Embed Size (px)
Citation preview
THE GENETICS OF TYPE 1 DIABETES:
FAMILY AND POPULATION STUDIES
by
STEPHEN CHARLES BAIN
A thesis submitted to the
Faculty of Medicine
of the
University of Birmingham
for the degree of
DOCTOR OF MEDICINE
Department of Medicine University of Birmingham Birmingham, B15 2TH United Kingdom
July 1993
University of Birmingham Research Archive
e-theses repository This unpublished thesis/dissertation is copyright of the author and/or third parties. The intellectual property rights of the author or third parties in respect of this work are as defined by The Copyright Designs and Patents Act 1988 or as modified by any successor legislation. Any use made of information contained in this thesis/dissertation must be in accordance with that legislation and must be properly acknowledged. Further distribution or reproduction in any format is prohibited without the permission of the copyright holder.

SYNOPSIS
Type 1 (insulin-dependent) diabetes mellitus is caused by autoimmune destruction
of insulin-producing pancreatic ß-cells. Genetic susceptibility is necessary for the
development of type 1 diabetes but inheritance does not follow simple Mendelian
rules and environmental factors are also involved. Identification of the genes which
mediate disease susceptibility should allow recognition of individuals at high risk of
disease; this will facilitate the study of environmental factors and possibly the
development of strategies for prevention. Further, the characterisation of
susceptibility genes will allow a greater understanding of the aetiopathogenesis of
type 1 diabetes and may lead to new therapeutic approaches. A major limiting
factor, hindering the genetic dissection of type 1 diabetes, has been the lack of a
large well-characterised clinical resource for study. This thesis describes how I
have established a Repository of immortalised cell lines from large numbers of
ethnically matched controls, sporadic type 1 diabetics and type 1 diabetic multiply
affected families. The family resource is now the largest single collection of it's
kind and is used by research groups throughout the world. Using this resource, I
have further characterised HLA-mediated susceptibility to Type 1 diabetes,
particularly with regard to age-related heterogeneity and inherited susceptibility. In
addition, I have confirmed the existence of linkage of type 1 diabetes to a gene (or
genes) within the insulin gene region on chromosome 11p. I have also performed
association studies using other candidate genes. These studies have led to a
significant advance in the field of the genetics of type 1 diabetes and bequeath a
permanent resource for future research.

DEDICATION
This thesis is dedicated to Beth who saved me from General Practice.
ACKNOWLEDGEMENTS
During the course of this work, I have received help and support from many individuals. Three deserve special mention; Tony Barnett for keeping faith, Beth Bain for her talpine dedication and John Todd for seemingly limitless enthusiasm and intellect.
I have enjoyed an excellent liaison with the British Diabetic Association, through Moira Murphy and Simon Howell, and the European Cell Culture Facility via Bryan Boulton. I am indebted to Michael Sheppard and Peter Morris who both gave me free rein in their departments.
I thank my colleagues for helpful discussion and critical review, especially Nick Aarons, Karen Balfour, Judy Brown, Maggie Dallman, Paul Dodson, Mark Dronsfield, Alan Jones, Jan-Bas Prins, Lyn Pritchard, Peter Reid, Neil Risch, Kjersti Ronningen, Tim Aitman, Richard Cornall, Sim Ghosh, Elaine Green, Mark Guy, Jenny Hall, Kate Hearne, Jenny Love, Pushpa Patel, Rachel Ritchie, Nanda Rodrigues & Matthew Walker. I am also grateful to the Tissue Typing laboratory at the Churchill Hospital, Oxford (Mike Bunce, Maggie Sutton, Craig Taylor & Ken Welsh) and to Gareth Plant for Cell Culture expertise.
I would like to express my gratitude to the West Midlands Regional Health Authority and ICI Pharmaceuticals for supporting my salary over the period of this research. The establishment of the British Diabetic Association - Warren Repository was supported by the following institutions: British Diabetic Association, Juvenile Diabetes Federation International, Medical Research Council (as part of the Human Genome Mapping Project) & Wellcome Trust. Special thanks are extended to Mrs C h r i s Woodward for bullying the BDA into continuing the funding for sample collection.
I am grateful to all the clinicians and nursing staff who volunteered families, Dr David Dunger who provided samples from a large number of sporadic diabetics and the Birmingham and Oxford Blood Transfusion Services who collected samples from control subjects. Finally, I extend my thanks to the patients and their families who have invited me into their homes and willingly donated over 5 gallons of blood to the cause.
CONTENTS Page
Chapter 1. Background and Strategy 1 1.1. Introduction. 2 1.2. Pathogenesis. 2 1.3. Aetiology. 5 1.3.1. HLA-encoded genetic susceptibility to type 1 diabetes. 6
1.3.1.i. HLA; from B15 to Asp 57. 6 1.3.1.ii. HLA; trans-racial studies. 12 1.3.1.iii. HLA; susceptibility loci other than HLA-DR and -DQ. 15
16 1.3.2.i. The insulin gene (INS) region. 17
18 1.3.2.iii. Immunoglobulin gene regions. 19
20 1.3.3. Environmental factors. 23
1.3.3.i. Viruses. 24 1.3.3.ii. Diet. 28
1.4. Prospects for prevention of type 1 diabetes. 31 1.4.1. Humoral markers of type 1 diabetes. 32 1.4.2. Metabolic tests of ß-cell function. 35
1.4.2.i. Glucose tolerance. 35 1.4.2.ii. Insulin secretion. 36
37
1.3.2. Non-HLA-encoded genetic susceptibility to type 1 diabetes.
1.3.2.ii. T cell receptor a and ß chain regions.
1.3.2.iv. Candidate genes from comparative mapping.
1.4.3. Combinations of humoral markers and metabolic tests in families. 1.4.4. Assessment of risk of type 1 diabetes in the general population
38 1.4.5. Genetic markers. 39 1.5. 42 1.5.1. Technological aspects. 42 1.5.2. Statistical aspects. 43 1.6. Conclusions. 47 1.7. Aims. 48
51 2.1. Collection of multiplex families with type 1 diabetes. 52 2.1.1. Ethics. 52
using humoral and metabolic markers of disease.
Identification of new genetic markers for type 1 diabetes.
Chapter 2. The Genetic Resource.
Page 2.1.2. Funding. 52
53 2.1.3. Steering Committee 53
2.1.4. Diagnosis of type 1 diabetes. 2.1.5. Racial background. 57 2.1.6. Source of families. 57
2.1.8. Sample collection. 60 59 2.1.7. The approach.
62 2.1.9. Immortalised cell lines. 63 2.1.10.Validation.
2.1.11.Progress: February 1989 - March 1993. 63 64 2.1.12.Cell line distribution. 65 2.1.13.Follow-up of families.
2.2. Collection of sporadic type 1 diabetics and conîrols. 65 66 2.2.1. Progress: June 1990 - March 1993. 66 2.3. Summary and conclusions.
Chapter 3. Analysis of Core Data. 67 3.1. Introduction. 68 3.2. Familysize. 68 3.3 Non-paternity. 68 3.4. Family history of diabetes. 69 3.4.1. Type 1 diabetes. 69
71 3.4.2. Type 2 diabetes. 72 3.5. Personal and family history of autoimmune disease.
3.5.1. Autoantibodies. 73 73 73
3.5.2. Addison's disease. 3.5.3. Coeliac disease. 3.5.4. Rheumatoid arthritis. 75 3.5.5. Thyroid disease. 73
Chapter 4. HLA Data. 7 9
4.2. Age-at-onset of diabetes. 80
76 3.6. Summary and conclusions.
4.1. Introduction. 80
82 4.3. Sex of diabetics.
Page 4.4. HLA-DR genotype and phenotype frequencies. 86 4.5. HLA-DR type and sex. 91 4.6. HLA-DR type and mean age-at-onset. 91 4.7. Disease associations with HLA-DR3 and -DR4. 95 4.8. HLA-DQB1 associations in HLA-DR4-positive diabetics. 95 4.9. Genetic linkage of HLA and type 1 diabetes. 98 4.10. Genetic linkage of HLA to type 1 diabetes in duplex versus
triplex families. 105
4.11. Evidence for linkage heterogeneity to HLA in duplex families. 108 4.12 Summary and conclusions. 110
Chapter 5. Insulin Gene Analysis. 114 5.1. Introduction. 115 5.2. Methodology. 118 5.3. Analysis of the l,428/FokI INS locus. 120 5.3.1. Association data. 120 5.3.2. Sex, age-at-onset and the 1,428/FokI polymorphism. 122 5.3.3. Interaction between 1,428/FokI INS genotype and HLA-DR type. 122 5.3.4. Parental sex and segregation of l,428/FokI INS alleles. 127 5.4. Analysis of INS haplotype data. 127 5.5. Analysis of INS haplotype data according to age-at-onset. 130 5.6. Comparison of linkage to INS and HLA. 133 5.7. Summary and conclusions. 136
Chapter 6. Analysis of HLA transmission. 140 6.1. Introduction. 141
6.2. Effects of parental sex on HLA-inherited susceptibility to type 1 diabetes. 142
6.2.1. Transmission of HLA-DR4 and HLA-DR3 from parents to diabetic offspring. 142
6.2.2. Analysis of the effects of non-inherited HLA antigens. 145 6.2.3. Summary and conclusions. 150 6.3. Parental Origin of HLA-DR types in HLA-DR3/4 heterozygote
diabetics. 151
Page 6.4. Differences between proband and later-affected offspring in
multiplex families. 154 6.4.1. HLA-DR status of proband versus later-affected offspring. 154 6.4.2. HLA haplotype sharing according to HLA-DR type of the proband. 157 6.5. Summary and conclusions. 159
Chapter 7. Candidate Gene Analysis. 161 7.1. Introduction. 162 7.2. Glucokinase. 162 7.2.1. Introduction. 162
164 7.2.2. GCK1 analysis. 164
7.2.3. Summary and conclusion of glucokinase study. 7.3. Analysis of apolipoprotein E genotype in type 1 and
type 2 diabetics. 167 7.3.1. Introduction. 167 7.3.2. Apo E analysis. 168 7.3.3. Summary and conclusions. 168 7.4. OFT3 gene polymorphism in type 1 diabetes. 171 7.4.1. Introduction. 171 7.4.2. Methodology. 172 7.4.3. OFT3 analysis. 172
175 175
7.4.4. Summary and conclusions. 175 7.4.5. Addendum. 176
Chapter 8. Concluding comments and future work. 177
Abbreviations. 181
References. 185
215
7.4.3.i. HLA-DR3 haplotypes and OFT3. 7.4.3.ii. HLA-DR4 haplotypes and OFT3.
Publications arising from this thesis.
LIST OF FIGURES Figure Page
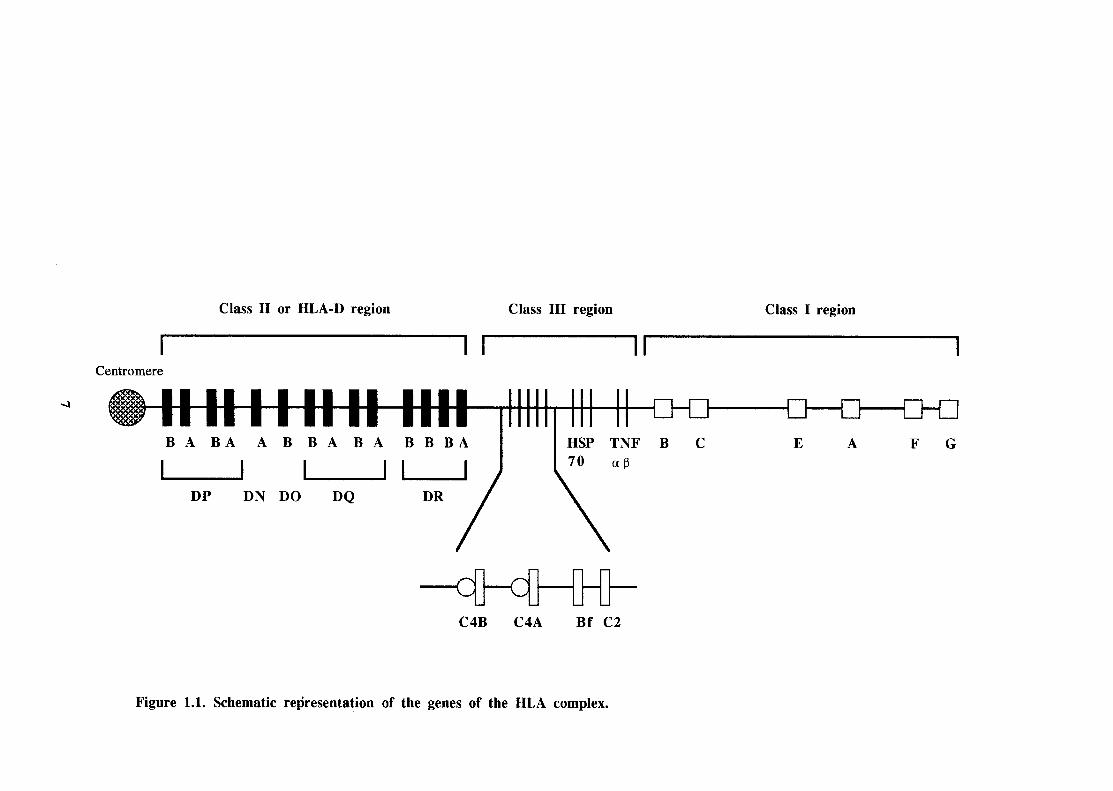
1.1 Schematic representation of the genes of the HLA complex. 7
5.1 4% agarose gel showing the INS gene product (amplified by the polymerase chain reaction) containing 1,428/FokI site following digestion with FokI. 119
4% agarose gel showing the OFT3 gene product (amplified by the polymerase chain reaction) followed by HindIlI digestion. 173
7.1
LIST OF TABLES
Table Page 2.1. Members of the B.D.A. - Warren Repository Steering Committee. 54
Personal and family history of diabetes and autoimmune disease in multiplex families. 70 Number of patients with raised and borderline levels of thyroid thyroglobulin and thyroid microsomal antibodies and human adrenal antibodies. 74
4.1. Mean age-at-onset of diabetes in multiplex and sporadic diabetics. 81 4.2. Sex of multiplex and sporadic diabetics. 81 4.3. Mean age-at-onset of diabetes in multiplex pedigrees according to
birth order. 85 Male to female sex ratio in diabetic tertiles according to age-at- onset (U.K.). 85 Male to female sex ratio in diabetic tertiles according to age-at- onset (G.A.W.5 & H.B.D.I.). 87 Male to female sex ratio in diabetic quintiles according to age-at- onset (combined datasets). 87 HLA-DR genotype frequencies (proportions) in multiplex and sporadic diabetics. 89 Comparison of HLA-DR3 and -DR4 genotype frequencies (proportions) of sporadic diabetics typed by serology and PCR (n=267) and PCR only (n=102). Sex of multiplex and sporadic diabetics according to HLA-DR3 and -DR4 typing. 92
4.10. Mean age-at-onset of multiplex and sporadic diabetics according to HLA-DR3 and -DR4 typing. 92
4.11. Sex ratio and age-at-onset of diabetes according to HLA type 94
4.12. HLA-DR genotype frequencies (proportions) of diabetics and controls vs controls). 96
4.13. Relative risks for HLA-DR3, -DR4 and -DR3/4 (shown with 95% confidence intervals). 96
3.1.
3.2.
4.4.
4.5.
4.6.
4.7.
4.8.
89 4.9.
(multiplex and sporadic diabetics combined).
Table Page 4.14. Evidence for linkage to HLA to type 1 diabetes in this U.K.
dataset vs G.A.W.5 dataset. 99 4.15. Evidence for linkage heterogeneity to HLA by age in all U.K.
sib-pairs (tertiles by youngest age-at-onset diabetic in each pair).
4.16. HLA IBD by age in all G.A.W.5 sib-pairs (tertiles by youngest
4.17. Lack of evidence for linkage heterogeneity to HLA by age in U.K. sib-pairs satisfying B.D.A. age criteria (tertiles by youngest age-at-
4.18. Identity-by-descent (IDB) data on sib-pairs from duplex and triplex families satisfying B.D.A. age-at-onset criteria.
4.19. HLA types of diabetics from duplex families with three or more offspring and from triplex families.
4.20. Evidence for linkage heterogeneity to HLA by age in all duplex sib-pairs (tertiles by youngest age-at-onset diabetic in each pair).
onset tertiles of duplex pedigrees.
Numbers (proportions) of +/+ homozygote and +/-, -/- diabetics and controls at the l,428/FokI INS site. Mean age-at-onset and sex of multiplex and sporadic diabetics according to l,428/FokI INS genotype. Relative risks by HLA type for homozygote status at the 1,428/FokI INS site in U.K. diabetics versus pooled controls. Segregation of 1,428/FokI INS alleles in relation to the HLA type of diabetic offspring: HLA genotypes and 1,428/FokI INS allele transmitted to diabetic offspring from informative (+/-) meioses. Paternal and maternal identity-by-descent (IBD) of the 1,428/FokI
INS haplotype sharing identical-by-descent (IBD) in affected sibling pairs from the G.A.W.5 dataset and Julier et al. INS haplotype sharing identical-by-descent (IBD) in affected sibling pairs from the U.K.(this dataset). Paternal and maternal identity-by-descent (IBD) of INS haplotypes in affected sibling pairs. 131
101
age-at-onset diabetic in each pair). 102
onset diabetic in each pair). 104
106
107 109
4.21. Comparison of HLA-DR types of diabetic offspring in age-at- 111
5.1. 121
5.2. 123
5.3. 124
5.4.
126
126
128
5.5. INS alleles in affected sibling pairs.
5.6.
5.7. 129
5.8.
Table Page 5.9. Examination of linkage heterogeneity to INS by age-at-onset in
U.K. sib-pairs satisfying B.D.A. criteria (tertiles by youngest age-at-onset diabetic in each pair).
5.10. HLA and INS haplotype sharing identical-by-descent (IBD) in duplex families (both diabetics aged less than 17 years at diagnosis) which are fully informative for both regions.
5.1 1. INS haplotype sharing identical-by-descent (IBD) in sibling pairs who are HLA-DR identical (by state); duplex pairs both <17 years at diagnosis. 135
5.12. Relative risks by HLA type for homozygote status at the 1,428/FokI INS site in Norwegian sporadic diabetics versus HLA-matched Norwegian controls. 139
Transmission of HLA-DR alleles to diabetic and non-diabetic offspring in multiplex families (HU-DRX refers to DR antigens other than -DR3 and -DR4). HLA haplotypes positive for HLA-DR3, -DR4 or neither (-DRX) in parents of the G.A.W.5 families. Comparison of HLA-DR3, -DR4 and -DRX phenotype and genotype frequencies in parents of multiplex diabetic offspring. Comparison of HLA-DR phenotype frequencies of non-inherited antigens according to parental sex (NIPAs and NIMAs not transmitted to any diabetics). 149 Comparison of proportions of non-inherited HLA-DR antigens (NIPAs and NIMAs not inherited by any diabetics). 149 Parental origin of HLA-DR3 in HLA-DR3/4 heterozygotes in multiplex families. 153 Comparison of HLA-DR types in probands and later-affected diabetics in multiplex families with conducive parents. 156 HLA haplotype sharing identical-by-descent (IBD) in duplex families according to HLA-DR type of the proband.
GCK 1 glucokínase microsatellite allele frequencies (proportions) in multiplex proband diabetics and controls.
132
134
6.1.
144 6.2.
146 6.3.
148 6.4.
6.5.
6.6.
6.7.
6.8. 158
7.1. 165
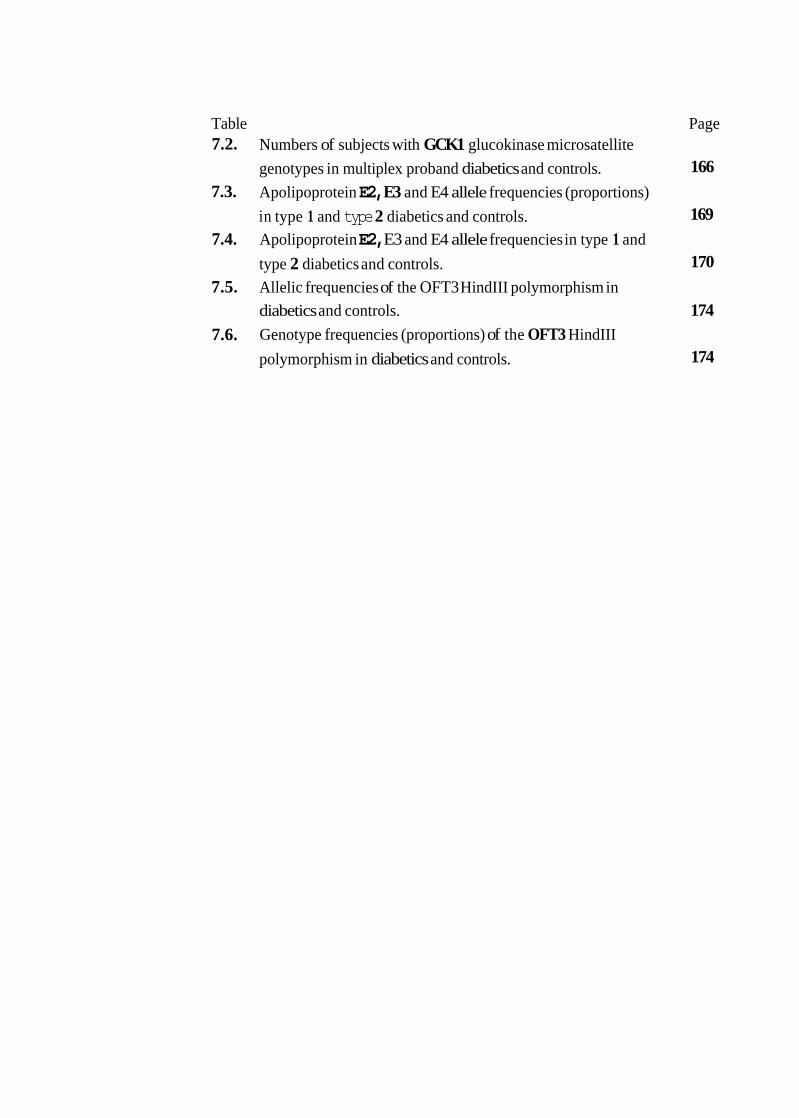
Table Page 7.2. Numbers of subjects with GCK1 glucokinase microsatellite
Apolipoprotein E2, E3 and E4 allele frequencies (proportions) in type 1 and type 2 diabetics and controls. Apolipoprotein E2, E3 and E4 allele frequencies in type 1 and type 2 diabetics and controls. Allelic frequencies of the OFT3 HindIII polymorphism in diabetics and controls. 174 Genotype frequencies (proportions) of the OFT3 HindIII polymorphism in diabetics and controls.
genotypes in multiplex proband diabetics and controls. 166 7.3.
169 7.4.
170 7.5.
7.6. 174

CHAPTER 1
BACKGROUND AND STRATEGY
1
1. Introduction
Diabetes mellitus is a clinical syndrome characterised by hyperglycaemia. The
fundamental defect in diabetes is a deficiency of insulin action. In the classical,
juvenile-onset form of diabetes mellitus (type 1 diabetes), there is an absolute
deficiency of insulin. In late-onset, non-insulin-dependent diabetes, there is a
variable combination of diminished insulin secretion and tissue resistance to insulin
activity (peripheral insulin resistance). The conventional diagnosis of diabetes
mellitus is defined in terms of blood glucose levels at the beginning and end of a
standard oral glucose tolerance test (OGTT) (WHO Expert Committee on Diabetes
Mellitus 1980). These criteria are, however, of little relevance to type 1 diabetes
where the majority of patients present with severe symptoms of lethargy,
polydipsia, polyuria and weight loss and the diagnosis is confirmed by an elevated
random blood glucose. If treatment with insulin is delayed, fatal diabetic
ketoacidosis may ensue.
The peak age-at-onset of type 1 diabetes is 12 years and the incidence of disease
appears to be increasing rapidly in the United Kingdom, where it is now the second
most common chronic disease of childhood(Metcalfe und Baum 1991). Affected
individuals require life-long insulin therapy and are prone to disabling
complications such as retinopathy, nephropathy and neuropathy.
1.2. Pathogenesis
The pathological process culminating in type 1 diabetes involves the chronic
autoimmune destruction of insulin-producing pancreatic -cells (Todd 1990). The
histological hallmark of disease is 'insulitis', a mononuclear cell infiltration of the
2
pancreatic islets of Langerhans. Insulitis is accompanied by selective loss of the
cells of the islets, leaving other endocrine cells intact. ß-cell loss appears to be a
protracted process; sensitive measures of ß-cell function, such as the first-phase
insulin response (FPIR) to intravenous glucose, have defined a period of up to 7
years before the need for insulin where the FPIR is reduced (Section
1.4.2.ii) (Srikanta, Ganda et al. 1985) (McCulloch, Klaff et al. 1990). Antibodies to
several different islet cell components, present in 70-80% of new cases, can also be
detected up to 5-10 years before diagnosis (Section 1.4.1). Eisenbarth's group have
proposed a linear model of progressive loss of insulin secretion during the pre-
diabetic period(Srikanta, Ganda et al. 1984). Other authors, however, find that
cell function may fluctuate and does not invariably progress to overt disease(Palmer
and McCulloch 1991)(Kobayashi, Itoh et al. 1987)(McCulloch, Klaget al. 1990).
Whichever model is more accurate, it is likely that clinical presentation of type 1
diabetes occurs after several years of dysfunction during which up to 90% of
the pancreatic may be destroyed(Gepts 1965).
The cells infiltrating human islets in type 1 diabetes are morphologically
lymphocytes, staining positive for T200 leukocyte common antigen (Foulis, Liddle
et al. 1986). In a single autopsy report, these cells were phenotypically
characterised and appeared to be predominantly cytotoxic/suppressor T-cells
(Bottazzo, Dean et al. 1985). In that study, Botazzo et al. reported increased class I
MHC expression (HLA-A, -B and -C) on affected islet cells and found that some
insulin-producing (but not or were class II (HLA-DR) positive
(Section 1.3.1). Foulis et al. also noted abundant HLA-DR expression on insulin-
secreting islet cells(Foulis, Liddle et al. 1986). The finding of class II HLA
expression in affected islets is significant for two reasons; do not normally
express class II antigens and cells expressing class II antigens can present antigen
3
to CD4-positive T-lymphocytes (T-helper cells). It has been proposed that aberrant
class II expression by facilitates the presentation of antigen to T-
lymphocytes which then initiate an immune response(Bottazzo, Pujol-Borrell et al.
1983). Alternatively, class II expression may be a consequence of ongoing
inflammation, rather than an initiating event (Dean, Walker et al. 1985).
Experimental work on MHC expression in animal models of disease may help to
resolve this issue. As in the human, (3-cells from diabetic rats show increased
expression of class I MHC antigens. Electron microscopy studies, however,
suggest that class II expression in rat islets is limited to lymphoid cells, dendritic
cells and macrophages(Farr and Anderson 1985). Other studies have addressed the
importance of class I and class II expression on in transgenic mouse
models (Allison, Campbell et al. 1988) (Lo, Burkly et al. 1988) (Sawetnick, Liggitt
et al. 1988). In all cases, overexpression of MHC antigens caused the development
of diabetes. However, ß-cell destruction did not occur. Histopathological findings
were not typical of type 1 disease and it appeared that diabetes was caused by
interference with insulin secretion. These findings suggest that MHC expression in
islets is unlikely to initiate autoimmune ß-cell destruction. Species differences
between human and rodent, however, cannot be excluded; for example, human T-
cells are MHC-class II-positive whereas mouse T-cells, in general, are not.
Two other lines of investigation provide further support for an involvement of T-
cells in the aetiology (or maintenance) of type 1 diabetes. First, a study of
peripheral blood lymphocytes in pre-diabetics by Faustman et al. showed an
increase in a subset of CD4-positive cells in 22 pre-diabetics compared to age-
matched controls; a subset of CDw29 (helper-inducer) cells was reciprocally
reduced in the same group(Faustman, Eisenbarth et al. 1989). Second, there are
4
studies demonstrating an effect of cyclosporin A (CY-A) in early disease. CY-A
inhibits early events in T-cell activation, at least in part by binding the protein
cyclophilin (Krensky, Weiss et al. 1990). In a double-blind, placebo-controlled trial
of CY-A in recently diagnosed diabetes, CY-A increased the rate and duration of
insulin-free remissions; after 9 months treatment, 24.1 % of the CY-A group were
in complete remission, compared with 5.8% of the placebo-treated patients(Feutren,
Papoz et al. 1986). Unfortunately, despite continued CY-A treatment, the majority
of patients only have short remissions and ultimately require re-introduction of
insulin treatment(Assan, Feutren et al. 1990)(Bougneres, Landais et al. 1990).
In summary, type 1 diabetes is preceded by invasion of the pancreatic islets by
immune cells, including T-lymphocytes and macrophages, that cause specific lysis
of This process, known as insulitis, takes place over a period of months or
years, during which 80-90% of the are destroyed. Only at this stage do the
typical symptoms develop, allowing the clinical diagnosis of type 1 diabetes to be
made. Intervention aimed at preserving ß-cell function is, therefore, more likely to
succeed if started before the time of clinical presentation, when a larger proportion
of are still viable.
1.3. Aetiology
The life-time risk of type 1 diabetes is approximately 0.4% in Caucasians; the
average risk for siblings of type 1 diabetics is 6% and the concordance rate for
genetically identical monozygotic (MZ) twins is reported to be 36% (Risch
1987)(Olmos, A'Hern et al. 1988). Although the MZ twin concordance figures are
probably an overestimate due to ascertainment bias, these findings indicate
significant familial clustering of disease, consistent with a genetic input. The large
5
discordance rates in MZ twins, however, indicate that susceptibility genes have low
penetrance i.e., an individual who is 'genetically programmed' for disease rarely
develops the clinical condition. The penetrance of an allele (the probability that it
causes disease) is dependent upon three factors: (1) its interaction with alleles of
additional unlinked loci, (2) random factors within the individual (e.g., T-
lymphocyte antigen receptor and immunoglobulin somatic gene rearrangements)
and (3) environmental agents. Only (2) and (3) can apply to MZ twins and whilst
random factors could theoretically explain the low twin concordance rates, this
would not be consistent with the observed risk among siblings. It is likely,
therefore, that environmental factors are of great importance.
In the following sections, I describe the current knowledge of genetic susceptibility
to type 1 diabetes and the evidence supporting environmental influences in disease
aetiology.
1.3.1. HLA-encoded genetic susceptibility to type 1 diabetes
1.3.1.i. HLA; from B15 to Asp 57.
The best evidence for a genetic component to susceptibility to type 1 diabetes comes
from studies of the Human Leukocyte Antigen (HLA) region. The HLA region is a
cluster of genes located within the major histocompatibility complex (MHC) on
chromosome 6p (figure 1.1). Hence, in human studies, the terms HLA and MHC
tend to be interchangeable. In the 1960's, the HLA region was identified as the site
of the Major Transplantation Antigen Complex of genes in humans, and was
originally named because the serologically defined antigens which it encodes are
absent on red blood cells. The search for associations between antigens of the HLA
system and disease was stimulated by the discovery of genetic linkage between the
6
mouse Major Transplantation Complex (H-2) and resistance to virus-induced
leukaemia (McDevitt and Bodmer 1974). Further impetus to the search for
autoimmune associations came when immune response (Ir) genes were found to be
linked to H-2.
In 1973, Singal et al. described an association between HLA-B15 and type 1
diabetes, which was absent in non-insulin-requiring diabetics (Singal and Blajchman
1973). This finding, and a further association with HLA-B8, was confirmed by
Nerup et al. and Cudworth and Woodrow (Nerup, Platz et al. 1974)(Cudworth and
Woodrow 1974). These contributions were important since they led to a formal
split of the clinical syndrome of diabetes into type 1 and type 2 (maturity-onset,
non-insulin-dependent) diabetes. Two points concerning this advance are worthy of
note. First, an almost identical delineation of diabetes, made using clinical criteria
had been reported 20 years earlier by R.D. Lawrence(Lawrence 1951). This had
not, however, been accepted by geneticists who continued to analyse diabetes as
one condition (with predictably poor results). Second, the study of Singal et al. was
not the first to investigate an association between type 1 diabetes and HLA antigens.
Finkelstein et al. had found no association in a study of juvenile-onset patients, a
failure due to racial admixture of the population under study (23 Caucasians, 10
Hispanics and 6 Negroids) (Finlzelstein, Zeller et al. 1972). Racial differences in
HLA disease associations have subsequently been exploited in fine mapping of
disease susceptibility loci (Section 1.3.2).
The original studies detected associations with HLA class I gene polymorphisms by
serological typing (the use of antibodies which recognise characteristic epitopes of
HLA-encoded molecules). Class I genes encode alpha chains which combine with
microglobulin to form glycoproteins found on all nucleated cells. These
8
molecules are involved in the restriction of T-lymphocyte activity. Even at the time
of discovery, it was not thought that class I genes were primary susceptibility
determinants for type 1 diabetes; rather it was suggested that these plymorphisms
were in linkage disequilibrium with true susceptibility alleles within the HLA
region. Linkage disequilibrium describes the co-occurrence of two or more separate
alleles on the same chromosome more frequently than expected by chance. This
phenomenon is particularly strong across the 2,500 kilobase pairs of the HLA
region, with few recombination events occurring during meioses; this leads to
combinations of alleles at different loci (haplotypes) being inherited en bloc.
With the development of cellular typing and isolation of class II antisera, it emerged
that the strongest population associations are with class II antigens (Nerup,
Cathelineau et al. 1977); over 95% of Caucasian type 1 diabetics have HLA-DR3
and -DR4 antigens, compared with 50% of controls(Svejgaard and Ryder 1989).
HLA-DR3 and -DR4 are allelic products of the DRB1 and DRA loci of the HLA-D
or class II region of the MHC (figure 1.1). These molecules are also cell-surface
glycoproteins but are made up of both a- and -chains. Each class II gene is
subdivided into at least one A and one B gene, alleles of which encode the a- and
-chains respectively. Class II molecules are found on antigen presenting cells such
as macrophages, B lymphocytes and activated T-lymphocytes. They bind foreign
(and self) antigen and present it to CD4-positive T-cells. Many of the class II genes
are highly polymorphic, resulting in great variation in the class JI molecules
possessed by different individuals.
Study of the segregation of HLA haplotypes in families with type 1 diabetes also
implicates a disease susceptibility gene (or genes) closely linked to the class II
region (Thomson, Robinson et al. 1988) (Spielman, Baur et al. 1989). Thomson et
9
al., however, pointed out that the HLA-DRB1 alleles encoding DR3 and DR4 are
too common in the general population to be susceptibility determinants; alternative
loci within the class II region were, therefore, considered(Thomson, Robinson et
al. 1988). Linkage disequilibrium is strong between the HLA-DR and -DQ
subregions and, as a result, little familial recombination between DQA1 and DRB1
is observed. This prevents detailed linkage analysis in families and creates
difficulties in fine mapping of primary susceptibility genes. Owerbach et al. were
the first to discover an HLA-DQB1 DNA polymorphism, based on restriction
enzyme digestion of genomic DNA, that subdivided HLA-DR4 haplotypes into
high and low risk(Owerbach, Lernmark et al. 1983). This important result
demonstrated that HLA-DQB1 is more closely associated with disease susceptibility
than the HLA-DRB1 locus. Nepom et al. subsequently showed that this restriction
fragment length poly morphism (RFLP) corresponded to a recognised serological
specificity (TA10) and that two alleles of the HLA-DQB1 locus were associated
with DR4(Kim 1985). One of these, HLA-DQ8 (TA10-) is increased in Caucasian
patients (90%) whilst the other, HLA-DQ7 (TA10+) is decreased (10%); the alleles
are equally represented in HLA-DR4-positive controls(Nepom, Palmer et al. 1986).
In 1987, Michelsen and Lernmark reported the sequence of the HLA-DQB1 DQ7
allele (now known as HLA-DQB1*0301)(Michelsen and Lernmark 1987). This
showed only 6 amino acid differences from the sequence of the DQ8 allele (HLA-
DQB1*0302); four of these differences are in the N-terminal polymorphic domain,
at residues 13, 26,45 and 57. The polymerase chain reaction (PCR) was used to
sequence these alleles in type 1 diabetics and controls, to determine whether there
was additional polymorphism between the coding sequences. The sequences of
DQB 1*0301 and DQB 1*0302 were, however, identical in the two groups and there
10
was no sequence unique to type 1 diabetes. The associated DQA1 alleles were also
found to be identical.
This suggested that one, or more, of the known amino acid changes might be
responsible for the contrasting associations of HLA-DR4,-DQ8 and -DR4,-DQ7
haplotypes with type 1 diabetes. In addition, two other HLA-DR alleles,
DR2(Dw15 and 16) and DR6 (DRw13 and 14), were associated with more than
one DQB 1 allele, posing the same question; did the frequencies of DQB 1 alleles (on
HLA-DR2 and -DR6 haplotypes) differ in patients versus controls? For both HLA-
DR2(DRw16) and -DRw13, the predisposing haplotypes carried a DQB1 allele
encoding a non-charged amino acid at position 57 (of the Haplotypes
which did not predispose to disease, including HLA-DQ7 haplotypes, had DQB 1
alleles encoding the charged amino acid aspartic acid at this position (Asp-57).
Thus, in the three cases where the distribution of DQB1 alleles could be compared
in HLA-DR-matched diabetics and controls, there was a significant difference and
this correlated with polymorphism of HLA-DQB1 codon 57(Todd, Bell et al.
1987)(Horn, Bugawan et al. 1988). Consistent with this finding, predisposing
HLA-DR3 and -DR1 haplotypes have DQB 1 alleles encoding alanine and valine,
respectively, at position 57.
Further support for an important role for position 57 in diabetes susceptibility
comes from animal models of disease. The non-obese diabetic (NOD) mouse is a
strain which spontaneously develops diabetes with many histological,
immunological and pathological features of human type 1 disease. The murine
homologue of HLA-DQB1 is known as and the sequence of the NOD I-Aß
allele is unique in having a Ser-57 codon; all other, diabetes-resistant, strains
possess an gene with an Asp-57 codon(Acha-Orbea and McDevitt 1987). The
1 1
spontaneously diabetic BB rat also encodes Ser-57 in its homologous class II
chains.
In 1988, Brown et al. proposed a hypothetical structure for class II
molecules(Brown, Jardetzky et al. 1988). In this, Asp-57 forms a salt bridge with a
conserved arginine residue at position 79 of the DQ a-chain. This suggests that the
chain residue 57 may be in a position on the surface of the antigen-binding site
where it can interact with the T-cell receptor and/or peptides(Todd, Acha-Orbea et
al. 1988). The functional importance of this position is emphasised by studies
showing that alteration of residue 57 can affect the recognition of both alloreactive
and antigen-specific T-cell clones(Lundin, Gauderernack et al. 1988) (Sterkers,
Zeliszewski et al. 1988)(Kwok, Mickelson et al. 1990). Further, transgenic data
in the mouse indicate that amino acid polymorphisms at positions 56 and 57 in the
I-A molecule influence the development of overt diabetes(Miyazaki, Uno et al.
1990) (Slattery, Kjer-Nielson et al. 1990) (Lund, O'Reilly et al. 1990).
1.3.1.ii. HLA; trans-racial studies.
Recombination events during evolution, including those between the HLA-DQ and
-DR loci, have created population-specific combinations of HLA alleles known as
'extended haplotypes'. If an allele of an HLA locus is directly involved in disease
susceptibility, then its effects should be evident irrespective of the other alleles
present on the haplotype. Extended haplotypes allow stringent testing of HLA
associations with type 1 diabetes and are the basis of trans-racial studies.
Using RFLP analysis, Fletcher et al. described a race-specific HLA-DR7 haplotype
that, in contrast to Caucasian DR7 haplotypes, is diabetogenic (Fletcher, Mijovic et
al. 1988). The amino-terminal domainencoding sequences of the HLA-DRB 1 and
1 2
-DQB 1 alleles on this haplotype are identical to those on Caucasian DR7 haplotypes
and the only coding sequence differences are at the HLA-DQA1 locus(Todd,
Mijovic et al. 1989). The DQA1*0201 allele of the neutral Caucasian HLA-DR7
haplotype is replaced by DQA 1*0301, an allele which is also found in predisposing
Caucasian HLA-DR4 haplotypes. The DQA 1*0301 -DQB 1 *020 1 allelic pair,
present on this haplotype, also accounts for the susceptibility of different HLA-DR9
haplotypes: Caucasian DR9 haplotypes are neutral with respect to type 1 diabetes,
in accord with the presence of DQB 1*0303 which encodes Asp-57; Negro HLA-
DR9 haplotypes are positively associated with disease and carry DQB1*0201 which
encodes Ala-57 (Todd 1990). The combination of DQA 1 *030 1 and DQB 1 *020 1
alleles on the same chromosome is rare in Caucasians; the A3/DQ2 molecule,
however, is common in diabetics due to the high frequency of HLA-DR3/4
heterozygotes (DR3 and DR4 haplotypes carry DQB 1 *020 1 and DQA 1 *0301
alleles respectively). This so-called transcomplementation of HLA-DQ alleles on
different chromosomes is one explanation for the increased risk of HLA-DR3/4
heterozygotes (Nepom, Schwarz et al. 1987).
The frequency of HLA-DR2(w15) is decreased in Caucasian type 1 diabetics,
indicating that HLA-DR2 haplotypes provide resistance to disease (particularly to
susceptibility encoded by HLA-DR4 haplotypes) (Thomson, Robinson et al. 1988).
Resistance correlates with a particular allele of HLA-DQB 1, designated
DQB 1 *0602, and this allele is associated with protection in all races that have been
studied(Khalil, d'Auriol et al. 1990) (Jenkins, Mijovic et al. 1991) (Mijovic, Jenkins
et al. 1991)(Cavan, Jacobs et al. 1993). Diabetogenic HLA-DR2 haplotypes have
been identified but these show plymorphism at the HLA-DQB1 locus compared
with resistance haplotypes(Kohonen-Corish, Serjeantson et al. 1987)(Bach, Rich et
al. 1985) (Bohme, Carlsson et al. 1986) (Lundin, Gauderernack et al. 1988). The
1 3
Caucasian AZH haplotype, for example, which is positively associated with
disease, is the only HLA-DR2 (DRw16) haplotype to have a HLA-DQB1
allele encoding a non-charged amino acid at position 57.
HLA-DRw6 also correlates with resistance to type 1 diabetes in Caucasians. This
haplotype carries the HLA-DQB1 allele, DQB1*0603 and is associated with
protection in other populations(Todd, Bell et al. 1987)(Fletcher, Mijovic et al.
1988) (Fletcher, Odugbesan et al. 1988) (Todd, Mijovic et al. 1989) (Jenkins,
Mijovic et al. 1991)(Mijovic, Jenkins et al. 1991)(Cavan, Jacobs et al. 1993).
Three HLA-DQA1 alleles have negative associations with type 1 diabetes in
Caucasians; HLA-DQA 1 *0102 (found on HLA-DR2 and some -DRw6
haplotypes), HLA-DQA 1*0103 (HLA-DRw6 haplotypes) and HLA-DQA 1 *020 1.
The HLA-DQA1*0201 allele occurs on HLA-DR7 haplotypes; this may explain the
negative association of HLA-DR7,-DQB 1 *0303 haplotypes and the neutral effect of
HLA-DR7,-DQB 1 *020 1 (Cavan, Bain et al. 1992).
There are two caveats to the interpretation of trans-racial analyses. First, the test
assumes that the effect of an allele on disease susceptibility is independent and not
influenced by other loci. This assumption has important consequences; for
example, studies in Caucasian, North Indian Asian, Negroid and Japanese
populations support the contention that HLA-DQA1*0301 is a primary disease
susceptibility determinant. A recent report, however, shows no disease association
in Southern Chinese(Cavan, Jacobs et al. 1993). If susceptibility alleles are truly
independent, this one negative study theoretically excludes HLA-DQA1 *0301 from
involvement in disease. I have described, however, that the interaction of HLA-
and is critical in determining antigen presentation by HLA
molecules and this indicates that HLA-DQA1 and -DQB1 alleles are not
14
independent. Indeed, it would be surprising if other modifying factors were not
also involved. It is possible that there are non-coding (and perhaps coding)
differences between DQA1 and DQB 1 alleles on different haplotypes; such
polymorphisms might affect gene expression and, therefore, influence susceptibility
to type 1 diabetes. The second assumption of trans-racial analysis is that the
identical diagnostic criteria are used in the races under study. This requires rigorous
attention to clinical detail which is not readily apparent in some studies.
1.3.1.iii. HLA; susceptibility loci other than HLA-DR and -DQ.
The HLA-DPB1 locus, centromeric to HLA-DQ (figure 1.1), is also highly
polymorphic. Although disease associations have been reported, there is little
evidence that susceptibility to type 1 diabetes is influenced by this locus(Easteal,
Kohonen-Cotish et al. 1990). The genes which encode tumour necrosis factor lie
telomeric to the HLA-DR genes. An association between disease and heterozygosity
for a gene RFLP has been reported in Caucasians but not in other races; it is
likely that this association is secondary to linkage disequilibrium with alleles in the
class II region(Jenkins, Penny et al. 1991).
A number of reports suggest that the disease associations with HLA-B and -DR
alleles are more than simply a reflection of linkage disequilibrium (with HLA-DQA1
and -DQB1 loci). When HLA-DR3,-DQB1*0201 haplotypes are sub-divided
according to HLA-B alleles, HLA-B8 and -B 18 haplotypes are generally found to
be most predisposing (Thomson, Robinson et al. 1988) (Risch 1989). Since the
sequences of HLA-DR3 and DQB1*0201 are the same on all Caucasian haplotypes
(although there is some variation at the DRB3 locus), this implies that other loci
outside the HLA-DQ region influence susceptibility (Field 1989) (Todd, Bell et al.
1987)(Horn, Bugawan et al. 1988). Similar findings have been reported for HLA-
1 5
DR4; haplotypes, such as DR4(Dw14)DQ8 and DR4(Dw4)DQ8 which differ only
at the DRB1 locus (Dw subtypes), do not confer the same risk of type 1
diabetes (Bach, Rich et al. 1985) (Sheehy, Scharf et al. 1989). Tuomilehto-Wolf et
al. have recently claimed that polymorphism at the HLA-A locus also affects
haplotypic risk(Tuomilehto- Wolf, Tuomilehto et al. 1989).
To summarise these data, certain alleles of HLA-DQA1, -DQB1 and DRB1
correlate directly with susceptibility to type 1 diabetes(Todd 1990)(Sheehy, Scharf
et al. 1989)(Caillat-Zwman, Garchon et al. 1992). The structure of the amino acid
at position 57 of the HLA-DQ 0-chain provides a partial molecular basis for this
correlation, however, this residue is not sufficient by itself to account for the
observed effects and other HLA loci are involved. It is of note, however, that this
specific amino acid 'defect' in the HLA-DQ molecule is conserved in the NOD
mouse, unique among mouse strains in that it spontaneously develops insulin-
dependent diabetes. The precise mechanism by which HLA polymorphisms
predispose to disease is not known but probably involves the presentation of self-
antigens, in the form of peptides, by class II molecules to T-cells. Certain alleles of
HLA-DQ, for example, may present pathogenic epitopes of 0-cell associated
proteins whereas other alleles of HLA-DR and -DQ may present nonpathogenic
peptides. The balance of these molecular interactions might cause a reduction in
susceptibility, or even active protection as observed for HLA-DQB1 *0602
haplotypes in human and for the I-E molecule in NOD.
1.3.2. Non-HLA-encoded genetic susceptibility to type 1 diabetes.
Risch has assessed the contribution of HLA-linked loci to the familial clustering of
type 1 diabetes(Risch 1987). This was done by examining the relationship between
1 6
the increased risk of disease in relatives of type 1 diabetics over the population
prevalence and the probability of sharing HLA haplotypes identical-by-descent
(IBD) (Section 1.5.2). The expected proportion of affected sib pairs sharing zero
HLA haplotypes IBD under a single locus model is significantly less than the
observed frequency. Risch concluded that the effect of HLA-linked loci on familial
clustering of disease is minor and that additional familial factors exist; these may be
genetic (non-HIA linked loci) or environmental.
1.3.2.i. The insulin gene (INS) region.
The autoimmune process leading to type 1 diabetes is highly specific to pancreatic
the only cells which produce insulin. The insulin gene is, therefore, a
plausible candidate susceptibility locus since insulin (or insulin precursors) may act
as an autoantigen. Alternatively, levels of insulin could modulate the interaction
between the immune system and and ultimately determine whether these
cells become a target for autoimmune destruction. It is of note that intensive insulin
therapy given at the time of diagnosis can reduce ß-cell loss, possibly by reducing
endogenous insulin secretion(Shah, Malone et al. 1989). Further, treatment of
prediabetic NOD mice with insulin prevents the onset of disease, further suggesting
that exogenous insulin protects from autoimmune damage(Atkinson,
Maclaren et al. 1990).
Population studies of type 1 diabetics and non-diabetic controls have shown a
positive association between alleles within the INS region and disease(Bell, Horita
et al. 1984)(Hitman, Tarn et al. 1985). Linkage analyses in multiplex families,
however, have failed to confirm this finding(Field 1991). This conflict between
association and linkage studies has puzzled investigators for some years. Although
some were willing to accept the possibility of hidden stratification producing an
1 7
anomalous association, others suggested that small susceptibility effects (in
comparison to HLA) may be easier to detect by association than by linkage
analysis. Possible explanations for the latter hypothesis are that several haplotypes
carry diabetogenic mutations(Thomson, Robinson et al. 1989) and/or the
frequencies of these susceptibility alleles in the generai population is high(Todd and
Bain 1992).
In 1991, Julier et al. claimed to have explained the apparent paradox between
association and linkage studies(Julier, Hyer et al. 1991). They analysed a large
group of unrelated subjects with type 1 diabetes and confirmed an association
between disease and newly defined polymorphisms across the INS region. Direct
evidence for linkage of INS was then obtained by analysis of affected sibling pairs
whose parents were heterozygous for the disease-associated INS polymorphisms.
Interestingly, in that study, linkage was observed only in male meioses, suggesting
involvement of maternal imprinting. In addition, the INS association was
significant only in HLA-DR4-positive diabetics, suggesting interaction between the
HLA and INS susceptibility loci.
1.3.2.ii. T-cell receptor a and ß chain regions.
T-cells recognise antigen when it is in combination with HLA molecules on the
surface of antigen-presenting cells. This recognition is facilitated by the T-cell
receptor (TCR), a heterodimeric cell surface molecule made up of an a and ß chain,
both with constant and variable regions. Since type 1 diabetes appears to be a T-cell
mediated disease, the genes coding for TCR are plausible candidates for disease
susceptibility. The loci for TCR a (TCRA) and ß (TCRB) chains are located on
chromosome 14( 14q11) and 7(7q35), respectively. Association and linkage
analyses of polymorphisms of the gene coding for the TCRA constant region and
1 8
type 1 diabetes have been negative(Hoover, Black et al. 1989)(Concannon, Wright
et al. 1990). Early association studies of polymorphisms within the TCRB constant
region suggested that patients were more likely to be heterozygous at this locus than
controls(Hoover, Angelini et al. 1986) (Millward, Welsh et al. 1987). Recent
studies, however, using larger populations and linkage studies in families have
failed to confirm this observation(Hoover, Black et al. 1989)(Concannon, Wright et
al. 1990). It should be noted that these studies are concerned only with
susceptibility due to variation in germ-line TCR genes. Somatic diversification
mechanisms allow the random addition or deletion of nucleotides at junctions
between TCR gene segments, hence the TCR products expressed on the surface of
peripheral T-cells are not entirely encoded in the germ line; even monozygotic twins
may differ in their repertoire of TCR specificities.
1.3.2.iii. Immunoglobulin gene regions.
The immunoglobulin K light chain (Km) locus is located on the short arm of
chromosome 2(2p12). Early reports that Km( 1) was increased in HLA-DR4
diabetics have not been confirmed(Field and McArthur 1987)(Field 1991). The
immunoglobulin heavy chain region (Gm) is found on the long arm of chromosome
14( 14q32.3). Gm allotypes are serologically defined antigens, located in the
constant portion of the y heavy chains of IgG immunoglobulins. There is a good
deal of evidence to support associations between Gm allotypes and susceptibility to
autoimmune disease, hence the Gm region is a candidate for genetic susceptibility to
type 1 diabetes. Studies searching for a direct association between Gm and type 1
diabetes have produced negative results, as have linkage studies(Field 1991). Field,
however, has proposed that genes encoding Gm allotypes, or in linkage
disequilibrium with them, may contribute to susceptibility through interactions with
HLA, TCRB and INS(Field 1991). Her findings can be summarised thus:
1 9
i) HLA-Gm: HLA-DR3/4 diabetics have an increased frequency of phenotypes or
haplotypes negative for Gm(23) compared with non-DR3/4 diabetics or controls.
ii) TCRB-Gm: Diabetics who are negative for Gm(23) have a higher frequency of
the TCRB 9.3 kilobase fragment, compared with those diabetics who are positive
for Gm(23) or controls (an association independent of HLA).
iii) INS-Gm: Diabetics who are not Class 1/1 homozygotes at the INS VNTR have
decreased frequency of G2m(23) compared with Class 1/1 homozygote diabetics
and non-diabetic siblings (an effect which is stronger in DR3/4 individuals).
The evidence for these interactions is often based on small numbers of subjects
taken from pooled data sets. In addition, the number of tests performed (without a
priori reason) leads to questions concerning an acceptable level of significance.
1.3.2.i~. Candidate genes from comparative mapping.
The best evidence for the existence of susceptibility genes outside HLA and INS
comes from genetic analysis of the NOD mouse(Todd, Aitman et al. 1991). The
NOD mouse is an inbred strain (i.e, individuals within a colony are essentially
genetically identical) that spontaneously develops diabetes which is very similar to
human type 1 disease. Autoimmune islet-cell destruction is a shared characteristic,
as are the appearance of autoantibodies to components and other endocrine
tissues, defects in T-cell activity, sensitivity to immunosuppression and the
presence of a susceptibility locus within the MHC. Comparative mapping of the
mouse and human has revealed extensive regions of homology. Prediction of the
location of disease loci in man, given their location in mouse, is a potentially
powerful application of the mouse/human comparative map (Nadeau 1989).
2 0
A linkage map of the mouse genome has been generated using the polymerase chain
reaction (PCR) to amplify microsatellite DNA markers(Love, Knight et al. 1990).
Microsatellites are blocks of simple repetitive DNA (di-, tri- and tetranucleotide
repeats) possessing length polymorphism that can be resolved on agarose or
acrylamide gels, without the need for restriction enzyme digestion or radio-labelling
(Weber and May 1989)(Love, Knight et al. 1990). Analysis of the eo-segregation
of these randomly dispersed markers and disease in outcross and backcross
experiments has led to the discovery of three significant linkages in the NOD
mouse(Todd, Aitman et al. 1991)(Cornall, Prim et al. 1991). Idd-3 is located on
mouse chromosome 3 (in mouse, the MHC susceptibility gene complex is Idd-1
and a putative locus on chromosome 9 has been designated Idd-2), Idd-4 on
chromosome 1 1 and Idd-5 on chromosome 1. Syntenous conserved regions in the
human are located on chromosomes 1 or 4, 17 and 2 respectively and are candidate
susceptibility regions for human type 1 diabetes/(Todd and Bain 1992). Of these,
the region of chromosome 2q homologous with the location of Idd-5 is of specific
interest since two potential candidate genes reside within this area; the Interleukin- 1
receptor gene (Il-1 r1) and Lsh/Lty/Bcg which influence macrophage activation and
resistance to infection(Cornall, Prim et al. 1991).
The comparative mapping strategy has already been used to investigate the human
homologue of Idd-2 (Prochazka, Leiter et al. 1987). Data from the NOD mouse
suggest that the Thy-1 gene on mouse chromosome 9 is linked to diabetes
susceptibility at a recombination distance of 10- 15%. In humans, the Thy- 1’ locus
lies in a syntenic conserved linkage group on chromosome 1 1q. Eighty one affected
sib-pair families (40 from the collection described in this thesis) were analysed with
17 marker loci for linkage to type 1 diabetes(Hyer, Julier et al. 1991). There was no
evidence to support the existence of a susceptibility locus within the region and it
2 1
was possible to exclude more than 90% of the region, assuming the probability of
sharing two alleles IBD at a susceptibility locus was at least 50%. In the same year
as this study, Wong et al. published an RFLP analysis of the CD3 epsilon ( E )
locus(Wong, Moore et al. 1991). This gene codes for the TCR-CD3 complex E
chain and is located on chromosome 11q23, "in the vicinity" of the human Thy-1
locus. Although the authors found no association between this locus and type 1
diabetes overall, they did report a significant difference between the frequency of
the 8 kilobase allele in male and female subjects (0.268 vs 0.43;
and between female diabetics and controls (0.43 vs 0.267; p<0.015). This led to
the suggestion that a gene residing on chromosome 11q23 might cause
susceptibility to type 1 diabetes in women and subsequently led to the designation
of as human 'IDDM2' by the Eleventh International Workshop on Human
Gene Mapping (Junien and van Heyningen 1991). This assignment was particularly
surprising given the conflicting results concerning this chromosomal region, the
lack of a priori reason for a sex difference in disease association and the well-
described association between INS and type 1 diabetes, first reported in 1984 (Bell,
Horita et al. 1984).
In summary, there is prodigious evidence that HLA genes are associated and linked
to type 1 diabetes although the precise localisation of all of these susceptibility loci
has yet to be defined. Irrespective of the number of HLA loci, family studies
indicate that genes within the HLA region account for only a (minor) part of the
disease clustering; other unlinked loci and/or environmental factors are implicated
The INS region has been consistently associated with disease but only one family
study has shown evidence for linkage; in that study maternal imprinting and an
interaction with HLA(-DR4) had to be invoked to provide evidence for INS-
2 2
encoded susceptibility. Evidence supporting other candidate loci is weak, requiring
confirmation in independent data sets.
1.3.3. Environment al fact ors.
Environmental factors may act at any time from conception until the moment of
diabetes-onset and could both promote and prevent disease. Apart from twin
studies, evidence that the environment plays an important role in the development of
human diabetes includes reports describing a seasonal pattern of disease-
onset (Ludvigsson and Afoke 1989) and the increasing incidence of type 1 diabetes
in several countries(Joner and Sovik 1991) (Tuomilehto, Rewers et al.
1991)(Metcalfe and Baum 1991). Studies perporting to show effects of the
environment, however, require close scrutiny. For example, geographical variation
in the frequency of type 1 diabetes correlates more convincingly with HLA-linked
determinants than average yearly temperature (Diabetes Epidemiology Research
International Group 1988) (Dorman, LaPorte et al. 1990). Similarly, caffeine
exposure is only one of a multitude of environmental and genetic differences
between high risk Scandinavian populations and low risk groups
elsewhere(Tuomilehto, Tuomilehto- Wolf et al. 1990) (Bain, Rowe et al. 1990).
These concerns emphasize the likely interactive relationship between the
environment and genetic factors. This contention is supported by reports that ethnic
groups living in the same area, with similar healthcare and diet, may have
significantly different frequencies of diabetes(Gay, Hamman et al. 1989). Also, the
frequency of type 1 diabetes can increase in immigrants migrating from low risk
countries to high risk ones(Diabetes Epidemiology Research International 1987).
2 3
1.3.3.i. Viruses.
A great deal of interest has focused on viral infections as "triggers" of the
autoimmune process that ultimately leads to ß-cell destruction and there is now a
large body of data concerning this topic(Todd 1991). Viral infections can cause
mononuclear infiltration of islets and be directly cytotoxic to especially in
the setting of overwhelming neonatal infections (Jenson, Rosenberg et al. 1980). In
a case described by Yoon et al (Yoon, Austin et al. 1989), Coxsackie B4 virus
isolated from a child's pancreas at postmortem produced insulitis and diabetes when
inoculated into mice, implying that the child's diabetes was virally induced.
Post-mortem histological studies of recently diagnosed cases, however, do not
support the contention that rapid cytopathic viral infection is a major cause of ß-cell
destruction. Persistent viral infections are more likely to be involved, given the long
prodromal phase of type 1 diabetes. Viruses known to infect include
rubella, cytomegalovirus (CMV) and Coxsackie virus (Jenson, Rosenberg et al.
1980). Congenital rubella is the foremost example of an intra-uterine infection
causing diabetes indistinguishable from the sporadic type 1 disease; insulin-
dependent diabetes is seen in 12-20% of cases of congenital rubella, has an age-at-
onset in the mid-teens and is associated with HLA-DR3 and -DR4 (Ginsberg-
Fellner, Witt et al. 1984)(Mensen, Forrest et al. 1978). Congenital rubella,
however, cannot be involved in many sporadic cases since vaccination regimes in
the UK, and elsewhere, have dramatically reduced the incidence of intra-uterine
exposure.
Recently, two reports described an experimental model of diabetes in mice which
offers a plausible mechanism for viral-related autoimmune destruction of in
2 4
humans (Ohashi, Oehen et al. 1991) (Oldstone, Nerenberg et al. 1991). Mice,
which were not diabetes-prone, were made transgenic for a lymphocytic
choriomeningitis virus (LCMV) gene, under control of the specific promoter
of the rat insulin II gene. As a consequence, viral protein was selectively
expressed by however, the mice did not become diabetic unless they were
infected with LCMV. The conclusions were that could express an
exogenous antigen but were not a target for T cell cytolytic activity because other
'immune signals' were lacking. LCMV infection provided these signals, resulting
in autoimmune destruction of and diabetes. In man, one could postulate that
individuals become infected with a ß-cell tropic virus which persists without
substantial viral or immune cell-mediated cytopathic damage. In the presence of
type 1 diabetes susceptibility HLA molecules, immune cells may slowly infiltrate
the islets, producing a low-grade insulitis which may resolve over time. Overt
disease will only be precipitated if there is an additional viral infection during a
critical phase or "window" in this process. This proposal is consistent with
experimental evidence that viruses encode protein epitopes that are immunologically
cross-reactive with ß-cell epitopes and reports that M Z twins who are discordant for
disease after 5 years are likely to remain so.
Hypotheses concerning persistent viral infection of can be rigidly tested by
using highly sensitive PCR methodology. CMV infection is persistent, involves
cells, and the presence of the virus has been associated with type 1 diabetes
(Bantvala, Bryant et al. 1985). Foulis et al. tested the hypothesis that a persistent
non-cytopathic infection of by CMV is involved in disease aetiology using
PCR (Foulis 1989). They dissected individual from paraffin wax-embedded
specimens taken from recently diagnosed cases: a PCR assay, specific for the
2 5
intermediate-early gene of CMV, showed no evidence of infection in any of the 47
diabetics tested(Foulis, McGill et al. 1992).
It is equally, if not more likely that no single virus accounts for the majority of
cases of type 1 diabetes and the effects of viral infection may be non-specific. ß-cell
stress, in genetically susceptible individuals with early insulitis ('pre-diabetes'),
could precipitate immune destruction of large numbers of and hence hasten
the onset of disease. Any infection could have this effect and there are published
reports of increases in mumps, chickenpox, rubella and other common viral and
bacterial infections just prior to disease onset (Oldstone, Nerenberg et al. 1991).
Bantvala et al. found an increase in Coxsackie B-specific IgM titres in recently
diagnosed type 1 diabetics whilst Pak et ai. have detected CMV genomic DNA more
frequently in diabetics compared with controls(Bantvala, Bryant et al. 1985)(Pak,
Chu et al. 1990). Puberty and the concomitant increase in peripheral insulin
resistance could also have a similar effect on the function of (Smith,
Archibald et al. 1988). It is, of course, difficult to prove that infections accelerate
ß-cell destruction and it is possible that their apparent increase in the pre-diabetic
period reflects the immunocompromised state (a consequence of mild to moderate
hyperglycaemia).
The hypothesis that environmental factors (particularly infections) protect against
the development of type 1 diabetes is novel and has a number of attractive features
(Todd 1991). The increased incidence of childhood-onset disease in many countries
has occurred against a background of widespread vaccination programmes and
improved health care. Paralytic poliomyelitis affords a precedent for the serious
long-term consequences of delayed exposure to an common infectious agent. The
most powerful support, however, for a protective role of the environment comes
2 6
from the NOD mouse. The cumulative frequency of murine type 1 diabetes in
inbred, genetically identical NOD mice is 50-90% for females and 10-50% for
males, when housed under specific-pathogen free (SPF) conditions. Therefore, as
in human MZ twins, possession of all the susceptibility alleles necessary for type 1
diabetes is not sufficient to cause overt disease in all animals; agents present in the
animal house must affect the penetrance of susceptibility determinants. Two groups
have shown, however, that if SPF NOD mice are Caesarean-derived, and then bred
under germ-free conditions, the frequency of diabetes increases to 100% for
females and 70% for males(Wicker, Miller et al. 1987)(Suzuki, Yamada et al.
1987). Similar results are also seen in caesarean derived BB/Wor diabetic rats(Like,
Guberski et al. 1991).
Conversely, deliberate and accidental viral infections have been shown to reduce
disease frequency. Most strikingly, in one colony, diabetes resistance correlated
with high titres of antibodies to mouse hepatitis virus (MHV): after exposure to
MHV, the disease frequencies were 36% and 9% (females and males respectively)
compared to 95% and 60% in the MHV-negative progeny of caesarian-derived
mice(Wilbertz, Partke et al. 1991). The implications for murine type 1 diabetes are
that endogenous factors are sufficient to cause disease. Any causative role for
viruses in this setting would, therefore, be restricted to endogenous, inherited
retroviruses. To date, there is no firm evidence of the participation of a retroviral
sequences in diabetes aetiology, however, endogenous retrovirues are common,
stably integrated in both mouse (and human genomes) and can express proteins.
Furthermore, immunological cross reactivity has been demonstrated between the
retroviral antigen p73 and insulin (a candidate ß-cell autoantigen) and retroviruses
have been shown to influence the T-lymphocyte activity(Serreze, Leiter et al.
1988) (Choi, Kappler et al. 1991).
2 7
Other environmental manipulations also protect against diabetes in the NOD mouse
and BB rat; for example, a single injection of Freund's adjuvant or BCG given
early in life(Sadelain, Quin et al. 1990), immunoregulation by cytokines such as
interleukin 1 (Il-1) and Tumour necrosis factor (Jacob, Aiso et al, 1990),
neonatal stimulation of (Buschard, Jorgensen et al. 1990) and subcutaneous
or oral insulin (Atkinson, Maduren et al. 1990) (Zhang, Davidson et al. 1991).
There is little direct evidence to support a protective role for the environment in
human type 1 diabetes. Indeed, the studies which point to such an effect can be
interpreted in a number of ways. For example, a Finnish study of newly diagnosed
type 1 diabetics found significantly lower levels of IgG antibodies to mumps virus
in patients compared to non-diabetic siblings and controls(Hiltunen, Hyoty et al.
1991). Antibodies to CMV, Coxsackie B4 and rubella viruses were equally
distributed in the three groups. One interpretation of this result is that IgG
antibodies to mumps protect against diabetes, however, an alternative explanation
is that pre-diabetic individuals may be unable to mount an appropriate antibody
response, permitting persistence of the virus and hence, accelerated ß-cell
destruction.
1.3.3.ii. Diet.
Reports of social risk determinants for childhood diabetes(Christau, Kromann et al.
1977)(Blom, Dahlquist et al. 1989) indicate that lifestyle behaviour, such as eating
habits, may contribute to disease onset. In one study, mean consumption of milk
was correlated with the yearly incidence of type 1 diabetes (Scott 1990). Others
have shown an association between short duration of breast-feeding and type 1
diabetes (Blom, Dahlquist et al. 1989) (Borsch- Johnsen, Mandrup-Poulson et al.
1984)(Mayer, Hammar et al. 1988) suggesting that the early introduction of cow's
2 8
milk proteins may be a risk factor for disease. This hypothesis is supported by
reports that diabetes does not occur in diabetes-prone Bio Breeding (BB) rats reared
on a diet free of cow's milk for the first two-to-three months of life (Elliott and
Martin 1984)(Daneman, Fishman et al. 1987).
The whey protein, bovine serum albumin (BSA), is a candidate molecule for the
'environmental trigger' which leads to type 1 diabetes for the following reasons:
early induction of tolerance to BSA prevents diabetes and immunisation accelerates
it in the BB rat(Martin, Trink et al. 199l)(Glemm, Robinson et al. 1989)(Dusch,
Karjalainen et al. 1992); serum concentrations of anti-BSA antibodies are
significantly higher in diabetic rats than in controls(Beppu, Winter et al. 1987); anti-
BSA antibodies are present in patients with type 1 diabetes(Martin, Trink et al.
1991). Anti-BSA antibodies bind to p69, a pancreatic ß-cell surface protein that is
inducible by interferon gamma; this led Martin and colleagues to propose that a
BSA-induced, p69 cross-reactive immune response could be the link between milk
protein and ß-cell autoimmunity (Martin, Trink et al. 1991). BSA differs from
human albumin in a 17 amino acid sequence extending from position 152 to 168 of
the BSA molecule, termed ABBOS. Karjalainen et al. have analysed anti-BSA and
anti-ABBOS antibodies in 44 type 1 diabetics at diagnosis, after 3-4 months and
again at 1-2 years(Karjalainen, Martin et al. 1992). All the diabetics had elevated
concentrations of IgG (and IgA) antibodies to BSA compared with controls, the
majority of which were specific for ABBOS. Antibodies to other milk proteins were
not increased. Antibody levels declined after diagnosis (especially those with anti-
ABBOS specificity), reaching normal levels within two years. The authors
concluded that patients with type 1 diabetes have immunity to cow's milk albumin,
with an antibody capable of cross-reaction with a specific surface protein.
Whilst it is possible that such antibodies could be central in ß-cell destruction, an
2 9
alternative hypothesis is that there are multiple antibodies to antigens present
at the onset of type 1 diabetes (a consequence of destruction, rather than it's
cause) and that homology of the p69 antigen and BSA is clinically
irrelevant(Chideckel 1992). The 'diabetes-triggering role' of BSA in animal models
suggests that such scepticism is not warranted, however, a recent study does not
support the earlier findings.
Dahlquist et al examined sera from 1 16 recent-onset diabetic children and 112 age-
and sex-matched controls for islet cell antibodies (ICA), cow's milk protein IgA,
IgG and IgM antibodies and lactoglobulin IgA and IgM antibodies
lactoblobulin is another protein present in cow's milk but not human, which has
been shown to be highly antigenic) (Dahlquist, Savilahti et al. 1992). Antibody titres
were compared to questionnaire data on the duration of breast-feeding and
introduction of formula feeds. They found that most antibody levels were increased
in the diabetics and that the differences in both cow's milk and lactoglobulin
antibodies were most pronounced in early onset disease. If these antibodies are a
non-specific reaction to destruction, then one would expect a correlation with
titres of ICA. This was indeed the case for cow's milk proteins, however,
lactoglobulin IgA antibodies were independently related to risk, favouring a more
specific and independent relationship between these antibodies and type 1 diabetes.
Given the central tenet of the above studies, one might expect milk intake to be high
in children who go on to develop diabetes. In fact, there is a report of a decreased
frequency of milk intake among diabetic compared to control children who were
questioned about frequent intake of food and milk prior to disease onset (Dahlquist,
Blom et al. 1990).
3 0
1.4. Prospects for prevention of type 1 diabetes.
The study of type 1 diabetes is directed towards two major goals; better treatment
for those with overt disease and prevention of type 1 diabetes in those at risk.
Although improvements in treatment have been made in recent years (for example,
methods of insulin delivery, glucose monitoring, retinal laser therapy), diabetics
continue to be at risk of disabling and life-threatening complications. In addition,
the incidence of new cases of disease appears to be increasing. In this setting, the
prevention of type 1 diabetes would have a major impact in both human and
economic terms.
As described in Section 1.3, the aetiology of type 1 diabetes is incompletely
understood. Genetic susceptibility is necessary for the development of disease but
MZ twin studies indicate that overt disease is unlikely, even in the presence of a full
complement of susceptibility alleles. Environmental factors are, therefore, required
for the phenotype to be expressed and these have yet to be identified. It is also
likely that the process which culminates in type 1 diabetes is protracted and may
remit without causing overt disease. Given this background, it is feasible that type 1
diabetes could be prevented by manipulation of the environment before ß-cell
damage has occurred or by therapeutic intervention at an early stage of ß-cell
dysfunction. This will require both a knowledge of the environmental factors
important in disease aetiology and an ability to detect those at high risk of disease.
Whilst it is possible that large epidemiological studies alone will detect important
environmental influences, the odds are heavily stacked against such an outcome.
Even in those countries with the highest incidence of disease, massive numbers of
3 1
individuals need to be prospectively studied for each new case of type 1 diabetes.
Furthermore many, if not all, of the study population will have been exposed to the
'diabetogenic' environment and yet will not develop disease since they lack the
necessary high-risk genotype. If the environmental influences are multiple,
protective, intra-uterine (or a combination of all three) then the order of difficulty
increases by many magnitudes.
This highlights the importance of identification of individuals at high risk of
disease. A cohort of high-risk individuals, identified before any indication of
disease pathogenesis (ideally at birth), would facilitate the prospective study of
environmental influences on diabetes development. in such a group, there exists the
potential for early diagnosis of type 1 diabetes, hence this cohort would also be a
reagent for testing new therapeutic approaches. To date, strategies of risk
assessment have used serological markers and metabolic tests in first-degree
relatives of known diabetics; this combination has been employed to attain a high
specificity of prediction, so as to limit the use of potentially harmful interventions to
those at highest risk. Since over 90% of new type 1 diabetics have no immediate
family history of disease, screening measures will have to be successfully applied
to the general population to make a significant impact.
1.4.1. Humoral markers of type 1 diabetes.
Antibodies to islet cells were first detected in patients with polyendocrine
disease(Bottazzo, Florin-Christensen et al. 1974) (MacCuish, Irvine et al. 1974).
Subsequently, it was found that antibodies to several islet cell components are
present in 70-80% of newly diagnosed cases of type 1 diabetes(Landin-Olsson,
Karlsson et al. 1989). Islet cell antibodies (ICA) are detected by an indirect
3 2
immunofluorescence technique and the antigen to which they are directed remains
unknown. Studies of fist-degree relatives of type 1 diabetics have shown that ICA
can be present several years before disease-onset, however, antibody levels may
fluctuate and are not an absolute indicator of future disease.
Despite technical problems with ICA measurement(Bonifacio, Boitard et al. 1990),
current models of diabetes prediction are based on this marker. ICAs are detectable
in 5-8% of first-degree relatives and new familial cases of diabetes are concentrated
in this ICA-positive group. The risk of disease is approximately proportional to the
ICA titre, hence 5% of first-degree relatives with ICA between 4-19 Juvenile
Diabetes Foundation Units (JDFU) require insulin within 5 years, compared with
35 % of those with ICA >20 JDFU(Bonifacio, Bingley et al. 1990)(Riley, Maclaren
et al. 1990). In this latter group, approximately 60-70% will require insulin within
ten years although progression to diabetes is not inevitable in the
remainder (McCulloch, Klaff et al. 1990).
The predictive value of ICA can be further refined by the staining pattern of the
antibodies (Gianani, Pugliese et al. 1992) (Genovese, Bonifacio et al. 1992) (Timsit,
Caillet-Zucman et al. 1992). It has been demonstrated that some ICAs stain
predominantly within islets restricted ICA') and these are associated
with a lower risk of diabetes than ICAs which stain all types of islet cells
('nonrestricted ICA'). Since restricted ICA are responsible for
immunofluorescence staining in ~25% of ICA-positive first-degree relatives, a
proportion of false positives may be eliminated by sub-division of the antibody
response. Bingley et al. have calculated that the effect on a 35% risk of progression
over 5 years for relatives with ICA >20 JDFU would be marginal (rising to only
3 3
49%), however, at the end of 10 years >90% would be expected to develop
diabetes (Bingley, Bonifacio et al. 1993).
Two other autoantibodies of importance in risk prediction have been identified;
insulin autoantibodies (IAA) and autoantibodies to an islet cell antigen of 64,000
molecular weight (64-kD). IAAs react specifically with insulin and can be detected
before exogenous insulin therapy has been commenced(Palmer, Asplin et al. 1983).
They appear to have little prognostic significance in the absence of ICA but the
combination of these antibodies is highly predictive. In the study of Ziegler et al.,
for example, family members positive for IAA with ICA >40 JDFU had a 77% risk
of diabetes within 5 years, compared with 42% for those with ICA >40 JDFU
alone(Ziegler, Ziegler et al. 1989). It is of interest that IAAs are inversely related to
age, highest levels being reported in children below the age of five years at
diagnosis(Vardi, Ziegler et al. 1988). This has led to the suggestion that IAAs may
appear early in life in susceptible individuals and then slowly disappear over time.
Alternatively, this finding might indicate heterogeneity of type 1 diabetes (Section
2.1.4).
The 64-kD autoantigen is defined by the ability of diabetic serum to
immunoprecipitate a 64,000- labelled islet cell protein (Baekkeskov, Landin et
al. 1987). This protein has recently been identified as glutamic acid decarboxylase
(GAD), an enzyme expressed in brain and pancreas which is responsible for the
synthesis of aminobutyric acid(Baekkeskov, Aanstoot et al. 1990). Antibodies to
the 64-Kd antigen and to GAD are found in ~80% of relatives studied before
diagnosis (Atkinson, Maclaren et al. 1990) (Barmeier, McCulloch et al. 1991) and
they may persist for a longer period than ICA(Christie, Daneman et al. 1990). As in
the case of ICA, distinct specificities of these antibodies has been
3 4
demonstrated(Christie, Vohra et al. 1990). Antibodies to a 50,000-Mr tryptic
fragment are found in most type 1 diabetics; these antibodies are, however, also
present in 15% of MZ twins who remain discordant for disease and in ICA-positive
plyendocrine patients who do not develop diabetes. This has led to the suggestion
that GAD may be the autoantigen of the ß-cell restricted ICA, with low risk of
progression to disease. In contrast, antibodies to 37,000/40,000-Mr tryptic
fragments, distinct from GAD, are found in the majority of type 1 patients and
correlate well with nonrestricted ICA. These are found in only 2% of discordant
twins who have not developed diabetes(Christie, Tun et al. 1992). To date, large
prospective studies have not been performed using these markers and their
prognostic utility is not known.
1.4.2. Metabolic tests of function.
Immunological markers identify those subjects at high risk of autoimmune
damage but give no indication as to the stage of this process. Direct tests of ß-cell
function are an obvious (and essential) measure of target organ damage in type 1
diabetes. Unfortunately, the available methods are imprecise and there is difficulty
in extrapolating from functional abnormalities to an estimation of ß-cell mass.
1.4.2.i. Glucose tolerance.
Prospective follow-up of first-degree relatives of type 1 diabetics has shown
progressive or intermittent hyperglycaemia many months before the development of
overt disease. Indeed, oral glucose tolerance tests diagnostic of diabetes or impaired
glucose tolerance (IGT) have been described up to ten years prior to the
development of symptoms (Rosenbloom, Hunt et al. 1982) (Millward, Alviggi et al.
1986). Abnormalities of glucose tolerance are relatively common in the latter stages
3 5
of the prodrome of diabetes; one analysis showed raised random blood glucose
levels or IGT in 1 1/15 ICA+ individuals who later developed diabetes(Tarn, Smith
et al. 1987). Using results from intensively studied first-degree relatives with ICA
>40 JDFU, the Joslin group described a progressive rise in fasting and 60 minute
plasma glucose levels in the intravenous glucose tolerance test (IVGTT) during the
18 months prior to overt diabetes(Bleich, Jackson et al. 1990). A fasting plasma
glucose >5.9mmol/l had a positive predictive value of 100% for overt diabetes
within 18 months, however, the 60 minute glucose value did not discriminate so
well.
1.4.2.ii. Insulin secretion.
The insulin response to an intravenous glucose load, as measured by the IVGTT, is
the most widely employed measure of function used in the prediction of type
1 diabetes. A progressive decline in FPIR prior to diabetes has been shown in
prospective twin and family studies(Srikanta, Ganda et al. 1983)(Chase, Voss et al.
1987) (Vialettes, Mattei-Zevaco et al. 1988). It was initially suggested that this
decline was linear and an individual's time to diabetes could be estimated on the
basis of two tests(Srikanta, Ganda et al. 1984). Unfortunately, the IVGTT has
proved to be highly variable both within and between subjects and there are major
changes in the insulin response during puberty (Smith, Tarn et al. 1988)(Smith,
Archibald et al. 1988). This makes interpretation of changes within the normal
range extremely difficult and has limited the application of this finding in individual
subjects.
Loss of first phase insulin secretion (usually defined as below the first centile) is
claimed to be highly predictive of imminent type 1 diabetes in subjects with
detectable ICA. In the largest published series, 1169 family members were screened
3 6
for ICA and 66/71 of those with detectable ICA had an IVGTT(Chase, Voss et al.
1987). Of those subjects with a response below the first centile (sum of 1 minute
and three minute insulins <46mUnits/l), 7/16 needed insulin within 2 years. The
test was most useful in predicting diabetes in children where 7/10 developed
diabetes within 2 years. The positive predictive value of the test was improved by
using a lower threshold; below 25mU/I insulin response, 7/7 children developed
diabetes within one year and 5/7 were diabetic within one month. The short time
lapse between loss of FPIR and the need for insulin therapy implies that that the
cell mass is only slightly greater than at diagnosis; benefit from intervention at this
stage may therefore be marginal.
1.4.3. Combinations of humoral markers and metabolic tests in
families.
Elevated titres of IAA and loss of FPIR are each strongly predictive of rapid
progression to type 1 diabetes in high-titre ICA-positive relatives. A preliminary
report indicated that a model based on combined analyses gave highly specific
prediction of end-stage prediabetes, with progression in 90% of high-risk
individuals within 4 years(Colman and Eisenbarth 1988). Five years after it's initial
description, this 'dual parameter model' has yet to be validated. Further,
investigators have described patients with low insulin secretory responses who
have remained stable or improved(Bingley, Bonifacio et al. 1993). The proper
evaluation of various combinations of disease markers is still awaited.
3 7
1.4.4. Assessment of risk of type 1 diabetes in the general
population using serological and metabolic markers of disease.
Bingley et al. compared the prevalence of ICA and the risk of diabetes in
approximately 3,000 schoolchildren, aged 9-13 years, and 272 age-matched non-
diabetic siblings of type 1 diabetics(Bingley, Bonifacio et al. 1993). ICAs were
detected (threshold of 4 JDFU) in 2.8% of schoolchildren and 6.6% of siblings.
Since incidence data suggest that 0.2% of these children develop diabetes within 10
years, compared with 2.8% of the siblings, siblings were only twice as likely to
have a given titre of ICA than healthy children, but are 14 times more likely to
develop diabetes. The predictive value of ICA in the general population will fall,
therefore, to approximately one-seventh of that in siblings. This estimate is
consistent with prospective data from siblings and schoolchildren in Finland (Knip,
Vahasalo et al. 1992). The correction factor implies that progression to type 1
diabetes in 5 years would occur in 2-5% children with detectable ICA and 5-10%
of those with ICA >20 JDFU. Hence, ICA alone will have limited prognostic value
in the general population.
The predictive value of ICA/IAA in combination with metabolic tests is also
significantly reduced if used to screen the general population. When combined with
a test of FPIR, high titre ICA and fluid phase IAA are estimated to give a specificity
of 99.75% and sensitivity of 60%(Palmer and McCulZoch 1991). In the general
population these figures yield a positive predictive value of only 42%; per 100,000
population screened there would be 180 true positives, 120 false negatives and 250
false positives.
3 8
Irrespective of their ability to detect cases at high risk of diabetes, serological and
metabolic tests are less than ideal for screening, even for the purposes of research
studies. Whilst the presence of ICA and IAA in cohorts of at-risk individuals
correlate with future disease development, in individuals they do not always
persist (Riley, Maclaren et al. 1990) (Thivolet, Beaufiere et al. 1991) (Ziegler, Alper
et al. 1991)(Kuller, Becker et al. 1990). To date, the time of emergence and the
persistence of the autoantibody response in the general population has not been
described. Hence, multiple testing may be required and is a feature of many of the
published studies. In addition, the antibody analyses are labour intensive, not easily
reproduced and, therefore, unsuitable for large-scale use. Metabolic testing is also
time-consuming and labour-intensive whilst IVGTTs are too invasive to be
acceptable to the low-risk individuals. Finally, methodological differences between
centres have hindered comparison of results from IVGTT studies.
1.4.5. Genetic markers.
For population screening, the use of genetic markers has a number of potential
advantages over serological and metabolic testing. The test need only be performed
once since the inherited genome is invariant, and this screening could take place at
the time of birth. Invasive procedures are not necessary as PCR analysis can be
performed on umbilical cord blood or buccal cell DNA from mouthwashes(Lench,
Stanier et al. 1988). PCR methodologies are potentially simple, robust and easily
transferred between laboratories. There are also theoretical attractions, in that the
identification of genetic markers should lead to the isolation of individual genes and
the responsible polymorphisms, so-called positional cloning (Collins 1992). This
will allow insights into the pathophysiology of type 1 diabetes and ultimately lead
to new therapeutic approaches.
3 9
An often cited limitation to genetic testing is the 36% concordance rate in MZ twins.
This implies that the highest predictive power that can be achieved by a genetic
approach is a risk of only one-in-the. Indeed, given the likely ascertainment bias
in twin studies (twins are more likely to be ascertained and, therefore studied, if
both are diabetic), assignment of even a 1-in-3 risk may seem optimistic.
Calculations of this type are, however, flawed on at least two counts. Firstly, the
penetrance of high-risk genotypes is not known; MZ twins who are HLA-DR3,-
DQB 1 *0201/DR4,-DQB 1*0302 heterozygotes may have a higher concordance rate
than 36%. This is supported by subdivision of data from Johnston et al. which
shows >50% concordance in (the small numbers of) HLA-DR3/4 MZ
twins(Johnston, Pyke et al. 1983). Unfortunately, further HLA typing has not been
performed on this cohort (Dr R.D.G. Leslie, personal communication) and I have
been unable to obtain data on the Joslin twins.
Secondly, the increasing incidence of type 1 diabetes has important implications for
genetic screening. Given the relatively fixed genetic background in the UK
Caucasoid population over the past 100 years (at least), the increased number of
new cases implies one of three things: 1) more individuals with known genetic
susceptibility determinants are developing disease, for example, the penetrance of
HLA-DR3/4 has been increased; 2) individuals who do not have currently
recognised high risk genotypes are becoming diabetic; 3) a combination of both.
This issue has important implications for population screening strategies using
genetic markers. If the penetrance of known determinants increases, these markers
will become more effective in pin-pointing individuals at high risk. Alternatively, if
new cases are developing in a 'genetically low-risk group' then current markers will
have reduced power and may become obsolete as screening tools. The available
evidence is inconclusive. Kontiainen et al. reported that the frequency of HLA-DR3
4 0
in children with type 1 diabetes in Finland was increased in patients diagnosed in
the 1960s but fell to background levels in the 1970s and 1980s(Kontiainen,
Scheinin et al. 1988). In contrast, HLA-DR4 is reported to be significantly
increased in frequency in epidemic cases of type 1 diabetes compared to non-
epidemic cases(Ziegler, Alper et al. 1991). Prospective studies of diabetic cohorts
diagnosed during different periods will be needed to answer this important
question.
These provisos aside, the criticism of genetic screening assumes that genetic
markers would be used in isolation from other investigations and this is clearly not
the case. Individuals identified as being at high genetic risk would be monitored for
evidence of active ß-cell autoimmunity (using a combination of autoantibody tests)
and, if positive, be subjected to invasive tests of ß-cell function. In this scenario,
invasive investigations are only offered to those individuals at greatest risk (in
whom the take-up rate is likely to be highest).
Using PCR and oligonucleotide dot blot analysis the most diabetogenic HLA types
can be identified. In a study from Finland, a panel of 4 sequence-specific
oligonucleotide probes was used to identify susceptibility and protective HLA-DQ
alleles. HLA-DQB 1*0302, in the absence of a protective HLA-DQB 1 allele, was
found in 82% of type 1 diabetic patients compared with 3% of controls, giving a
life-time absolute risk of 13.7% (Reijonen, Ilonen et al. 1991). These figures cannot
be applied to the UK population since the incidence rates of type 1 diabetes are so
different from those in Finland (approximately 14/100,000 versus
30/ 100,000) (Diabetes Epidemiology Research International Group 1988). Similar
large-scale studies have yet to be performed in the UK but analyses from other
countries suggest that HLA-DQ typing may identify individuals at 6-8 %
4 1
risk(Sheehy, Scharf et al. 1989)(Todd 1991). This figure can probably be
improved since studies have not subdivided HLA-DR3 haplotypes into those
conferring high and low risk (Section 1.3.1.iii). It is of note that, even at this low
level of absolute risk, HLA screening can identify individuals from the general
population with a similar risk to siblings of affected individuals. Given the MZ twin
data, it is reasonable to assume that identification of additional non-HLA
susceptibility loci may allow identification of individuals at 15-20% risk of
developing diabetes.
1.5. Identification of new genetic markers for type 1 diabetes.
1.5.1. Technological aspect s.
The three main strategies for the identification of disease susceptibility loci are: the
candidate gene or gene region approach, random screening (exclusion mapping) of
the genome using highly polymorphic probes; and identification of subphenotypes
that are genetically less complex than the clinical disorder(Todd and Bain 1992).
The analysis of candidate genes has already been successful in the study of type 1
diabetes (HLA and INS) and remains the method of choice. Virtually any gene that
affects function or activity of the immune system is a potential candidate.
Further, it is possible that genes influencing susceptibility to type 2 diabetes are
involved in the development of type 1 disease (Sections 3.1.2.ii and 7.2.1).
An additional and potentially more targeted source of candidate genes are being
generated from animal models. The large degree of conservation between mouse
and human genomes means that susceptibility gene regions identified in the NOD
mouse have homologous regions in man(Erkkson 1989). To date, there have been
4 2
reports of four susceptibility gene regions outside the MHC in the NOD mouse and
there is preliminary evidence of at least a further seven (J.A.Todd, personal
communication). As genes in the NOD mouse are mapped and functionally
characterised, candidate biochemical pathways will also be identified.
The task of testing candidate loci has been greatly simplified by the application of
the polymerase chain reaction (PCR). Most genes are close to segments of tandemly
repeated simple DNA sequences (microsatellites) that are highly polymorphic and
can be easily amplified by PCR. Microsatellite size variation (down to 2 base pairs)
can be resolved using non-denaturing polyacrylamide gels stained with ethidium
bromide. This method has recently been successful in demonstrating linkage
between a subphenotype of non-insulin-dependent diabetes (Maturity Onset
Diabetes of the Young) and the glucokinase gene on chromosome 7(Froguel,
Vaxillaire et al. 1992). Large numbers of microsatellite primers have been published
and further sequences are available from the EMBL and Genbank data bases. For
regions where microsatellites are not available or have low information content,
new microsatellite markers can be developed by screening Yeast Artificial
Chromosome clones from the genetic region of interest.
1.5.2. Statistical aspects.
The analytical process by which susceptibility genes are identified is known as
genetic linkage analysis. Genetic linkage reflects the fact that two genes located near
to one another on the same chromosome are not inherited independently. If two loci
are in close proximity, alleles at these loci will tend to be inherited together. If they
are some distance apart, recombination between homologous chromosomes during
reproductive events (meioses) creates new combinations of alleles. The frequency at
4 3
which recombination occurs (the recombination fraction), increases with the
distance between loci; if they are sufficiently far apart, the probability of inheriting
recombinant and parental (nonrecombinant) chromosomes is equal (0.5), the same
as when loci are on different chromosomes.
The principle underlying the application of classical linkage analysis to the study of
single-gene disorders is straightforward(Morton 1955). If two traits (such as a
disease and a genetic marker) are Co-inherited more frequently than is expected by
chance, this constitutes genetic linkage. For example, in a pedigree, the probability
of observing co-segregation of disease and a DNA polymorphism in ten informative
meioses will equal ( if their loci are very tightly linked. If the two loci are not
linked, then the probability of observing complete co-segregation in all ten meioses
will be since the probability that two randomly selected genes at unlinked
loci will cosegregate is equal to 0.5. Thus, if complete Co-segregation is observed,
the relative probability that the two loci are tightly linked, as opposed to not linked
(the null hypothesis), equals 1: or 1024 to 1. The of this ratio is
known as the log of the odds' or LOD score. In general, a positive LOD score of 3
(or more) is taken as proof of linkage. The strictness of this criterion reflects the
low prior probability (approximately 1 in 50) of linkage between any two randomly
selected loci; conditional odds of 1000 to 1, therefore, yield an overall probability
of 1 in 20 that the observed cosegregation has occurred by chance (equivalent to the
standard "p<0.05"). A negative LOD score of -2 is taken as strong evidence against
linkage, in line with the high prior probability against linkage (approximately 49.to
1).
In contrast to the situation in monogenic disorders, in complex diseases such as
type 1 diabetes, modes of inheritance, penetrances and gene frequencies are
unknown. LOD score analyses can be performed, using various genetic
4 4
models(Lathrop, Lalouel et al. 1984) (Lander, Green et al. 1987), however,
simulation studies show that the chance of falsely obtaining a LOD score of 3 is
high(Clerget-Darpoux, Babron et al. 1990). The power of such analyses in
complex diseases is further reduced by genetic and clinical heterogeneity (Section
2.1.4), and interactions between loci(Risch 1991). In addition, linkage analysis is
hampered in type 1 diabetes since large pedigrees are uncommon.
An alternative method is to restrict the analysis to affected relative pairs, especially
affected sibling pairs (ASPs). ASPs are more readily available than other relative
pairs and, as model specification is not required for analysis, the emphasis is on the
detection of susceptibility loci. At any one locus, the Mendelian expectation is that
ASP share O, 1 or 2 alleles identical-by-descent (IBD) in the proportions of 1:2:1.
If, however, the allele under consideration is involved in disease susceptibility (or
is in linkage disequilibrium with a susceptibility locus) one would expect increased
allele sharing in ASPs (more '2-sharers' and fewer '0-sharers'). The simplest
method of statistical analysis of these tests is to compare the IBD data with the
Mendelian expectations using a goodness-of-fit test. The formula used is
where Oi and Ei are the observed and expected values for i alleles IBD and i=0, 1
and 2. This test has two degrees of freedom and a value of 13.8 is numerically
equivalent to a LOD score of 3.0.
Similarly, from each individual parent, the frequency that ASPs share O or 1 alleles
IBD should be equal unless the allele is involved in disease susceptibility. In this
case ASPs will receive the same allele more frequently than not, and the proportion
of 1-sharers' would be increased. Again, a statistical comparison can be made with
4 5
the Mendelian expectations (1 : 1) using a goodness-of-fit test, this time with
one degree of freedom.
A requirement for ASP analysis is that the parental origins of marker loci can be
unambiguously assigned; this requires that parental types are available for analysis.
Since type 1 diabetes is a disease of early-onset, living parents are generally
available after the diagnosis of disease in their offspring. A potential difficulty in
the data generated from ASPs is the inherent ascertainment bias since the majority
of type 1 diabetics are sporadic cases with no first-degree family history of disease
(Section 1.7).
The collection of a large number of multiplex families gives adequate power to
detect linkage, even with genes of moderate effect, provided that there is a high
resolution map with markers of polymorphism information content (PIC)
>0.7(Risch 1990)(Hyer, Julier et al. 1991). The number of families required to
demonstrate linkage to HLA can be calculated from previous studies, however, for
new genes, the power of the analysis is dependent upon many variables (for
example, magnitude of the gene effect, proximity and PIC of the genetic marker,
disease and locus heterogeneity), most of which can only be estimated. In practice,
the more families that are available for analysis, the higher the chance of success.
Minimum numbers of pedigrees can be estimated from (recently published)
theoretical evaluations (Risch 1990) (Risch 1990) (Risch 1990)(Rich 1990) but these
targets must be flexible and be revised in line with direct experience from handling
data generated by the data set (Todd and Bain 1992).
4 6
Some methods of linkage analysis demand that disease-associated markers are first
identified by means of population association analysis(McGinnis, Spielman et al.
1991). Also, where disease susceptibility alleles are common, association studies
may be more informative than linkage data (Section 5.1). To facilitate these
analyses, large numbers of samples from sporadic cases of type 1 diabetes and non-
diabetic controls are required. In addition, this resource allows a comparison of
familial and sporadic cases since there is a possibility that the aetiology of disease
differs in these two groups (as is the case in Creutzfeldt-Jacob disease). Further,
the overall contribution of genes identified by linkage analysis of pedigrees needs to
be assessed in sporadic diabetics which account for more than 90% of new cases.
Again, the precise numbers of subjects required for these analyses is an estimate
given the number of unknown parameters(Cox and Bell 1989).
1.6. Conclusions.
Type 1 diabetes is an important condition. It is already common, the incidence of
new cases appears to be rising and it is responsible for substantial premature
morbidity and mortality. The pathogenesis of disease develops over a prolonged
period and is influenced by environmental factors. Prevention or early intervention
during the pre-clinical phase is, therefore, feasible. Identification of high-risk
individuals is necessary to facilitate such a strategy and, in the general population,
this is best achieved by genetic screening in the first instance. Serological and
metabolic markers would be employed in the genetically high-risk subgroup to
study environmental factors and to target those for intervention therapy.
4 7
Alleles of the HLA-DQ loci assign an absolute risk of approximately 1-in- 15 and
this risk may be increased by consideration of other haplotypic loci (both class I and
II). The identification of additional non-HLA genes is, however, essential to raise
the predictive power of genetic markers to levels where primary screening is viable.
A co-ordinated approach to the mapping of new susceptibility loci in complex
diseases such as type 1 diabetes is now possible. Techniques in molecular biology
have advanced to a sufficient level to enable rapid testing of candidate genes and,
theoretically, exclusion mapping of the entire human genome.
At the time of commencement of this thesis, many features of type 1 diabetes made
it an ideal experimental system to develop approaches to the mapping and
characterisation of susceptibility genes for complex disease: the disease is relatively
unambiguous to diagnose, thus reducing clinical heterogeneity; families with
multiple affected siblings and living parents are potentially available due to the high
prevalence and low age-at-onset of disease; the HLA region had already been
identified as a susceptibility locus; a considerable amount was known about the
immunology of type 1 diabetes, enabling a rationale for choosing candidate genes
for analysis; and animal models of disease were available.
1.7. Aims.
The major aim of the work documented in this thesis was to provide a resource for
the identification of new susceptibility genes for type 1 diabetes. This was to be
made up of three components; multiplex families (nuclear families with living
parents and at least two affected offspring), sporadic cases of type 1 diabetes and
unaffected control subjects. The initial target number of families required (-150)
was calculated to be large enough to identify 'important' gene effects, given the
4 8
provisos detailed above (Section 1.6). Samples were also be amassed from at least
200 type 1 sporadic diabetics and 200 ethnically-matched non-diabetic controls.
A secondary aim of this work was to make this resource available for posterity.
This can be achieved by Epstein Barr Virus (EBV) transformation of peripheral
blood lymphocytes into immortalised cell lines. These lines have the potential to
reproduce indefinitely and can be stored in a viable state under liquid nitrogen. They
represent , therefore, a limitless supply of DNA for study and allow the resource
to be used by other groups. This means that an extensive data base can be
established on one re-usable facility, limiting duplication of effort. In theory at
least, this should accelerate research activity in the field of genetics of type 1
diabetes.
Although the idea is by no means new, the scale of this project was novel. Clearly,
for such a resource to be accepted by the scientific community, the validity of the
project must be beyond question. Validation can be considered in a number of
ways: validation of the concept of family studies identifying genes important in a
mainly sporadic disease necessitates a detailed comparison of multiplex and
sporadic cases(Bingley and Gale 1991); validation of the family collection requires
confirmation of the known genetic involvement of HLA in type 1 diabetes; and
validation of the resource implies exclusion of sample mix-ups and cases of non-
paternity (using HLA markers). Validation of the project formed the third aim of my
work.
Finally, I set out to make a contribution to the current knowledge of genetic
susceptibility by: 1) examination of the controversy surrounding the involvement of
the insulin gene locus and susceptibility to type 1 diabetes in this independent
4 9

data set; 2) assessment of published reports of parental effects on HLA-mediated
susceptibility to disease; 3) analysis of new candidate gene loci.
5 0
CHAPTER 2
THE GENETIC RESOURCE
5 1
2.1. Collection of multiplex families with type 1 diabetes.
2.1.1. Ethics.
The collection of multiplex families began in February, 1989 after approval had
been granted from the local Ethical Subcommittees of both the East Birmingham
Hospital, Birmingham and the John Radcliffe Hospital, Oxford.
2.1.2. Funding.
Establishing a large collection of this kind is an expensive undertaking.
Unfortunately, there are a limited number of grant-giving bodies with sufficient
resources to adequately fund such an enterprise. Furthermore, most of these prefer
to support "the science" which is facilitated by such a resource, rather than it's
establishment. This attitude has prevailed, despite a consensus among those
working on the genetics of type 1 diabetes in the UK, that a multiplex family
collection was essential for future progress (outcome of a British Diabetic
Association sponsored Workshop on the Genetics of Type 1 Diabetes, 1988). As a
result of this situation, funding has been piecemeal and obtained from a number of
different sources, acknowledged at the beginning of this thesis. Three months after
the collection began, the British Diabetic Association (B.D.A.) made available part
of a bequest from Alec and Beryl Warren to fund the collection of samples and
immortalisation of cell lines; as a result, the collection is known as the British
Diabetic Association - Warren Repository.
5 2
2.1.3. Steering Commit tee.
A Steering Committee was established early in the collection (table 2.1). This
comprises representatives of the B.D.A. and those individuals involved in the
ascertainment, collection, validation and immortalisation of the Repository. Initially
the committee established the inclusion and exclusion criteria for the resource.
Subsequently, the role of the committee has been to oversee financial and
organisational aspects of the collection. Currently, the committee is involved in the
distribution of cell lines to other laboratories.
2.1.4. Diagnosis of type 1 diabetes.
Linkage analysis of any disease is most likely to be successful if the pedigrees
under study have an identical phenotype; accurate diagnosis is, therefore, essential.
Diagnosis remains a major problem in the analysis of many complex diseases. For
example, the label 'schizophrenia' may be attached to various psychiatric disorders
manifesting in young individuals, whilst in hypertension and type 2 diabetes the
clinical syndromes are arbitrarily defined extremes of a 'normal distribution'. In
contrast, the diagnosis of type 1 diabetes is usually clear-cut: acute symptoms in a
child or young adult leading to ketosis and an absolute dependence upon insulin.
Phenocopies of type 1 diabetes are also relatively uncommon and can be easily
recognised, for example, insulin-dependent diabetes following an overwhelming
viral infection or alcohol-induced pancreatitis (phenocopies are environmentally-
induced cases of disease with little or no genetic input). Misdiagnosis, due to
confusion with type 2 diabetes or maturity-onset-diabetes of the young (MODY),
may occur but can be distinguished by close questioning; type 2 diabetes usually
manifests over the age of 40 years and is accompanied by weight gain; MODY may
5 3
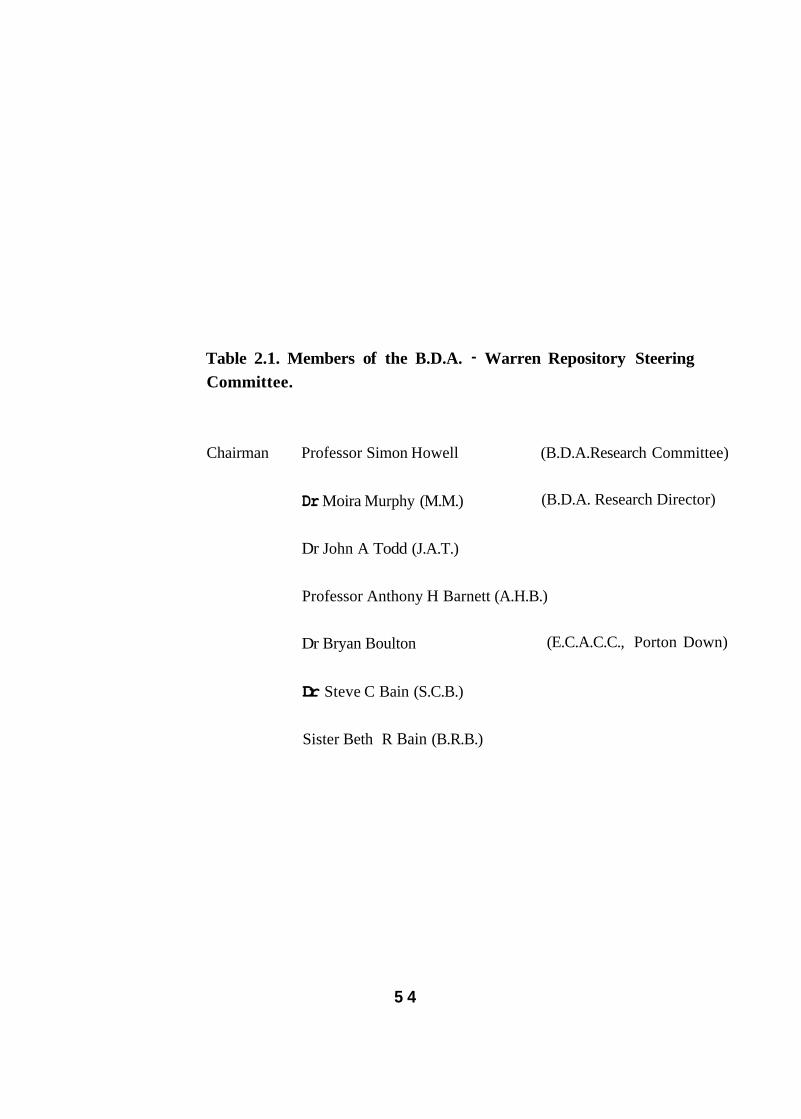
Table 2.1. Members of the B.D.A. - Warren Repository Steering Commit tee.
Chairman Professor Simon Howell (B.D.A.Research Committee)
Dr Moira Murphy (M.M.)
Dr John A Todd (J.A.T.)
Professor Anthony H Barnett (A.H.B.)
Dr Bryan Boulton
Dr Steve C Bain (S.C.B.)
Sister Beth R Bain (B.R.B.)
(B.D.A. Research Director)
(E.C.A.C.C., Porton Down)
5 4
present in children or young adults but with mild symptoms; neither condition
necessitates immediate and continual insulin therapy.
There is, however, evidence which suggests that genetic heterogeneity might exist
in type 1 diabetes. Genetic heterogeneity describes a situation where a number of
different alleles can cause the same, or very similar, phenotype. This term can be
subdivided into allelic heterogeneity, where the alleles are of the same gene, and
locus heterogeneity, where the alleles are of different genetic loci. Reports in the
literature suggest that type 1 diabetes with onset after adolescence differs from the
classical, juvenile-onset disease; the clinical onset is often more gradual, allowing a
prolonged period of oral hypoglycaemic therapy(Tarn, Thomas et al. 1988);
subjects are less likely to have circulating insulin autoantibodies at diagnosis(Vardi,
Ziegler et al. 1988); stimulated C-peptide levels are higher after five years of
disease(The DCCT Research Group 1987) and HLA associations may differ and be
quantitatively less important (Karjalainen, Salmela et al. 1989) (Caillat-Zucman,
Garchon et al. 1992). Histological studies support this contention; in the largest
postmortem study, insulitis was invariably present in children aged 3-9 years at
death (19/19), but found in only 70% of cases (23/33) aged 10-19 years at
death(Foulis, Liddle et al. 1986). A decreased frequency of insulitis with older
age-at-onset has also been documented in other autopsy series(Gepts
1965)(Doniach and Morgan 1973)(Junker, Egeberg et al. 1977).
There are two broad approaches to the problem of genetic heterogeneity;
1) the use of extremely stringent inclusion criteria to produce as homogeneous a
data set as possible. This will probably limit genetic heterogeneity but greatly
reduces the number of pedigrees available for study.
5 5
2) the recruitment of vast numbers of pedigrees by including all likely cases. This
provides a large data base (in which major gene effects might be detected), with the
potential for subgroup analysis using clinical data or new genetic loci. Small gene
effects, however, are likely to be missed and it is difficult to exclude loci using such
a data set (since negative findings could always be due to admixture).
We chose to use a combination of these two approaches. Our main inclusion criteria
applied to the first or youngest diagnosed diabetic in each multiplex pedigree; these
were clinical criteria (acute symptoms, weight loss, immediate requirement for
insulin) and an age-at-onset of diabetes less than 17 years of age. Requirements for
the second (and third) diabetics were less stringent, namely age-at-diagnosis <29
years and no prolonged period of oral hypoglycaemic therapy. Only families
satisfying these criteria were to be included in the B.D.A. - Warren Repository
(hence, the age-at-onset criteria are referred to as 'B.D.A. age criteria'). In
addition, we also collected pedigrees who did not satisfy the above age criteria (but
were clinically type 1) when they were keen to participate and in close proximity to
other suitable families.
The rationale for these decisions were as follows:
1) The age-at-onset criterion of less than 17 years for the first-diagnosed or
youngest-onset diabetic ensured that each family included a 'juvenile-onset'
diabetic. The probability of the second, or third, diabetic (aged <29 years at onset)
also having type 1 disease would, therefore, be high.
2) The parents of a type 1 diabetic child are very alert to the same diagnosis in other
offspring. As a result, the second diabetic is often diagnosed before the stage when
insulin (or any other therapy) is required. Also, these cases are unlikely to develop
severe symptoms such as weight loss or ketoacidosis before insulin is commenced.
5 6
3) Since the age criteria were arbitrary, we also collected other pedigrees who only
satisfied the clinical criteria. These additional pedigrees were to allow an analysis
of age-at-onset and linkage of HLA to type 1 diabetes (previous evidence of genetic
heterogeneity at HLA had come from association studies only). In addition, age-
related genetic heterogeneity at HLA does not ordain the same effect at other
susceptibility loci.
4) ICA and C-peptide responses were not used as inclusion/exclusion criteria.
Although approximately 80% of type 1 diabetics are ICA-positive at diagnosis, this
proportion falls over time. A rational use of this investigation would have limited
the number of pedigrees to those diagnosed within a certain period of collection.
Similar considerations apply to interpretation of the stimulated C-peptide response.
5) Finally, the age-at-onset criteria further reduced the possibility that subjects with
early onset non-insulin-dependent diabetes (but treated with insulin) would be
included in the data set.
2.1.5. Racial background.
Attempts to establish an ethnically homogeneous group are mandatory, given the
reports of differences in HLA associations between racial groups (Section 1.3.1.ii.
and Jenkins, Mijovic et al. 1990). Hence, all diabetics and controls are white
Caucasoids with all four grandparents born within the British Isles.
2.1.6. Source of families.
The first family to be collected live in Cowley, Oxfordshire. They were volunteered
by Dr David Dunger, who directs the Oxford Regional Prospective Study of Type 1
Diabetes (O.R.P.S.). This study has been gathering data on newly diagnosed type
5 7
1 diabetic children in Oxfordshire since 1985; those families known to have two
diabetic offspring were 'flagged', yielding eighteen sibling pairs for this study. The
notes of type 1 patients attending the East Birmingham Hospital diabetic clinic were
scanned, in an opportunistic way, for a positive family history of disease and
patients directly questioned about affected siblings and offspring. Over a three year
period, this yielded 18 participating families.
A plea for suitable families was made to local diabetologists and consultant
physicians in the West Midlands (A.H.B). Consultants farther afield were then
canvassed by telephone (A.H.B) and face-to-face at scientific meetings (A.H.B,
S.C.B). In 1990, all members of the Medical and Scientific Section of the B.D.A.
received a 'circular' concerning the project. An announcement was also made at the
Annual General Meeting of the Section in Glasgow, stressing that the collection
was truly nationwide. Items published in scientific journals(Bain, Todd et al.
1990)(Bain, Barnett et al. 1991)(Brown 1991) and the B.D.A.'s magazine Balance
further publicised the Repository(Rowe, Bain et al. 1990), but still did not directly
appeal to patients and their families. This was due to a reluctance of the Steering
Committee to be seen to be by-passing the 'medical establishment'. This contrasts
with a French collection of diabetic multiplex families, launched by a 'Telephon'
event and maintained using Metro advertising. Indeed, the B.D.A.'s low-key
approach was such that journalists writing for Balance in 1992 were apparently
unaware of the project; when a multiplex family wrote to the Question/Answer
section of the magazine asking whether they could participate in research projects,
the reply stated that "the B.D.A. is not directly involved in research projects and
you should contact you own hospital doctor".
5 8
Each new initiative produced a positive response in terms of family referrals,
however, this was variable and often short-lived. Presentations to local B.D.A.
patient meetings (S.C.B, A.H.B) and diabetes support groups (S.C.B), were also
turning up few additional families. In July 1992, the Steering Committee felt that
the Repository was sufficiently established to allow a more widespread and direct
approach. Dr Peter Swift, Secretary of the British Paediatric Association (B.P.A.)
agreed to canvass all the B.P.A.'s members and to print details of the Repository in
the Society's newsletter. A further article was published in Balance, for the first
time appealing to families to volunteer themselves for inclusion (Murphy 1992).
By February, 1993 I had been in correspondence with 117 consultant physicians
and paediatricians throughout the British Isles. This has generated 451 possible
families for inclusion. Our procedure for approaching families and collecting
samples developed during the first year of collection and has since become
standard.
2.1.7. The approach.
Families who volunteer themselves generally make contact with the B.D.A. They
receive a reply from Dr Moira Murphy, thanking them for their interest and
explaining that their name and address has been passed on to the collecting team.
We (B.R.B and S.C.B) then send details of the project with a form for the family to
complete and return in a stamped-addressed envelope. This establishes 1) that both
parents and diabetics are alive, available and willing to donate a blood sample; 2)
the diabetics satisfy the B.D.A. age criteria; 3) the name and address of the
diabetics' hospital consultant(s); and 4) an easy contact point with a telephone
number. I then write to their consultant explaining that the family have volunteered
5 9
for the study and ask that he/she should contact me if they have any objections to
their participation; I also enclose details of the project in the hope that they might
volunteer other families from the same area. When the families are referred by
medical staff, I contact the family by telephone (if possible) prior to sending out the
above package. This gives an early indication of those occasions where members of
the family have not been forewarned of our approach (or consented to the release of
their personal details). Such matters are best dealt with at an early stage and even
disgruntled families are eventually keen to help. In only one case has there been the
spectre of legal action.
Families who do not satisfy the inclusion criteria are not troubled further. Those
who do are contacted by telephone (S.C.B) to check details (especially willingness
and availability) and to arrange a possible time for collection. I also attempt to make
telephone contact with those families who do not reply to our initial contact; this
reveals unsuitable families, incorrect addresses and occasionally, families who do
not wish to participate.
2.1.8. Sample collection.
Families are bled in their own homes, usually at weekends, by B.R.B and myself.
Although this has necessitated a good deal of travelling, this arrangement has
prevailed for the following reasons; 1) patient compliance is good since they do not
have to travel, take time from school or work, and children are more easily bled in
their own surroundings; 2) the samples are collected in a uniform way and not
exposed to the rigours of courier firm travel; 3) personal contact with the families
improves future compliance if further sampling is required or additional clinical
details are sought; 4) the samples do not go missing.
6 0
On arrival in the family home, I explain the concept and aims of the B.D.A. -
Warren Repository and field the inevitable questions concerning diabetic care. I
then take details regarding the clinical diagnosis of type 1 diabetes, confirming to
my satisfaction that the clinical and age-at-onset criteria are met. We also record
details of any family history of type 1 and type 2 diabetes and enquire of a personal
or family history of other autoimmune diseases, specifically, Addison's disease,
coeliac disease, myasthenia gravis, pernicious anaemia, rheumatoid arthritis,
thyroid disease and vitiligo. Diabetic complications are recorded if volunteered by
patients, but are not directly illicited; complications data obtained from patient
questioning is unreliable and would not justify the potential distress of raising the
subject in young families. Forty millilitres of blood is collected into a 60ml syringe
containing 0.5ml preservative-free heparin (Minihep™, Leo Laboratories Ltd.). The
syringe, already labelled with the patient's identification number and Christian name
(checked by the patient), is capped and kept at room temperature. The average time
spent in a family home (irrespective of the number of individuals to be bled) is one
hour.
Peripheral blood lymphocytes (PBLs) are separated from 20mls of blood within 48
hours of venesection (J.A.T., S.C.B.) and then stored at -80°C. The remaining
20mls of blood are separated into plasma and cells. Plasma is aliquoted into 1ml
vials, one of which is sent for thyroid and anti-adrenal antibody screening at the
Regional Immunology Unit, East Birmingham Hospital (Professor R.A.
Thompson).
6 1
2.1.9. Immortalised cell lines.
The frozen PBLs are subjected to viral transformation at the European Collection of
Animal Cell Cultures (E.C.A.C.C.) in Porton Down, Wiltshire. Viral
transformation is a technique in which infection of lymphocytes with Epstein Barr
Virus (EBV) produces 'immortalised cell lines'. These lines can be stored under
liquid nitrogen and, under appropriate conditions, will replicate indefinitely; they,
therefore, represent a renewable source of DNA from the diabetic families. Using
the above procedure, we achieved successful transformation in more than 98% of
cases and further venesection is not necessary.
On occasions, we have attempted to use alternative strategies, for example, bleeding
performed by local hospital staff or G.P.s, use of the Vacutainer™ (Becton
Dickinson) collection system and courier firm transport. These have been more
expensive (up to ten times more so) and have led to high rates of failure of EBV
transformation (approaching 50%) due to poor patient compliance, transport delays
etc. In September 1991, a collaboration was established with Professor E.A.M.
Gale (St Bartholomew's Hospital, London) to facilitate the inclusion of multiplex
families already recruited into the Bart's-Oxford (BOX) study. This prospective
study is using serological markers to assess the risk of type 1 diabetes in siblings of
new cases. Since the families are under regular review by BOX field workers, it
was decided that bleeding should be performed on their routine visits and samples
delivered by courier firm or hospital transport. Despite the undoubted dedication of
these staff, after eighteen months less than half of the families volunteered have
been successfully transformed, highlighting the difficulties of delegation.
6 2
2.1.10. Validation.
The aims of validation of the Repository are to ensure the integrity of all families
(i.e., exclude non-paternity) and to confirm that there are no sample mix-ups during
the process of EBV-transformation. Lymphoblastoid cell lines are serologically
typed for HLA class I and II loci in a microcytotoxicity assay by the Oxford
Transplant Centre at the Churchill Hospital, Oxford. HLA haplotypes are then
determined (S.C.B) to confirm the relationship between parents and offspring.
Using standard techniques, DNA is extracted from blood cell pellets and HLA-DR
typing is performed using an allele-specific PCR assay for HLA-DR3 and -DR4
(S.C.B)(Patel, Lo et al. 1993). Comparison of the HLA-DR typing of EBV and
blood from the same individual is used to confirm identity of samples.
2.1.11. Progress: February 1989 - March 1993.
Of the 451 family names passed to me for inclusion in the B.D.A. - Warren
Repository, I have been unable to contact 95 (0.21) due to incorrect addresses
and/or no available telephone number. Of the remainder, 4 have refused to take part
and 110 (0.24) did not fit the inclusion criteria. In all but eight cases, exclusions
were made without visiting the family home. The commonest reasons for exclusion
were as follows; unavailable family members (usually deceased parents);
parenusibling affected family members only or identical twins; age-at-onset; race;
misdiagnosis. It is of note that families were more likely to be excluded if they were
volunteered by computer; two large diabetic departments with 'computerised
diabetic clinics' volunteered a total of 45 pedigrees of which only 5 were suitable.
6 3
The need for samples to be processed within 48 hours imposes a limitation to the
number of families that can be collected in a given period. In addition, in 64% of
the families collected the diabetics and parents lived in separate homes (reflecting
the large input of families from adult diabetic clinics). As a result, in only 48% of
families have the diabetics and parents been collected during the same weekend
period and 22% of families have required three or more visits.
Samples have been collected from members of 187 multiplex pedigrees. A further
70 suitable families have volunteered to take part in the study and are awaiting
collection. With the exception of 15 families from the BOX study and one pedigree
from King's College Hospital, London, all venesection has been performed by
S.C.B and B.R.B. This has entailed more than 18,000 miles travelling within the
British Isles. A total of 895 individuals have been bled in various locations
including gardens, public houses, newsagents and a nightclub in Shrewsbury.
Immortalised cell lines are available from both parents and at least two diabetics in
160 families. This is the largest collection of it's kind in the world.
2.1.12. Cell line distribution
Immortalised cell lines from the first 45 B.D.A. - Warren families were made
available to the scientific community in June 1991 at the International Diabetes
Federation Meeting in Washington DC. In May 1992, a catalogue of 100 families
was released. To date, two laboratories in North America have purchased 'DNA
and cell lines and three others are in the process of placing orders. HLA and insulin
data amassed for this thesis has been made freely available to researchers using this
resource, in the hope that a large collaborative data base will be generated. The
6 4
families are also included in Professor G. Thomson's HLA data base (University of
California, U.S.A.).
2.1.13. Follow-up of families.
Clearly, this group of families is a unique resource with the potential to generate
much useful information. To facilitate future studies, we (S.C.B, B.R.B) have tried
to avert a major source of patient dissatisfaction with medical studies, namely lack
of feedback. All participating families (and many of those who were excluded) are
sent copies of articles about the repository and relevant B.D.A. press releases. The
B.D.A. (M.M., B.R.B) also send Christmas cards to the families each year. This
has already yielded returns, with families informing us of newly diagnosed cases.
2.2. Collection of sporadic type 1 diabetics and controls.
The importance of genes discovered in multiplex families will need to be confirmed
and assessed in sporadic cases using population association studies. In June 1990,
I initiated the collection of a large number of 'sporadic' type 1 diabetics. These are
selected using the same criteria as the proband or youngest diabetic of the multiplex
pedigrees i.e. acute onset of symptoms with weight loss, an immediate requirement
for insulin and age less than 17 years at diagnosis. Once again, all patients are
white Caucasoid with grandparents born within the British Isles. The sporadic
diabetics, however, have no affected siblings at the time of bleeding. Patients are
being recruited from adult and paediatric clinics in Birmingham and Oxford. In
addition, samples have been collected from almost all the diabetics in the O.R.P.S.
6 5
To provide a geographically matched group of controls, I approached the Blood
Transfusion Centre in Birmingham and Dr T.J. Aitman contacted the Plasma Donor
Centre in the John Radcliffe Hospital. Samples have subsequently been collected
from these two centres and EBV lines are being transformed. The controls are all
aged more than 25 years at the time of bleeding, they are white Caucasoids with
grandparents born within the British Isles and they have no siblings with type 1
diabetes. Questionnaires concerning family history of type 1 and type 2 diabetes
and other autoimmune diseases are being completed by both the sporadic diabetics
and controls.
2.2.1. Progress: June 1990 - March 1993.
Samples have been collected from over 400 sporadic diabetics and 500 control
subjects. PBLs have been harvested from almost all of these subjects and I have
prepared DNA from 360 diabetics and 340 controls.
2.3. Summary and conclusions.
This chapter describes the successful establishment of a resource which will
facilitate the genetic analysis of type 1 diabetes. In contrast to previous collections
of diabetic multiplex families, the Repository is larger, ethnically homogeneous
and able to furnish laboratories throughout the world with DNA. The potential for
many groups to work on one data set is already being realised and should facilitate a
more rapid accumulation of knowledge. The following chapters describe my own
analyses of data generated from this group of pedigrees.
6 6

CHAPTER 3
ANALYSIS OF CORE DATA
6 7
3.1. Introduction.
Samples have been collected from members of 187 multiplex pedigrees. Of these,
basic data on family size, family history of diabetes, and personal and family
history of other autoimmune disease is available on 183 families.
3.2. Family size.
In 65 families, the two diabetics are the only offspring. Sixty two families have 3
children (9 with 3 diabetics) and 34 families have four. Twenty families have five
or more offspring. The mean number of children is 3.2 (SD1.4). 166 families have
two affected offspring ('duplex families'; 0.91), seventeen have three ('triplex';
0.09) and none have four; indeed, I have not received details of any pedigrees in the
United Kingdom with four diabetic children.
3.3. Non-paternity.
HLA and microsatellite analysis of EBV-transformed DNA of three individuals
from three separate families have suggested non-paternity. On typing the blood-
derived D.N.A., it emerged that two of these samples had been mixed up after
EBV-transformation. Further cell pellets grown up from the original transformed
cell lines have identical types to the blood DNA, confirming paternity in these
cases. In the third case, typing of the blood DNA is also incompatible with family
integrity. This individuai is an unaffected family member and has not been included
in any analyses; the sample has been excluded from the Repository.
6 8
The low rate of non-paternity contrasts with other studies where rates in excess of
10% have been reported. There are a number of reasons that may explain this
difference. First, in the various explanations of the project before a visit is
arranged, the families are made fully aware that 'inheritance' is being studied.
Further follow-up is generally made through the parents who then have the
opportunity to avoid participation without arousing suspicion within the family.
Second, the incidence of diabetes is such, that a mother would have to be extremely
unfortunate to have two offspring from different fathers who both go on to become
type 1 diabetics.
3.4. Family history of diabetes.
The number of diabetic offspring, parents and families with a history of diabetes
and other autoimmune diseases is shown in table 3.1.
3.4.1. Type 1 diabetes.
In seventeen multiplex families (0.09), one parent is also an insulin-dependent
diabetic; this is the father in 14 cases (0.82). In 9/17 cases (0.53), the parent was
affected prior to conception of both of the diabetic children (all fathers). The mean
age-at-onset of the parents is significantly higher than that of their offspring; 25.1
(SD11.4) years versus 10.3 (8.5) yrs, p<0.0001). In only one pedigree is there a
diabetic parent (father) and three affected offspring; there are no cases where both
parents are diabetic. Including three generations (grandparents, parents, parental
siblings, cousins), 46 pedigrees (0.25) reported a family history of insulin-
dependent diabetes.
6 9
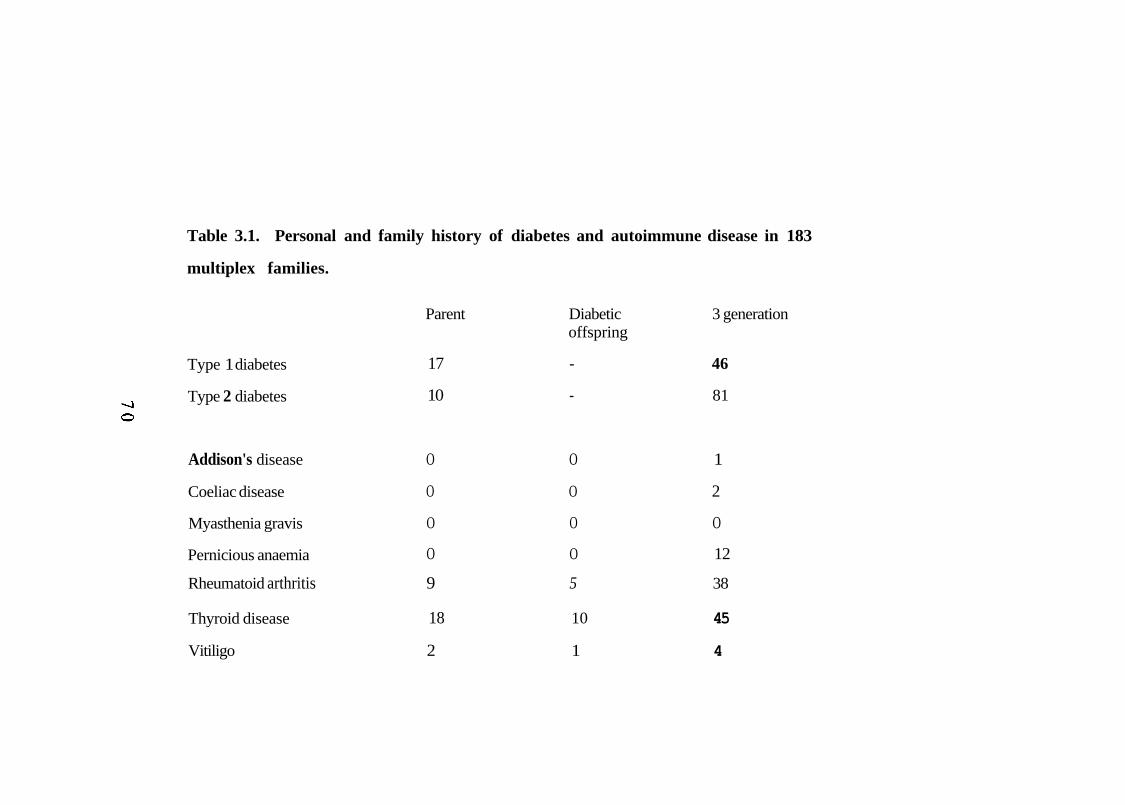
Table 3.1. Personal and family history of diabetes and autoimmune disease in 183
multiplex families.
Parent Diabetic 3 generation offspring
Type 1 diabetes 17 - 46
Type 2 diabetes 10 - 81
Addison's disease O O 1
Coeliac disease O O 2
Myasthenia gravis O O O
Pernicious anaemia O O 12
Thyroid disease 18 10 45
Vitiligo 2 1 4
Rheumatoid arthritis 9 5 38
Familial clustering of type 1 diabetes is well documented in the literature. Wagener
et al. analysed the family histories of 1280 type 1 diabetics from Pittsburgh and
reported 57 families with at least one insulin-dependent parent (0.05) (Wagener,
Sacks et al. 1982). Chern et al,, documented a similar finding (0.07) in Minnesota,
whilst in the Swedish Childhood study of 3503 cases, the proportion of probands
with a diabetic parent was identical to this data set (0.09)(Chern, Anderson et al.
1982)(Dahlquist, Blom et al. 1989). In that study, there was also a preponderance
of diabetic fathers (0.73) and, of the 339 families responding to a questionnaire,
41% had a three generation history of insulin-treated diabetes. Allen et al. studied
the families of 194 diabetic probands resident in Wisconsin(Allen, Palta et al.
1991); parental IDDM occurred in 6.4% of families, half of which were fathers.
29% had a second or third-degree relative with IDDM.
3.4.2. Type 2 diabetes.
In ten families (0.05), one parent is known to have type 2 diabetes ( 5 fathers: 5
mothers). A three generation family history of type 2 diabetes, however, was
documented in 81 pedigrees (0.44). The familial clustering of type 1 and type 2
diabetes has also been described. Gottlieb noted an increased risk of insulin-
dependent diabetes among the offspring of NIDDM parents(Gottlieb 1980). In the
Pittsburgh study(Wagener, Sacks et al. 1982), 55 families had at least one type 2
parent (0.05) and in the study of Chern at al., the risk to siblings of type 1 diabetics
was highest when a parent had type 2 diabetes (rather than type 1 disease)(Chern,
Anderson et al. 1982). In 1987, however, Tillil and Kobberling found no increase
in type 2 diabetes in parents of 554 type I probands(Tillil and Kobberlìng 1987) and
in the Swedish Childhood study, non-insulin-dependent diabetes was present in
only 1.7% of parents, although 31.8% of families reported a three generation
7 1
history of type 2 disease(Dahlquist, Blom et al. 1989). In the study of Allen et al.,
4.3% of 194 newly diagnosed cases had a parent with type 2 diabetes and 34% had
a second or third-degree relative with type 2 diabetes(Allen, Palta et al. 1991).
The differences between these studies are difficult to interpret for the following
reasons.
1) Type 2 diabetes is often undiagnosed. Hence, designation of 'unaffected status'
is unsatisfactory unless an oral glucose tolerance test has been performed and will
lead to underestimates of prevalence. In multiplex pedigrees, however, the
diagnosis may be more frequently made due to increased concern about diabetes.
There is some support for this contention from the Pittsburgh study where 5/7
parental cases of type 2 were diagnosed following the onset of type 1 diabetes in
their second sibling(Wagener, Sacks et al. 1982).
2) Insulin is frequently used in the treatment of type 2 diabetes and this can lead to
misclassification of disease. The Swedish Childhood study, for example, reported
figures for 'insulin-treated diabetes', rather than type 1 diabetes.
3) Type 2 diabetes is a condition diagnosed in middle and later years. Hence,
studies in which parental status is assessed at the time of diagnosis of the type 1
offspring (e.g., the Swedish Childhood study and that of Allen et al.) would be
expected to find lower rates of type 2 disease than this study.
3.5. Personal and family history of autoimmune disease.
Only 16 of the 385 diabetics (0.04) from these multiplex pedigrees are known to
have another autoimmune condition (table 3.1). In 10 cases this is thyroid disease
(0.03), 5 have seropositive rheumatoid arthritis (all female) and there is one case of
7 2
vitiligo. There are no known cases of Addison's disease, coeliac disease,
pernicious anaemia or myasthenia gravis.
3.5.1. Autoantibodies.
To date, 365 plasma samples from 98 different families have been tested for thyroid
thyroglobulin and microsomal antibodies and human adrenal antibodies. This total
includes 162 parents (80 fathers; 82 mothers), 158 diabetic offspring and 43
unaffected offspring (at the time of venesection). Results are shown in table 3.2.
Eight fathers and 9 mothers were positive for both thyroid antibodies, in contrast to
only three diabetics (all at low titres).
3.5.2. Addison's disease.
Addison's disease (primary hypoadrenalism) is rare in type 1 diabetes and there
were no cases in these multiplex families. Adrenal antibodies are also uncommon,
present in less than 1% in the diabetics. This finding is consistent with previous
studies of Caucasoid type 1 patients which have found antibodies in 1.5-2.0% of
cases(Riley, Maclaren et al. 1980)(Bright, Blizzard et al. 1982).
3.5.3. Coeliac disease
An association between coeliac disease and type 1 diabetes has been confirmed in a
number of populations(Savilanhti, Simell et al. 1986) (Cacciarì, Salardi et al.
1987) (Ul-Hague Chowdhury, Sher et al. 1992). The reported prevalence of coeliac
disease in type 1 diabetics varies from approximately 1.7/1000 in the UK to 3.5%
in Finland. Either condition may present first although symptoms of coeliac disease
7 3
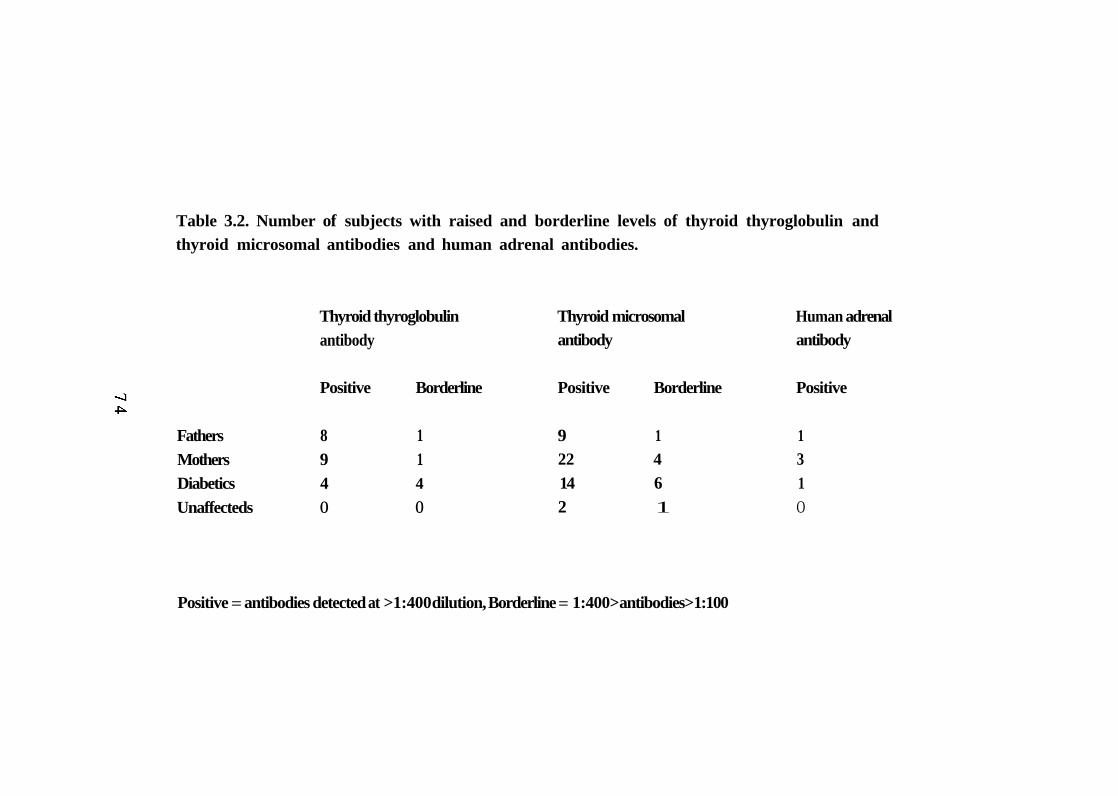
Table 3.2. Number of subjects with raised and borderline levels of thyroid thyroglobulin and thyroid microsomal antibodies and human adrenal antibodies.
Thyroid thyroglobulin Thyroid microsomal Human adrenal antibody antibody antibody
Positive Borderline Positive Borderline Positive
Fathers 8 1 9 1 1 Mothers 9 1 22 4 3 Diabetics 4 4 14 6 1 Unaffecteds O O 2 1 O
Positive = antibodies detected at >1:400 dilution, Borderline = 1:400> antibodies> 1:100
are sometimes absent in patients who already have type 1 diabetes(Maki, Hallstrom
et al. 1984). The finding of no known affecteds in these multiplex pedigrees,
despite the frequency of high-risk HLA-DQA1*0501 /DQB1*0201(found in HLA-
DR3/4 heterozygotes) suggests that; coeliac disease is often undiagnosed in these
subjects; it is relatively asymptomatic; or a combination of both.
3.5.4. Rheumatoid arthritis.
The association between rheumatoid arthritis and type 1 diabetes is not well
described. In one study from London, 39 of 295 patients (0.13) with classical or
definite rheumatoid arthritis had a first or second degree relative with type 1
diabetes(Thomas, Young et al. 1983). In this data set, five multiplex diabetics have
seropositive disease (all female) and in 38/183 (0.21) pedigrees, there is a three
generation family history of rheumatoid arthritis. This is a similar figure to that
reported for 'rheumatic' diseases (25%) in families of sporadic type 1 diabetics in
Sweden(Dahlquist, Blom et al. 1989).
3.5.5. Thyroid disease.
Ten diabetic offspring (8 female; 2 male) have received treatment for hyper- or
hypothyroidism and 45/182 (O. 25) families volunteered a three generation history
of thyroid disease. Fourteen diabetics (7 males; 7 females) are positive (>1:400) for
thyroid microsomal antibodies (TMA), but only three have significant titres of both
thyroglobulin and TMA; none of these patients are receiving treatment.
The reported incidence of thyroid antibodies in type 1 diabetic patients varies
considerably. Riley et al. examined 643 white Americans who had developed type 1
7 5
diabetes before the age of 30 years and found TMA in 131(0.20) (Riley, Maclaren et
al. 1981). They were then able to follow 117 of these patients for a mean of 20.6
months; 50(0.43) were found be have a clinical thyroid disorder (8 hyper- and 42
hypothyroidism). This led to the authors to suggest that all type 1 diabetics should
be screened for TMA and that those with positive results should have yearly checks
of thyroid function. In 1982, Bright el. al reported even higher levels of thyroid
antibodies; 53/164 (0.32) white type 1 diabetics in Virginia were positive for
thyroglobulin antibodies and/or TMA(Bright, Blizzard et al. 1982). In contrast, a
study from Newcastle-upon-Tyne, UK found thyroid antibodies in 17 of 134
(0.13) type 1 diabetics diagnosed before the age of 20 years. 25 of their patients
(0.19) had a positive family history and only four (0.03) had abnormal thyroid
function(Court and Parkin 1982). These results are extremely similar to those from
this multiplex data set and suggest that there is considerable ethnic and/or
geographical variation in the incidence of thyroid disease in type 1 diabetes.
3.6. Summary and conclusions.
Clearly, there are limitations to the interpretation of disease recall data; for example,
the family recall of diagnoses such as rheumatoid arthritis and thyroid disease is
likely to include a number of non-autoimmune conditions; vitiligo may be concealed
from relatives; the prevalence of pernicious anaemia and type 2 diabetes will depend
upon the parental age; these families are particularly aware of diabetes and are likely
to have searched for other family cases of type 1 and type 2 disease. There are also
biases inherent in the method of data collection. To gain a disease history, I have
questioned at least four members of each family; compare this with data gathered
from proband studies, where only one individual completes a questionnaire. Given
these provisos, there are two important findings;
7 6
1) There appears to be no significant increase in the prevalence of diabetes or
autoimmune disease in the families of multiplex diabetics compared with sporadic
diabetics.
Since over 90% of newly diagnosed type 1 diabetics are sporadic, with no first
degree family history of disease, it is important to establish whether there are
differences between diabetics from multiplex pedigrees and the diabetic population
as a whole. For example, it is possible that multiplex diabetics represent a
particularly 'autoimmune' form of type 1 disease and such heterogeneity would
potentially limit the value of multiplex families in genetic and therapeutic studies. In
the above data, there is no evidence of a difference in the prevalence of type 1 or
type 2 diabetes in this multiplex group compared with large epidemiological studies
of (mainly) sporadic cases. Further, the prevalence of other autoimmune conditions
in these diabetics and their families is no greater than has been reported for sporadic
cases.
2) The use of autoantibodies may not be a practical means of sub-grouping type 1
diabetic pedigrees (or sporadic cases).
One way of approaching the genetic analysis of complex diseases is to concentrate
on sub-groups of affected individuals with additional, well-defined characteristics
(subphenotypes). These are less likely to show genetic heterogeneity and may have
a recognisable mode of inheritance, for example, the MODY sub-group of type 2
diabetes. Reports that 20-30% of Caucasoid type 1 diabetics have TMA suggested
that autoantibody estimation is a useful way of sub-grouping multiplex families for
linkage studies(Riley, Maclaren et al. 1981)(Bright, Blizzard et al. 1982). The
above results do not support this contention; the prevalence of adrenal antibodies
was extremely low (<1%) and only 15/158 diabetics were positive for one thyroid
autoantibody (0.10). This latter finding is much lower than data published from the
7 7
United States but is consistent with reports from the UK (0.13, 0.10) and from
preliminary analysis of 111 sporadic diabetics collected for this study (0.14).
Subgroups of this size (n~20) severely limit the power of linkage analysis and are
consequently of little value. The limitations of thyroid autoantibodies in sub-group
determination are further highlighted by the finding that less than 40% of cases who
had received or are receiving therapy for thyroid disease had positive titres of TMA
(presumably reflecting 'burn-out' of the autoimmune process).
7 8

CHAPTER 4
HLA DATA
7 9
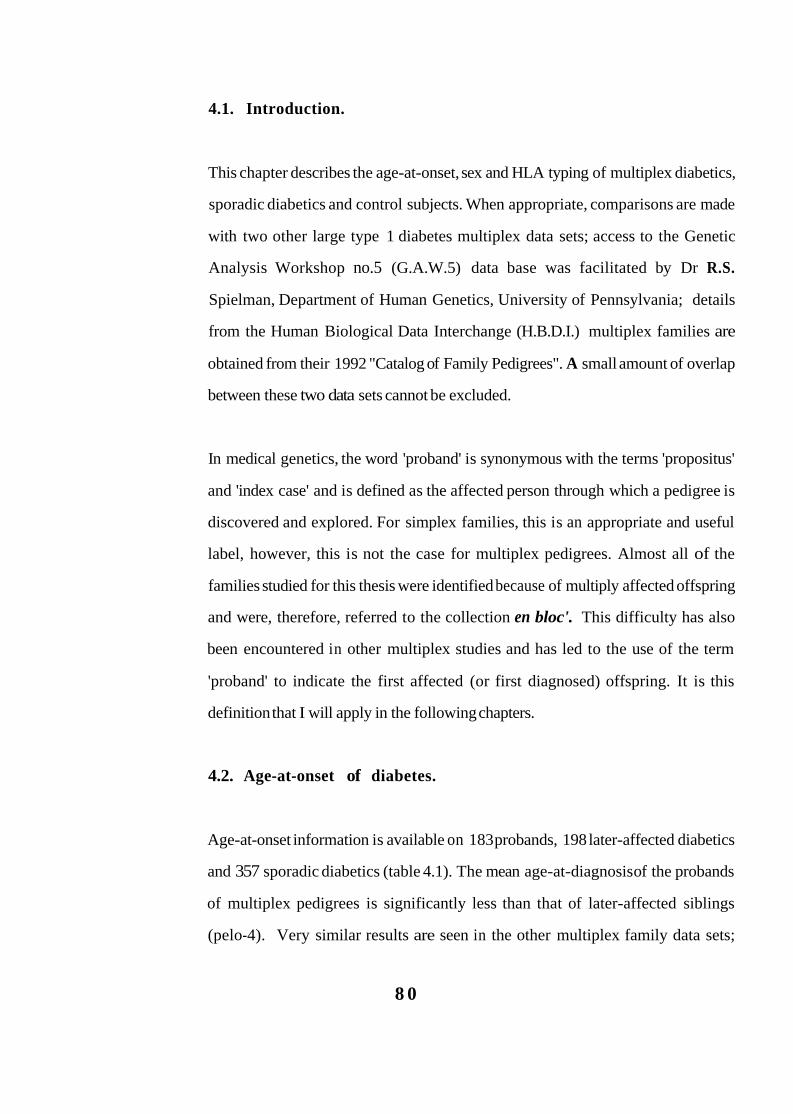
4.1. Introduction.
This chapter describes the age-at-onset, sex and HLA typing of multiplex diabetics,
sporadic diabetics and control subjects. When appropriate, comparisons are made
with two other large type 1 diabetes multiplex data sets; access to the Genetic
Analysis Workshop no.5 (G.A.W.5) data base was facilitated by Dr R.S.
Spielman, Department of Human Genetics, University of Pennsylvania; details
from the Human Biological Data Interchange (H.B.D.I.) multiplex families are
obtained from their 1992 "Catalog of Family Pedigrees". A small amount of overlap
between these two data sets cannot be excluded.
In medical genetics, the word 'proband' is synonymous with the terms 'propositus'
and 'index case' and is defined as the affected person through which a pedigree is
discovered and explored. For simplex families, this is an appropriate and useful
label, however, this is not the case for multiplex pedigrees. Almost all of the
families studied for this thesis were identified because of multiply affected offspring
and were, therefore, referred to the collection en bloc'. This difficulty has also
been encountered in other multiplex studies and has led to the use of the term
'proband' to indicate the first affected (or first diagnosed) offspring. It is this
definition that I will apply in the following chapters.
4.2. Age-at-onset of diabetes.
Age-at-onset information is available on 183 probands, 198 later-affected diabetics
and 357 sporadic diabetics (table 4.1). The mean age-at-diagnosis of the probands
of multiplex pedigrees is significantly less than that of later-affected siblings
(pelo-4). Very similar results are seen in the other multiplex family data sets;
8 0
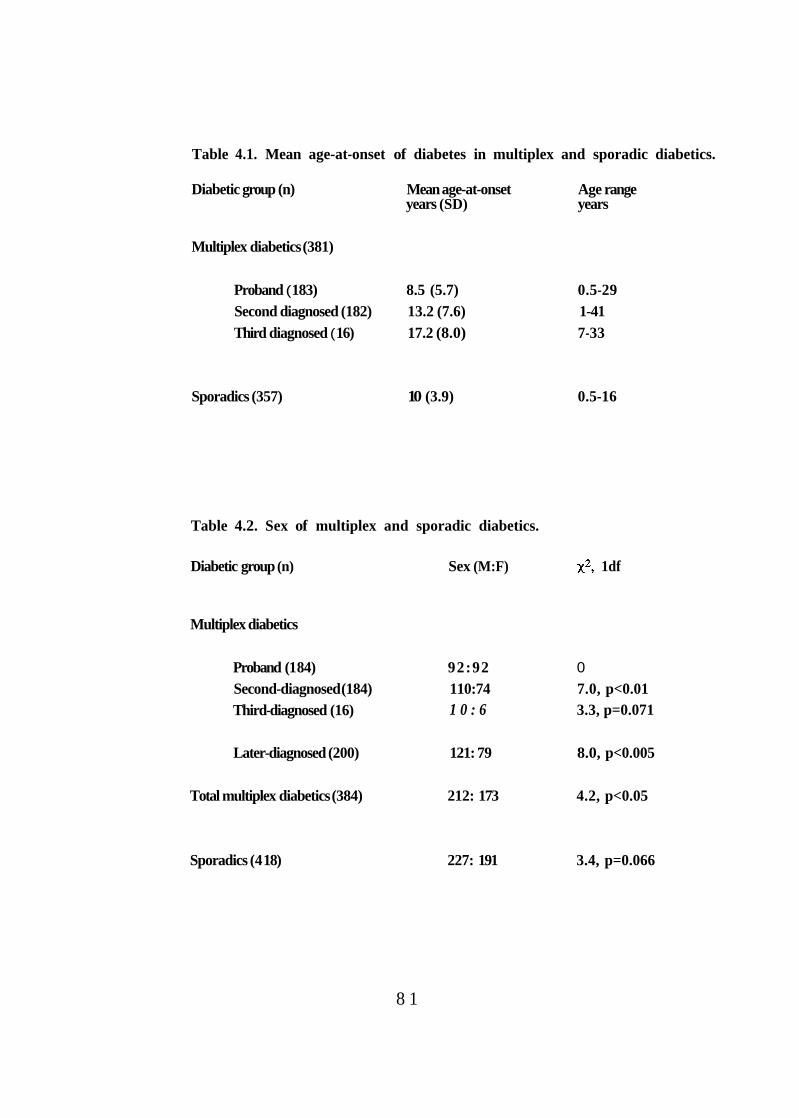
Table 4.1. Mean age-at-onset of diabetes in multiplex and sporadic diabetics.
Diabetic group (n) Mean age-at-onset Age range years (SD) years
Multiplex diabetics (381)
Proband ( 183) 8.5 (5.7) 0.5-29 Second diagnosed (182) 13.2 (7.6) 1-41 Third diagnosed ( 16) 17.2 (8.0) 7-33
Sporadics (357) 10 (3.9) 0.5-16
Table 4.2. Sex of multiplex and sporadic diabetics.
Diabetic group (n) Sex (M:F) 1df
Multiplex diabetics
Proband (1 84) 92:92 0 Second-diagnosed (184) 110:74 7.0, p<0.01 Third-diagnosed (16) 1 0 : 6 3.3, p=0.071
Later-diagnosed (200) 121: 79 8.0, p<0.005
Total multiplex diabetics (384) 212: 173 4.2, p<0.05
Sporadics (4 18) 227: 191 3.4, p=0.066
8 1
G.A.W.5 (94 unrelated families) probands mean age-at-onset 9.4 (6.6) years
versus later-affecteds 12.7 (7.6) years, p<0.002; H.B.D.I. (99 unrelated families)
proband mean age-at-onset 8.1 (4.9) years versus later-affecteds 13.4 (8.6) years,
p<0.0001.
The multiplex probands in this data set are also significantly younger at disease-
onset than the sporadic diabetics (p<0.002); this is despite the 16 years upper age
limitation on sporadic diabetics which would tend to reduce the mean age of the
sporadic group. Also, some of the sporadic diabetics may become 'multiplex' if one
or more of their siblings become diabetic. A similar finding has been reported from
Scandinavia (multiplex probands mean age-at-onset 7.8 (5.1) years versus
sporadics 12.9 (6.4) years, p<0.001)(Pociot, Johannesen et al. 1993). It has been
suggested that this result indicates a stronger role for environmental triggers and/or
additional genetic factors in familial cases (i.e., heterogeneity between multiplex
and sporadic disease).
4.3. Sex of diabetics.
Once again, there is a difference between probands and later-diagnosed diabetics in
the multiplex data set (table 4.2). Probands have an equal ratio between males and
females whilst in the later-diagnosed diabetics, there are significantly more males
than expected (p<0.005). Comparison of the sex ratios in the two groups confirms
that this difference is significant at the 5% level (92:92 vs 120:80, 3.9, 1df,
p<0.05). Overall, in the multiplex diabetic cases, there is a slight preponderance of
males (0.55) and this is also seen in the sporadic diabetic group (males 0.54). There
is no evidence of heterogeneity between the multiplex and sporadic diabetics with
regard to sex 0.07, 1df, p=0.8).
8 2
The difference in the sex ratio in probands and later-affected diabetics in these
multiplex families is not replicated in the other data sets. In G.A.W.5, there is a
significant excess of males in both the probands (57:36, p<0.05) and later-affecteds
(67:45, p<0.05). In the H.B.D.I. families, there are more male probands than
female probands (59:40, p=0.06) but an equal sex ratio in the later-affecteds
(61:63).
Having examined only two variables, age-at-onset and sex, there appears to be
evidence of considerable heterogeneity: between sporadic and multiplex diabetics
(age-at-onset) ; within multiplex families (sex and age-at-onset); and between
multiplex data sets (sex). This is difficult to accept, given that the clinical criteria for
the diagnosis of diabetes were identical for the multiplex and sporadic cases in this
study (and very similar to those used in G.A.W.5 and H.B.D.I.). Similar findings
have, however, been reported in the literature and are generally accepted as
evidence of 'environmental factors', 'genetic effects' or a combination of
both(Johannesen, Pociot et al. 1993)(Pociot, Johannesen et al. 1993). I have re-
examined these data and find that these apparently random and inexplicable
differences can be reconciled by consideration of the term 'proband' and age-at-
onset effects.
By defining the proband of a multiplex family as the first diabetic offspring, there is
an in-built bias towards the proband group being younger at diagnosis. This is due
to the fact that later-affecteds (by definition) have zero risk of disease up to the
diagnosis of the proband. For example, if the first-born child is diagnosed at an
early age (hence, the proband), then siblings have many years to develop disease
(up to the age of 28 years the family would still satisfy B.D.A. age criteria).
Conversely, if the first-born is not diagnosed until his/her twenties, then a younger
8 3
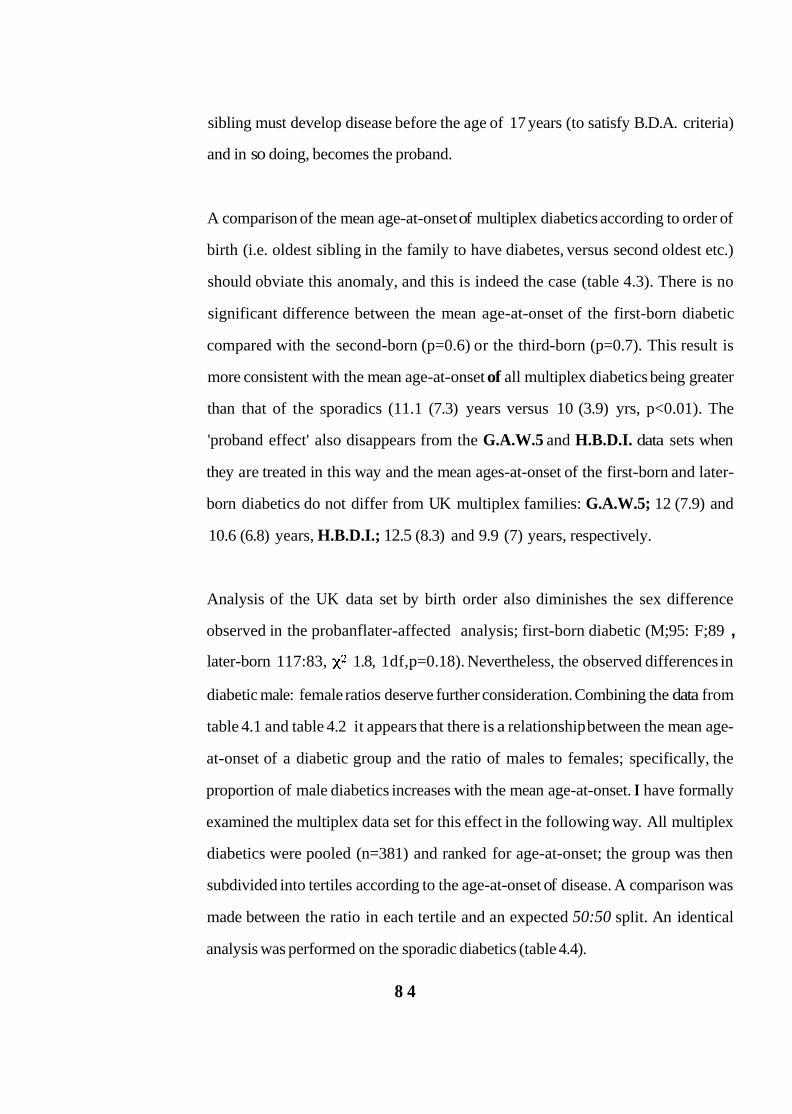
sibling must develop disease before the age of 17 years (to satisfy B.D.A. criteria)
and in so doing, becomes the proband.
A comparison of the mean age-at-onset of multiplex diabetics according to order of
birth (i.e. oldest sibling in the family to have diabetes, versus second oldest etc.)
should obviate this anomaly, and this is indeed the case (table 4.3). There is no
significant difference between the mean age-at-onset of the first-born diabetic
compared with the second-born (p=0.6) or the third-born (p=0.7). This result is
more consistent with the mean age-at-onset of all multiplex diabetics being greater
than that of the sporadics (11.1 (7.3) years versus 10 (3.9) yrs, p<0.01). The
'proband effect' also disappears from the G.A.W.5 and H.B.D.I. data sets when
they are treated in this way and the mean ages-at-onset of the first-born and later-
born diabetics do not differ from UK multiplex families: G.A.W.5; 12 (7.9) and
10.6 (6.8) years, H.B.D.I.; 12.5 (8.3) and 9.9 (7) years, respectively.
Analysis of the UK data set by birth order also diminishes the sex difference
observed in the probanflater-affected analysis; first-born diabetic (M;95: F;89 , later-born 117:83, 1.8, 1df, p=0.18). Nevertheless, the observed differences in
diabetic male: female ratios deserve further consideration. Combining the data from
table 4.1 and table 4.2 it appears that there is a relationship between the mean age-
at-onset of a diabetic group and the ratio of males to females; specifically, the
proportion of male diabetics increases with the mean age-at-onset. I have formally
examined the multiplex data set for this effect in the following way. All multiplex
diabetics were pooled (n=381) and ranked for age-at-onset; the group was then
subdivided into tertiles according to the age-at-onset of disease. A comparison was
made between the ratio in each tertile and an expected 50:50 split. An identical
analysis was performed on the sporadic diabetics (table 4.4).
8 4
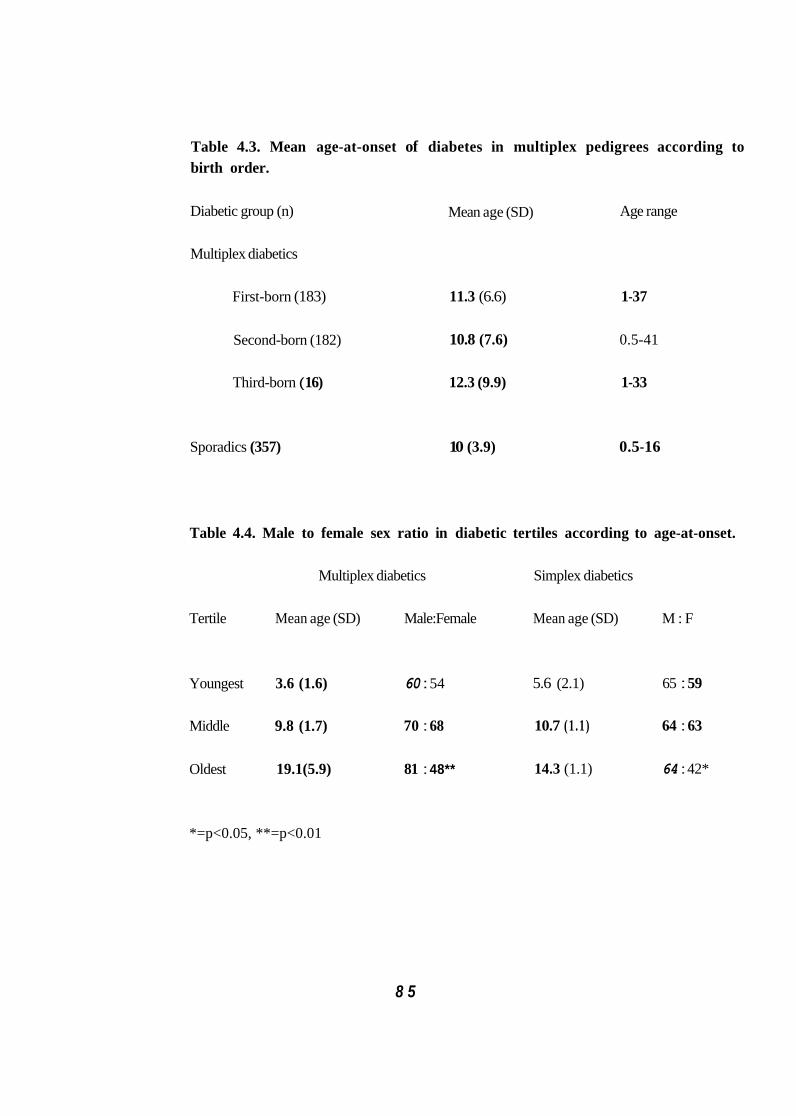
Table 4.3. Mean age-at-onset of diabetes in multiplex pedigrees according to birth order.
Age range Diabetic group (n)
Multiplex diabetics
Mean age (SD)
First-born (183) 11.3 (6.6) 1-37
10.8 (7.6) 0.5-41 Second-born (182)
Third-born ( 16) 12.3 (9.9) 1-33
Sporadics (357) 10 (3.9) 0.5-16
Table 4.4. Male to female sex ratio in diabetic tertiles according to age-at-onset.
Multiplex diabetics Simplex diabetics
Tertile Mean age (SD) Male:Female Mean age (SD) M : F
Youngest 3.6 (1.6) 60 : 54 5.6 (2.1) 65 : 59
Middle 9.8 (1.7) 70 : 68 10.7 (1 .1) 64 : 63
Oldest 19.1(5.9) 81 : 48** 14.3 (1.1) 64 : 42*
*=p<0.05, **=p<0.01
8 5
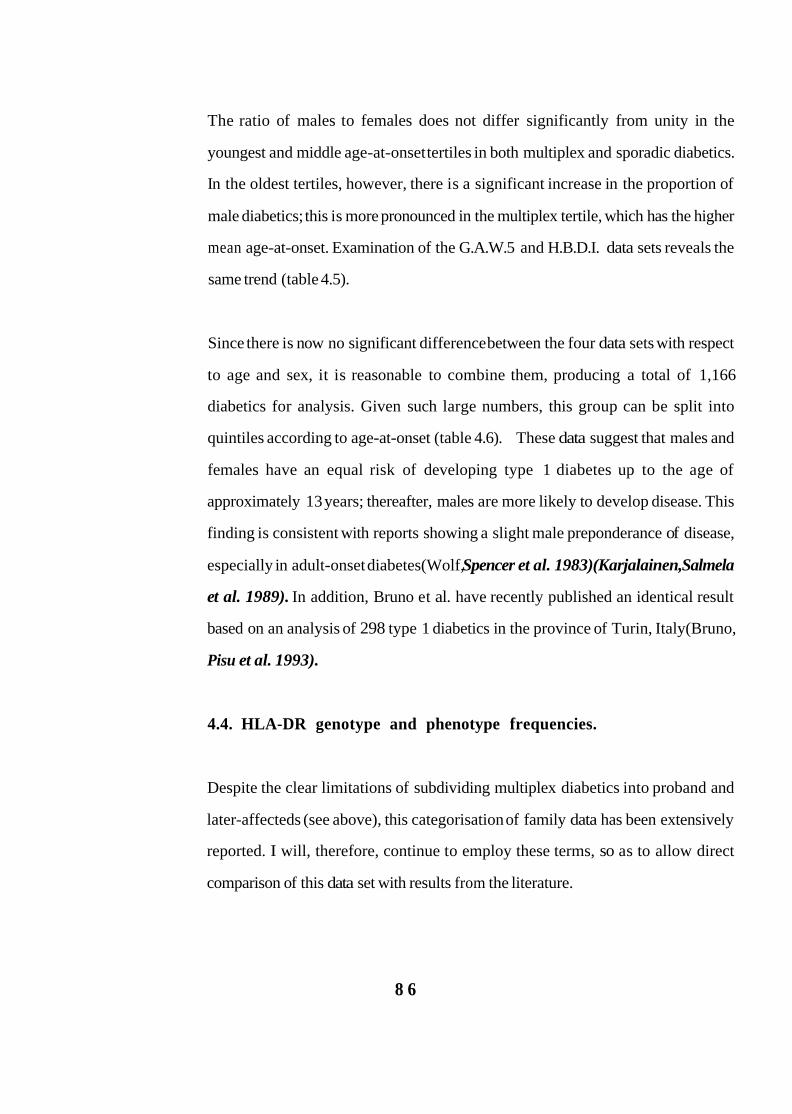
The ratio of males to females does not differ significantly from unity in the
youngest and middle age-at-onset tertiles in both multiplex and sporadic diabetics.
In the oldest tertiles, however, there is a significant increase in the proportion of
male diabetics; this is more pronounced in the multiplex tertile, which has the higher
mean age-at-onset. Examination of the G.A.W.5 and H.B.D.I. data sets reveals the
same trend (table 4.5).
Since there is now no significant difference between the four data sets with respect
to age and sex, it is reasonable to combine them, producing a total of 1,166
diabetics for analysis. Given such large numbers, this group can be split into
quintiles according to age-at-onset (table 4.6). These data suggest that males and
females have an equal risk of developing type 1 diabetes up to the age of
approximately 13 years; thereafter, males are more likely to develop disease. This
finding is consistent with reports showing a slight male preponderance of disease,
especially in adult-onset diabetes(Wolf, Spencer et al. 1983) (Karjalainen, Salmela
et al. 1989). In addition, Bruno et al. have recently published an identical result
based on an analysis of 298 type 1 diabetics in the province of Turin, Italy(Bruno,
Pisu et al. 1993).
4.4. HLA-DR genotype and phenotype frequencies.
Despite the clear limitations of subdividing multiplex diabetics into proband and
later-affecteds (see above), this categorisation of family data has been extensively
reported. I will, therefore, continue to employ these terms, so as to allow direct
comparison of this data set with results from the literature.
8 6
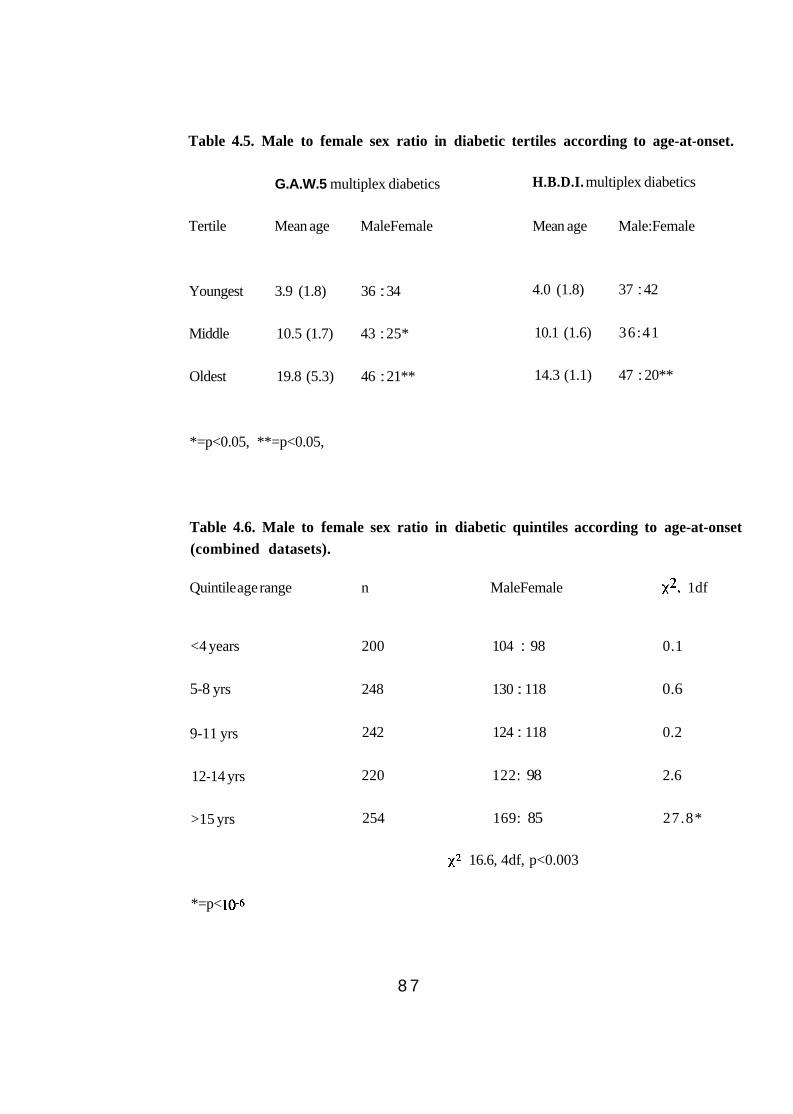
Table 4.5. Male to female sex ratio in diabetic tertiles according to age-at-onset.
G.A.W.5 multiplex diabetics H.B.D.I. multiplex diabetics
Tertile Mean age MaleFemale Mean age Male:Female
Youngest 3.9 (1.8) 36 : 34 4.0 (1.8) 37 : 42
Middle 10.5 (1.7) 43 : 25* 10.1 (1.6) 36:41
Oldest 19.8 (5.3) 46 : 21** 14.3 (1.1) 47 : 20**
*=p<0.05, **=p<0.05,
Table 4.6. Male to female sex ratio in diabetic quintiles according to age-at-onset (combined datasets).
Quintile age range n MaleFemale 1df
<4 years 200 104 : 98 0.1
5-8 yrs 248 130 : 118 0.6
9-11 yrs 242 124 : 118 0.2
12-14 yrs 220 122: 98 2.6
>15 yrs 254 169: 85 27.8*
16.6, 4df, p<0.003
*=p<
8 7
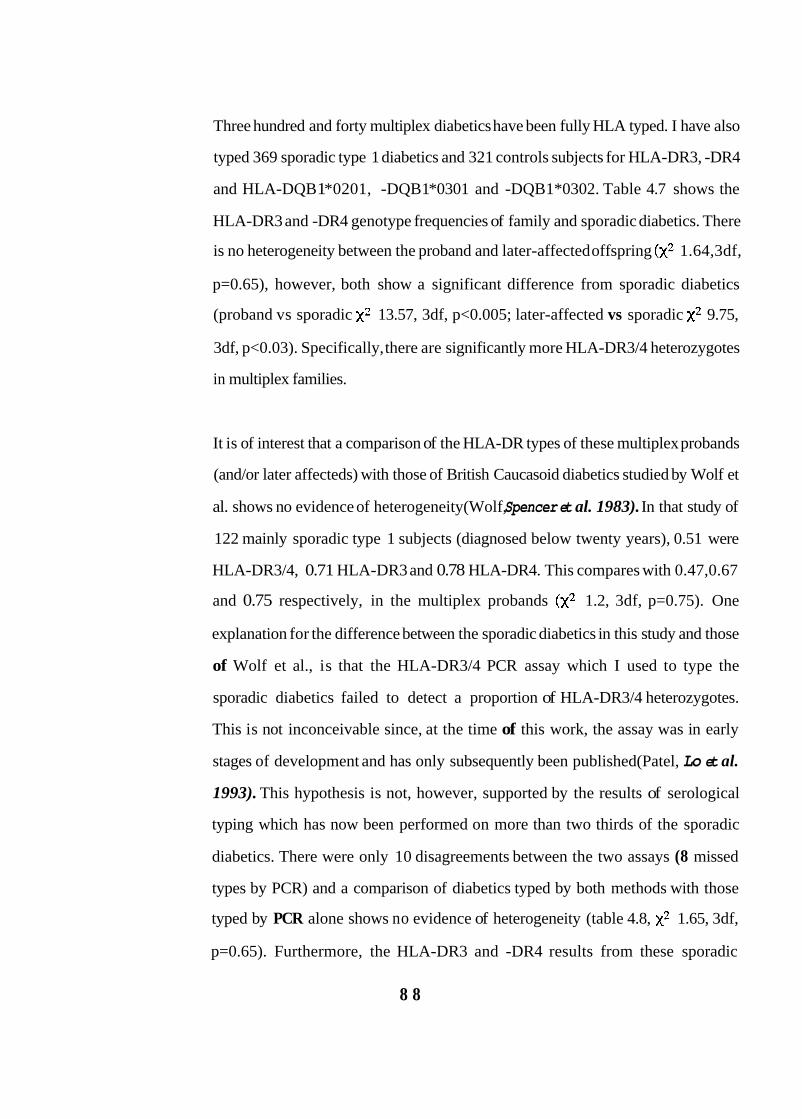
Three hundred and forty multiplex diabetics have been fully HLA typed. I have also
typed 369 sporadic type 1 diabetics and 321 controls subjects for HLA-DR3, -DR4
and HLA-DQB 1 *0201, -DQB 1 *0301 and -DQB 1*0302. Table 4.7 shows the
HLA-DR3 and -DR4 genotype frequencies of family and sporadic diabetics. There
is no heterogeneity between the proband and later-affected offspring 1.64,3df,
p=0.65), however, both show a significant difference from sporadic diabetics
(proband vs sporadic 13.57, 3df, p<0.005; later-affected vs sporadic 9.75,
3df, p<0.03). Specifically, there are significantly more HLA-DR3/4 heterozygotes
in multiplex families.
It is of interest that a comparison of the HLA-DR types of these multiplex probands
(and/or later affecteds) with those of British Caucasoid diabetics studied by Wolf et
al. shows no evidence of heterogeneity(Wolf, Spencer et al. 1983). In that study of
122 mainly sporadic type 1 subjects (diagnosed below twenty years), 0.51 were
HLA-DR3/4, 0.71 HLA-DR3 and 0.78 HLA-DR4. This compares with 0.47,0.67
and 0.75 respectively, in the multiplex probands 1.2, 3df, p=0.75). One
explanation for the difference between the sporadic diabetics in this study and those
of Wolf et al., is that the HLA-DR3/4 PCR assay which I used to type the
sporadic diabetics failed to detect a proportion of HLA-DR3/4 heterozygotes.
This is not inconceivable since, at the time of this work, the assay was in early
stages of development and has only subsequently been published(Patel, Lo et al.
1993). This hypothesis is not, however, supported by the results of serological
typing which has now been performed on more than two thirds of the sporadic
diabetics. There were only 10 disagreements between the two assays (8 missed
types by PCR) and a comparison of diabetics typed by both methods with those
typed by PCR alone shows no evidence of heterogeneity (table 4.8, 1.65, 3df,
p=0.65). Furthermore, the HLA-DR3 and -DR4 results from these sporadic
8 8
Table 4.7. HLA-DR genotype frequencies (proportions) in multiplex and sporadic diabetics.
HLA-DR type
X/X 3/X, 3/3 4/X,4/4 3/4 Totals
Proband 8 (0.05) 33 (0.2) 47 (0.28) 79 (0.47) 167
Later-diagnosed 6 (0.03) 33 (0.19) 59 (0.34) 75 (0.43) 173
Total multiplex diabetics 14 (0.04) 66 (0.19) 106 (0.31) 154 (0.45) 340
sporadic 26 (0.07) 91 (0.25) 138 (0.37) 114 (0.31) 369
Table 4.8. Comparison of HLA-DR3 and -DR4 genotype frequencies (proportions) of sporadic diabetics typed by serology and PCR (n=267) and PCR only (n=102).
HU-DR type
X/X 3/X,3/3 4/X,4/4 3/4 Totals
Serology/PCR 17 (0.06) 67 (0.25) 101 (0.38) 83 (0.31) 267
PCR 9 (0.09) 24 (0.24) 37 (0.36) 31 (0.31) 102
8 9
diabetics are compatible with those from a large study of French Caucasian
diabetics; Caillat-Zucman found the HLA-DR3/4 genotype in 0.38 of patients aged
less than 15 years at diagnosis (n=112) and this fell to 0.24 in those aged 15-30
years at onset of disease(Caillat-Zucman, Garchon et al. 1992).
An alternative explanation is that the Barts-Windsor study group were 'preselected'
and this produced an excess of HLA-DR3/4 heterozygotes(Wolf, Spencer et al.
1983). The mechanism by which this could occur is difficult to explain, although it
is supported by other evidence of selection; a high proportion of diabetic probands
had a first degree relative with disease (19/123 = 0.15 compared with <0.1
expected); and the high number of twin pairs (6 verses an expected number of 1-2).
If one accepts that there is a difference between multiplex and sporadic diabetics,
with regard to HLA (and Dr E.Tuomilehto-Wolf herself, now insists that this is the
case, personal communication), then does this indicate genetic heterogeneity? I
think not, since the ability of parental couples to produce an HLA-DR3/4
heterozygote increases their chances of becoming a multiplex pedigree for at least
two reasons. First, for an HLA-DR3/4 offspring to be conceived, the parents must
carry at least two high risk HLA haplotypes between them; therefore, three of the
four potential inherited HLA combinations will be high risk for diabetes (HLA-
DR3/4, -DR3/X and -DR4/X). Second, the risk of diabetes to HLA-DR3/4
offspring is higher than that of HLA-DR4/4,4/X and HLA-DR3/3,3/X (Section
4.7). Hence, families with an HLA-DR3/4 diabetic child will be more likely to have
multiple diabetic offspring than those in which the diabetic is not HLA-DR3/4.
Given these considerations, one would expect HLA-DR3/4 to be more frequent in
multiplex diabetics than sporadic cases and genetic heterogeneity need not be
evoked as an explanation.
9 0
4.5. HLA-DR type and sex
Analysis of the male to female sex ratio by HLA-DR type shows no significant
heterogeneity in sporadic diabetics, however, there is a significant difference in
multiplex diabetics, mainly due to a high proportion of HLA-DR3/3,3/X male
diabetics (table 4.9).
4.6. HLA-DR type and mean age-at-onset
Table 4.10 shows the mean age-at-onset according to HLA-DR3 and -DR4 typing.
In the multiplex diabetics in this data set, mean age-at-onset of the HLA-DRX/X
group is significantly younger than both the HLA-DR3/3,3/X (p<0.01) and HLA-
DR4/4,4/X diabetics (p<0.05). The mean age-at-onset of HLA-DR3/4 diabetics is
also significantly less than that of the HLA-DR3/3,3/X multiplex group. In
contrast, in the sporadic group, the HLA-DRX/X diabetics are significantly older
than both HLA-DR3/3,3/X (p<0.05) and -DR3/4 diabetics (p<0.05).
Interpretation of these findings is difficult. The number of tests performed means
that results significant at the 5% level should be viewed with caution, especially
when three of the four 'significant results' involve small HLA-DRX/X groups
(n=14 multiplex and 24 sporadic diabetics, respectively). This contention is
supported by examination of the G.A.W.5 multiplex data set (table 4.10). Here, the
mean ages-at-onset for HLA-DR3/4, -DR4/4,4/X and -DR3/3,3/X are almost
identical to those of UK multiplex diabetics and there are no significant differences
between them. In this data set, however, the small number of HLA-DRX/X
diabetics (n=4) have a higher mean age-at-onset of 18.7 (10.4) years although this
difference is not statistically significant.
9 1
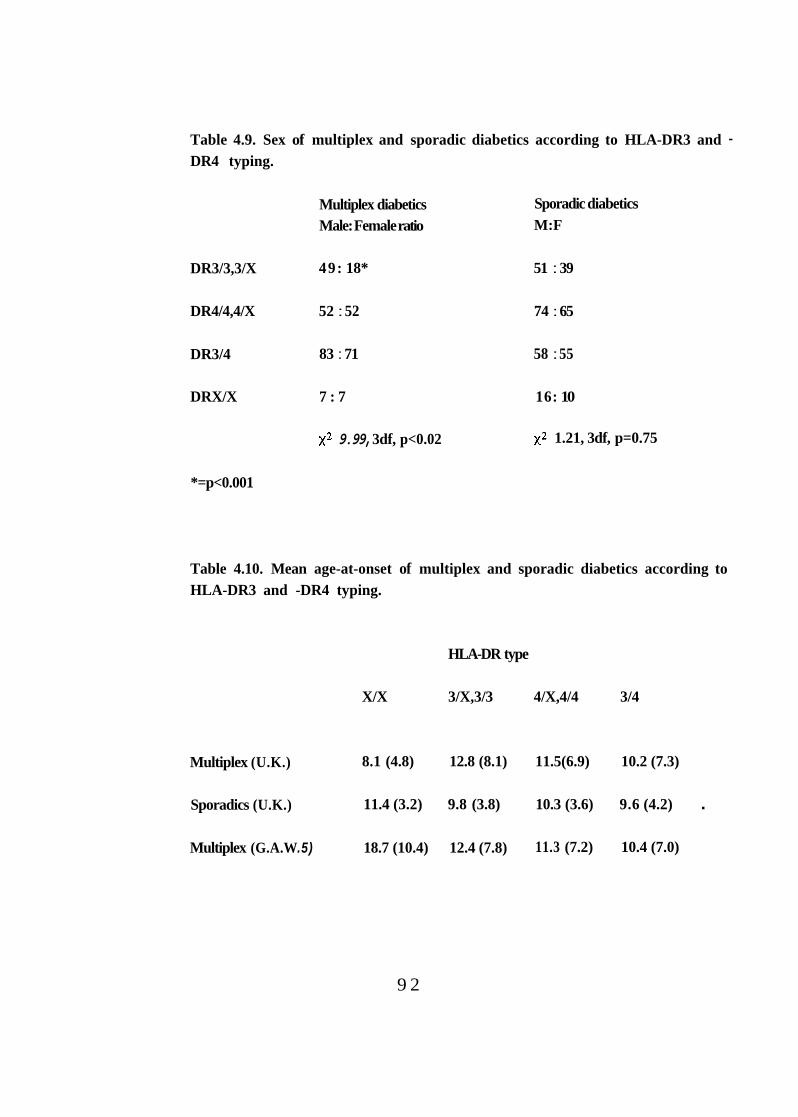
Table 4.9. Sex of multiplex and sporadic diabetics according to HLA-DR3 and - DR4 typing.
Multiplex diabetics Sporadic diabetics Male: Female ratio M:F
DR3/3,3/X 49: 18* 51 : 39
DR4/4,4/X 52 : 52 74 : 65
DR3/4 83 : 71 58 : 55
DRX/X 7 : 7 16: 10
9.99, 3df, p<0.02 1.21, 3df, p=0.75
*=p<0.001
Table 4.10. Mean age-at-onset of multiplex and sporadic diabetics according to HLA-DR3 and -DR4 typing.
HLA-DR type
X/X 3/X,3/3 4/X,4/4 3/4
Multiplex (U.K.) 8.1 (4.8) 12.8 (8.1) 11.5(6.9) 10.2 (7.3)
Sporadics (U.K.) 11.4 (3.2) 9.8 (3.8) 10.3 (3.6) 9.6 (4.2) .
Multiplex (G.A.W .5) 18.7 (10.4) 12.4 (7.8) 11.3 (7.2) 10.4 (7.0)
9 2
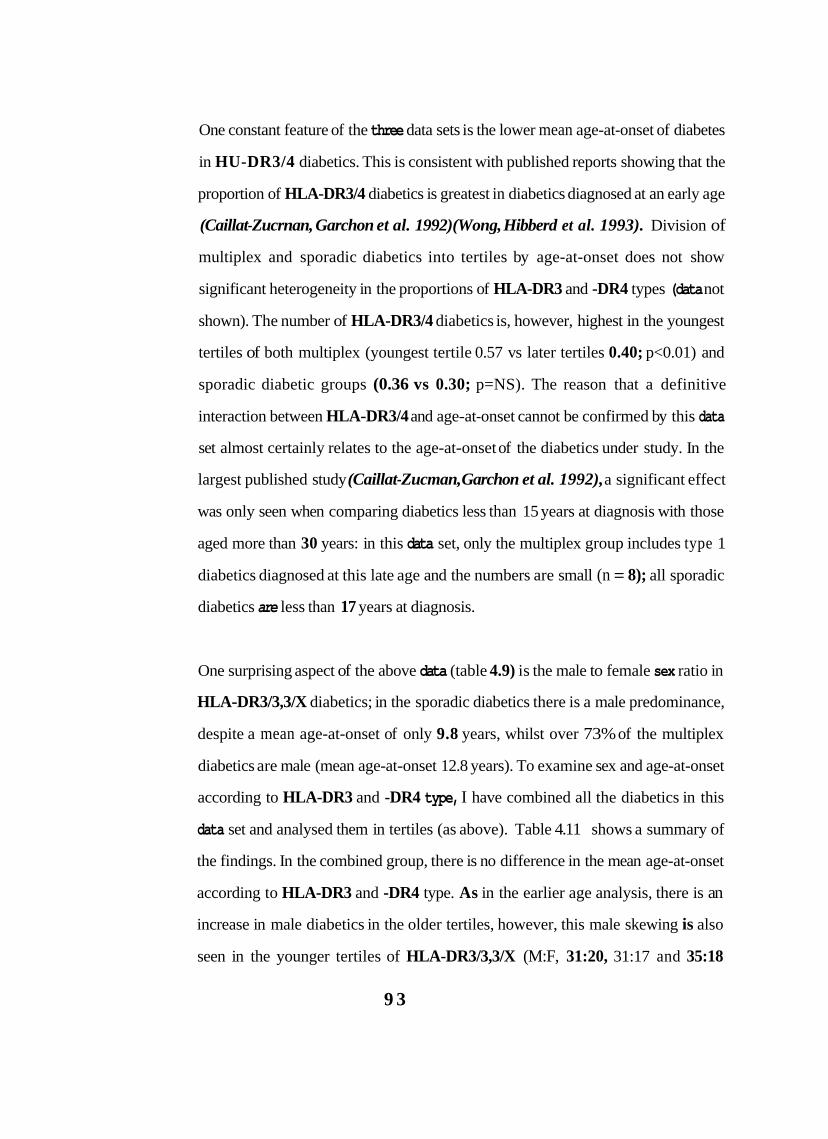
One constant feature of the three data sets is the lower mean age-at-onset of diabetes
in HU-DR3/4 diabetics. This is consistent with published reports showing that the
proportion of HLA-DR3/4 diabetics is greatest in diabetics diagnosed at an early age
(Caillat-Zucrnan, Garchon et al. 1992)(Wong, Hibberd et al. 1993). Division of
multiplex and sporadic diabetics into tertiles by age-at-onset does not show
significant heterogeneity in the proportions of HLA-DR3 and -DR4 types (data not
shown). The number of HLA-DR3/4 diabetics is, however, highest in the youngest
tertiles of both multiplex (youngest tertile 0.57 vs later tertiles 0.40; p<0.01) and
sporadic diabetic groups (0.36 vs 0.30; p=NS). The reason that a definitive
interaction between HLA-DR3/4 and age-at-onset cannot be confirmed by this data
set almost certainly relates to the age-at-onset of the diabetics under study. In the
largest published study (Caillat-Zucman, Garchon et al. 1992), a significant effect
was only seen when comparing diabetics less than 15 years at diagnosis with those
aged more than 30 years: in this data set, only the multiplex group includes type 1
diabetics diagnosed at this late age and the numbers are small (n = 8); all sporadic
diabetics are less than 17 years at diagnosis.
One surprising aspect of the above data (table 4.9) is the male to female sex ratio in
HLA-DR3/3,3/X diabetics; in the sporadic diabetics there is a male predominance,
despite a mean age-at-onset of only 9.8 years, whilst over 73% of the multiplex
diabetics are male (mean age-at-onset 12.8 years). To examine sex and age-at-onset
according to HLA-DR3 and -DR4 type, I have combined all the diabetics in this
data set and analysed them in tertiles (as above). Table 4.11 shows a summary of
the findings. In the combined group, there is no difference in the mean age-at-onset
according to HLA-DR3 and -DR4 type. As in the earlier age analysis, there is an
increase in male diabetics in the older tertiles, however, this male skewing is also
seen in the younger tertiles of HLA-DR3/3,3/X (M:F, 31:20, 31:17 and 35:18
9 3
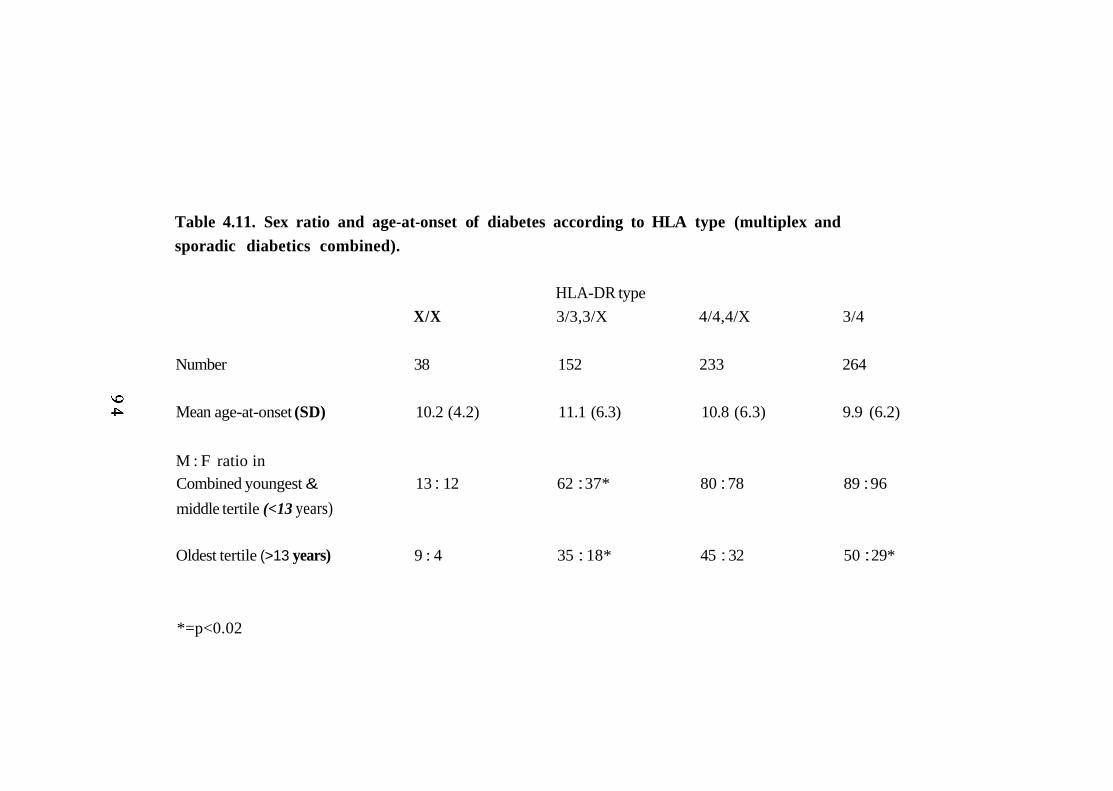
Table 4.11. Sex ratio and age-at-onset of diabetes according to HLA type (multiplex and sporadic diabetics combined).
HLA-DR type X/X 3/3,3/X 4/4,4/X 3/4
Number 38 152 233 264
Mean age-at-onset (SD) 10.2 (4.2) 11.1 (6.3) 10.8 (6.3) 9.9 (6.2)
M : F ratio in Combined youngest & 13 : 12 62 : 37* 80 : 78 89 : 96 middle tertile (<13 years)
Oldest tertile (>13 years) 9 : 4 35 : 18* 45 : 32 50 : 29*
*=p<0.02
respectively). Unfortunately, this effect cannot be confirmed or refuted by analysis
of the other family data sets; HLA-DR data from H.B.D.I. families is not freely
available and only 37 diabetics in G.A.W.5 are HLA-DR3/3,3/X although the same
trend is seen (M : F younger/middle tertiles 12:7, oldest 9:5).
4.7. Disease associations with HLA-DR3 and -DR4.
This data set demonstrates the well-recognised population associations between
HLA-DR3 and HLA-DR4 and type 1 diabetes. Comparison of the HLA-DR3 and -
DR4 genotype frequencies (HLA-DR3/3,3/X, -DR4/4,4/X, -DR3/4 and -X/X) in
diabetics and controls shows highly significant heterogeneity (table 4.12). Relative
risks (RRs) are calculated according to the Method of Woolf(Woolf 1955) and are
shown in table 4.13. For the 'All DR3' relative risk for probands, for example, a
2x2 contingency table is created with one column comprising the totals of diabetic
probands who are HLA-DR3-positive (including -DR3/4) and those who are not
whilst the second column contains equivalent totals from controls. It should be
noted that the RRs are higher in multiplex offspring than in sporadic diabetics,
although the wide 95% confidence intervals indicate that these differences are not
significant.
4.8. HLA-DQB1 associations in HLA-DR4-positive diabetics
HLA-DR4 is in linkage disequilibrium with two HLA-DQB1 alleles, HLA-
DQB1*0301 and -DQB1*0302 (Section 1.3.1.i); 90% of HLA-DR4 diabetics are
reported to be positive for HLA-DQB1*0302 allele(Nepom, Palmer et al. 1986). I
examined the disease association of these HLA-DQB1 alleles in multiplex and
sporadic diabetics using PCR and oligonucleotide dot-blotting(Bain and Todd
9 5
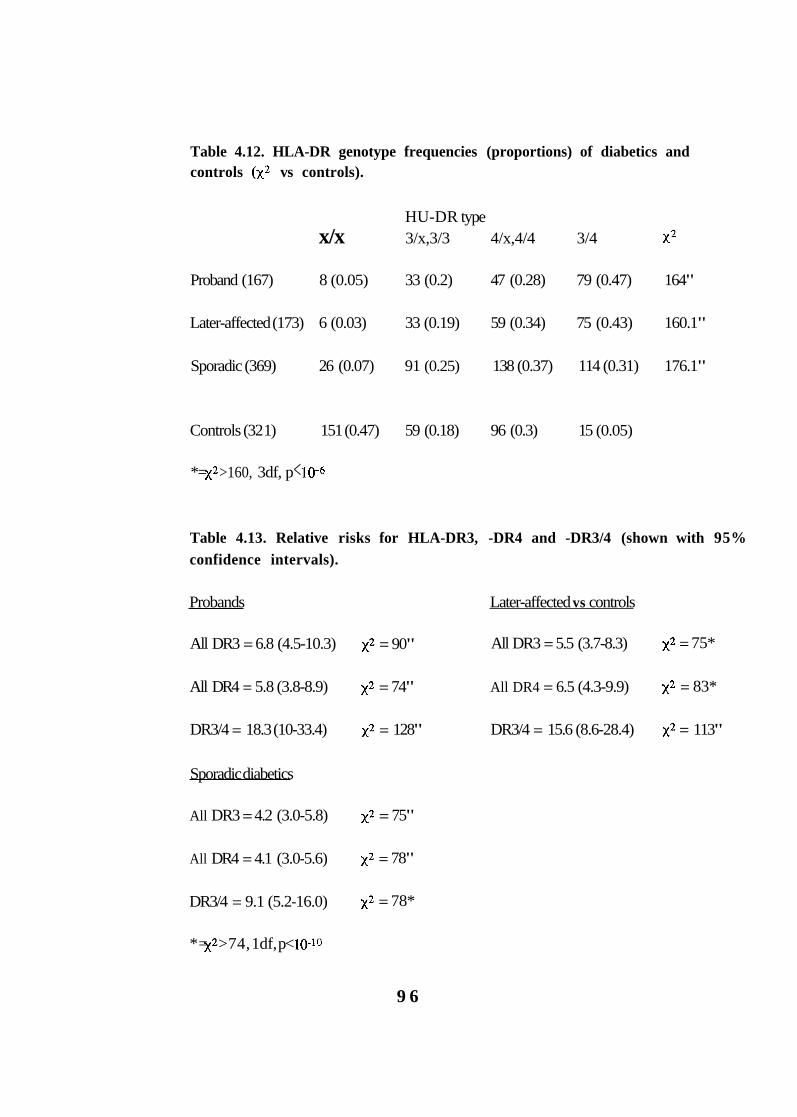
Table 4.12. HLA-DR genotype frequencies (proportions) of diabetics and controls vs controls).
HU-DR type x/x 3/x,3/3 4/x,4/4 3/4
Proband (167) 8 (0.05) 33 (0.2) 47 (0.28) 79 (0.47) 164"
Later-affected (173) 6 (0.03) 33 (0.19) 59 (0.34) 75 (0.43) 160.1"
Sporadic (369) 26 (0.07) 91 (0.25) 138 (0.37) 114 (0.31) 176.1"
Controls (32 1) 151 (0.47) 59 (0.18) 96 (0.3) 15 (0.05)
*= >160, 3df, p <
Table 4.13. Relative risks for HLA-DR3, -DR4 and -DR3/4 (shown with 95% confidence intervals).
Probands Later-affected vs controls
All DR3 = 6.8 (4.5-10.3) = 90" All DR3 = 5.5 (3.7-8.3) = 75*
All DR4 = 5.8 (3.8-8.9) = 74" All DR4 = 6.5 (4.3-9.9) = 83*
DR3/4 = 18.3 (10-33.4) = 128" DR3/4 = 15.6 (8.6-28.4) = 113"
Sporadic diabetics
All DR3 = 4.2 (3.0-5.8) = 75"
All DR4 = 4.1 (3.0-5.6) = 78"
DR3/4 = 9.1 (5.2-16.0) = 78*
*= >74, 1df, p<
9 6
1993). HLA-DQB 1 typing was performed on 278 HLA-DR4-positive multiplex
diabetics and 243 sporadics; 229 (0.93) and 218 (0.9) carry HLA-DQB1*0302,
respectively between groups 1.4, 1df, p=0.24). Of the 75 HLA-DR4-positive
controls typed for HLA-DQB1,44 (0.59) are HLA-DQB1*0302 and 31 (0.41) are
-DQB 1*0301. Closer examination of the association revealed that the proportion of
HLA-DQB 1*0302 was highest in HLA-DR3/4 heterozygotes versus controls
28.8, 1df, p< and this was significantly increased compared with HLA-
DR4/4,4/X diabetics in both multiplex 10.4, 1df, p<0.002) and sporadic
samples 19.5, 1df, pelo-5).
This difference between the association of HLA-DR4 and -DQB1 alleles in HLA-
DR314 heterozygotes and HLA-DR4/X diabetics has been noted previously (Tait,
Mraz et al. 1988). The same study also found that HLA-DR1/4 diabetics did not
have a significant excess of HLA-DR4, -DQB1*0302 (TA10-) compared with
HLA-DR4-positive controls. Although their control population was large (n=583),
only 20 diabetics were HLA-DR1/4. Thirty-seven multiplex and 35 sporadic
diabetics in this series are HLA-DR1/4 and there is no difference between them
regarding the HLA-DR4, -DQB1*0302 association 0.013, 1df, p=0.9).
Comparison of the total HLA-DR1/4 diabetic cohort with the total DR4-positive
controls shows a significant increase of HLA-DQB1*0302 8.3, 1df, p<0.005).
There is no doubt that the association between HLA-DR4 and HLA-DQB 1*0302 is
strongest in HLA-DR3/4 diabetics. This suggests an interaction (leading to
increased disease susceptibility) between haplotypes carrying HLA-DR3,
DQB 1*0201 and HLA-DR4, DQB 1*0302, which cannot be explained by alleles at
HLA-DQB1 alone. Before this can be confirmed as a diabetogenic association,
however, data on a large group of HLA-DR3/4-positive controls is required.
9 7
Although the HLA-DR4, -DQB1 association is weaker in other HLA-DR4-positive
diabetic groups, it is present; the negative report in the literature may reflect the
small numbers studied previously. Once again, there is no significant difference
between multiplex and sporadic cases.
4.9. Genetic linkage of HLA and type 1 diabetes
Comparison of the HLA haplotype sharing in affected sibling pairs with that
expected under a model of random segregation ( 1:2:1) demonstrates genetic linkage
of HLA to diabetes (Section 1.5.2). Of 174 fully informative sibling pairs, 83
(0.48) share two haplotypes identical-by-descent (IBD), 67 (0.38) share one
haplotype IBD and 24 (0.14) share zero 51,2df, p< The number of zero
sharers in this data set is higher than is generally quoted in the literature (-0.07).
Comparison of these sharing data with those from the G.A.W.5 data set, however,
shows no significant heterogeneity between the multiplex families in these
collections (table 4.14).
Using the IBD probabilities from the UK data and the method of Risch one can
calculate how much of the observed familial clustering of type 1 diabetes is
accounted for by the HLA region(Risch 1987). The As for HLA is the expected
proportion of sibling pairs sharing zero HLA haplotypes (under a hypothesis of no
linkage) divided by the observed number of zero sharers, i.e. for this data set, As =
0.25/0.14 = 1.78. This compares with the overall As of 15 (the risk of disease to
the sibling of a type 1 diabetic compared with that of the general population),
implying that an unlinked locus and/or environmental factors are required to fully
account for the observed familial clustering. The As of 1.8 for HLA compares with
9 8
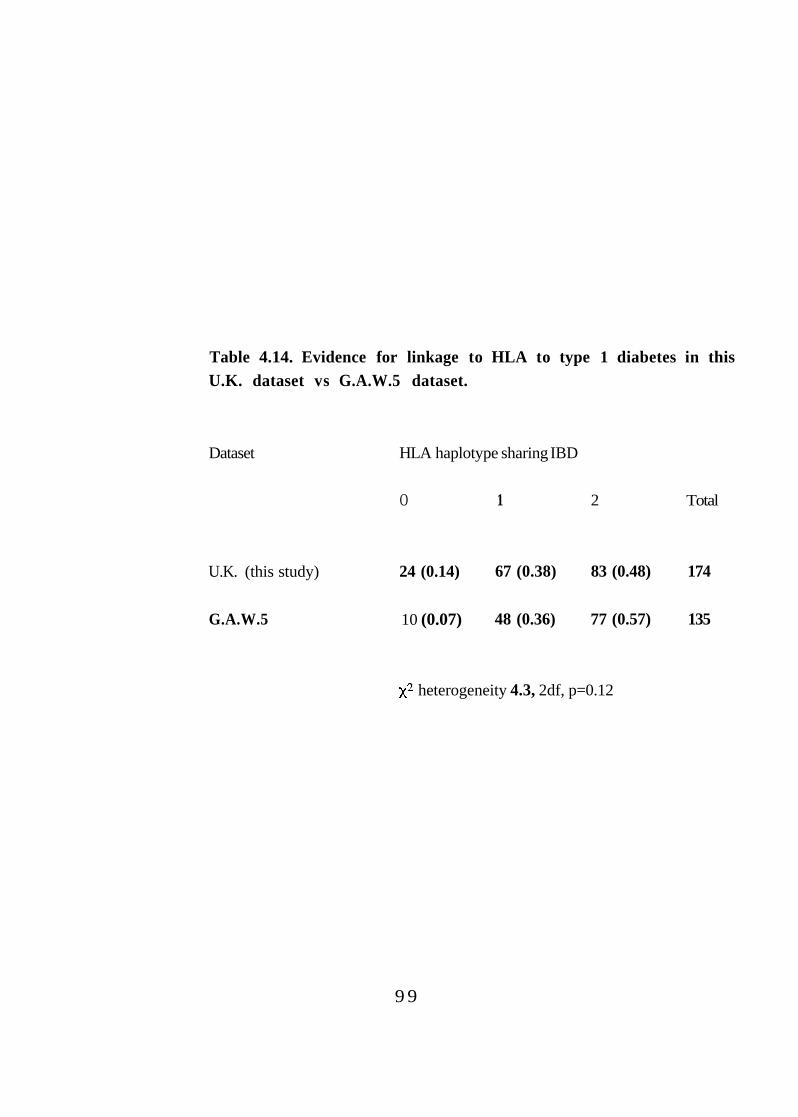
Table 4.14. Evidence for linkage to HLA to type 1 diabetes in this U.K. dataset vs G.A.W.5 dataset.
Dataset HLA haplotype sharing IBD
O 1 2 Total
U.K. (this study) 24 (0.14) 67 (0.38) 83 (0.48) 174
G.A.W.5 10 (0.07) 48 (0.36) 77 (0.57) 135
heterogeneity 4.3, 2df, p=0.12
9 9
the value estimated by Risch, = 3.42 (by meta-analysis of all data sets in the
literature) and from the G.A.W.5 data, As = 3.57.
Given the evidence in support of genetic heterogeneity according to age-at-onset
(Section 4.6) and the low value of As, I have subdivided the fully informative
sibling pairs according to age-at-onset of disease(Bain, Aitman et al. I993). This
has been done by dividing the data set into roughly equal tertiles using these four
criteria; age-at-onset of the younger diabetic in each sib-pair, age-at-onset of the
older diabetic in each sib-pair, age-at-onset of the proband in each sib-pair and
mean age-at-onset of the pair. Almost identical results are obtained from each
analysis and only the data for ageat-onset of the younger diabetic in each sib-pair is
shown (table 4.15).
Clearly, there is evidence of heterogeneity in the linkage of HLA to type 1 diabetes
according to age-at-onset, with the oldest tertile showing no significant distortion in
haplotype sharing. This result has not been described previously but is consistent
with reports of weaker HLA associations according to ageat-onset and the increase
in the proportion of HLA-DRX/X - positive sporadic diabetics with age(Caillat-
Zucman, Garchon et al. I992).
Examination of the G.A.W.5 sib-pairs by age-at-onset (table 4.16) does not
confirm this effect, however, the G.A.W.5 data set was assembled from families
that had already been HLA typed. Knowledge of these data could have affected the
selection of families and this is inkeeping with the extremely low proportion of
HLA-DRX/X in this data set (<0.02). There is further support for this contention
from data on French multiplex families (G.M. Lathrop, personal communication).
Young French multiplex families (at least one diabetic aged less than 18 years at
100
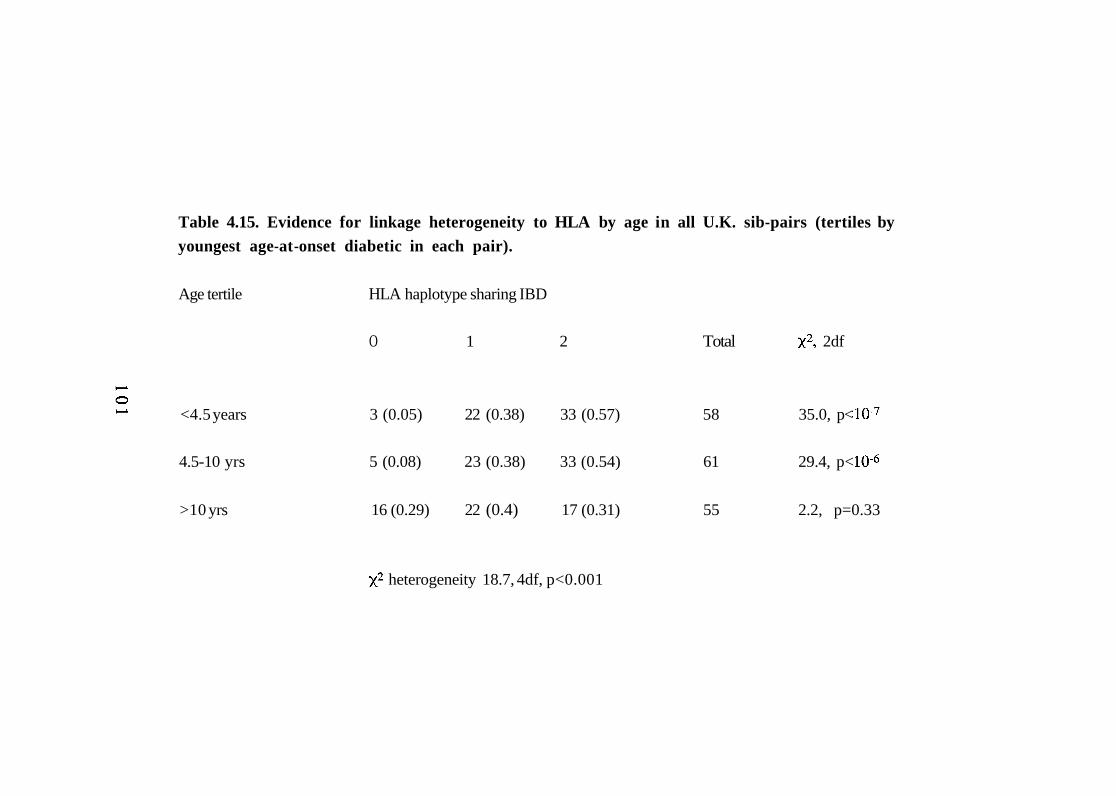
Table 4.15. Evidence for linkage heterogeneity to HLA by age in all U.K. sib-pairs (tertiles by youngest age-at -onset diabetic in each pair).
Age tertile HLA haplotype sharing IBD
O 1 2 Total 2df
<4.5 years 3 (0.05) 22 (0.38) 33 (0.57) 58 35.0, p<
4.5-10 yrs 5 (0.08) 23 (0.38) 33 (0.54) 61 29.4, p<
>10 yrs 16 (0.29) 22 (0.4) 17 (0.31) 55 2.2, p=0.33
heterogeneity 18.7, 4df, p<0.001
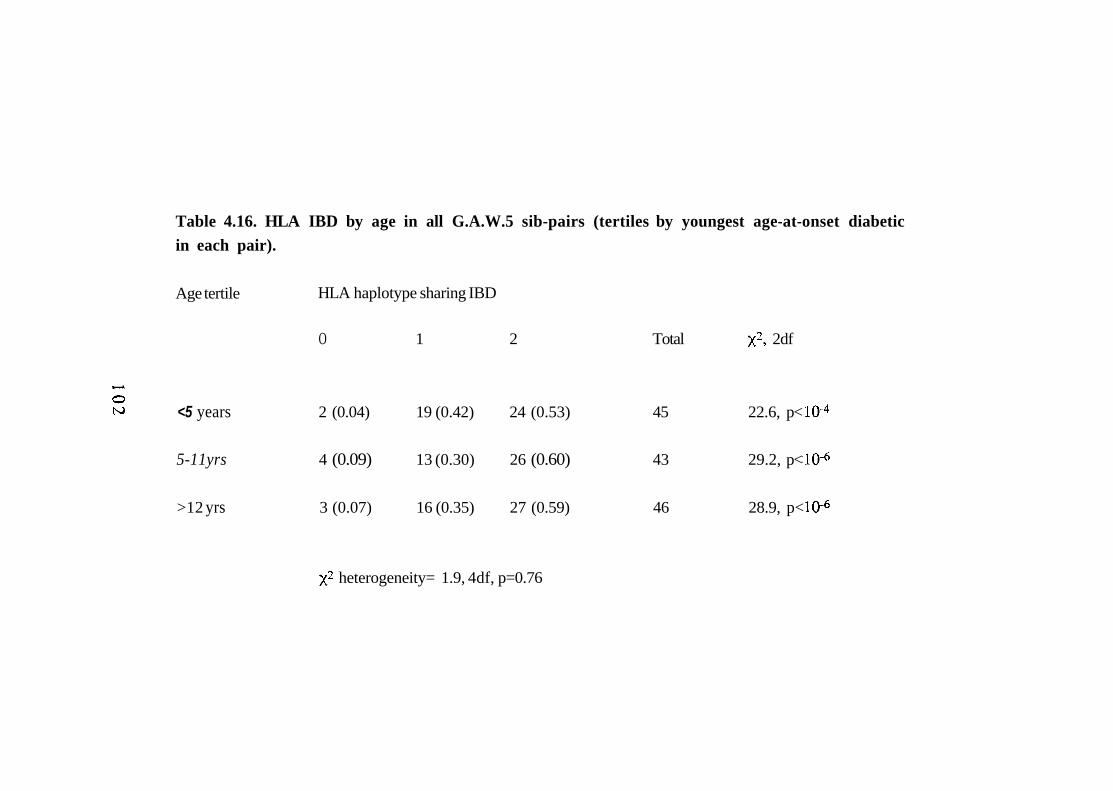
Table 4.16. HLA IBD by age in all G.A.W.5 sib-pairs (tertiles by youngest age-at-onset diabetic in each pair).
Age tertile HLA haplotype sharing IBD
O 1 2 Total 2df
<5 years 2 (0.04) 19 (0.42) 24 (0.53) 45 22.6, p<
5-11yrs 4 (0.09) 13 (0.30) 26 (0.60) 43 29.2, p<
>12 yrs 3 (0.07) 16 (0.35) 27 (0.59) 46 28.9, p<
heterogeneity= 1.9, 4df, p=0.76
diagnosis) are selected using clinical criteria only; in this group, there is a similar
trend in haplotype sharing, this being strongest in the youngest age-at-onset tertile
31,2df, and weakest in the oldest tertile 6.2,2df, p<0.05). Older
sibling pairs in the French data set are, however, pre-selected; both diabetics must
be ICA positive at diagnosis. In this older group (n=23), the evidence for linkage to
HLA is extremely strong 30,2df,
Another consideration in the analysis of the G.A.W.5 data is that both the zero-
sharers in the youngest age-at-onset tertile come from one family which has four
diabetic offspring. Both of these diabetics share 1 and/or 2 HLA haplotypes with
other diabetic family members, implying that all four parental haplotypes are high
risk. In these circumstances, zero sharing may have less relevance (Section 4.6 ).
Given that age-related HLA heterogeneity exists (in the UK at least), what is the
effect of excluding those sibling pairs that do not satisfy the B.D.A. age criteria?
These results are shown in table 4.17. Although there remains a trend towards
more zero-sharers in the oldest tertile, there is significant evidence of linkage in
each tertile >13.8, equivalent to LOD score >3) and no statistical heterogeneity
between the tertiles. These data show that by use of age-at-onset criteria alone,
evidence for genetic heterogeneity at HLA can be reduced (as was anticipated). This
finding also highlights the importance of accumulating detailed clinical data on
pedigrees, especially when clinical diagnostic criteria only are used for inclusion.
103
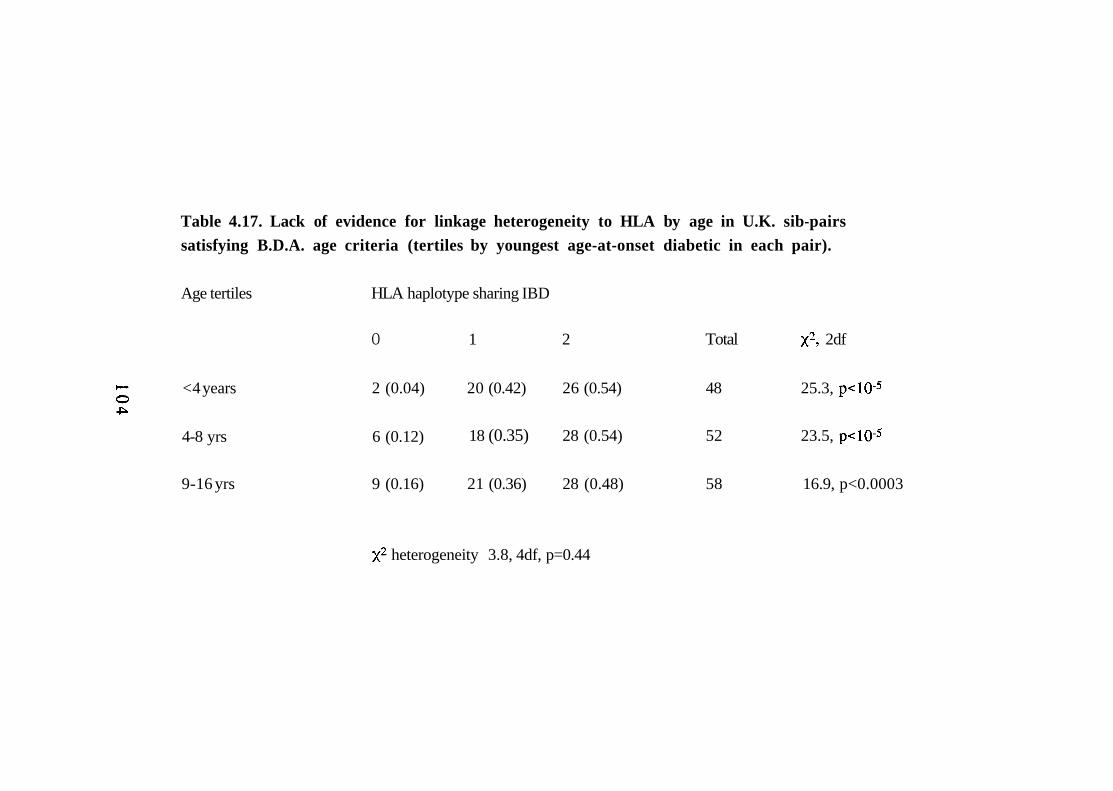
Table 4.17. Lack of evidence for linkage heterogeneity to HLA by age in U.K. sib-pairs satisfying B.D.A. age criteria (tertiles by youngest age-at-onset diabetic in each pair).
Age tertiles HLA haplotype sharing IBD
O 1 2 Total 2df
<4 years 2 (0.04) 20 (0.42) 26 (0.54) 48 25.3,
18 (0.35) 28 (0.54) 52 23.5, 4-8 yrs 6 (0.12)
9-16 yrs 9 (0.16) 21 (0.36) 28 (0.48) 58 16.9, p<0.0003
heterogeneity 3.8, 4df, p=0.44
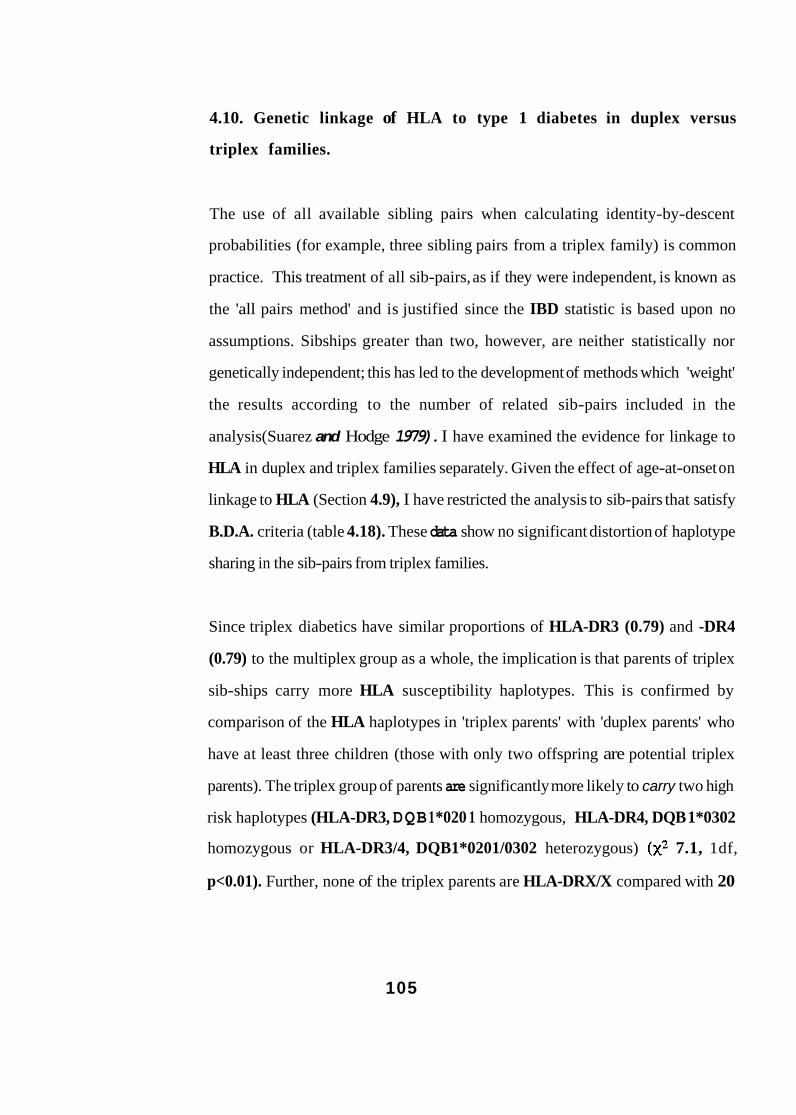
4.10. Genetic linkage of HLA to type 1 diabetes in duplex versus
triplex families.
The use of all available sibling pairs when calculating identity-by-descent
probabilities (for example, three sibling pairs from a triplex family) is common
practice. This treatment of all sib-pairs, as if they were independent, is known as
the 'all pairs method' and is justified since the IBD statistic is based upon no
assumptions. Sibships greater than two, however, are neither statistically nor
genetically independent; this has led to the development of methods which 'weight'
the results according to the number of related sib-pairs included in the
analysis(Suarez and Hodge 1979). I have examined the evidence for linkage to
HLA in duplex and triplex families separately. Given the effect of age-at-onset on
linkage to HLA (Section 4.9), I have restricted the analysis to sib-pairs that satisfy
B.D.A. criteria (table 4.18). These data show no significant distortion of haplotype
sharing in the sib-pairs from triplex families.
Since triplex diabetics have similar proportions of HLA-DR3 (0.79) and -DR4
(0.79) to the multiplex group as a whole, the implication is that parents of triplex
sib-ships carry more HLA susceptibility haplotypes. This is confirmed by
comparison of the HLA haplotypes in 'triplex parents' with 'duplex parents' who
have at least three children (those with only two offspring are potential triplex
parents). The triplex group of parents are significantly more likely to carry two high
risk haplotypes (HLA-DR3, DQB 1 *020 1 homozygous, HLA-DR4, DQB 1*0302
homozygous or HLA-DR3/4, DQB1*0201/0302 heterozygous) 7.1, 1df,
p<0.01). Further, none of the triplex parents are HLA-DRX/X compared with 20
105
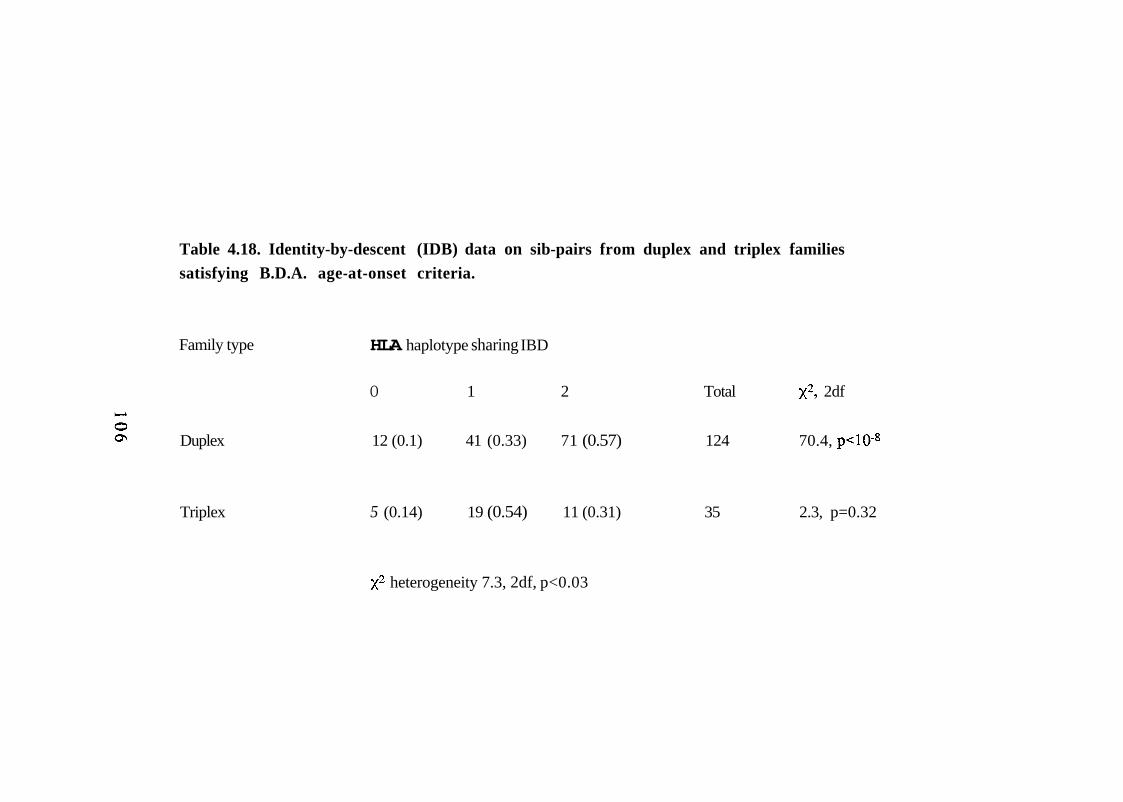
Table 4.18. Identity-by-descent (IDB) data on sib-pairs from duplex and triplex families satisfying B.D.A. age-at-onset criteria.
Family type HLA haplotype sharing IBD
O 1 2 Total 2df
Duplex 12 (0.1) 41 (0.33) 71 (0.57) 124 70.4,
Triplex 5 (0.14) 19 (0.54) 11 (0.31) 35 2.3, p=0.32
heterogeneity 7.3, 2df, p<0.03
Table 4.19. HLA types of diabetics from duplex families with three or more offspring and from triplex families.
Diabetics HLA-DR type
X/X 3/X, 3/3 4/X,4/4 3/4
Duplex 5 (0.03) 40 (0.24) 60 (0.35) 65 (0.38)
Triplex 2 (0.05) 7 (0.17) 7 (0.17) 26 (0.62)
heterogeneity 9.1, 3df, p<0.03
107
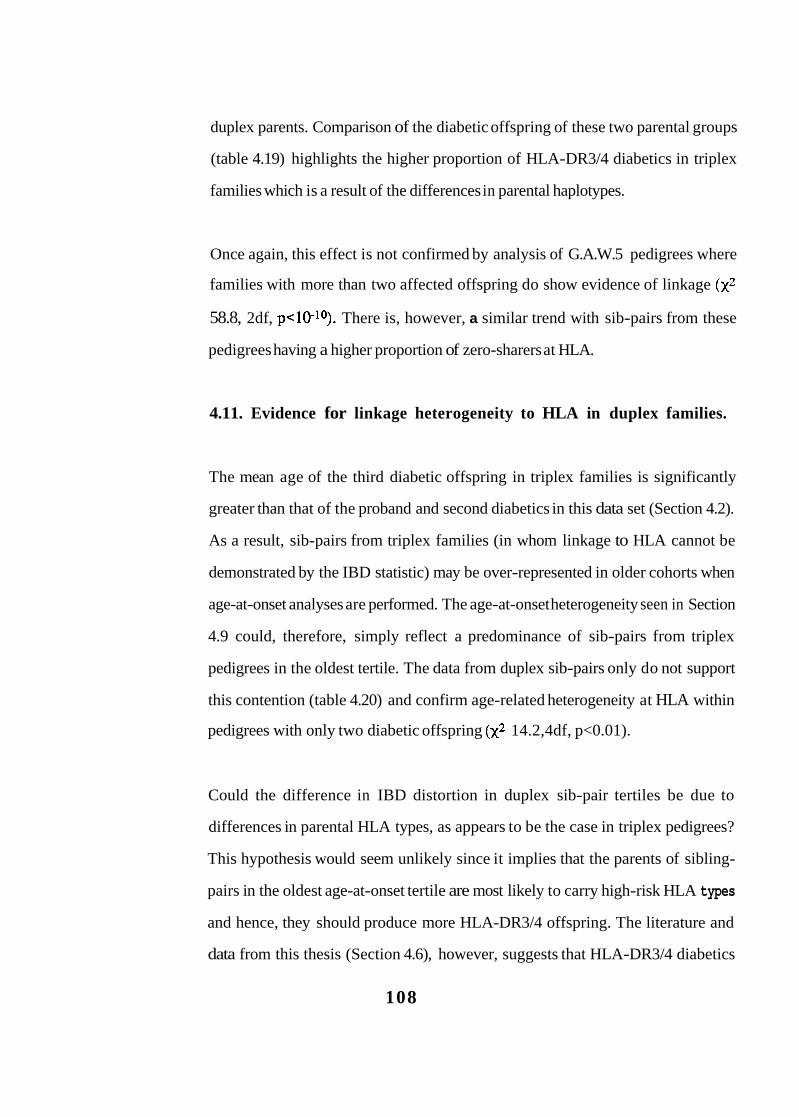
duplex parents. Comparison of the diabetic offspring of these two parental groups
(table 4.19) highlights the higher proportion of HLA-DR3/4 diabetics in triplex
families which is a result of the differences in parental haplotypes.
Once again, this effect is not confirmed by analysis of G.A.W.5 pedigrees where
families with more than two affected offspring do show evidence of linkage
58.8, 2df, There is, however, a similar trend with sib-pairs from these
pedigrees having a higher proportion of zero-sharers at HLA.
4.11. Evidence for linkage heterogeneity to HLA in duplex families.
The mean age of the third diabetic offspring in triplex families is significantly
greater than that of the proband and second diabetics in this data set (Section 4.2).
As a result, sib-pairs from triplex families (in whom linkage to HLA cannot be
demonstrated by the IBD statistic) may be over-represented in older cohorts when
age-at-onset analyses are performed. The age-at-onset heterogeneity seen in Section
4.9 could, therefore, simply reflect a predominance of sib-pairs from triplex
pedigrees in the oldest tertile. The data from duplex sib-pairs only do not support
this contention (table 4.20) and confirm age-related heterogeneity at HLA within
pedigrees with only two diabetic offspring 14.2,4df, p<0.01).
Could the difference in IBD distortion in duplex sib-pair tertiles be due to
differences in parental HLA types, as appears to be the case in triplex pedigrees?
This hypothesis would seem unlikely since it implies that the parents of sibling-
pairs in the oldest age-at-onset tertile are most likely to carry high-risk HLA types
and hence, they should produce more HLA-DR3/4 offspring. The literature and
data from this thesis (Section 4.6), however, suggests that HLA-DR3/4 diabetics
108
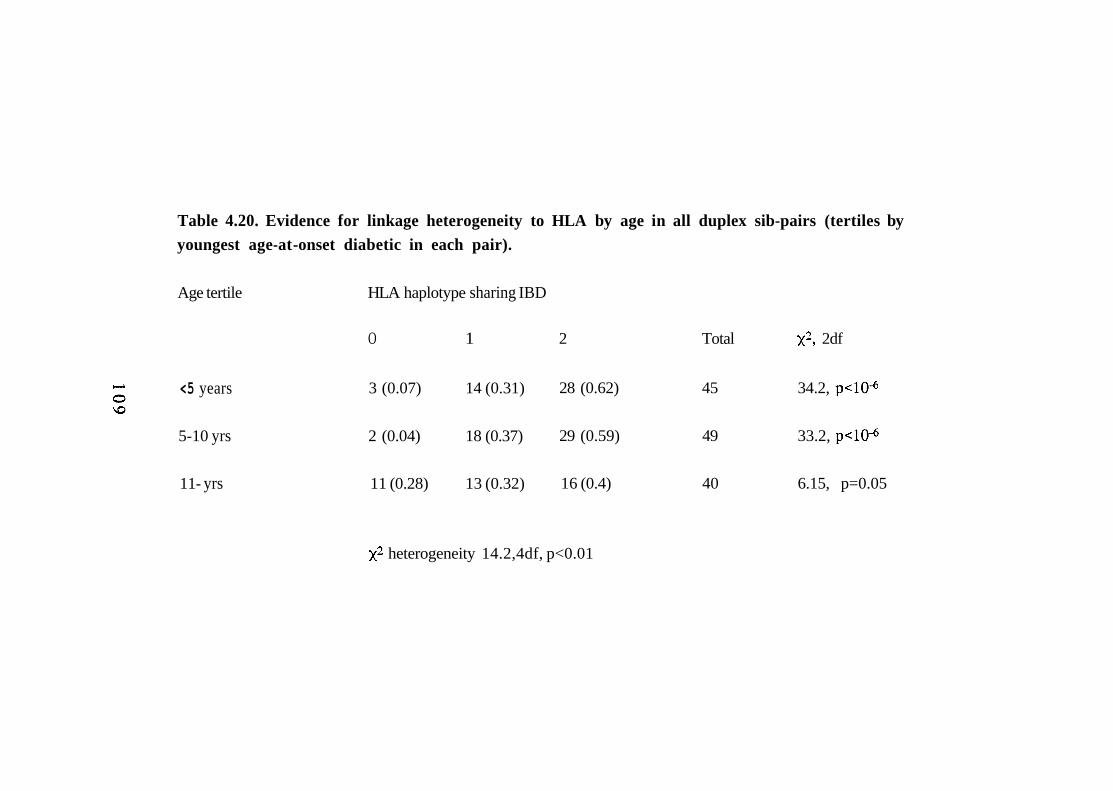
Table 4.20. Evidence for linkage heterogeneity to HLA by age in all duplex sib-pairs (tertiles by youngest age-at -onset diabetic in each pair).
Age tertile HLA haplotype sharing IBD
O 1 2 Total 2df
<5 years 3 (0.07) 14 (0.31) 28 (0.62) 45 34.2,
5-10 yrs 2 (0.04) 18 (0.37) 29 (0.59) 49 33.2,
11- yrs 11 (0.28) 13 (0.32) 16 (0.4) 40 6.15, p=0.05
heterogeneity 14.2,4df, p<0.01
develop disease at an earlier, rather than later, age. Table 4.21 shows a comparison
of the HLA-DR types in diabetics from the youngest and oldest age-at-onset tertiles;
this confirms that duplex diabetic offspring in the oldest age-at-onset tertile are less
likely to be HLA-DR3/4 heterozygotes, although this is not a significant finding.
Furthermore, there is no significant difference in the parents of the youngest and
oldest tertiles when comparing the proportions who are homozygous for high-risk
HLA-DR,-DQ haplotypes (as performed in Section 4.10). Twenty-six of eighty
(0.32) parents of sib-pairs in the oldest tertile are "high-risk homozygotes"
compared with 19/88 (0.22) parents in the youngest tertile 2.5, 1df, p=0.11).
4.12. Summary and conclusions.
Analysis of this large, ethnically homogeneous data set confirms the well-described
associations between HLA-DR3 and HLA-DR4 and type 1 diabetes. Further, the
analysis demonstrates linkage between the HLA region and type 1 disease in
multiplex pedigrees.
These data also show that heterogeneity, related to age-at-onset of disease, is
present in type 1 diabetes. Below the age of approximately 13 years, the risk of
type 1 diabetes appears to be equal for males and females but as the age-at-onset
increases above this age, males are more likely to be affected This result may direct
research towards environmental factors acting around the onset of puberty and
whilst studies of this kind do not provide mechanistic hypotheses, it is interesting to
speculate on the possible roles of hormonal changes associated with menarche and
rubella vaccination. The additional finding that there is a male preponderance of
HLA-DR3/3,3/X diabetics, irrespective of age-at-onset, requires confirmation in
larger numbers of subjects.
110
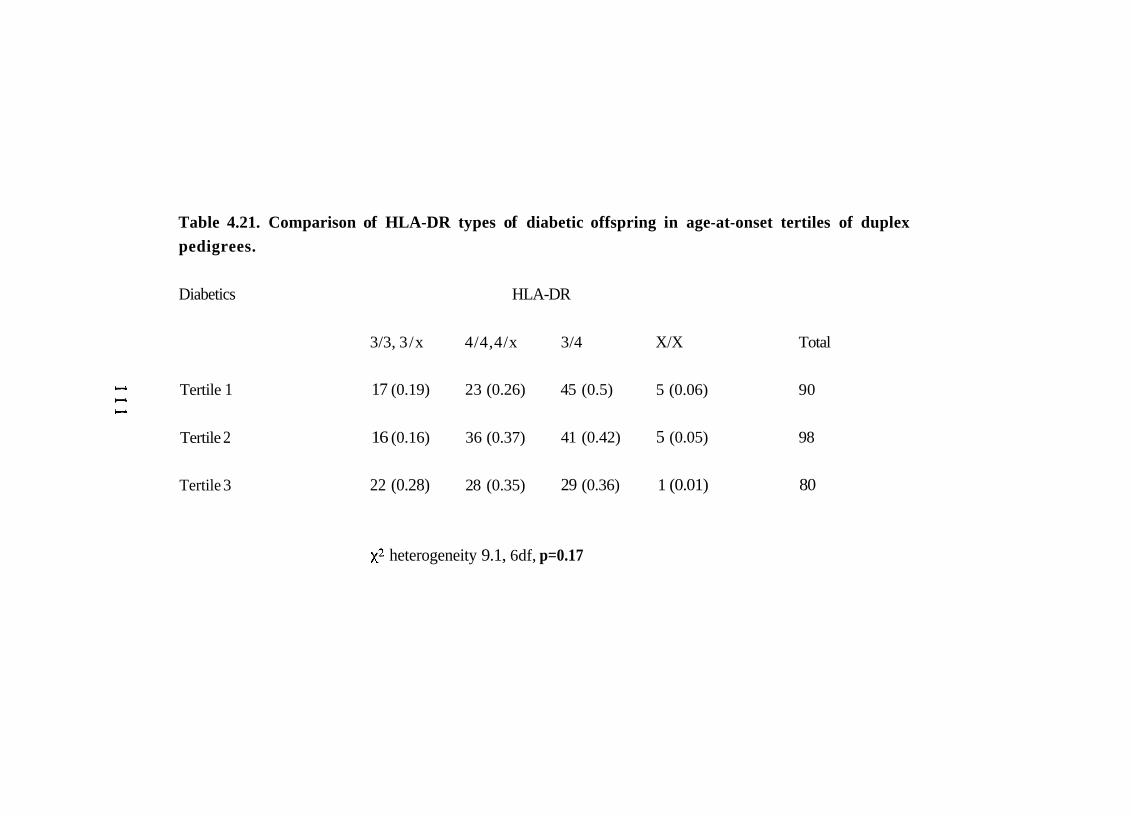
Table 4.21. Comparison of HLA-DR types of diabetic offspring in age-at-onset tertiles of duplex pedigrees.
Diabetics HLA-DR
3/3, 3/x 4/4,4/x 3/4 X/X Total
Tertile 1 17 (0.19) 23 (0.26) 45 (0.5) 5 (0.06) 90
Tertile 2 16 (0.16) 36 (0.37) 41 (0.42) 5 (0.05) 98
Tertile 3 22 (0.28) 28 (0.35) 29 (0.36) 1 (0.01) 80
heterogeneity 9.1, 6df, p=0.17
There is also evidence that linkage between HLA and type 1 diabetes is dependent
upon age-at-onset of disease, at least in this multiplex family data set. This is
consistent with data from population association studies, as well as reports of
clinical and 'biochemical' heterogeneity according to age at diagnosis. The lack of
support for this finding from the G.A.W.5 data set is both surprising and a matter for
concern; the possibility that this relates to pre-selection of pedigrees (on the basis of
HLA typing) needs to be explored. In addition, the mean age-at-onset of disease
appears to be lower in HLA-DR3/4 diabetics and this is consistent with data
showing a higher proportion of HLA-DR3/4 heterozygotes in younger diabetics.
The age range of subjects in this data set, however, precludes firm confirmation of
this finding.
There is little evidence of genetic heterogeneity between multiplex and sporadic
diabetics. The previously reported differences in mean age-at-onset of disease
(between probands and sporadics) are shown to be spurious and the only
convincing difference between familial and sporadic diabetics is the higher
proportion of HLA-DR3/4 heterozygotes in multiplex diabetics. This finding is
consistent with an increased prevalence of high risk HLA haplotypes in the parents
of multiply affected offspring and the higher risk of disease to HLA-DR3/4
individuals. This contention is supported by the even higher proportion of HLA-
DR3/4 heterozygotes in triplex diabetics. The implication of these findings is that
genes identified in linkage analyses of multiplex families are likely to be involved in
sporadic type 1 disease. Assessment of the importance of new loci, however, must
be performed in sporadic cases (compared with controls) since multiplex cases will
tend to over-emphasise the risk afforded by susceptibility alleles (as seen with
HLA-DR3/4 heterozygote relative risk in multiplex versus sporadic cases).
112

Finally, these data may help in the selection of sibling pairs which are most likely to
demonstrate linkage to new susceptibility loci. The ability to detect linkage to HLA
using affected sibling pair analysis is greatly reduced by analysis of both older
pedigrees and triplex sib-ships; this suggests that young onset, duplex pedigrees
may be of most value in linkage analysis of other loci.
1 1 3
CHAPTER 5
INSULIN GENE ANALYSIS
1 1 4
5.1. Introduction.
The insulin gene region (INS) on the short arm of chromosome 11 (11p15.5) was
initially regarded as a candidate gene for type 2 diabetes. The first polymorphism to
be assayed for association studies was described by Bell et al. in 1981 (Bell, Karam
et al. 1981); this consists of a length polymorphism created by variation in the
number of copies of a 14bp repeat located 5' to the start of the transcription of the
insulin gene. This is termed a variable number tandem repeat (VNTR). The number
of tandem repeats in Caucasians falls into two main classes; small alleles of
approximately 40 repeats, known as Class 1 alleles and larger alleles (~170 repeats)
designated Class 3. Intermediate sized alleles (Class 2) are extremely rare in
Caucasians.
Initial studies on the INS VNTR examined only small numbers of subjects with
type 1 diabetes since the focus was on type 2 disease(Bell, Karam et al.
1981) (Rotwein, Chyn et al. 1981) (Owerbach and Nemp 1982)(Rotwein, Chirgwin
et al. 1983). In 1984, however, Bell at al. analysed a group of 113 type 1 diabetics
and reported an association between Class 1 alleles and disease(Bell, Horita et al.
1984). This was followed by a study from Hitman et al. (53 patients versus 88
controls) which again showed a significantly higher frequency of Class 1 alleles in
diabetic patients(Hitman, Tarn et al. 1985). Linkage analysis of 17 multiplex
families (in the same paper), however, showed no evidence of linkage between INS
and type 1 diabetes, despite using various models of inheritance and penetrance. In
1988, Cox et al. analysed 33 affected sibling pairs (from 22 multiplex families) for
linkage between INS and type 1 diabetes(Cox, Baker et al. 1988); they found no
significant distortion in haplotype sharing from the expected 1:2:1 ratio. These
authors concluded that either there was no susceptibility locus linked to INS and the
115
association found in unrelated diabetics and controls was an artifact (due to
unrecognised population stratification) or a susceptibility locus did exist but it's
effects were too weak to be detected by linkage analysis of small numbers of
pedigrees.
In 1989, an analysis of the G.A.W.5 data set was published but this did little to
resolve the issue; data was available on 74 sibling pairs and showed that 0.28
shared zero haplotypes IBD, 0.47 shared one and 0.24 shared both(Field 1989);
these results do not differ significantly from the expected 1:2:1 ratio. Thomson et
al. subsequently applied the affected family based controls (AFBAC) method to the
G.A.W.5 data(Thomson, Robinson et al. 1989). This method catagorises parental
haplotypes according to whether or not they are transmitted to affected offspring;
those that are not (DO haplotypes) act as an intenial, and therefore racially matched,
control group. This analysis showed that significantly more D1 haplotypes
(transmitted to diabetics) were Class 1, supporting weak linkage of a locus at INS.
The first evidence for linkage between INS and type 1 diabetes was established in
1991 by Julier et al.(Julier, Hyer et al. 1991). This group identified new
polymorphisms within the INS region which could be analysed by PCR and
confirmed an association between these polymorphisms and type 1 diabetes. They
then analysed a large, mostly French, group of multiplex families for evidence of
linkage. The approach was different, in that analysis of pedigrees was limited to
those in which at least one parent was heterozygous at the locus of interest. In
effect, this meant that each parent could transmit a high risk (disease-associated)
allele or a low risk (non-disease-associated) allele to affected sibling pairs. Under a
model of no linkage, the INS alleles would be transmitted to affected offspring in a
ratio of 1:1 and siblings would share the same parental allele 50% of the time.
1 1 6
Distortion of segregation (assessed by the x2 goodness-of-fit test, with a
significance level of 0.05) was taken as evidence for linkage. Since the parents
were being analysed separately, information was generated from partially
informative families and a comparison of parental segregation was facilitated.
Whilst these statistical manoeuvres had been used many times in the past, neither
had been been applied to the so-called INS paradox (positive association studies in
the face of negative linkage analysis) (Owerbach, Gunn et al. 1990).
In the study of Julier et al., evidence for linkage was observed only when the INS
loci were paternally inherited. Conventional IBD analysis of the French data set
showed no evidence of linkage; indeed, more sibling pairs shared zero INS
haplotypes than shared two IBD. Maternal imprinting was considered the most
likely explanation for the observed sex difference since this phenomenon appears to
be involved in monoallelic expression of other genes on chromosome 11p(Heutink,
van der Mey et al. 1992)(Zhang and Tycko 1992). Imprinting describes a
phenomenon where the expression of a gene is affected by the sex of the parent
from whom it is inherited. In the case of the INS susceptibility locus, the authors
suggested that disease-associated alleles were active only when inherited from a
male parent.
The same study also reported that the INS association was significant only in HLA-
DR4-positive diabetics, with no additional risk conferred in combination with other
HLA types. Further, the overall relative risk due to INS was similar to that of HLA-
DR4 itself, implying that INS is a major susceptibility locus. These results pointed
to complex interactions in genetic susceptibility to type 1 diabetes and implied that
parental origin of susceptibility loci must be known before risk can be measured. If
confirmed, this would have a major impact upon the feasibility of population
117
screening for type 1 diabetes using genetic markers (Section 1.4.5). I analysed this
independent, homogeneous data set for an association between alleles in the INS
region and disease. I then went on to search for an interaction between HLA-DR
and INS and to assess the effect of parental sex on susceptibility determinants at
INS using identical statistical methodology to Julier et al. (Julier, Hyer et al. 1991).
Given the findings of the previous chapter, the analysis was limited to those
families satisfying the B.D.A. age criteria.
5.2. Methodology
I designed new primers to amplify the 1,428/FokI, 1,404/Fnu4H I and 1,127/PstI
polymorphic sites of the INS region(Bain, Prim et al. 1992). PCR amplification
was performed in a volume containing 25-250ng DNA, 1.0-1.5mM
10mM TRIS buffer (pH 8.4), 'Tween 20' 0.01%, 200mM of each dNTP, 125ng
of each primer and 0.5 units of Taq polymerase (Boehringer). 32-35 cycles (1' at
94°C, 1' at 55°C and 30 seconds at 72°C) were performed in a Perkin-Elmer
Cetus Thermal Cycler. Primers SCB1 5'-CCA GCA TGC AGT GGC TCT CC-3'
and SCB2 5'-ATT GCT GGA ATG TTC TCA TTC CC-3' amplify a 230 base-pair
product which contains the l,428/FokI and 1,404/Fnu4HI restriction sites.
Digestion was performed on of PCR product for 2 hours at 37°C using either
0.5 units of FokI or 3 units of Fnu4HI enzyme. Amplification of the 1,127/PstI
polymorphic site was performed using the primers BRB1, 5'-AGC CCT TGG
CCC TGG AGG G-3' and BRB2 5'-CTT TAT TCC ATC TCT CTC GGT G-3'
under the same conditions and digested with 4 units of PstI enzyme for 2 hours at
37°C. The digested and undigested products are visualised by ethidium bromide
staining following electrophoresis in a 4% agarose gel (see figure 5.1). All family
members, sporadic diabetics and controls were typed for the 1,428/FokI,
1 1 8
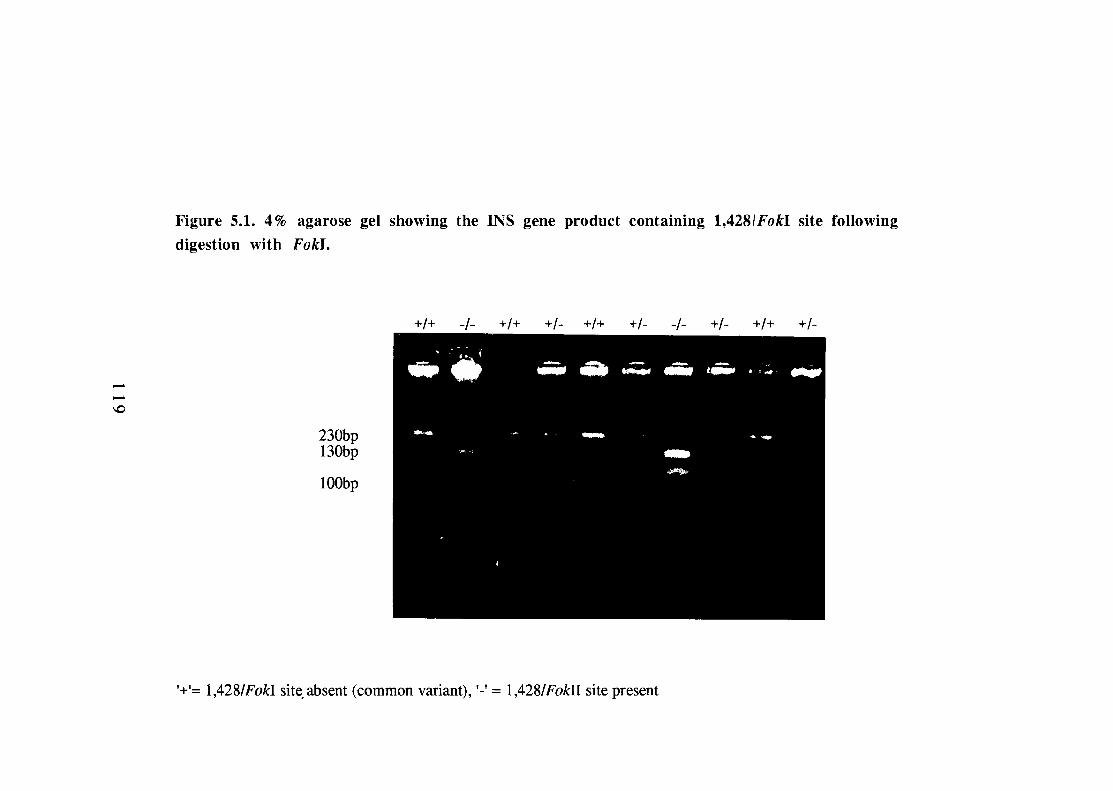
1,404/Fnu4HI and 1,127/PstI polymorphic sites of the INS region (Julier, Hyer et
al. 1991). The 1,127/PstI and 1,404/Fnu4HI data do not differ significantly from
that generated using Fokl digestion due to the strong linkage disequilibrium across
the INS region, as described previously(Cox, Bell et al. 1988). For this reason,
only the 1,428/FokI data are presented.
Haplotype data for the INS region were generated in 131 sibling pairs by additional
typing of the INS VNTR(Bell, Karam et al. 1981), HRAS VNTR(Owerbach,
Gunn et al. 1990) and a microsatellite within the Tyrosine Hydroxylase
gene(Hearne, Ghosh et al. 1992). The Southern blotting was performed as part of
a laboratory effort to facilitate RFLP analyses on the first 120 multiplex families. I
am indebted to the following individuals; J.R.S. Hall, C.M. Hearne, J.M. Love, J-
B. Prins, L.E. Pritchard, R.J. Ritchie and N.R. Rodrigues.
5.3. Analysis of the 1,428/FokI INS locus.
340 control subjects were typed for the 1,428/FokI INS polymorphisms. The
common 1,428/FokI allele (allele frequency 492/628 = 0.78) lacks the polymorphic
restriction site and is designated '+'; the other allele is ‘-’. Since only 23 of over
1,300 individuals typed for this thesis were -/- homozygotes, these individuals have
been included in the +/- group.
5.3.1. Association data.
Table 5.1 shows that the + 1,428/FokI INS allele is associated with type 1 diabetes.
512/648 (0.79) diabetics are 1,428/FokI INS +/+ homozygotes compared with
0.59 control subjects; this gives an overall relative risk of 2.6 (1.9-3.5) for the
120
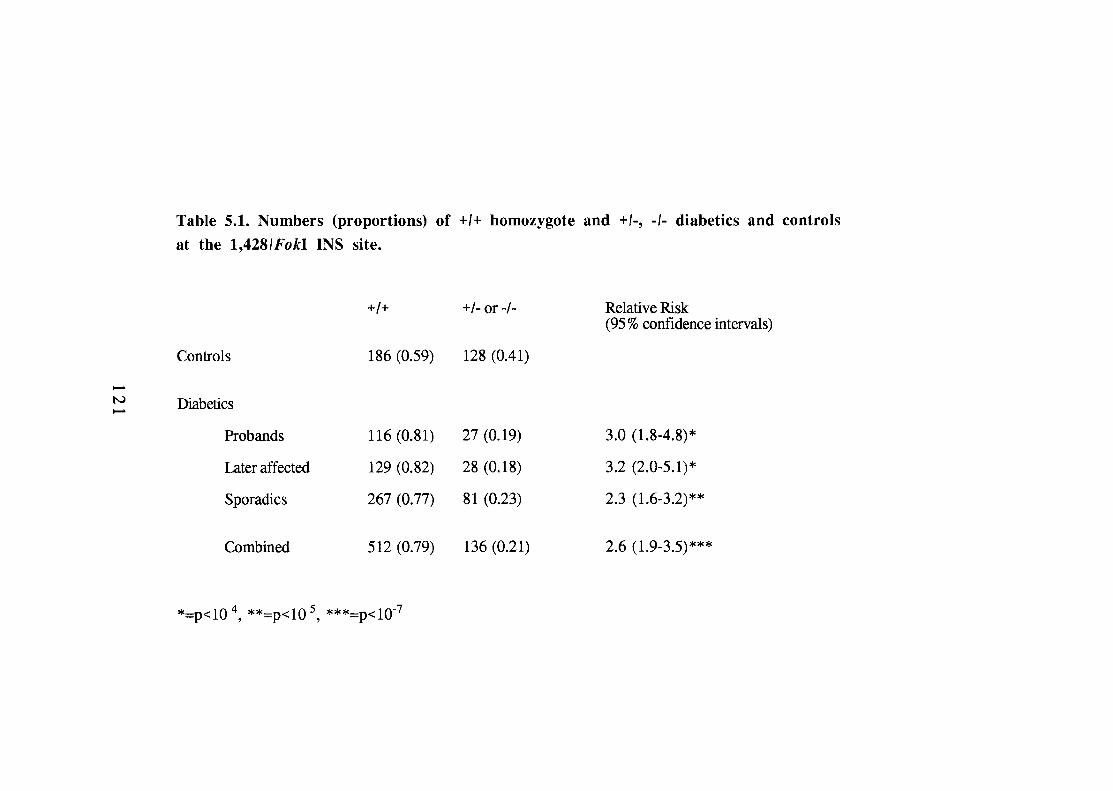
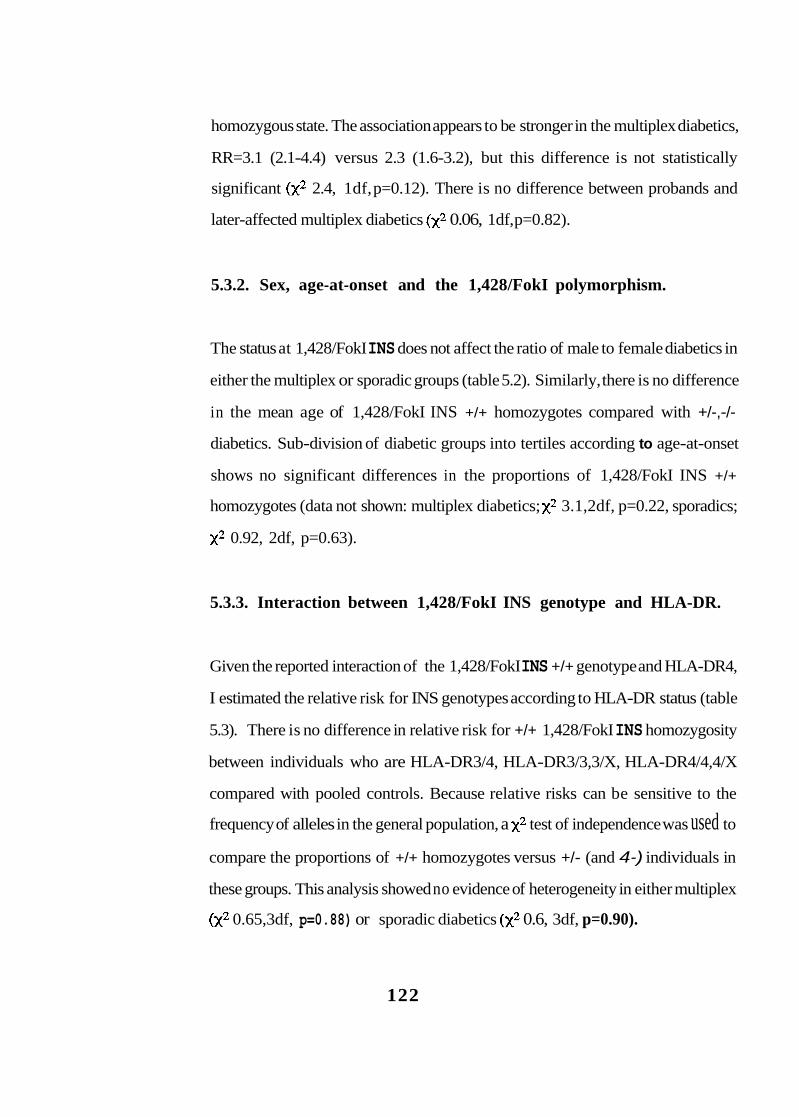
homozygous state. The association appears to be stronger in the multiplex diabetics,
RR=3.1 (2.1-4.4) versus 2.3 (1.6-3.2), but this difference is not statistically
significant 2.4, 1df, p=0.12). There is no difference between probands and
later-affected multiplex diabetics 0.06, 1df, p=0.82).
5.3.2. Sex, age-at-onset and the 1,428/FokI polymorphism.
The status at 1,428/FokI INS does not affect the ratio of male to female diabetics in
either the multiplex or sporadic groups (table 5.2). Similarly, there is no difference
in the mean age of 1,428/FokI INS +/+ homozygotes compared with +/-,-/-
diabetics. Sub-division of diabetic groups into tertiles according to age-at-onset
shows no significant differences in the proportions of 1,428/FokI INS +/+
homozygotes (data not shown: multiplex diabetics; 3.1,2df, p=0.22, sporadics;
0.92, 2df, p=0.63).
5.3.3. Interaction between 1,428/FokI INS genotype and HLA-DR.
Given the reported interaction of the 1,428/FokI INS +/+ genotype and HLA-DR4,
I estimated the relative risk for INS genotypes according to HLA-DR status (table
5.3). There is no difference in relative risk for +/+ 1,428/FokI INS homozygosity
between individuals who are HLA-DR3/4, HLA-DR3/3,3/X, HLA-DR4/4,4/X
compared with pooled controls. Because relative risks can be sensitive to the
frequency of alleles in the general population, a test of independence was used to
compare the proportions of +/+ homozygotes versus +/- (and 4-) individuals in
these groups. This analysis showed no evidence of heterogeneity in either multiplex
0.65,3df, p=0.88) or sporadic diabetics 0.6, 3df, p=0.90).
122
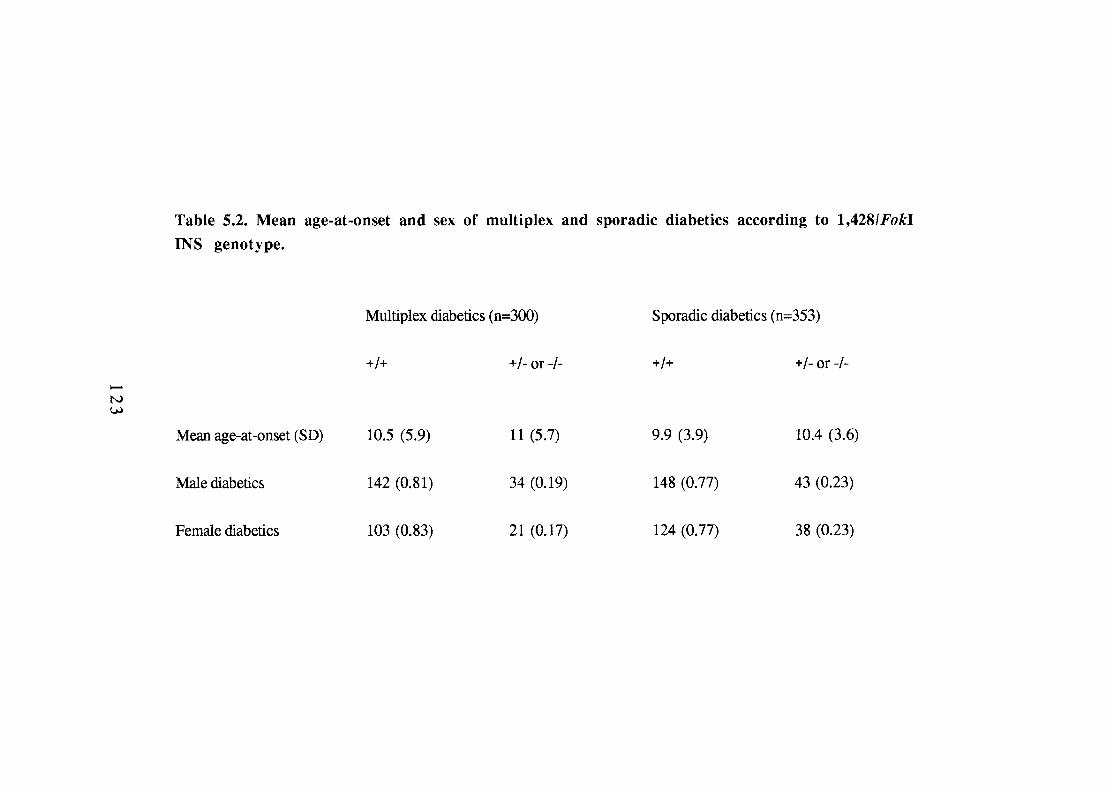
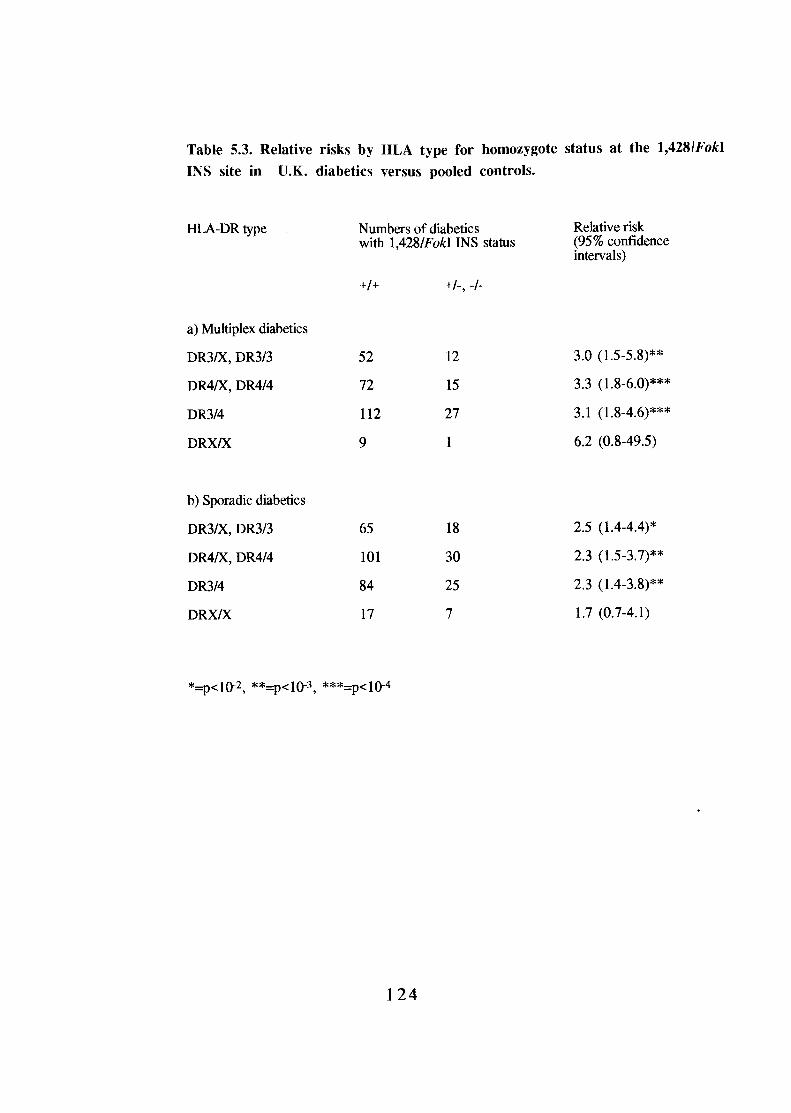
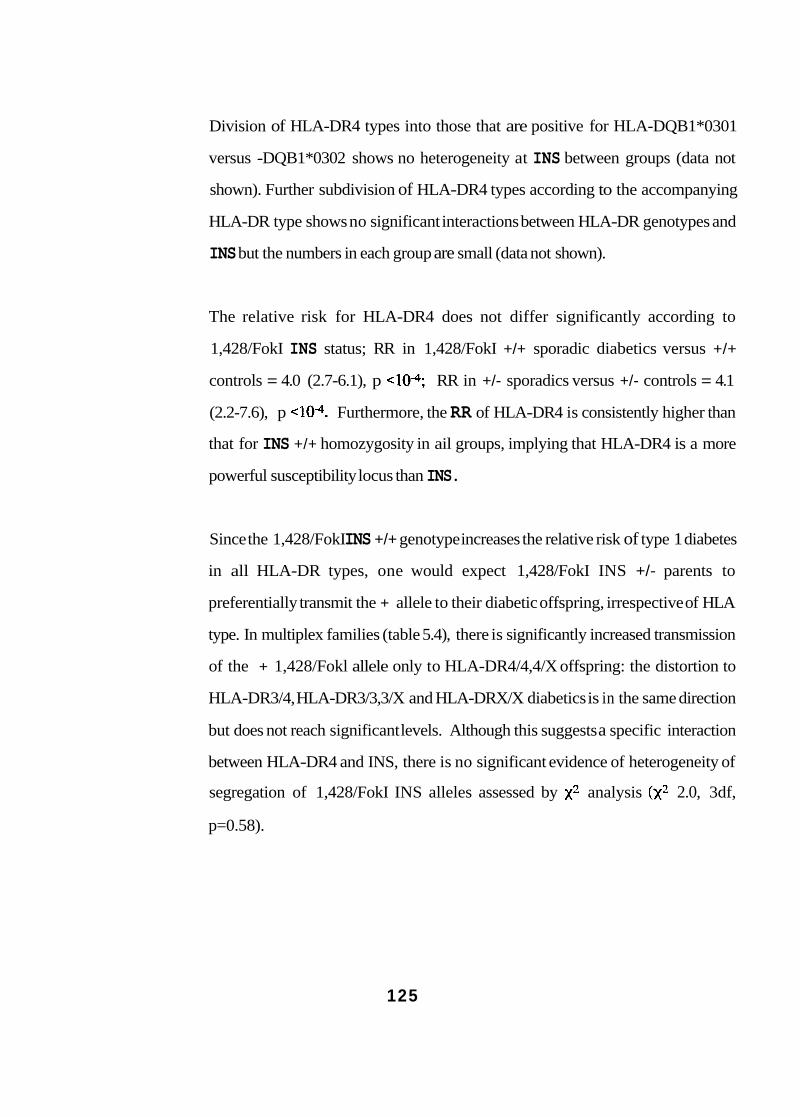
Division of HLA-DR4 types into those that are positive for HLA-DQB1*0301
versus -DQB1*0302 shows no heterogeneity at INS between groups (data not
shown). Further subdivision of HLA-DR4 types according to the accompanying
HLA-DR type shows no significant interactions between HLA-DR genotypes and
INS but the numbers in each group are small (data not shown).
The relative risk for HLA-DR4 does not differ significantly according to
1,428/FokI INS status; RR in 1,428/FokI +/+ sporadic diabetics versus +/+
controls = 4.0 (2.7-6.1), p RR in +/- sporadics versus +/- controls = 4.1
(2.2-7.6), p Furthermore, the RR of HLA-DR4 is consistently higher than
that for INS +/+ homozygosity in ail groups, implying that HLA-DR4 is a more
powerful susceptibility locus than INS.
Since the 1,428/FokI INS +/+ genotype increases the relative risk of type 1 diabetes
in all HLA-DR types, one would expect 1,428/FokI INS +/- parents to
preferentially transmit the + allele to their diabetic offspring, irrespective of HLA
type. In multiplex families (table 5.4), there is significantly increased transmission
of the + 1,428/Fokl allele only to HLA-DR4/4,4/X offspring: the distortion to
HLA-DR3/4, HLA-DR3/3,3/X and HLA-DRX/X diabetics is in the same direction
but does not reach significant levels. Although this suggests a specific interaction
between HLA-DR4 and INS, there is no significant evidence of heterogeneity of
segregation of 1,428/FokI INS alleles assessed by analysis 2.0, 3df,
p=0.58).
125
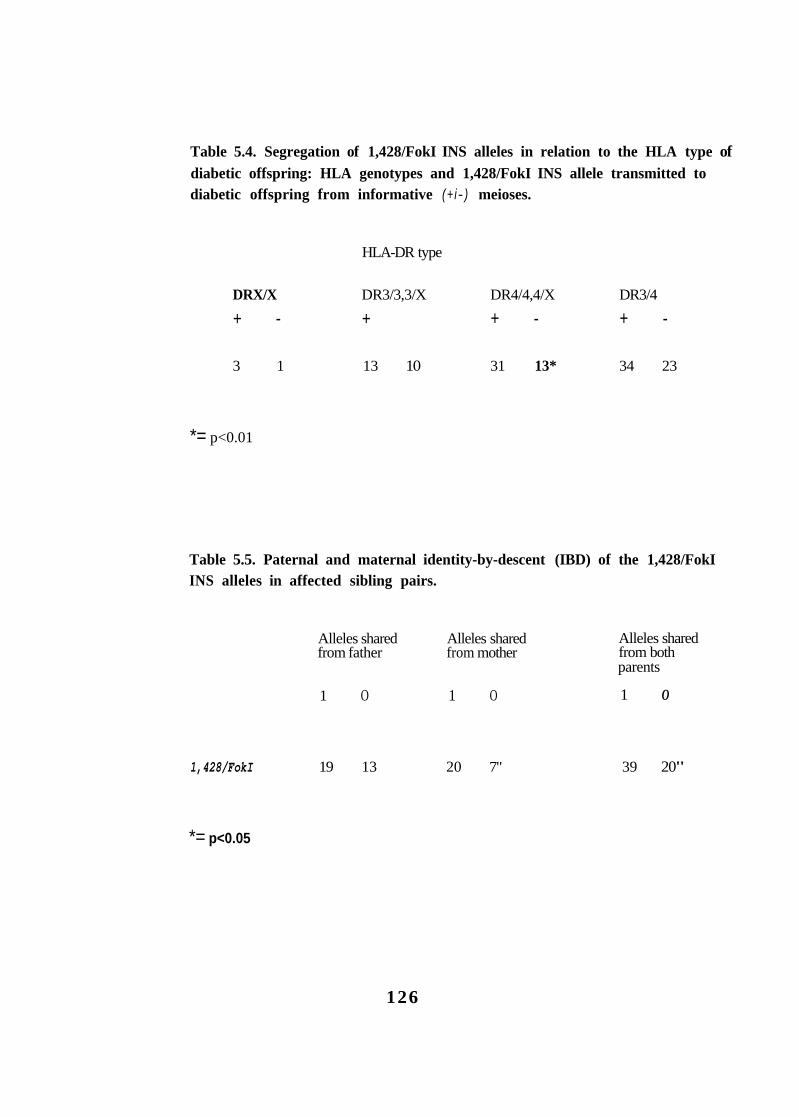
Table 5.4. Segregation of 1,428/FokI INS alleles in relation to the HLA type of diabetic offspring: HLA genotypes and 1,428/FokI INS allele transmitted to diabetic offspring from informative (+ i- ) meioses.
HLA-DR type
DRX/X DR3/3,3/X DR4/4,4/X DR3/4
+ - + + - + -
3 1 13 10 31 13* 34 23
*= p<0.01
Table 5.5. Paternal and maternal identity-by-descent (IBD) of the 1,428/FokI INS alleles in affected sibling pairs.
Alleles shared Alleles shared Alleles shared from father from mother from both
1 O 1 O 1 O
parents
1,428/FokI 19 13 20 7" 39 20"
*= p<0.05
126
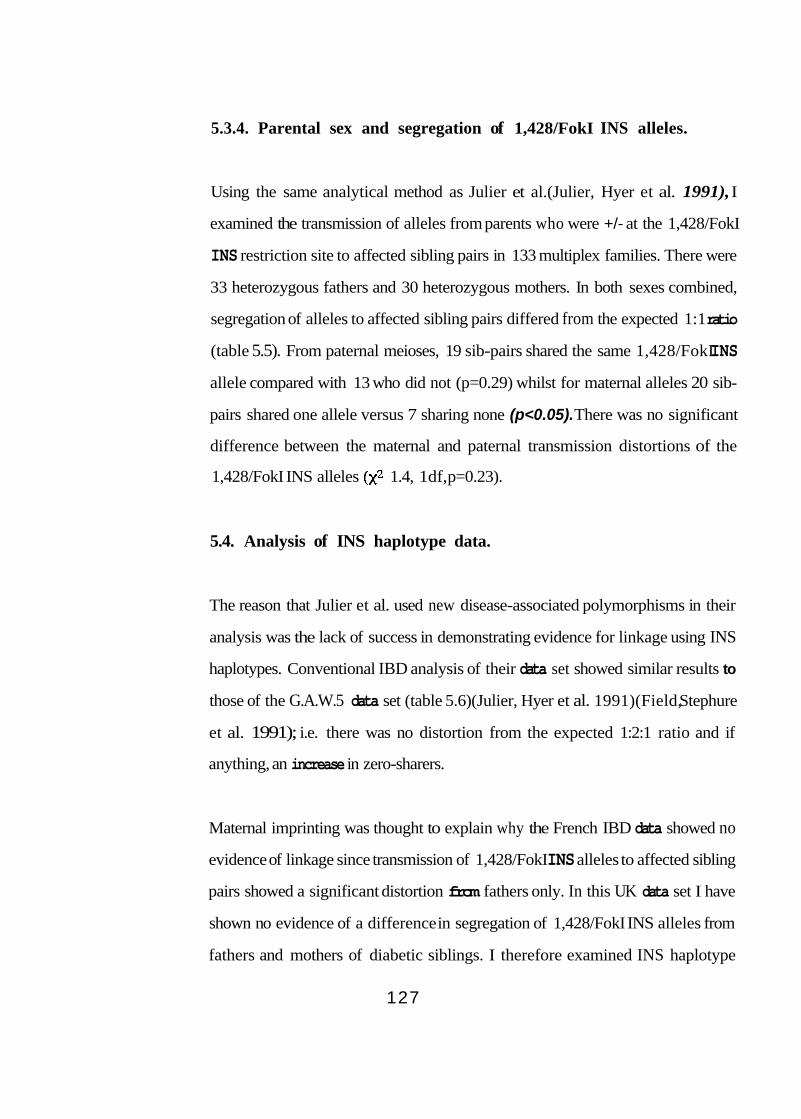
5.3.4. Parental sex and segregation of 1,428/FokI INS alleles.
Using the same analytical method as Julier et al.(Julier, Hyer et al. 1991), I
examined the transmission of alleles from parents who were +/- at the 1,428/FokI
INS restriction site to affected sibling pairs in 133 multiplex families. There were
33 heterozygous fathers and 30 heterozygous mothers. In both sexes combined,
segregation of alleles to affected sibling pairs differed from the expected 1:1 ratio
(table 5.5). From paternal meioses, 19 sib-pairs shared the same 1,428/FokI INS
allele compared with 13 who did not (p=0.29) whilst for maternal alleles 20 sib-
pairs shared one allele versus 7 sharing none (p<0.05). There was no significant
difference between the maternal and paternal transmission distortions of the
1,428/FokI INS alleles 1.4, 1df, p=0.23).
5.4. Analysis of INS haplotype data.
The reason that Julier et al. used new disease-associated polymorphisms in their
analysis was the lack of success in demonstrating evidence for linkage using INS
haplotypes. Conventional IBD analysis of their data set showed similar results to
those of the G.A.W.5 data set (table 5.6)(Julier, Hyer et al. 1991)(Field, Stephure
et al. 1991); i.e. there was no distortion from the expected 1:2:1 ratio and if
anything, an increase in zero-sharers.
Maternal imprinting was thought to explain why the French IBD data showed no
evidence of linkage since transmission of 1,428/FokI INS alleles to affected sibling
pairs showed a significant distortion from fathers only. In this UK data set I have
shown no evidence of a difference in segregation of 1,428/FokI INS alleles from
fathers and mothers of diabetic siblings. I therefore examined INS haplotype
127
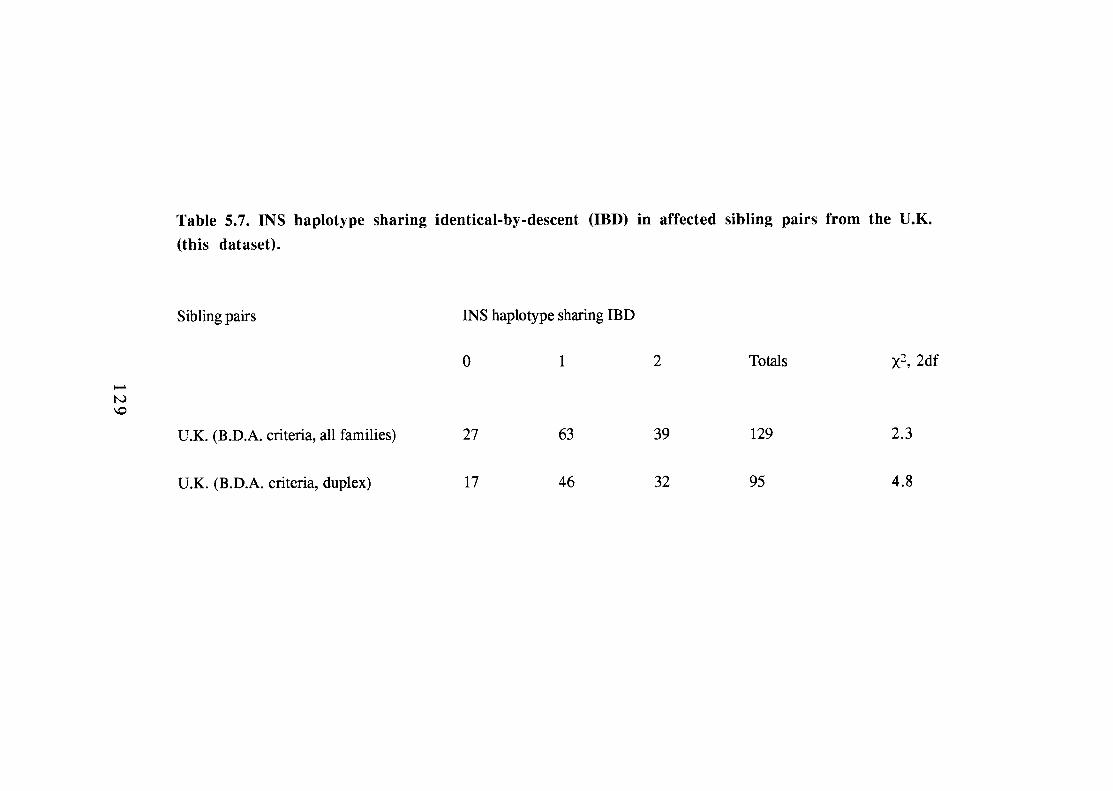
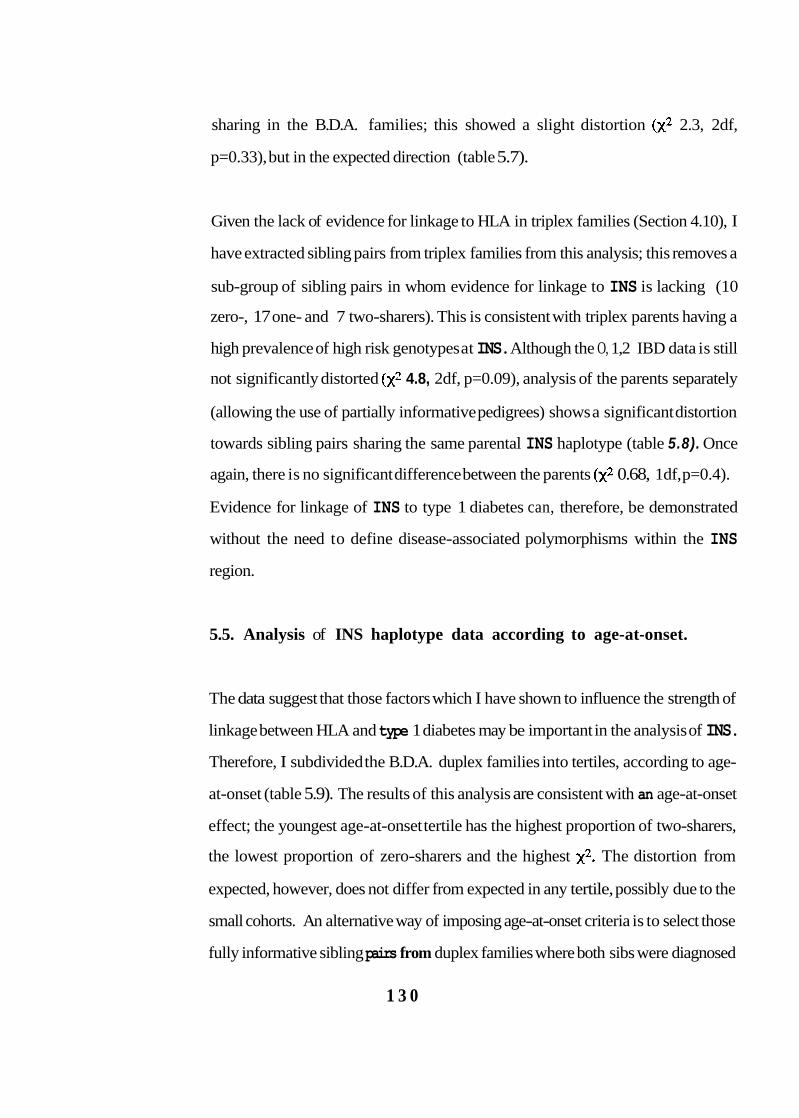
sharing in the B.D.A. families; this showed a slight distortion 2.3, 2df,
p=0.33), but in the expected direction (table 5.7).
Given the lack of evidence for linkage to HLA in triplex families (Section 4.10), I
have extracted sibling pairs from triplex families from this analysis; this removes a
sub-group of sibling pairs in whom evidence for linkage to INS is lacking (10
zero-, 17 one- and 7 two-sharers). This is consistent with triplex parents having a
high prevalence of high risk genotypes at INS. Although the O, 1,2 IBD data is still
not significantly distorted 4.8, 2df, p=0.09), analysis of the parents separately
(allowing the use of partially informative pedigrees) shows a significant distortion
towards sibling pairs sharing the same parental INS haplotype (table 5.8). Once
again, there is no significant difference between the parents 0.68, 1df, p=0.4).
Evidence for linkage of INS to type 1 diabetes can, therefore, be demonstrated
without the need to define disease-associated polymorphisms within the INS
region.
5.5. Analysis of INS haplotype data according to age-at-onset.
The data suggest that those factors which I have shown to influence the strength of
linkage between HLA and type 1 diabetes may be important in the analysis of INS.
Therefore, I subdivided the B.D.A. duplex families into tertiles, according to age-
at-onset (table 5.9). The results of this analysis are consistent with an age-at-onset
effect; the youngest age-at-onset tertile has the highest proportion of two-sharers,
the lowest proportion of zero-sharers and the highest The distortion from
expected, however, does not differ from expected in any tertile, possibly due to the
small cohorts. An alternative way of imposing age-at-onset criteria is to select those
fully informative sibling pairs from duplex families where both sibs were diagnosed
1 3 0
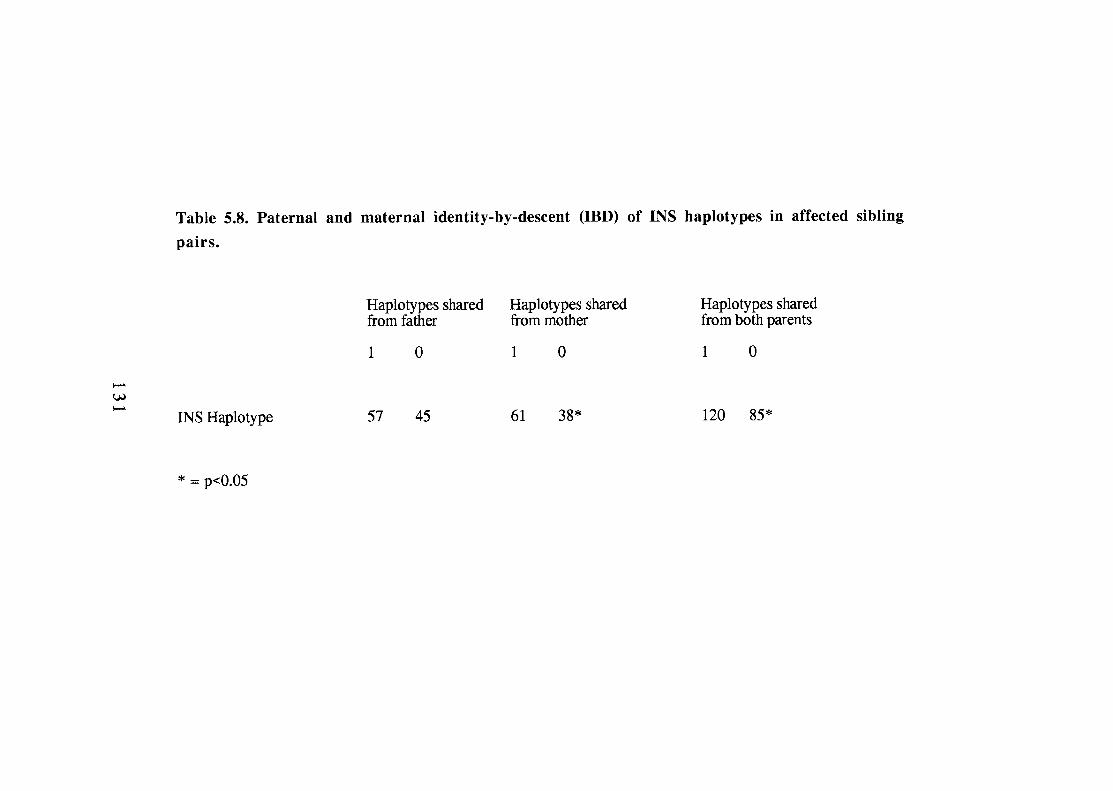
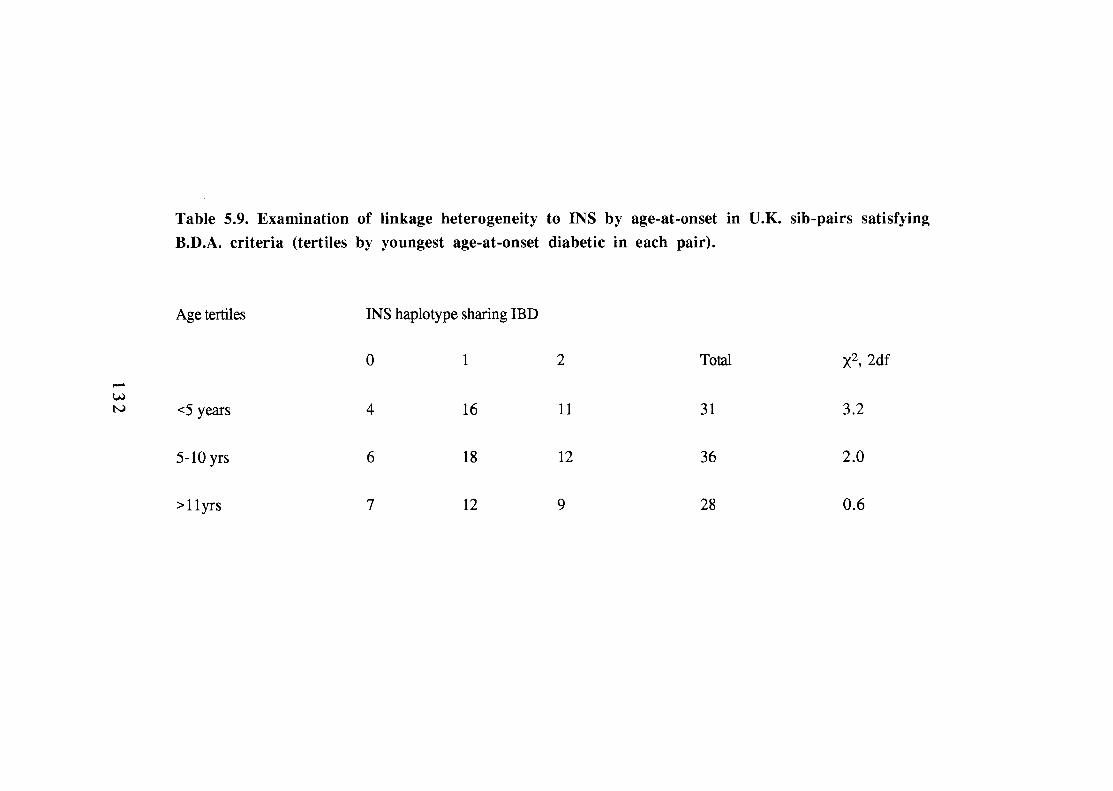
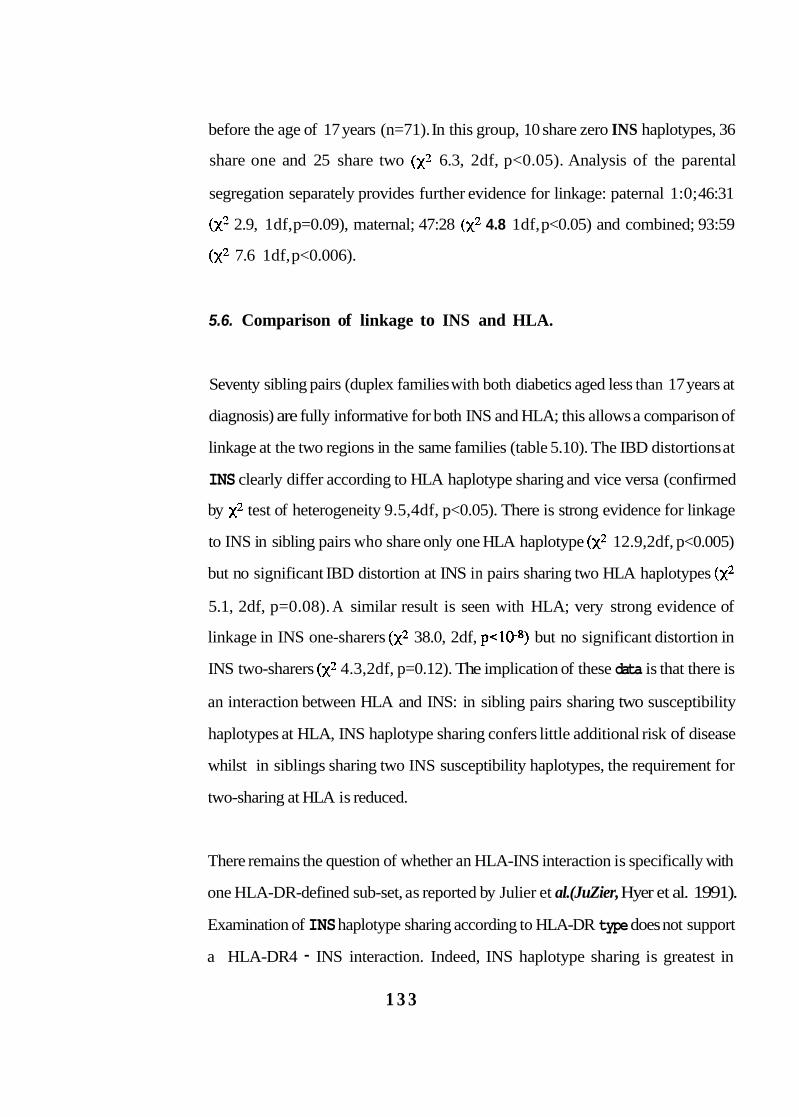
before the age of 17 years (n=71). In this group, 10 share zero INS haplotypes, 36
share one and 25 share two 6.3, 2df, p<0.05). Analysis of the parental
segregation separately provides further evidence for linkage: paternal 1:0; 46:31
2.9, 1df, p=0.09), maternal; 47:28 4.8 1df, p<0.05) and combined; 93:59
7.6 1df, p<0.006).
5.6. Comparison of linkage to INS and HLA.
Seventy sibling pairs (duplex families with both diabetics aged less than 17 years at
diagnosis) are fully informative for both INS and HLA; this allows a comparison of
linkage at the two regions in the same families (table 5.10). The IBD distortions at
INS clearly differ according to HLA haplotype sharing and vice versa (confirmed
by test of heterogeneity 9.5,4df, p<0.05). There is strong evidence for linkage
to INS in sibling pairs who share only one HLA haplotype 12.9,2df, p<0.005)
but no significant IBD distortion at INS in pairs sharing two HLA haplotypes
5.1, 2df, p=0.08). A similar result is seen with HLA; very strong evidence of
linkage in INS one-sharers 38.0, 2df, but no significant distortion in
INS two-sharers 4.3,2df, p=0.12). The implication of these data is that there is
an interaction between HLA and INS: in sibling pairs sharing two susceptibility
haplotypes at HLA, INS haplotype sharing confers little additional risk of disease
whilst in siblings sharing two INS susceptibility haplotypes, the requirement for
two-sharing at HLA is reduced.
There remains the question of whether an HLA-INS interaction is specifically with
one HLA-DR-defined sub-set, as reported by Julier et al.(JuZier, Hyer et al. 1991).
Examination of INS haplotype sharing according to HLA-DR type does not support
a HLA-DR4 - INS interaction. Indeed, INS haplotype sharing is greatest in
1 3 3
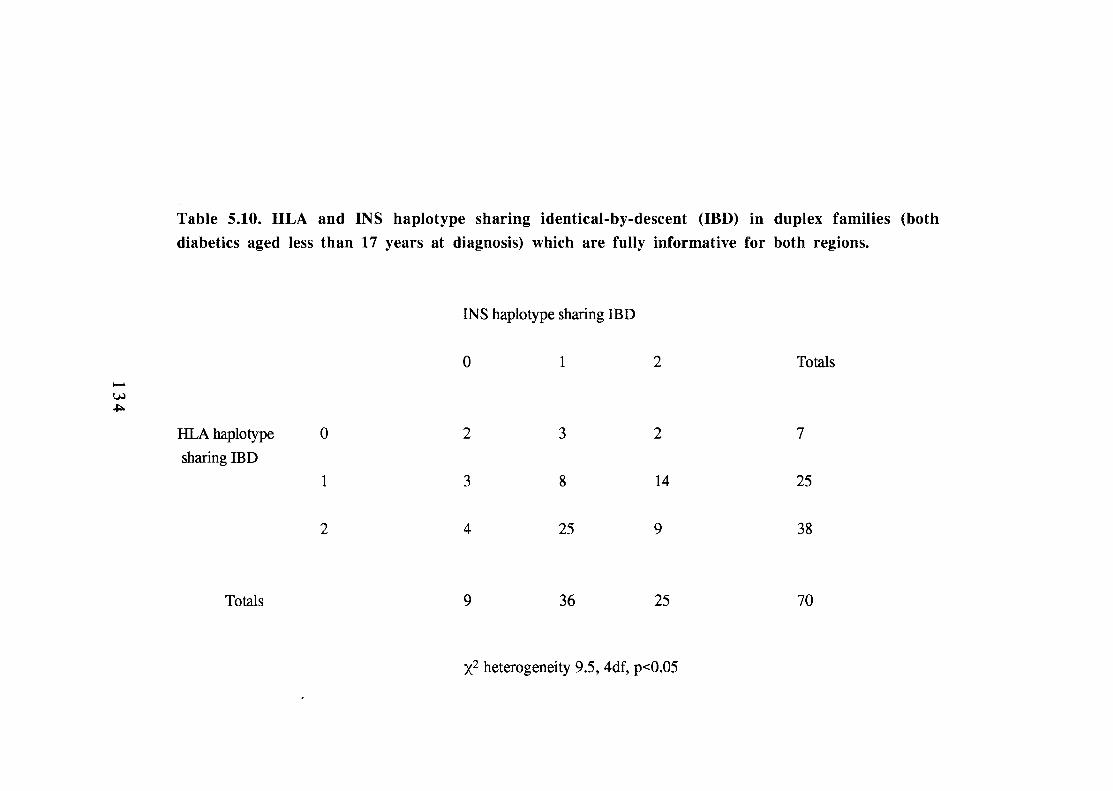
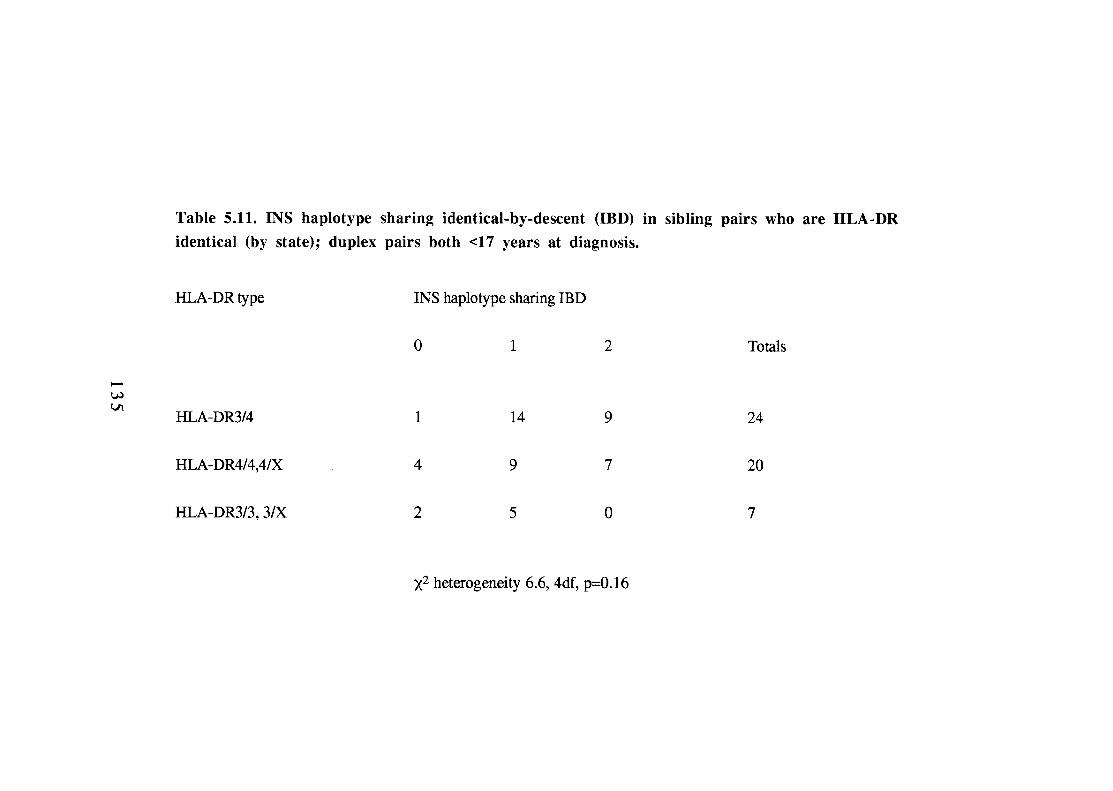
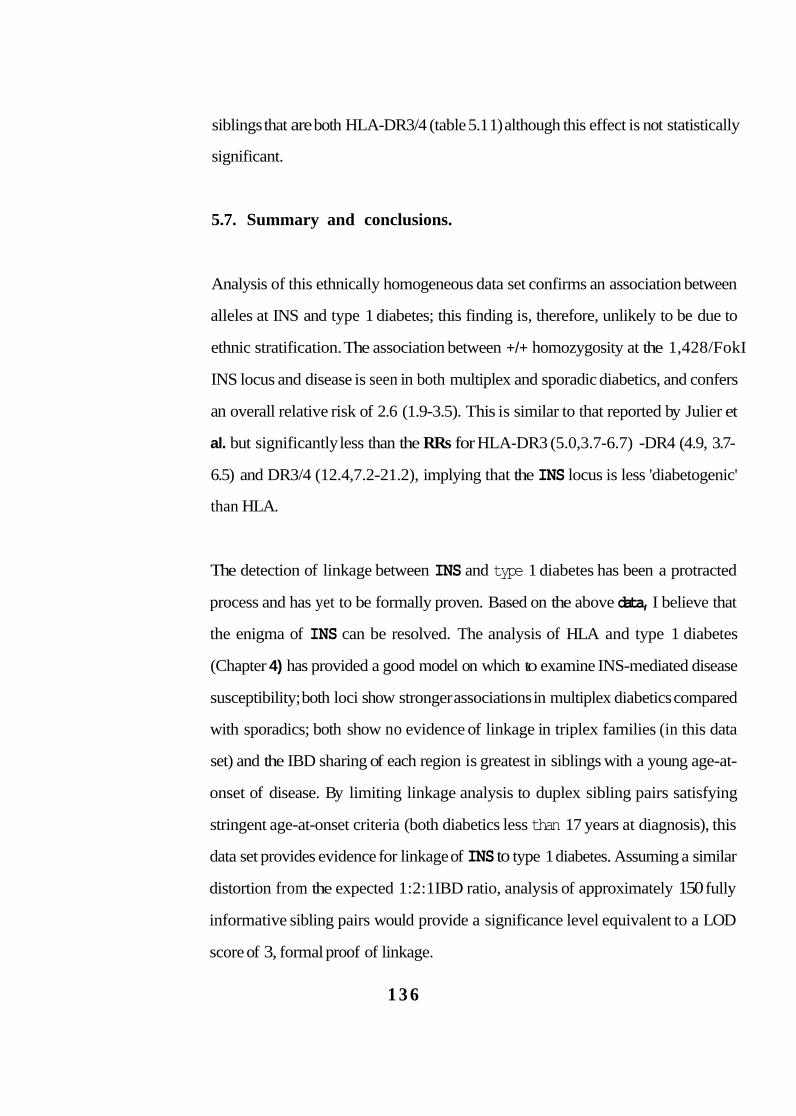
siblings that are both HLA-DR3/4 (table 5.1 1) although this effect is not statistically
significant.
5.7. Summary and conclusions.
Analysis of this ethnically homogeneous data set confirms an association between
alleles at INS and type 1 diabetes; this finding is, therefore, unlikely to be due to
ethnic stratification. The association between +/+ homozygosity at the 1,428/FokI
INS locus and disease is seen in both multiplex and sporadic diabetics, and confers
an overall relative risk of 2.6 (1.9-3.5). This is similar to that reported by Julier et
al. but significantly less than the RRs for HLA-DR3 (5.0,3.7-6.7) -DR4 (4.9, 3.7-
6.5) and DR3/4 (12.4,7.2-21.2), implying that the INS locus is less 'diabetogenic'
than HLA.
The detection of linkage between INS and type 1 diabetes has been a protracted
process and has yet to be formally proven. Based on the above data, I believe that
the enigma of INS can be resolved. The analysis of HLA and type 1 diabetes
(Chapter 4) has provided a good model on which to examine INS-mediated disease
susceptibility; both loci show stronger associations in multiplex diabetics compared
with sporadics; both show no evidence of linkage in triplex families (in this data
set) and the IBD sharing of each region is greatest in siblings with a young age-at-
onset of disease. By limiting linkage analysis to duplex sibling pairs satisfying
stringent age-at-onset criteria (both diabetics less than 17 years at diagnosis), this
data set provides evidence for linkage of INS to type 1 diabetes. Assuming a similar
distortion from the expected 1:2:1 IBD ratio, analysis of approximately 150 fully
informative sibling pairs would provide a significance level equivalent to a LOD
score of 3, formal proof of linkage.
1 3 6
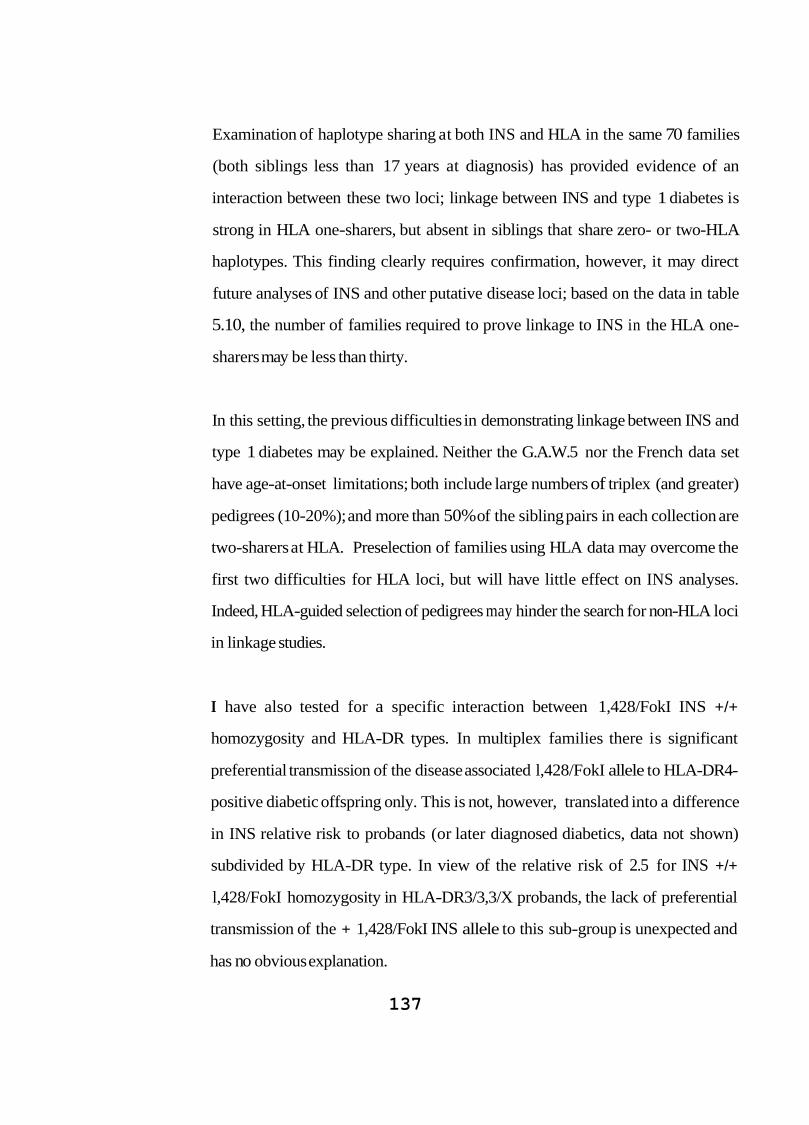
Examination of haplotype sharing at both INS and HLA in the same 70 families
(both siblings less than 17 years at diagnosis) has provided evidence of an
interaction between these two loci; linkage between INS and type 1 diabetes is
strong in HLA one-sharers, but absent in siblings that share zero- or two-HLA
haplotypes. This finding clearly requires confirmation, however, it may direct
future analyses of INS and other putative disease loci; based on the data in table
5.10, the number of families required to prove linkage to INS in the HLA one-
sharers may be less than thirty.
In this setting, the previous difficulties in demonstrating linkage between INS and
type 1 diabetes may be explained. Neither the G.A.W.5 nor the French data set
have age-at-onset limitations; both include large numbers of triplex (and greater)
pedigrees (10-20%); and more than 50% of the sibling pairs in each collection are
two-sharers at HLA. Preselection of families using HLA data may overcome the
first two difficulties for HLA loci, but will have little effect on INS analyses.
Indeed, HLA-guided selection of pedigrees may hinder the search for non-HLA loci
in linkage studies.
I have also tested for a specific interaction between 1,428/FokI INS +/+
homozygosity and HLA-DR types. In multiplex families there is significant
preferential transmission of the disease associated l,428/FokI allele to HLA-DR4-
positive diabetic offspring only. This is not, however, translated into a difference
in INS relative risk to probands (or later diagnosed diabetics, data not shown)
subdivided by HLA-DR type. In view of the relative risk of 2.5 for INS +/+
l,428/FokI homozygosity in HLA-DR3/3,3/X probands, the lack of preferential
transmission of the + 1,428/FokI INS allele to this sub-group is unexpected and
has no obvious explanation.
137
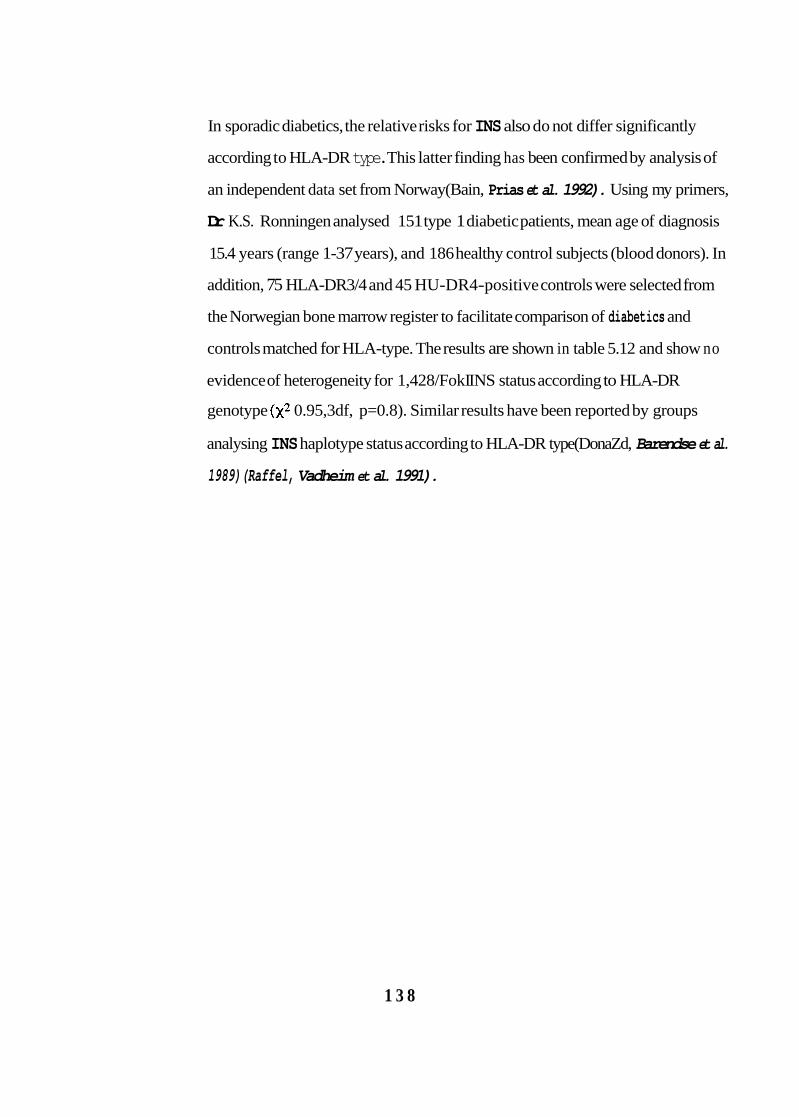
In sporadic diabetics, the relative risks for INS also do not differ significantly
according to HLA-DR type. This latter finding has been confirmed by analysis of
an independent data set from Norway(Bain, Prias et al. 1992). Using my primers,
Dr K.S. Ronningen analysed 15 1 type 1 diabetic patients, mean age of diagnosis
15.4 years (range 1-37 years), and 186 healthy control subjects (blood donors). In
addition, 75 HLA-DR3/4 and 45 HU-DR4-positive controls were selected from
the Norwegian bone marrow register to facilitate comparison of diabetics and
controls matched for HLA-type. The results are shown in table 5.12 and show no
evidence of heterogeneity for 1,428/FokI INS status according to HLA-DR
genotype 0.95,3df, p=0.8). Similar results have been reported by groups
analysing INS haplotype status according to HLA-DR type(DonaZd, Barendse et al.
1989)(Raffel, Vadheim et al. 1991).
1 3 8
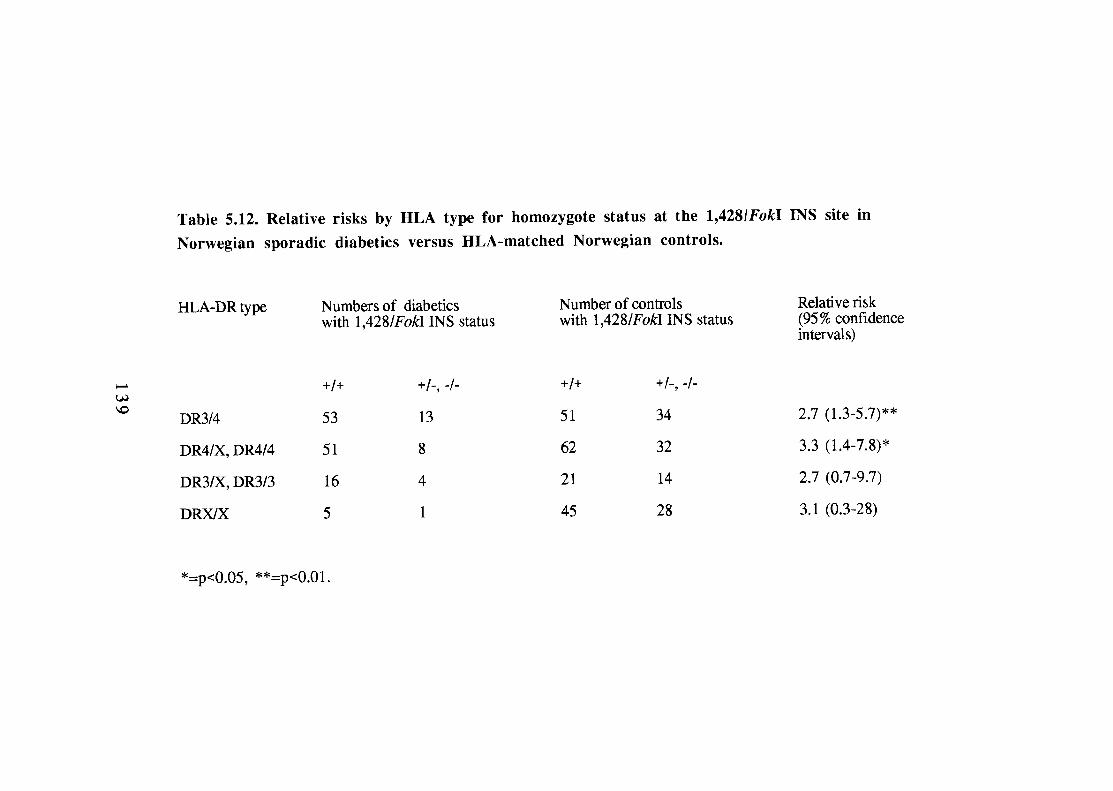
CHAPTER 6
ANALYSIS OF HLA TRANSMISSION
140
6.1. Introduction
In multiplex families, susceptibility haplotypes carrying HLA-DR3 and -DR4 are
preferentially transmitted from parents to diabetic offspring. This is entirely
expected since families are selected on the basis of their multiply affected offspring
and HLA-DR3 and -DR4 are susceptibility haplotypes for disease. During the past
10 years, however, many studies have reported effects which imply that the
inheritance of HLA susceptibility may be more complicated than this. There are
reports that male diabetics (and unaffected fathers) are more likely to transmit HLA-
DR4 to their diabetic offspring than are diabetic mothers(Vadheim, Rutter et al.
1986). It has also been suggested that maternal HLA susceptibility haplotypes may
impart risk to offspring, irrespective of whether or not they are inherited(Rubinstein
1991). In addition, diabetic HLA-DR3/4 heterozygotes are said to inherit paternal
HLA-DR4 haplotypes significantly more frequently than maternal (Deschamps,
Hors et al. 1990); this implies a parent-of-origin effect on HLA mediated
susceptibility.
There are other reports of modulation of HLA-DR mediated susceptibility in
multiplex diabetics, unrelated to parental effects. HLA-DR type has been found to
vary according to the affection status of the diabetic offspring (i.e. whether they are
the proband or later affected)(Rubinstein, Walker et al. 1986). It has also been
reported that haplotype sharing is dependent upon the HLA-DR status of the
proband in multiplex families(Rutter, Vadheim et al. 1987). The implication of
these findings is that the risk to siblings of type 1 diabetics is dependent upon HLA-
DR status of the proband.
141
These results have two important consequences. First, they may provide important
mechanistic insights into HLA mediated susceptibility to type 1 diabetes. Second,
they imply that population screening for type 1 diabetes using genetic markers
(Section 1.4.5) will be fraught with difficulties since risk assessment could not be
solely based upon an individual's genotype; one would also need to know the
genotypes of parents and siblings (at least). Replication of these findings is clearly
essential. In this chapter, I examine this data set for evidence to support these
reports.
6.2. Effects of parental sex on HLA-inherited susceptibility to type 1
diabetes
6.2.1. Transmission of HLA-DR4 and HLA-DR3 from parents to
diabetic offspring
In 1984, Warram et al. reported that type 1 diabetes was transmitted less frequently
to the offspring of diabetic mothers than to those of diabetic fathers (1.3 versus
6.1%, p<0.05) (Warram, Krolewski et al. 1984). Although the numbers reported
were small (13 diabetics from 419 offspring), the result was consistent with a
review of published data. Degnbol and Green had reported a cumulative risk of
diabetes of 4.2% by age 20 for offspring of diabetic fathers and 1.8% for offspring
of mothers(Degnbol and Green 1978). Reanalysis of the prevalence rates of
'juvenile-onset diabetes' in Prince Edward Island, Canada also showed lower rates
of diabetes in the offspring of diabetic mothers(Simpson 1969). Further support
for this finding came from prevalence studies of diabetes in parents of newly
diagnosed type 1 diabetics; the frequency of diabetes was higher in fathers than in
142
mothers in both Pittsburgh and Sweden(Wagener, Sacks et al. 1982) (Dahlquist,
Gustavsson et al. 1982).
In 1986, Vadheim et ai. seemed to provide a 'genetic' mechanism for the difference
in risk to offspring of diabetic parents(Vadheim, Rotter et al. 1986). They reported
that fathers with an HLA-DR4 allele were more likely to transmit this allele to their
diabetic and non-diabetic children than were mothers (72.1 versus 55.6%,
p<0.001). Although this paper was severely criticised(Falk, Field et al. 1987),
subsequent examination of the G.A.W.5 data set showed a similar parental
difference in the transmission of HLA-DR4-carrying haplotypes to diabetic
offspring; namely, healthy HLA-DR4/X fathers were significantly more likely to
transmit HU-DR4 than were mothers(Field 1989). Field has subsequently added
more data from GAW4 simplex pedigrees and her own Calgary data set, confirming
this effect (L.L. Field, personal communication).
I analysed 168 multiplex families for an effect of parental sex on the transmission
of HLA-DR3 and -DR4 haplotypes to offspring in multiplex families. As expected,
there is significant preferential transmission of HLA-DR3-positive haplotypes to
diabetic offspring from HLA-DR3/X fathers and mothers (X is any HLA-DR
antigen other than DR3 and DR4) (table 6.1). Similarly, transmission of HLA-DR4
to diabetics is significantly increased from both parents. In contrast to the previous
reports, however, there is no difference between parents concerning the
transmission of these haplotypes (HLA-DR3; p=0.51, HLA-DR4; p=0.44).
Consistent with these findings, the highly significant increase in HLA haplotype
sharing in affected sibling-pairs (ASPs) is independent of parental sex; ASPs share
120/176 paternal haplotypes and 118/179 maternal Segregation
1 4 3
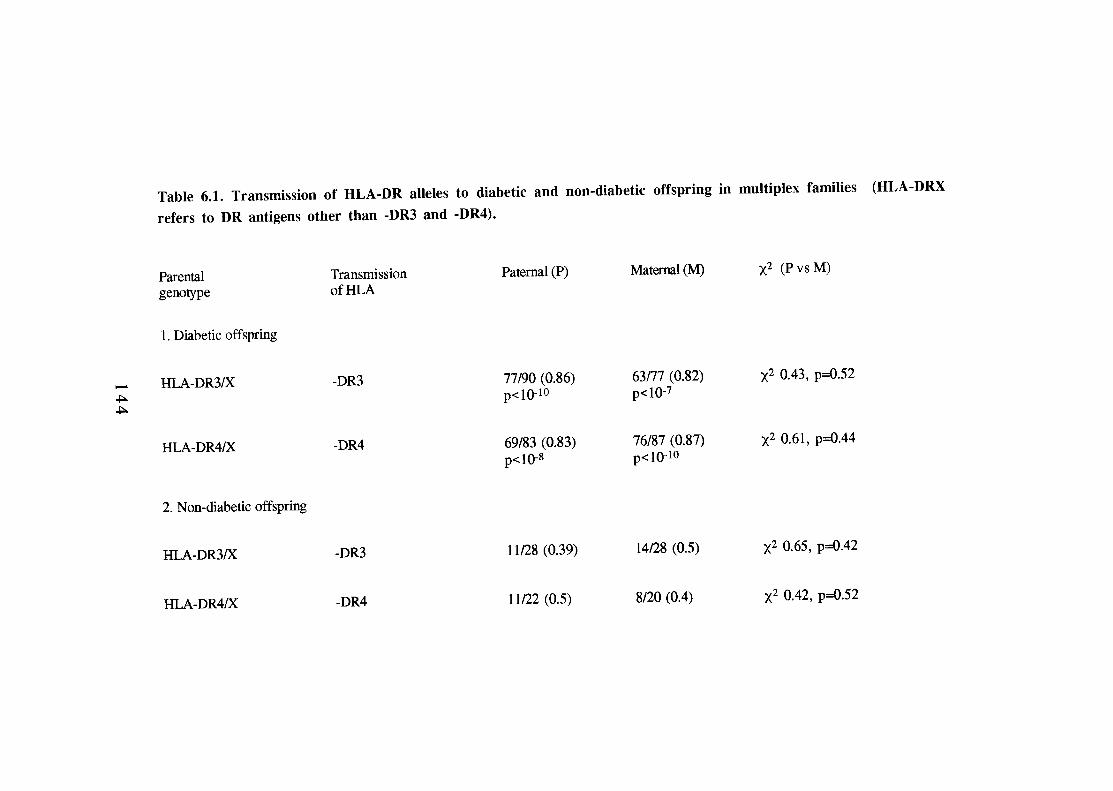
of HLA-DR3 and -DR4 haplotypes to unaffected siblings does not differ from the
expected 1: 1 ratio in either parent (table 6.1).
These data provide no support for a parental difference in the transmission of HLA-
DR4 (or HLA-DR3) to diabetic offspring and implies that, if such a phenomenon
does exist, it's effect is minor in this ethnic group. It is of interest that a large study
of simplex type 1 diabetic pedigrees in France (n=174) has also failed to confirm a
paternal HLA-DR4 effect(Thivolet, Beaufrere et al. 1988). The reasons for these
differences between data sets is not clear, however, it is of note that in the
G.A.W.5 data set there is a significant difference in HLA-DR susceptibility types in
fathers compared with mothers (table 6.2, p<0.03). A similar trend was also
reported in the population studied by Vadheim et al. (Vadheim, Rotter et al. 1986).
6.2.2. Analysis of the effects of non-inherited HLA antigens.
Rubinstein et al. have suggested that maternal HLA antigens (specifically HLA-
DR4 and -DR6) may affect susceptibility to type 1 diabetes in offspring irrespective
of whether or not they are inherited(Rubinstein and Ginsberg-Fellner
1990) (Rubinstein 1991). Such an effect of non-inherited maternal antigens
(NIMAs) has recently been reported in rheumatoid arthritis, another autoimmune
condition associated with HLA-DR4 (ten Wolde, Breedveld et al. 1993). It has been
postulated that both 'self ' HLA antigens and NIMAs may influence thymic
selection of the T-cell repertoire in-utero and hence, susceptibility to disease in later
life. Such a hypothesis could account for differences in parental transmission of
disease, according to whether NIMAs were protecting or promoting disease
susceptibility.
1 4 5
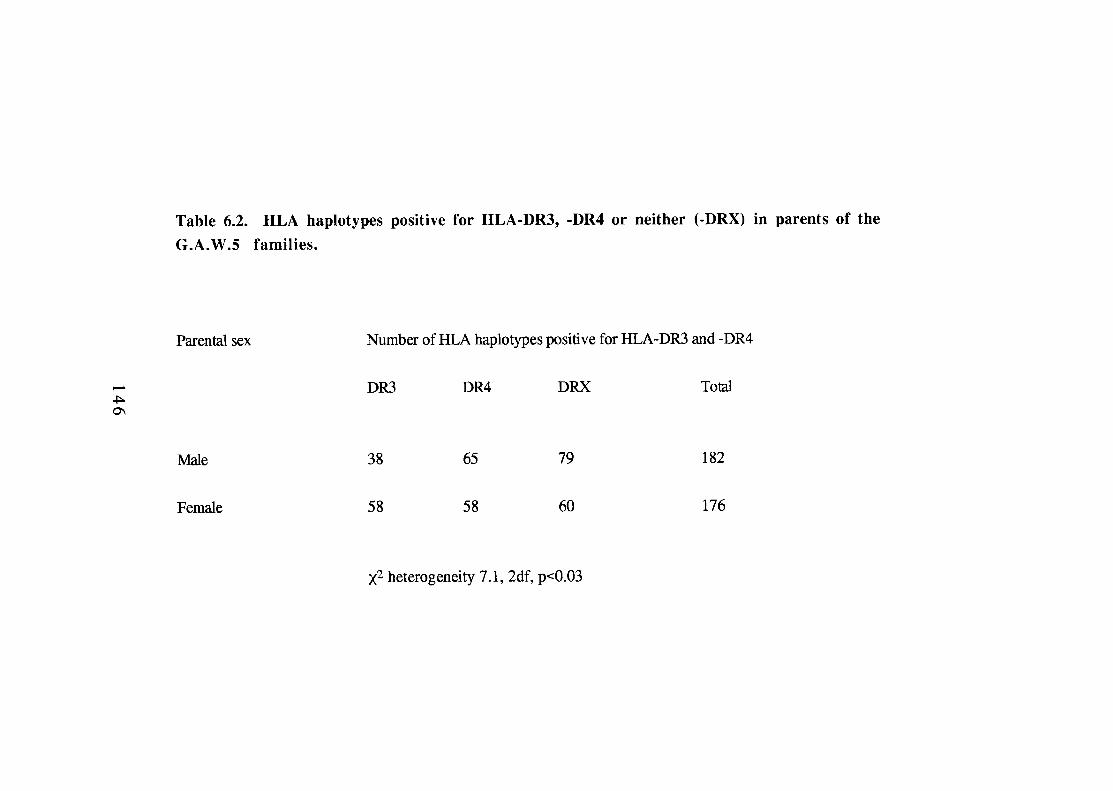
If NIMAs are exerting an effect, one might expect to see a difference in parental
HLA types. Specifically, in multiplex families, mothers would carry fewer
susceptibility alleles than fathers (since HLA-DR3 and -DR4 need not be inherited
to promote susceptibility) and/or they would be less likely to be HLA-DR2-positive
(since this would tend to protect offspring). I analysed 168 multiplex families for
differences in parental HLA-DR antigens. For HLA-DR3 and -DR4, the phenotype
and genotype frequencies in the parents in this data set are almost identical (table
6.3). There is also no difference between the frequencies of non-inherited paternal
antigens (NIPAs) and NIMAS (p=0.82) (table 6.4).
For all of the 10 HLA-DR specificities tested by serology, there is no significant
difference between parents (data not shown, p=0.15); indeed, HLA-DR2 is more,
rather than less, frequent in mothers but this difference is not significant when the
number of specificities tested is taken into account (pc=0.1). I also find no
significant differences between the proportions of NIMAs and NIPAs not inherited
by diabetics (table 6.5). Of the 75 diabetic offspring who were HLA-DR4-
negative, twenty-five had fathers with a non-inherited DR4 haplotype and twenty
had DR4-positive NIMAs (data not shown, p=0.37); again this is not consistent
with non-inherited maternal HLA-DR4 haplotypes influencing susceptibility.
If NIMAs were exerting an influence upon disease susceptibility, one would expect
a difference in non-inherited HLA types between mothers and fathers. No such
differences are seen in this data set. Indeed, the proportions of paternal and
maternal antigens which are not transmitted to diabetics are almost identical in all
HLA-DR types analysed. Furthermore, diabetics who did not inherit HLA-DR4 are
no more likely to have a DR4-positive mother than father. In addition, the specific
147
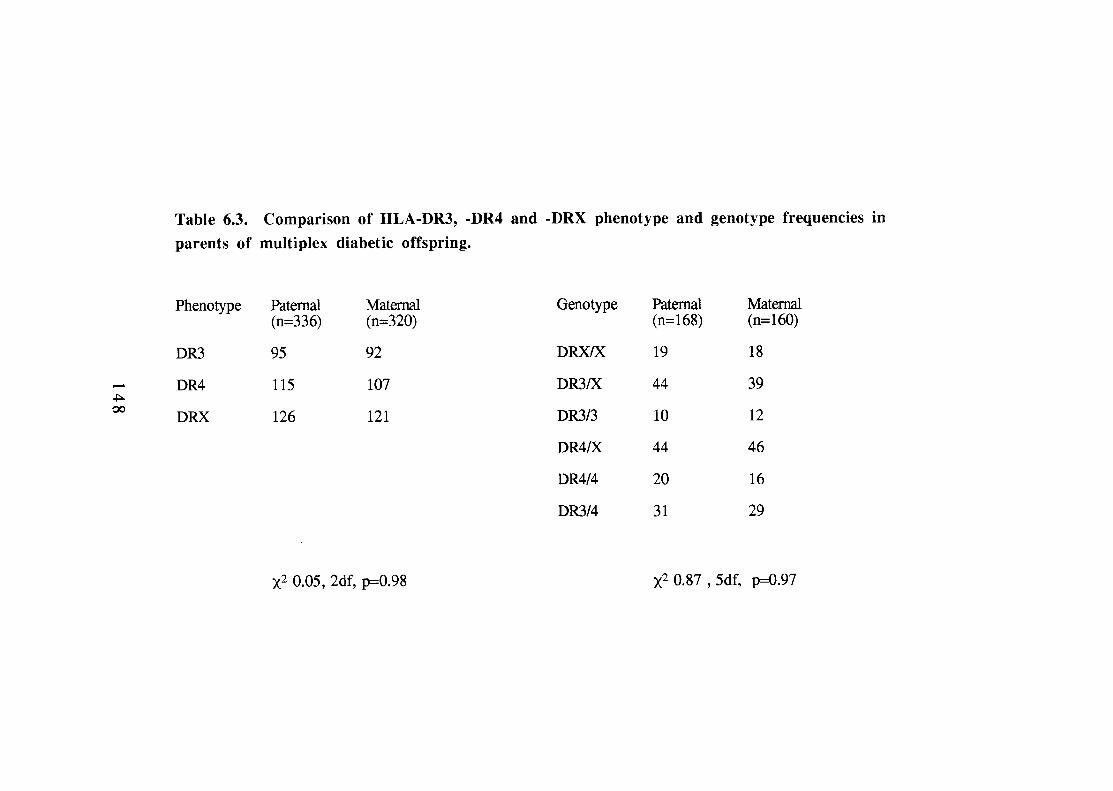
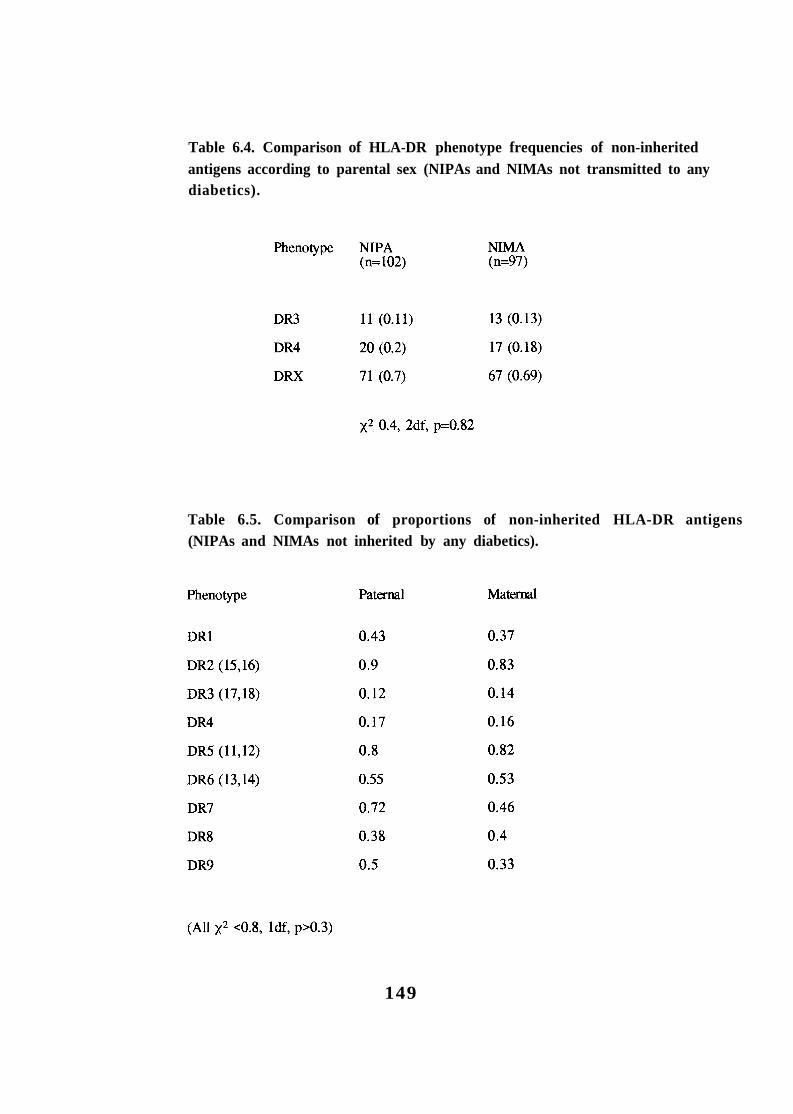
Table 6.4. Comparison of HLA-DR phenotype frequencies of non-inherited antigens according to parental sex (NIPAs and NIMAs not transmitted to any diabetics).
Table 6.5. Comparison of proportions of non-inherited HLA-DR antigens (NIPAs and NIMAs not inherited by any diabetics).
149
differences observed by Rubinstein et al (increased HLA-DRw6 and decreased
HLA-Bw62,DR4 in mothers compared with fathers) are absent (Rubinstein and
Ginsberg-Fellner 1990); I observe HLA-DR6-positive haplotypes in 25 fathers and
19 mothers and HLA-B62, DR4 haplotypes account for 17/334 (0.05) paternal and
23/320 (0.07) maternal haplotypes (data not shown).
6.2.3. Summary and conclusions.
I have examined this data set for parental effects on HLA inherited susceptibility
and find no evidence to support either preferential transmission of HLA-DR4 from
fathers to diabetic offspring nor an effect of NIMAs. If these phenomena exist, then
they are of minor importance in this population. It is possible that the differences
between these data and previous reports are due to ethnic differences. It is more
likely, however, that the original observations were erroneous (at least in terms of
magnitude) and due to the study of relatively small numbers. This highlights the
need for replication of data, especially when findings are unexpected.
These data may also question the dogma that diabetic mothers are less likely to have
diabetic offspring than are diabetic fathers. It is of note that in Warram et al's study,
88 male diabetics produced 244 children compared with 175 children from 99
affected females 10.6, 1df, p<0.001 assuming an expectation of equal
fecundity) (Warram, Krolewskì et al. 1984). This highlights a possible effect (noted
by Warram et al.) of increased spontaneous abortion and high perinatal mortality
rates in type 1 diabetic patients. At the time of that retrospective study, a substantial
proportion of diabetic pregnancies ended in foetal death. This alone could account
for the differences reported (1 1 diabetics born to type 1 fathers versus 2 to mothers)
150
and selective loss of 'potentially diabetic' foetuses (postulated by some authors) is
not required.
To date, there are no studies comparable to that of Warram et al. The effect of
reduced fecundity would not be detected by analyses which assess risk of parental
type 1 diabetes in families ascertained by the presence of diabetic offspring.
Further, these studies are prone to difficulties relating to the age-at-onset of disease,
for example, in this data set, over half of the affected parents were diagnosed after
the birth of their diabetic offspring. Furthermore, I have shown that type 1 diabetes
developing after puberty is more likely to affect males (fathers) than females
(Section 4.3); this can hardly be regarded as 'transmission of disease'.
Improvements in diabetic-obstetric care have led to an outcome in diabetic
pregnancy which is now comparable with that in non-diabetics. Further studies
under present conditions of improved foetal mortality should resolve the issue of
parental transmission of diabetes. Until then genetic counselling of type 1 diabetics
should be practised with caution.
6.3. Parental origin of HLA-DR types in HLA-DR3/4 heterozygote
diabetics.
In 1990, Deschamps et al analysed the inheritance of HLA-DR3 and -DR4
haplotypes from fathers and mothers to the probands, later-affected diabetics and
unaffected offspring of 246 simplex and 121 multiplex families (including 80
G.A.W.5 families)(Deschamps, Hors et al. 1990). They reported that in the DR3/4-
positive probands and affected siblings, the paternal and maternal HU-DR3 and -
1 5 1
DR4 antigens were not distributed randomly; 0.62 and 0.72 respectively received
HLA-DR4 from their father and -DR3 from their mother (DR3m/DR4p). This result
differed significantly from the expected 1:1 ratio and was not observed in
unaffected siblings. Once again, this has important implications for risk
assessment, since HLA-DR3/4 siblings with DR3m/DR4p were found to have a
significantly higher risk for disease than those who did not. I have analysed 78
probands, 74 later-affected diabetics and 17 unaffected offspring for this effect.
In the family data set, the parental origin of HLA-DR3 (and/or -DR4) in HLA-
DR3/4 diabetics does not differ from the expected 1:1 ratio (table 6.6). Any
suggestion of a trend towards increased inheritance of paternal HLA-DR4 seen in
the probands is also present in the small numbers of unaffected offspring, which act
as controls 0.5, 1df, p=0.47).
Once again, the results from this multiplex data set do not support a report in the
literature(Deschamps, Hors et al. 1990). Closer examination of the Deschamps'
paper, however, shows that the effect described was also not significant in French
simplex families (DR3m/DR4p found in 46/81 diabetics, versus expected 1.5,
1df, p=0.22, vs unaffected offspring 1.28, 1df, p=0.26). In French multiplex
families, the effect was seen comparing the total affected offspring with expected
(23134, 4.2,1df, p=0.04) but not when they were compared with unaffected
DR3/4 multiplex siblings 3.29, 1df, ~ 0 . 0 7 ) . That is to say, the finding was
very weak in French subjects. In fact, the major effect came from the G.A.W.5
multiplex data set. As mentioned previously (Section 6.2.1), the HU-DR types of
fathers and mothers differ significantly in G.A.W.5, with decreased levels of
paternal HLA-DR3 and slightly increased HU-DR4 (table 6.2). Until the effect of
these parental differences is controlled for, the relevance of Deschamps' finding can
152
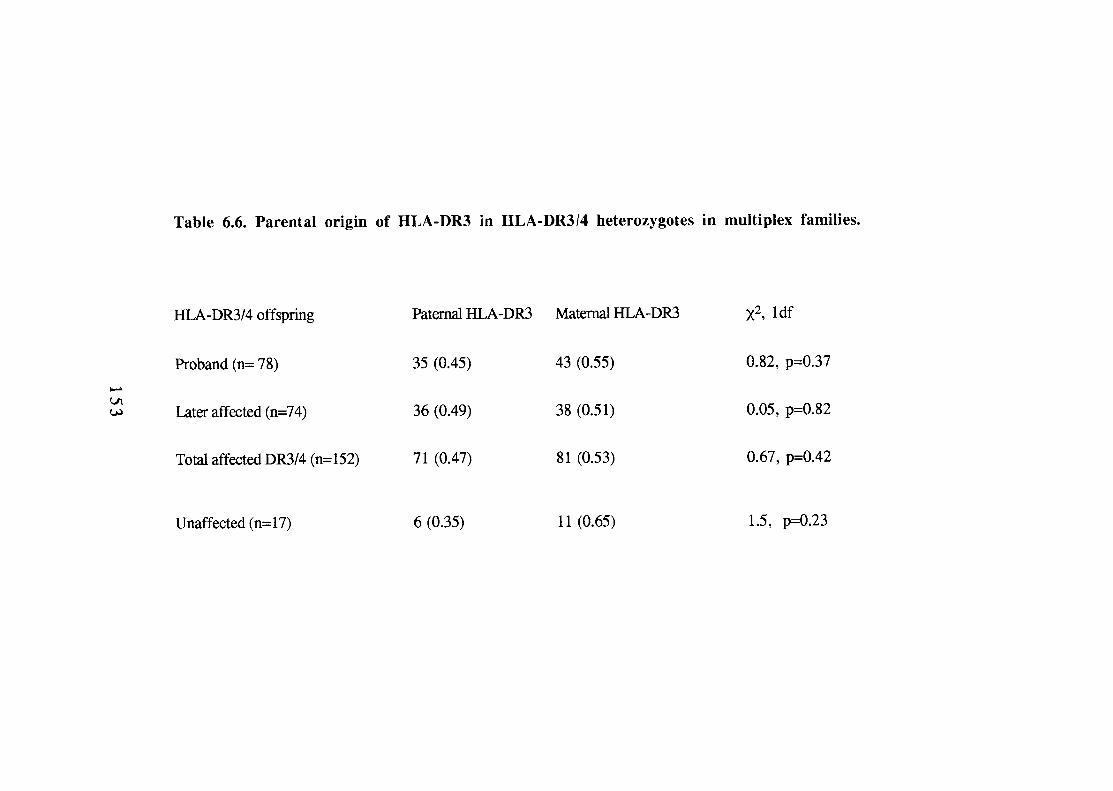
be questioned. It is also of note that the increased relative risk of 3.3 for
DR3m/DR4p over DR3/4 alone in that paper was calculated by comparing affected
multiplex offspring (0.68 G.A.W.5) with only French unaffected offspring, a
manoeuvre not justified in the text.
6.4. Differences between proband and later-affected offspring in
multipiex families.
6.4.1. HLA-DR status of proband versus later-affected offspring.
A persistent characteristic of virtually all type 1 diabetic samples is a higher than
expected frequency of HLA-DR3/4 heterozygotes. It has been observed that in
some multiplex samples, the HLA-DR distribution is different for the first affected
offspring in a family compared to subsequent affected offspring. Rubinstein
reported that the proband in multiplex families showed an excess of HLA-DR3/4
but this was markedly reduced in the second- and later-affecteds(Rubinstein,
Walker et al. 1986). Falk reported that in a combined sample from the Genetic
Analysis Workshop 4 (GAW4) and the HLA80 workshop, 55 % of the first affected
were HLA-DR3/4 compared to 40% of the second affected(Falk 1987).
Rubinstein et al. went on to examine HLA-DR3/4 excess in multiplex families with
so-called "conducive" parents. These are families in which only one DR3/4
combination can be inherited, i.e. parental combinations of HLA-DR3k vs -
DR4/X, -DR3/X vs -DR3/4, -DR4/X vs -DR3/4. Their data set was small (n=17
parent pairs) but showed that 13/17 (0.76) probands inherited HLA-DR3/4
compared with 10/25 (0.4) later-affected siblings 5.43, p~0.02). It was
suggested that this effect was due to "an interaction with environmental factors that
1 5 4
is most noticeable for the proband in a sibship". Although Rubinstein produced
support for this finding from the literature, subsequent analysis of 91 multiplex
families in the G.A.W.5 data set failed to provide confirmation of the result(Falk
1989); the frequencies of DR3/4 in proband and second affecteds were 0.39 and
0.40 respectively.
In this multiplex data set, 79/167 (0.47) probands and 75/173 (0.43) later-affected
diabetics are HLA-DR3/4 heterozygotes 0.54, 1df, p=0.46). Indeed,
comparison of the genotype frequencies HLA-DRX/X, 3/X,3/3, 4/X,4/4 and 3/4
reveals no evidence of heterogeneity at HLA between the two groups 1.6,3df,
p=0.65). Considering "conducive" parents only, 55 families satisfy the criteria of
Rubinstein et al. (including age-at-diagnosis; proband < 16 years, later-affected less
than 20 yrs)(table 6.7). In this subgroup, 0.71 probands inherit HLA-DR3/4
compared with 0.59 later-affecteds 1.8, 1df, p=0.18); once again, there is no
significant difference in HLA-DR3 and DR4 genotype frequencies between the
groups (p=0.43).
Although there does appear to be weak support for Rubinstein's finding (there are
slightly more HLA-DR3/4 probands than later-affecteds), this may simply reflect
age-at-onset effects (Section 4.9). The probands of the conducive parents in table
6.7 have a mean age-at-onset of 7.0 (4.7) years and this is significantly less than
that of the later-affecteds, 11.3 (5.6) years, Given the trend towards HLA-
DR3/4 diabetics being younger at diagnosis, any manipulation which selects a
younger age-at-onset subgroup of diabetics is likely to produce an over-
representation of the HLA-DR3/4 genotype.
1 5 5
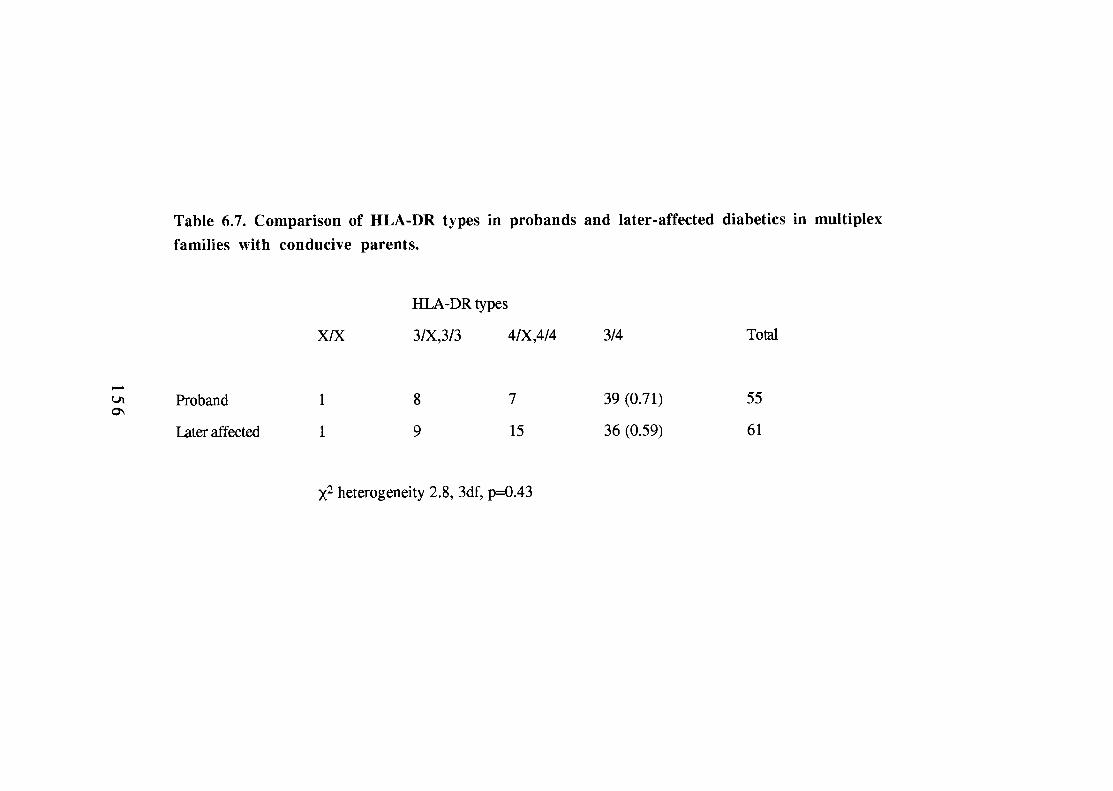
Finally, Rubinstein et al. noticed in their own data and in other published data sets,
that if the first affected offspring did not inherit HLA-DR314 then later-affected
siblings were never HLA-DR3/4. In the G.A.W.5 sample, there were 10 such
instances and in this data set 12 non-DR3/4 probands have affected siblings who
are HL,A-DR3/4 heterozygotes.
6.4.2. HLA haplotype sharing according to HLA-DR type of the
proband.
In 1987 Rotter et al. reported that the proportion of HLA haplotype sharing in
affected sib pairs was dependent upon the HLA-DR phenotype of the
proband(Rotter, Vadheim et al. 1987). In an analysis of the GAW4 data they found
that, if the proband was HLA-DR3/4, there was a significantly higher frequency of
2-haplotype sharing with affected sibs than if the proband was not HLA-DR314.
Falk reported a similar 'trend' towards two-haplotype sharing in 86 sib pairs from
the G.A.W.5 data set (proband HLA-DR3/4 versus not -DR3/4: 4.9, 2df,
p=0.087) (Falk 1989).
I have analysed 134 ASPs from duplex families (any age-at-onset) and confirm an
effect of proband HLA-DR type, although this is relatively weak (table 6.8). When
the proband is HLA-DR3/4, the proportion of affected siblings that share both HLA
haplotypes is 0.62 compared with 0.45 in probands who are not HLA-DR3/4
(p<0.05).
157
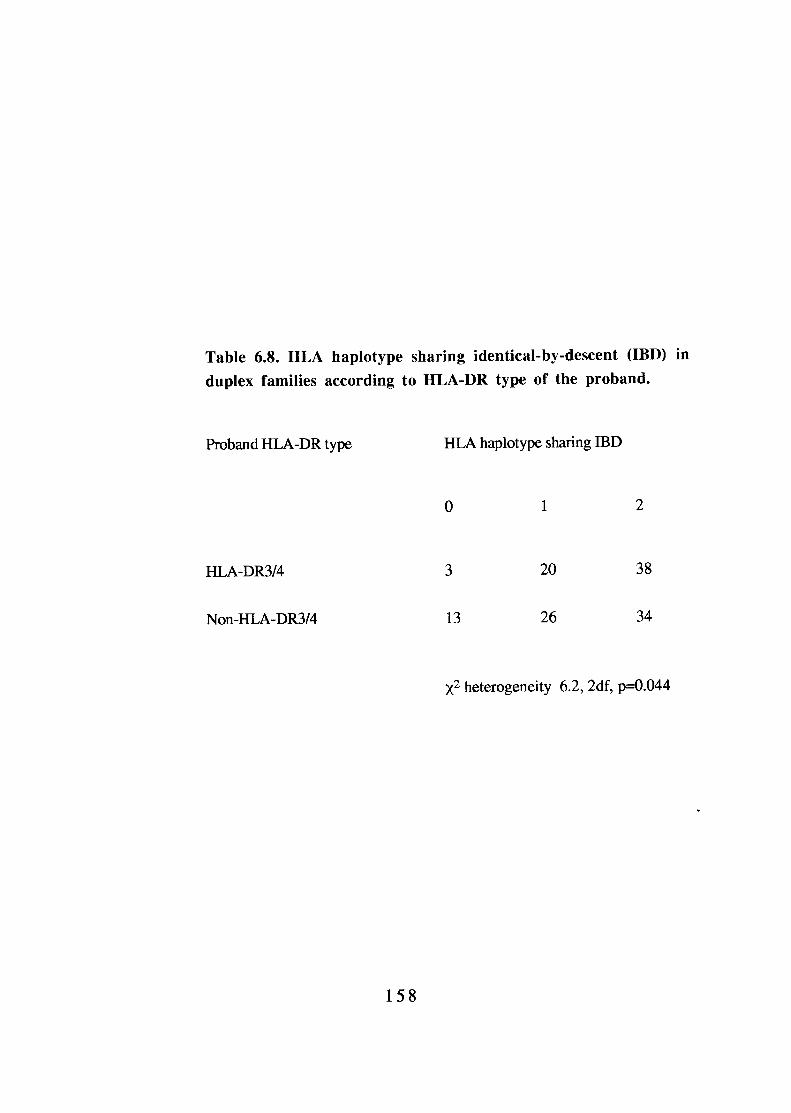
Given the increased risk of diabetes in HLA-DR3/4 heterozygotes, this result is not
unexpected. Furthermore, the presence of HLA-DR3/4 in a proband may designate
a more homogeneous group of families in which HLA susceptibility is important
for disease. This contention is supported by analysis of only those sib pairs which
satisfy the B.D.A. age criteria (which also reduces genetic heterogeneity at HLA).
In this group, proband HLA-DR status has no significant effect on haplotype
sharing (HLA-DR3/4 proband versus non-DR3/4: two-sharing 0.59 vs 0.50;
2.4, 2df, p=0.3).
6.5. Summary and conclusions.
The literature contains many reports which suggest that HLA-mediated
susceptibility to type 1 diabetes is more complicated than was first perceived These
findings are often unexpected and are based on relatively small sample sizes. Whilst
they lack an a priori reason for existence, they quickly generate tenable hypotheses
which have become part of the dogma of diabetes. I have examined this data set in
order to confirm five such findings; one (the effect of NIMAs) is very recent, two
(increased paternal HLA-DR4 transmission to diabetics and specifically to HLA-
DR3/4 heterozygotes) are generally accepted and two (proband HLA-DR3/4 excess
and increased HLA haplotype sharing in HLA-DR3/4 proband pairs) are almost
mutually exclusive. I find little evidence to support any of these phenomena. The
effects seen are at best weak and can, in my opinion, be explained by the well-
described risks afforded by different HLA-DR genotypes.
My data do not definitively refute any of the published findings since it is possible
that they may all present in different ethnic groups (although I doubt it). They do,
however, imply that such effects are minor in this Caucasoid family group. They
159
also suggest that population genetic screening is a feasible aim since an individual's
risk of disease appears to depend upon his/her genotype. In this population at least,
we need not concern ourselves with the genotypes of a person's mother or siblings.
Finally, this chapter highlights the need for replication of new and unexpected
findings in independent data sets. This data set is the largest and most
homogeneous collection of multiplex pedigrees in the world; it has also produced
the fewest surprises. It is to be hoped that the 'negative findings' which this
collection will generate are received with the same enthusiasm as the novel
hypotheses from smaller studies.
1 6 0

CHAPTER 7
CANDIDATE GENE ANALYSIS
1 6 1
7.1.Introduction.
In this chapter, I describe analyses of three candidate loci for type 1 diabetes, the
genes encoding glucokinase, apolipoprotein E and Octomer Binding Protein 3A.
7.2. Glucokinase.
7.2.1. Introduction.
There are several reports that relatives of type 2 diabetics are at increased risk of
type 1 diabetes(Chern, Anderson et al. 1982)(Wagener, Sacks et al.
1982)(Dahlquist, Blom et al. 1989) and this is the case in this data set (Section
3.1.2.ii). These findings may be due to recall bias (the diagnosis of type 1 diabetes
generating a search for diabetes in all family members). They could, however,
reflect an overlap of genetic susceptibility to both conditions. Studies of HLA and
INS lend support to this contention. Rich and colleagues have presented evidence
that HLA-DR4 contributes to increased susceptibility of type 1 diabetes in families
with type 2 diabetic parents(Rich, Panter et al. 1991)(Rich, French et al. 1993)
whilst alleles in the INS region may be associated with both type 1 and type 2
diabetes in different populations(Himan, Tarn et al. 1985) (Hitman, Kambo et al.
1991). Any genetic locus found to contribute susceptibility to type 2 diabetes,
therefore, should be regarded as a candidate gene region for type 1 diabetes (and
vice-versa).
In March, 1992 Frougel et al. described linkage of a glucokinase microsatellite
polymorphism (GCK 1) to non-insulin dependent diabetes(Froguel, Vaxillaire et al.
1992). Combined analysis of the sixteen families studied revealed a maximum LOD
1 6 2
score of 11.6 i.e. the odds of linkage versus non-linkage are 1 (Section
1.5.2). Within the 16 pedigrees, however, there was evidence of genetic
heterogeneity and a high degree of linkage was only seen in those families with
early-onset disease (at least two individuals diagnosed before the age of 25 years).
This subphenotype of non-insulin-dependent diabetes is an autosomal dominant
disorder, known as maturity-onset diabetes of the young (MODY) (Tattersall and
Fajans 1975). Linkage of GCK1 was subsequently confirmed in a large 5-
generation pedigree in the UK, however, this family has many features typical of
type 2 diabetes(Hattersley, Turner et al. 1992). This suggests that glucokinase gene
defects might also be involved in the pathogenesis of type 2 diabetes; glucokinase
is, therefore, a candidate gene for both type 2 and type 1 disease.
GCK1 is a polymorphic compound imperfect dinucleotide repeat element located
approximately 10 kilobases 3' to the glucokinase gene on chromosome
7p(Matsuani, Janssen et al. 1992). I tested for an association between alleles at
GCK1 and type 1 diabetes in probands of multiplex families(Bain, Barnett et al.
1992). This approach was adopted following my experience with INS (Section
5.3.1) which suggests that it may be easier to demonstrate an association with a
candidate locus than linkage. This is especially true when the disease-associated
allele has a high frequency in the unaffected population(Todd and Bain 1992). A
positive association clearly requires confirmation by linkage analysis since it may
reflect population stratification effects. Linkage studies are, however, unlikely to be
positive in the absence of an association. Probands were used in the study since
associations with the known susceptibility determinants, HLA and INS, are both
stronger in multiplex diabetics than in sporadic cases.
1 6 3
7.2.2. GCK1 analysis.
Probands from 137 type 1 diabetic multiplex families were compared with 176
non-diabetic control subjects. The alleles of GCK1 were amplified by PCR using
primers 9509 and 9510 as described(Hattersley, Turner et al. 1992). The final
product was electrophoresed on a 6% polyacrylamide gel at 100 V for 15 hours and
bands were detected by staining with ethidium bromide. Three alleles were detected
and these are designated z, z+2 and z+4 , The allelic frequencies of these are
shown in table 7.1 and genotype frequencies are shown in table 7.2. There were no
significant differences in the allele frequencies (p=0.58) or genotype frequencies
(p=0.4 1) between the groups. Contrary to a recent report(She, Bui et al. 1993), the
frequencies of heterozygotes with alleles z+4 and z+2 did not differ between
diabetics and controls 0.64, 1df, p=0.4) and both populations were in Hardy-
Weinberg equilibrium.
7.2.3. Summary and conclusion of glucokinase study.
This study shows no evidence for an association between type 1 diabetes and alleles
at GCK1, the same microsatellite used to detect linkage between the glucokinase
gene and type 2 diabetes(Froguel, Vaxillaire et al. 1992)(Hattersley, Turner et al.
1992). Family studies are unlikely to show linkage of this locus to type 1 diabetes.
This finding, however, does not exclude the possibility that mutations in the
glucokinase gene may be susceptibility determinants in some individuals with the
type 1 diabetes phenotype. As new mutations are identified(Vionnet, Stoffel et al.
1992), they should be analysed in type 1 diabetic pedigrees, especially those with
type 2 diabetic parents. This may facilitate the recognition of additional genetic
164
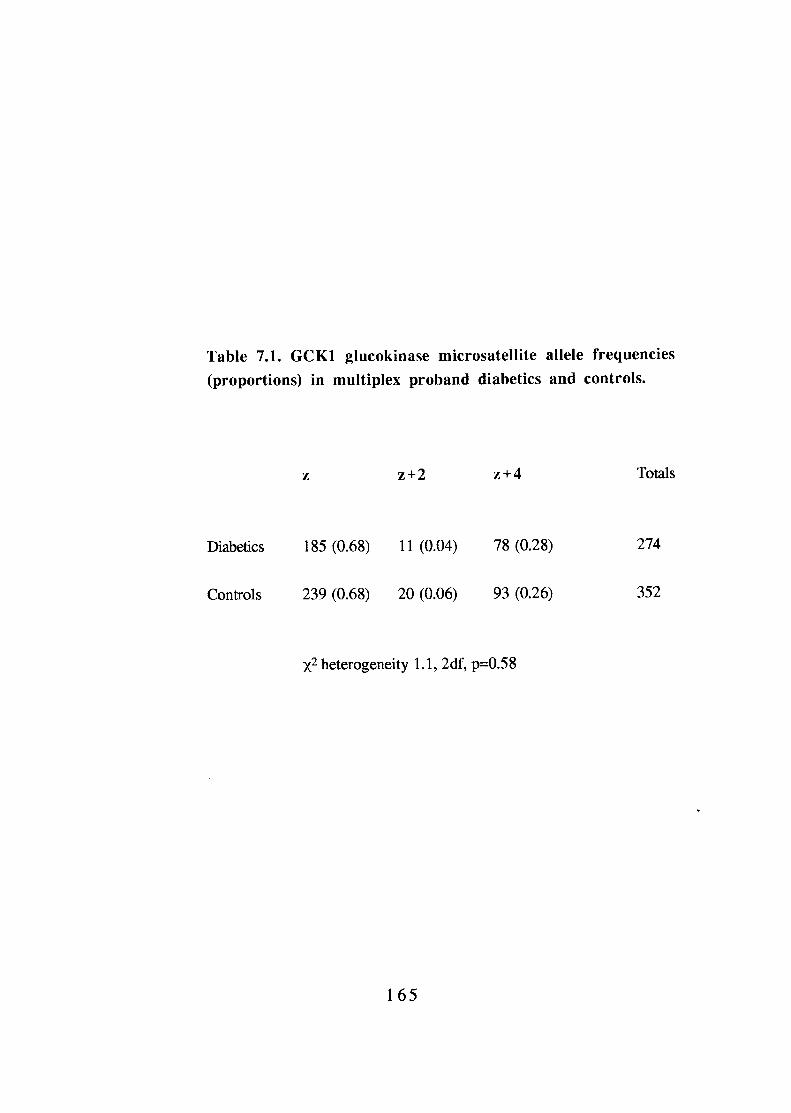
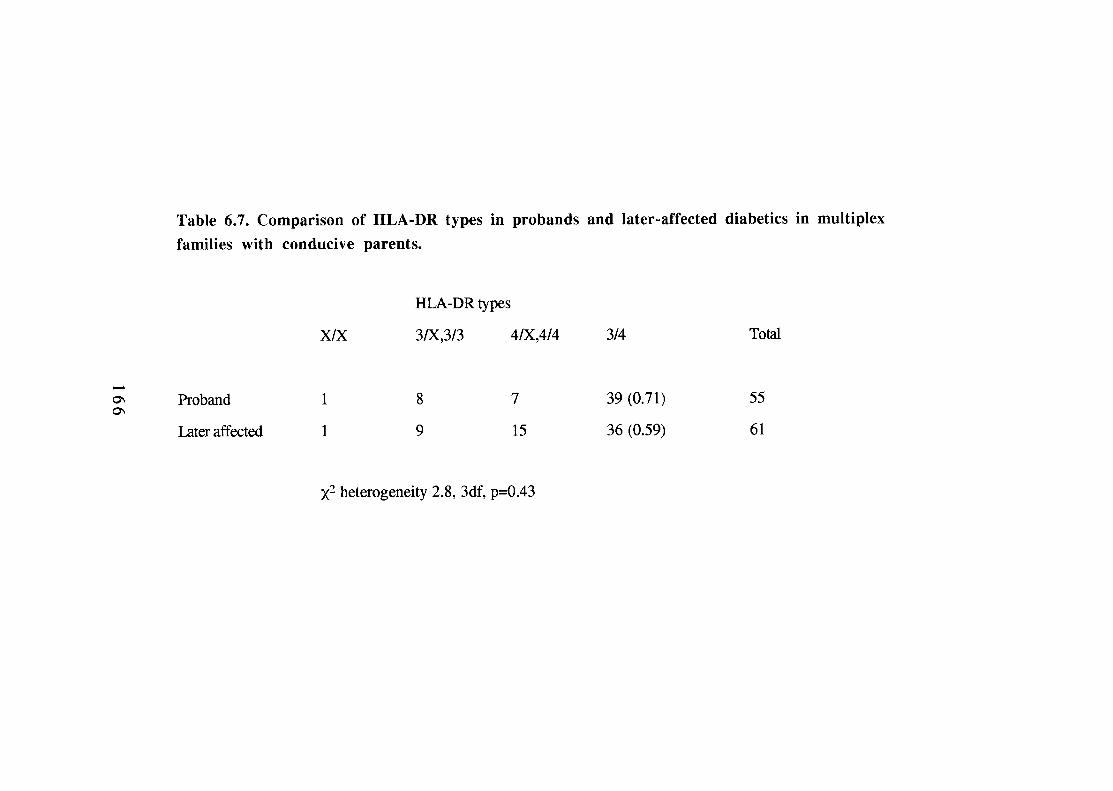
heterogeneity in type 1 diabetes and define possible overlaps in the genetics of
clinically different forms of diabetes.
7.3. Analysis of apolipoprotein E genotype in type 1 and type 2
diabetics.
7.3.1. Introduction.
Apolipoprotein E (Apo E) is a ligand for the LDL receptor and this interaction is
responsible for removal of triglyceride-rich very-low-density lipoprotein (VLDL)
remnants from plasma(Utermann 1987). The Apo E gene is polymorphic with three
co-dominant alleles coding for the major isoforrns Apo E2, E3 and E4. Apo E2 has
a low affinity for the LDL receptor and homozygosity may lead to elevated VLDL
remnants. The frequency of the Apo E2/E2 phenotype has been reported to be
increased in patients with both type 1 and type 2 diabetes and this has led to the
suggestion that the Apo E gene is a candidate susceptibility locus for disease
development (Eto, Watanabe et al. 1986)(Winocour, Tetlow et al. 1989)(Black,
Hewett et al. 1990). In those studies, designation of Apo E phenotype was
assessed by isoelectric focusing. This is a difficult, time consuming,
method(Wenharn, Sedky et al. 1991) and I have previously demonstrated that this
assay is affected by raised ambient glucose levels (glycosylation increases the
amount of Apo E in the E2 position during isoelectric focusing)(Bain, Guy et al.
1990). It is possible, therefore, that post-translational modification of Apo E may
account for the differences reported in diabetics.
In collaboration with E.K. Green and Dr A.F. Jones (Department of Clinical
Chemistry, East Birmingham Hospital), we directly assessed the Apo E genotype in
167
subjects with type 1 and type 2 diabetes and controls(Green, Bain et al. 1991). The
analysis was performed on 67 type 1 diabetic probands from multiplex families, 89
controls and 122 type 2 diabetics(Bain, Green et al. 1992). The type 2 diabetics
were aged over 40 years at diagnosis and were consecutive patients attending the
Diabetic clinic at East Birmingham Hospital. Type 2 diabetes was diagnosed
according to WHO criteria(WHO Expert Committee on Diabetes Mellitus 1980).
7.3.2. Apo E analysis.
The Apo E allele and genotype frequencies are shown in tables 7.3 and 7.4
respectively. The allele frequencies of Apo E2, E3 and E4 in controls are consistent
with previous studies of Apo E phenotype (for example, comparison with
Winocour et al. 0.9, 2df, p=0.63). Genotype frequencies in the controls are also
consistent with previous reports of Apo E phenotype. The allele frequencies did
not differ significantly from control subjects in type 1 0.6, 2df, p=0.74) or type
2 diabetics 1.2, 2df, p=0.55). There was also no difference in genotype
frequency in type 1 2.4, 5df, p=0.78) or type 2 diabetics 4.1, 5df, p=0.49)
compared with controls. Further, the genotype frequencies in all three groups did
not differ significantly from Hardy-Weinberg equilibrium.
7.3.3. Summary and conclusions.
These findings confirm previous phenotypic studies of Apo E in control subjects
but do not support suggestions of allelic or genotypic differences in type 1 or type 2
diabetics. Reviewing the only previous study of Apo E in type 1
diabetes(Winocour, Tetlow et al. 1989), it is possible that post-translational
modification of Apo E may be responsible for these discrepancies. Glycaemic
168
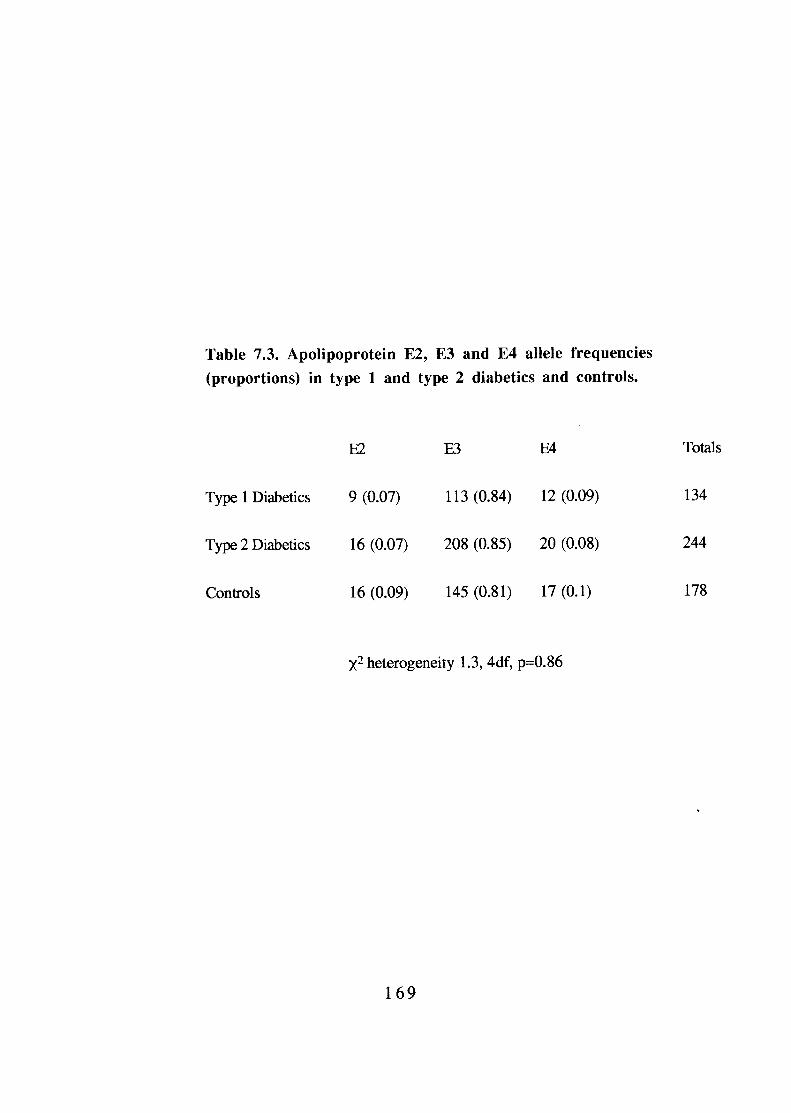
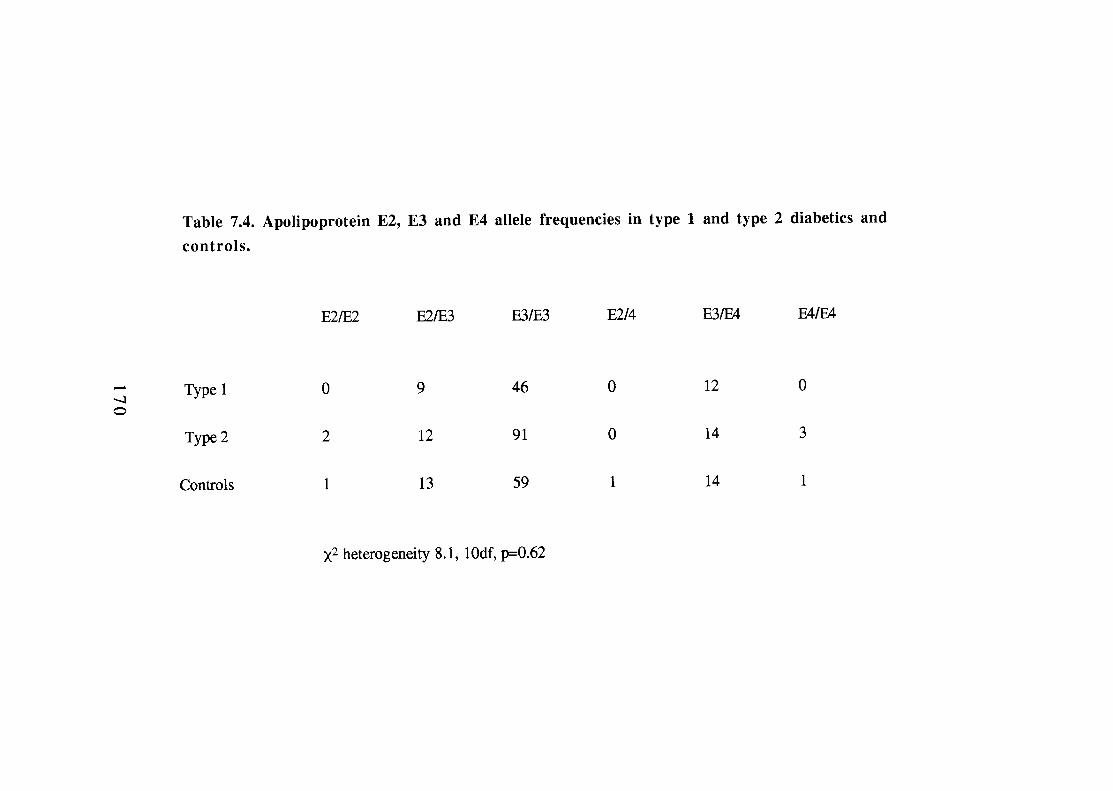
control in the diabetics in that study (assessed by glycosylated haemoglobin) was
abnormal (mean 9.4%, normal range 5-8%) and this could account for the increased
incidence of E2/E2 homozygosity observed in that group. The finding that allelic
and genotypic frequencies are very similar in controls, whether assessed by
phenotypic and genotypic methods, is also consistent with an effect of
hyperglycaemia. A larger study is required to confirm these findings.
7.4. OFT3 gene polymorphism in type 1 diabetes.
7.4.1. Introduction.
Transcription factors containing the POU-homeo domain have been shown to be
important regulators of tissue-specific gene expression in pituitary and lymphoid
cells. Using a PCR-based strategy, Takeda et al. looked for similar factors which
might be involved in the tissue-specific expression of genes in pancreatic ß-
cells(Takeda, Seino et al. 1992). This led to the isolation of two isoforms of the
transcription factor Octomer Binding Protein 3 (Oct3A and B). The sequence of
human Oct3A shows 87% amino acid identity with mouse Oct3 and polymorphisms
of the Oct3 gene have been found to segregate with murine type 1 diabetes in the
NOD mouse. The human Oct3 gene (named OFT3) is localised to the region of the
MHC on chromosome 6. It contains two polymorphisms, one of which can be
typed using PCR followed by digestion with HindIII. Takeda et al. typed the
HindIII polymorphism in Japanese type 1 diabetics and controls and found a
significant association between presence of the restriction site and disease (Dr J.
Takeda & Dr G.I. Bell, personal communication).
171
7.4.2. Methodology.
I have examined this Caucasoid population for an association between type 1
diabetes and polymorphism within OFT3. Since this gene appeared to be localised
within the MHC, it was hoped that a disease associated allele might split HLA-DR3
and /or -DR4- mediated disease susceptibility. I typed 114 probands from multiplex
families and 117 control subjects for the HindIII polymorphism of the OFT3 gene.
The primers used were; sense 5'-AGC TCA TTG TCT AAT GTC AT-3' and
antisense 5'-CAG CTA CAT GGT GAC TGA GT-3'. PCR conditions;
denaturation 95°C 1min, annealing 63°C 1min, extension 72°C 1min. The PCR
product (802 base pairs) digested to two products (546 and 256bp) in the presence
of a HindIII site; this is designated the '+' allele. The '-' allele does not digest with
HindIII (figure 7.1).
7.4.3. OFT3 analysis.
Comparison of the allele frequencies in diabetics and controls shows a significant
increase of the OET3+ allele in diabetics (table 7.5, p<0.01). The genotype
frequencies are shown in table 7.6. This confirms the association observed in
Japanese type 1 diabetics (p<0.01). Having confirmed the association, I went on to
type 402 haplotypes in the parents of multiplex families, allowing analysis of which
HLA haplotypes were in linkage disequilibrium with the + and - alleles of the OFT3
gene. Unfortunately, the few HLA recombinants observed (n=9) were all between
uninformative homozygotes at OFT3, preventing fine mapping of the gene by
linkage analysis in this data set.
172
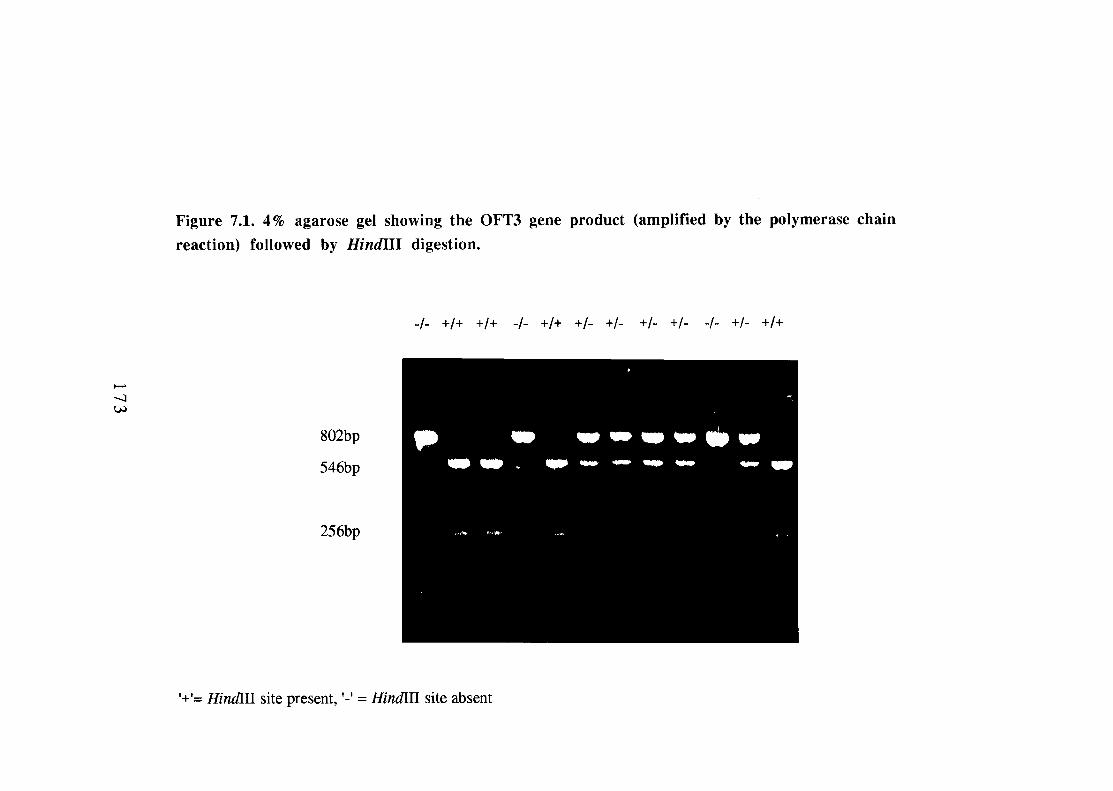
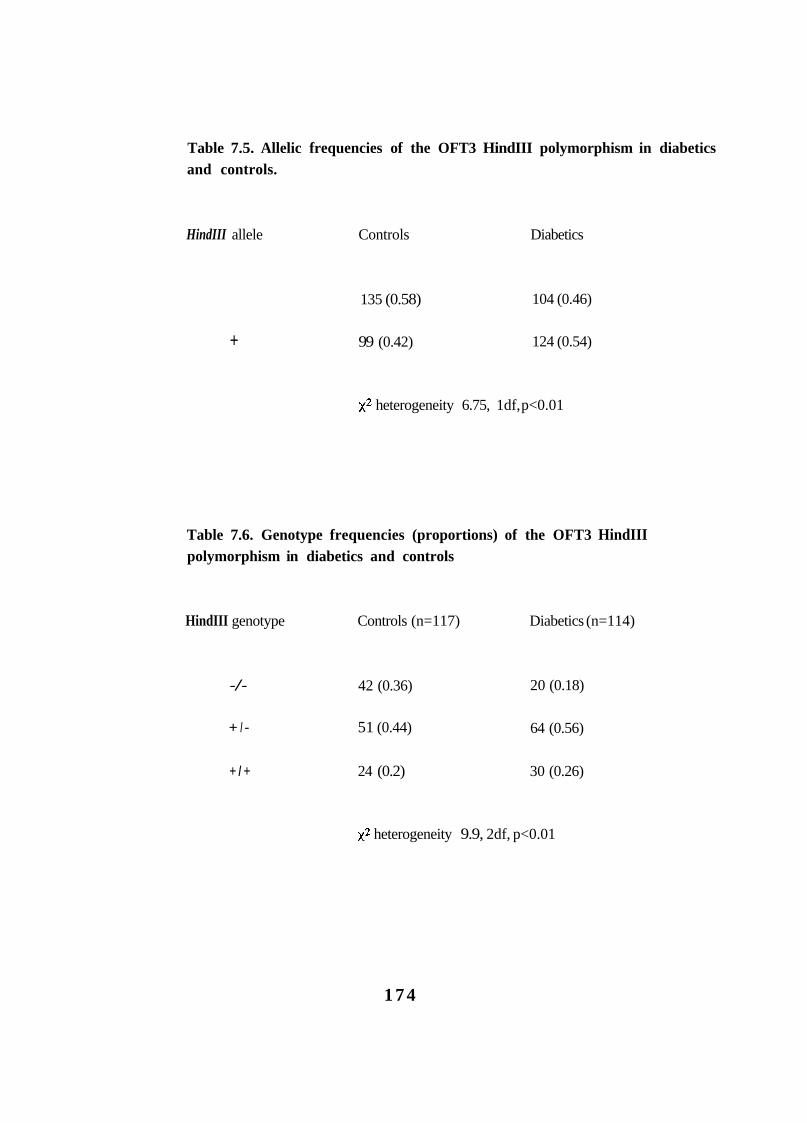
Table 7.5. Allelic frequencies of the OFT3 HindIII polymorphism in diabetics and controls.
HindIII allele Controls Diabetics
135 (0.58) 104 (0.46)
+ 99 (0.42) 124 (0.54)
heterogeneity 6.75, 1df, p<0.01
Table 7.6. Genotype frequencies (proportions) of the OFT3 HindIII polymorphism in diabetics and controls
HindIII genotype Controls (n=117) Diabetics (n=114)
-/- 42 (0.36) 20 (0.18)
+ I - 51 (0.44) 64 (0.56)
+ I + 24 (0.2) 30 (0.26)
heterogeneity 9.9, 2df, p<0.01
1 7 4
7.4.3.i. HLA-DR3 haplotypes and OFT3.
Concerning HLA-DR3,DQB1*0201 haplotypes, 36 (0.32) carry the - OFT3 allele
and 78 (0.68) were +. This appears to be the result of linkage disequilibrium
between the OFT3 polymorphism and HLA class I loci. The HLA-B8, DR3,
DQBl*0201 haplotypes, for example, carry the OFT3+ allele in 88/90 cases (0.98
vs expected 0.5, 82, 1df, whilst HLA-B18,DR3,DQB1*0201
haplotypes are OFT3- in 23/25 cases 17.6, 1df, It is, therefore, unlikely
that alleles at OFT3 are directly involved in susceptibility associated with HLA-DR3
since both + and - alleles are present on high risk HLA-DR3 haplotypes.
7.4.3.ii. HLA-DR4 haplotypes and OFT3.
HLA-DR4-positive haplotypes are OFT3+ in 65/137 (0.47) cases. There is,
however, a significant difference between the HLA-DQB 1 subgroups of HLA-
DR4. Low risk HLA- DR4, -DQB1*0301 haplotypes are OFT3 + in 6/27 (0.22)
cases, compared with 59/110 (0.54) of DR4, -DQB1*0302 haplotypes 8.6,
1df, p<0.005). Once again, however, there is little to support the contention that
the OFT3 locus is directly affecting susceptibility since there is no significant
difference in the proportion of OFT3+ HLA-DR4, -DQB1*0302 haplotypes in
multiplex diabetics (84/163=0.52) compared to the parental group 0.12, 1df,
p=0.73). That is to say, OFT3+ HLA-DR4,-DQB1*0302 haplotypes do not
segregate preferentially to the diabetic offspring.
7.4.4. Summary and conclusions.
It is unlikely that the OFT3 gene directly contributes to susceptibility to type 1
diabetes in Caucasians and the disease association probably reflects linkage
disequilibrium with true susceptibility determinants. Since the two alleles of OFT3
175
are both carried on high risk haplotypes, it has little potential for screening (even in
combination with other HLA markers).
This polymorphism may, however, be useful in further trans-racial studies. HLA-
DR4 and -DR9 are the major disease susceptibility determinants for type 1 diabetes
in Japanese and this population shows a disease association with the OFT3+ allele.
In this Caucasoid population, the positive association of OFT3+ and disease is due
to linkage disequilibrium with a majority of the high-risk HLA-DR3 haplotypes; the
HLA-DR4, -DQB1*0302 and -DR9, -DQB1 *0303 haplotypes are almost equally
split by the OFT3 polymorphism. Since HLA-DR3 is rare in Japanese populations,
the association with the OFT3+ allele cannot be due to linkage disequilibrium with
this HLA-DR type. The implication is that the positive association with OFT3+ in
Japanese is due to linkage disequilibrium with other class II alleles found on HLA-
DR4 and -DR9 haplotypes or that other loci (perhaps class I) are involved in disease
susceptibility.
7.4.5. Addendum.
The human OFT3 gene has recently been mapped and is located approximately 90
kilobase pairs telomeric to the class I HLA-C locus (Dr J. Ragoussis, personal
communication).
176

CHAPTER 8
CONCLUDING REMARKS AND FUTURE WORK
177
The successful identification of genes responsible for monogenic disorders,
including cystic fibrosis and Duchenne muscular dystrophy, has focused attention
on the genetics of so-called complex diseases. The essential feature of these
disorders is that both environmental and genetic influences are necessary for disease
expression. Complex diseases, which include type 1 diabetes, hypertension,
ischaemic heart disease and Alzheimer's disease, are common and account for a
major part of morbidity and mortality in the Western world. Elucidation of
susceptibility (and resistance) loci will allow identification of individuals at high
risk of these conditions; this should facilitate the study of environmental factors and
hence the development of preventative strategies. Ultimately, characterisation of
genes and their expression may lead to new therapeutic approaches. Technological
advances in the fields of molecular biology and statistics suggest that it is now
feasible to approach complex disease analysis in a logical and structured fashion.
In many ways, the genetic analysis of type 1 diabetes will be a model for the study
of complex diseases. It is clear that disease heterogeneity can be reduced by the use
of strict clinical criteria, in a way that is probably not possible in other conditions
(for example, psychiatric disorders). Further, two linked susceptibility gene regions
have now been identified. These features are in addition to the considerable amount
of knowledge concerning the immunology of type 1 diabetes and the availability of
animal models. Finally, a large ethnically homogeneous genetic resource is now
available to facilitate the necessary experimentation and, if the scientific will exists,
a world-wide collaborative effort.
This thesis describes the establishment, validation and use of the largest genetic
resource of its kind. Although a large collection of EBV-transformed cell lines from
1 7 8
multiplex families with type 1 diabetes has been regarded as a necessity, it is of note
that no salaries were specifically funded to establish this resource. Concerning
validation, I find no evidence to suggest that multiplex diabetics differ from
sporadic cases in the UK population. Genetic susceptibility at HLA and INS is
confirmed in this data set but evidence of parental effects on HLA-mediated
susceptibility are not seen, implying caution in their interpretation. The expected
influence of age-at-onset on genetic susceptibility is confirmed and an age effect on
sex reported. The first 100 multiplex families of the B.D.A. - Warren Repository
are now being used in North America by groups led by David Owerbach and Leigh
Field and an exchange of data has already taken place. This is promising for the
future of type 1 diabetes research.
A larger resource will undoubtedly be required to allow division of pedigrees into
potentially more homogeneous subgroups. This will be performed using data such
as HLA and INS genotypes, clinical details, family history and possibly humoral
markers (plasma is available should persistent antibody responses be discovered).
The monies to continue blood sample collection have been made available by the
Wellcome Trust through funding of a complex disease initiative based in Oxford.
The Steering Committee set up during this project will continue to oversee the
collection and will be involved in the distribution of cell lines from the expanding
resource.
As far as our own work on the resource is concerned (S.C.B., A.H.B. and
J.A.T.), there are two major directions this will take. Initially i t is important to
examine those associations and linkages for which there is preliminary data (for
example, T-cell receptor chain gene, immunoglobulin genes, as well as
new candidate gene regions generated from comparative mapping. In the near
179
future, automised technologies should enable exclusion mapping of the human
genome using microsatellite markers. This latter stategy will be based on the
successful Genethon programme in France(Weissenbach, Gyapay et al. I992) and
again will be funded by the Wellcome Trust initiative.
The analysis of complex diseases is now one of the highest priorities in basic
medical research. Type 1 diabetes is at the forefront of this research effort and will
be a major beneficiary if the current programmes are successful. Indeed, given the
(apparent) propensity of this condition to genetic analysis, type 1 diabetes may be
regarded as the crucible for the 'new genetics'.
1 8 0

ABBREVIATIONS
1 8 1
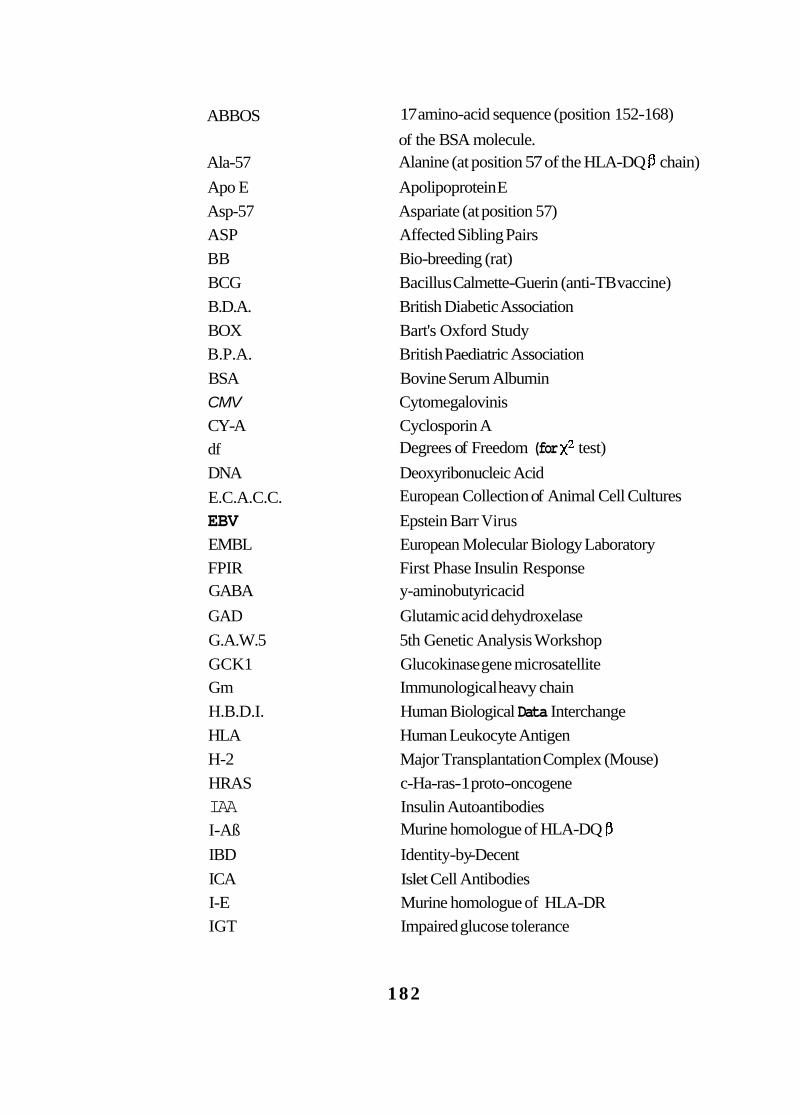
ABBOS 17 amino-acid sequence (position 152-168) of the BSA molecule. Alanine (at position 57 of the HLA-DQ chain) Ala-57
Apo E Apolipoprotein E Asp-57 Aspariate (at position 57) ASP Affected Sibling Pairs BB Bio-breeding (rat) BCG Bacillus Calmette-Guerin (anti-TB vaccine) B.D.A. British Diabetic Association BOX Bart's Oxford Study B.P.A. British Paediatric Association BSA Bovine Serum Albumin CMV Cytomegalovinis CY-A Cyclosporin A df DNA Deoxyribonucleic Acid E.C.A.C.C. EBV Epstein Barr Virus EMBL European Molecular Biology Laboratory FPIR First Phase Insulin Response GABA y-aminobutyric acid GAD Glutamic acid dehydroxelase G.A.W.5 5th Genetic Analysis Workshop GCK1 Glucokinase gene microsatellite Gm Immunological heavy chain H.B.D.I. Human Biological Data Interchange HLA Human Leukocyte Antigen H-2 Major Transplantation Complex (Mouse) HRAS c-Ha-ras- 1 proto-oncogene IAA Insulin Autoantibodies I-Aß IBD Identity-by -Decent ICA Islet Cell Antibodies I-E Murine homologue of HLA-DR IGT Impaired glucose tolerance
Degrees of Freedom (for test)
European Collection of Animal Cell Cultures
Murine homologue of HLA-DQ
182
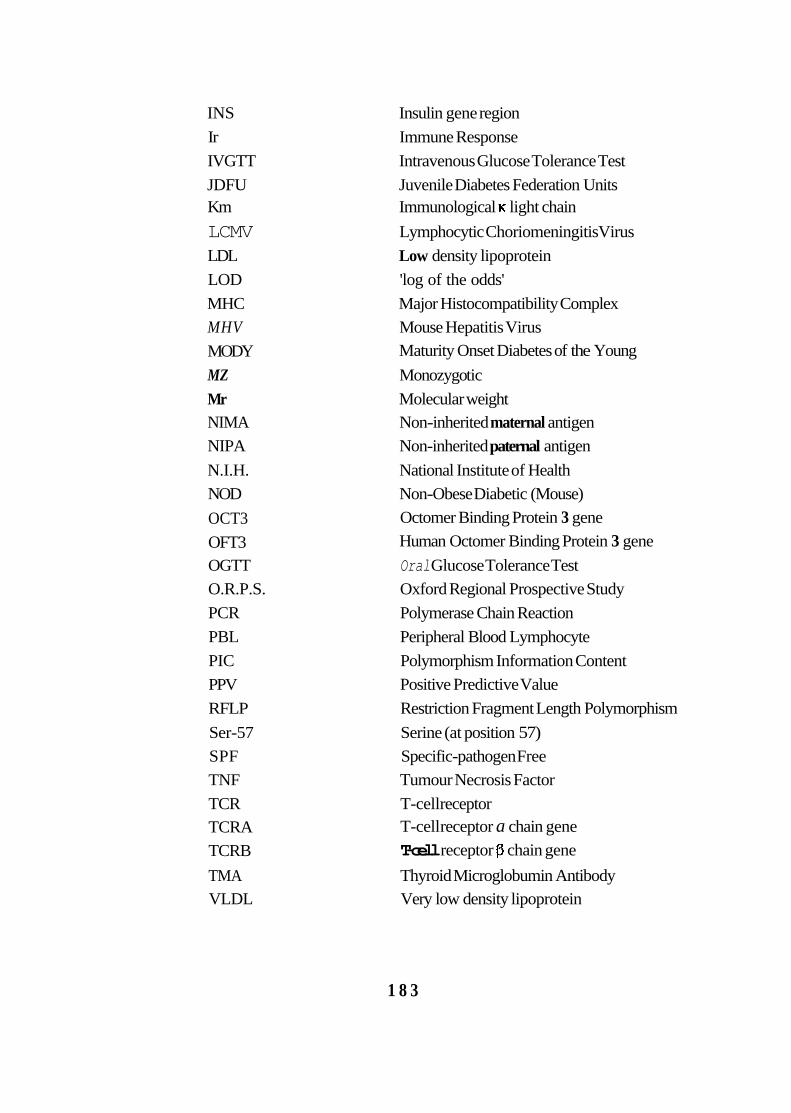
INS Insulin gene region Ir Immune Response IVGTT Intravenous Glucose Tolerance Test JDFU Juvenile Diabetes Federation Units Km Immunological light chain LCMV Lymphocytic Choriomeningitis Virus LDL Low density lipoprotein LOD 'log of the odds' MHC Major Histocompatibility Complex MHV Mouse Hepatitis Virus MODY MZ Monozygo tic Mr Molecular weight NIMA Non-inherited maternal antigen NIPA Non-inherited paternal antigen N.I.H. National Institute of Health NOD Non-Obese Diabetic (Mouse) OCT3 OFT3 OGTT Oral Glucose Tolerance Test O.R.P.S. Oxford Regional Prospective Study PCR Polymerase Chain Reaction PBL Peripheral Blood Lymphocyte PIC Polymorphism Information Content PPV Positive Predictive Value RFLP Restriction Fragment Length Polymorphism Ser-57 Serine (at position 57) SPF Specific-pathogen Free TNF Tumour Necrosis Factor TCR T-cell receptor TCRA T-cell receptor a chain gene TCRB T-cell receptor chain gene TMA Thyroid Microglobumin Antibody VLDL Very low density lipoprotein
Maturity Onset Diabetes of the Young
Octomer Binding Protein 3 gene Human Octomer Binding Protein 3 gene
1 8 3

VNTR Variable Number Tandem Repeat Wor Worstar (rat) YAC Yeast Artificial Chromosome
1 8 4

REFERENCES
1 8 5
Acha-Orbea, H. and McDevitt, H. O. (1987). “The first external domain of the nonobese diabetic mouse class II I-A chain is unique.” Proceedings of the National Academy of Science of the United States of America 84: 2435-9.
Allen, C., Palta, M., et al. (1991). “Risk of diabetes in siblings and other relatives of IDDM subjects.” Diabetes 40: 83 1-6.
Allison, J., Campbell, I. L., et al. (1988). “Diabetes in transgenic mice resulting from over-expression of class I histocompatibility molecules in pancreatic beta cells.” Nature 333: 529-33.
Assan, R., Feutren, G., et al. (1990). “Plasma C-peptide levels and clinical remissions in recent-onset type 1 diabetic patients treated with cyclosporin A and insulin.” Diabetes 39: 768-74.
Atkinson, M. A., Maclaren, N. K., et al. (1990). “Insulitis and diabetes in NOD mice reduced by prophylactic insulin therapy.” Diabetes 39 933-7.
Atkinson, M. A., Maclaren, N. K., et al. (1990). “64,000 Mr autoantibodies as predictors of insulin-dependent diabetes.” Lancet 335: 1357-60.
Bach, F. H., Rich, S. S., et al. (1985). “Insulin-dependent diabetes-associated HLA-D region encoded determinants.” Human Immunology 12: 59-64.
Baekkeskov, S. , Aanstoot, H. J., et al. (1990). “Identification of the 64K autoantigen in insulin-dependent diabetes as the GABA-synthesizing enzyme glutamic acid decarboxylase.” Nature 347: 15 1-6.
Baekkeskov, S., Landin, M., et al. (1987). “Antibodies to a 64,000 Mr human islet antigen precede the clinical onset of insulin-dependent diabetes.” Journal of Clinical Investigation 79: 926-34.
Bain, S. C., Aitman, T. J., et al. (1993). “Clinical heterogeneity of type 1 diabetes mellitus identified by genetic analysis of families (abstract).” Diabetic Medicine : in press.
1 8 6
Bain, S. C., Barnett, A. H., et al. (1991). “Genes for Diabetes.” British Medical Journal 302: 1423.
Bain, S. C., Barnett, A. H., et al. (1992). “Lack of an association between type 1 diabetes and the glucolcinase gene.” Lancet 340: 54-5.
Bain, S. C., Green, E. K., et al. (1992). “Direct analysis of apolipoprotein E genotype shows no evidence of different allelic or genotypic frequencies in subjects with type 1 and type 2 diabetes compared with controls (abstract).” Diabetic Medicine 9(Suppl. 2): S23.
Bain, S. C., Guy, M., et al. (1990). “Glycosylation and apolipoprotein E phenotype: increased proportion of E2 may contribute to diabetic dyslipoproteinaemia (abstract).” Diabetic Medicine 7: 35A.
Bain, S . C., Prins, J. B., et al. (1992). “Insulin gene region-encoded susceptibility to type 1 diabetes is not restricted to HLA-DR4-positive individuals.” Nature Genetics 2: 212-5.
Bain, S. C., Rowe, B. R., et al. (1990). “Coffee consumption as trigger for insulin dependent diabetes mellitus in childhood (letter).” British Medical Journal 300: 1012.
Bain, S. C. and Todd, J. A. (1993). Mapping MHC Class II genesídisease susceptibility. Methods in Molecular Biology. PCR: Selected protocols. New Jersey, Humana. in press.
Bain, S . C., Todd, J. A., et al. (1990). “The British Diabetic Association - Warren Repository.” Autoimmunity 7: 83-5.
Bantvala, J. E., Bryant, J., et al. (1985). “Coxackie B, Mumps, Rubella, and Cytomegalovirus specific IgM responses in patients with juvenile-onset insulin- dependent diabetes mellitus in Britain, Austria, and Australia.” Lancet ii: 1409-12.
1 8 7
Barmeier, H., McCulloch, D. K., et al. (1991). “Risk for developing type 1 (insulin-dependent) diabetes mellitus and the presence of 64K antibodies.” Diabetologia 34: 727-33.
Bell, G. I., Horita, S., et al. (1984). “A polymorphic locus near the human insulin gene is associated with insulin-dependent diabetes mellitus.” Diabetes 33: 176-83.
Bell, G. I., Karam, J. H., et al. (1981). “Polymorphic DNA region adjacent to the 5’ end of the human insulin gene.” Proceedings of the National Academy of Science of the United States of America 78: 5759-63.
Beppu, H., Winter, W. E., et al. (1987). “Bovine albumin antibodies in NOD mice.” Diabetes Research 6: 67-9.
Bingley, P. J., Bonifacio, E., et al. (1993). “Can we really predict IDDM?” Diabetes 42: 213-20.
Bingley, P. J., Bonifacio, E., et al. (1993). “Can islet cell antibodies predict insulin dependent diabetes in the general population?” Diabetes Care 1 6 45-50.
Bingley, P. J. and Gale, E. A. M. (1991). Lessons from family studies. Bailliere’s Clinical Endocrinology and Metabolism. Bailliere Tindall. 261 -283.
Black, S. C., Hewett, S., et al. (1990). “Isoform patterns of apolipoprotein E in diabetes mellitus.” Diabetic Medicine 7: 532-9.
Bleich, D., Jackson, R. A., et al. (1990). “Analysis of metabolic progression to type 1 diabetes in ICA+ relatives of patients with type 1 diabetes.” Diabetes Care 13: 111-8.
Blom, L., Dahlquist, G., et al. (1989). “The Swedish childhood diabetes study - social and perinatal risk determinants for diabetes in childhood.” Diabetologia 32: 7-13.
1 8 8
Bohme, J., Carlsson, B., et al. (1986). “Only one DQ- restriction fragment pattern of each DR specificity is associated with insulin-dependent diabetes.” Journal of Immunology 137: 941-7.
Bonifacio, E., Bingley, P. J., et al. (1990). “Quantification if islet-cell antibodies and prediction of insulin-dependent diabetes.” Lancet 335: 147-50.
Bonifacio, E., Boitard, C., et al. (1990). “Assessment of precision, concordance, specificity, and sensitivity of islet cell antibody measurement in 41 assays.” Diabetologia 33: 73 1-6.
Borsch-Johnsen, K., Mandrup-Poulson, T., et al. (1984). “Relation between breast feeding and incidence rates of insulin-dependent diabetes mellitus.” Lancet ii: 1083-6.
Bottazzo, G . F., Dean, B. M., et al. (1985). “In situ characterisation of autoimmune phenomena and expression of HLA molecules in the pancreas in diabetic insulitis.” New England Journal of Medicine 313: 353-60.
Bottazzo, G. F., Florin-Christensen, A., et al. (1974). “Islet-cell antibodies in diabetes mellitus with polyendocrine deficiences.” Lancet ii: 1279-83.
Bottazzo, G. F., Pujol-Borrell, R., et al. (1983). “Role of Aberrant HLA-DR Expression and Antigen Presentation in Induction of Endocrine Autoimmunity.” Lancet ii: 1115-8.
Bougneres, P.-F., Landais, P., et al. (1990). “Limited duration of remission of insulin dependency in children with recent overt type 1 diabetes treated with low- dose cyclosporin.” Diabetes 39: 1264-72.
Bright, G. M., Blizzard, R. M., et al. (1982). “Organ-specific autoantibodies in children with common endocrine diseases.” Journal of Paediatrics 100: 8-14.
Brown, J. H., Jardetzky, T., et al. (1988). “A hypothetical model of the foreign antigen binding site of class II histocompatibility molecules.” Nature 332: 845-50.
1 8 9
Brown, P. (1991). “Donations to ‘genetic bank’ aid diabetes research.” New Scientist (August 31): 10.
Bruno, G., Pisu, E., et al. (1993). “Sex differences in incidence of IDDM in age- group 15-29 yr.” Diabetes Care 16: 133-6.
Buschard, K., Jorgensen, M., et al. (1990). “Prevention of diabetes mellitus in BB rats by neonatal stimulation of Lancet 335: 134-5.
Cacciari, E., Salardi, S., et al. (1987). “Prevalence and characteristics of coeliac disease in type 1 diabetes mellitus.” Acta Paediatrica Scandinavia 76: 671-2.
Caillat-Zucman, S., Garchon, H.-J., et al. (1992). “Age-dependent HLA genetic heterogeneity of type 1 (insulin-dependent) diabetes mellitus.” Journal of Clinical Investigation 90: 2242-50.
Cavan, D. A., Bain, S. C., et al. (1992). “The genetics of type 1 (insulin- dependent) diabetes mellitus.” Journal of Medical Genetics 2 9 441-6.
Cavan, D. A., Jacobs, K. H., et al. (1993). “Both DQA1 and DQB1 genes are implicated in HLA-associated protection from type 1 (insulin-dependent) diabetes rnellitus in a British population.” Diabetologia 3 6 252-7.
Chase, H. P., Voss, M. A., et al. (1987). “Diagnosis of pre-type 1 diabetes.” Journal of Paediatrics 111: 807-12.
Chem, M. M., Anderson, V. E., et al. (1982). “Empirical risk for insulin- dependent diabetes (IDD) in sibs. Further definition of genetic heterogeneity. ” Diabetes 31: 11 15-8.
Chideckel, E. W. (1992). “A bovine albumin peptide as a possible trigger of diabetes mellitus.” New England Journal of Medicine 327: 1602.
Choi, Y., Kappler, J. W., et al. (1991). ”A superantigen encoded in the open reading frame of the 3’ long terminal repeat of mouse mammary tumour virus.” Nature 350: 203-7.
190
Christau, B., Kromann, H., et al. (1977). “Incidence, seasonal and geographical patterns of juvenile-onset insulin-dependent diabetes mellitus in Denmark.” Diabetologia 13: 281-4.
Christie, M. R., Daneman, D., et al. (1990). “Persistence of serum antibodies to 64,000-Mr islet cell protein after onst of type 1 diabetes.” Diabetes 39: 653-6.
Christie, M. R., Tun, R. Y. M., et al. (1992). “Antibodies to GAD and tryptic fragments of islet 64K antigen as distinct markers for development of IDDM. Studies with identical twins.” Diabetes 41: 782-7.
Christie, M. R., Vohra, G., et al. (1990). “Distinct antibody specificities to a 64kD islet cell antigen in type 1 diabetes as revealed by trypsin treatment.” Journal of Experimental Medicine 172: 789-94.
Clerget-Darpoux, F., Babron, M. C., et al. (1990). “Assessing the effect of multiple linkage tests in complex disease.” Genetic Epidemiology 7 245-53.
Collins, F. S. (1992). “Positional cloning: Let’s not call it reverse anymore.” Nature Genetics 1: 3-6.
Colman, P. G. and Eisenbarth, G. S. (1988). Immunology of type 1 diabetes - 1987. Diabetes Annual. Amsterdam, Elsevier. 4th, ed. 17-45.
Concannon, P., Wright, J. A., et al. (1990). “T-cell receptor genes and insulin- dependent diabetes mellitus (IDDM): no evidence for linkage from affected sib pairs.” American Journal of Human Genetics 47: 45-52.
Cornall, R. J., Prins, J. B., et al. (1991). “Type 1 diabetes in mice is linked to the interleukin-1 receptor and Lsh/Ity/Bcg genes on chromosome 1.” Nature 353: 262-5.
Court, S. and Parkin, J. M. (1982). “Hypothyroidism and growth failure in diabetes mellitus.” Archives of Disease in Childhood 57: 622-4.
191
Cox, N. J., Baker, L., et al. (1988). “Insulin-gene sharing in sib pairs with insulin-dependent diabetes mellitus: No evidence for linkage.” American Journal of Human Genetics 42: 167-72.
Cox, N. J. and Bell, G. I. (1989). “Disease associations. Chance, artifact, or susceptibility genes?” Diabetes 38: 947-50.
Cox, N. J., Bell, G. I., et al. (1988). “Linkage Disequilibrium in the human inSulidinsuiin-like growth factor II region of human chromosome IL” American Journal of Human Genetics 43: 495-501.
Cudworth, A. G . and Woodrow, J. C . (1974). ”HL-A antigens and diabetes mellitus.” Lancet ii: 1153.
Dahlquist, G., Blom, L., et al. (1990). “Dietary Factors and the risk of developing insulin-dependent diabetes in childhood.” British Medical Journal 300: 1302-6.
Dahlquist, G., Blom, L., et al. (1989). “The Swedish childhood diabetes study - results from a nine year case register and a one year case-referent study indicating that type 1 (insulin-dependent) diabetes mellitus is associated with both type 2 (non- insulin-dependent) diabetes mellitus and autoimmune disorders. ” Diabetologia 32: 2-6.
Dahlquist, G., Gustavsson, K. H., et al. (1982). ”The incidence of diabetes mellitus in Swedish children 0-14 years of age. A prospective study 1977-80.” Acta Paediatrics Scandinavica 71: 7-14.
Dahlquist, G., Savilahti, E., et al. (1992). “An increased level of antibodies to lactoglobulin is a risk determinant for early-onset type 1 (insulin-dependent) diabetes mellitus independent of islet cell antibodies and early introduction of cow’s milk” Diabetologia 35: 980-84.
Daneman, D., Fishman, L., et al. (1987). “Dietary triggers of insulin-dependent diabetes in the BB rat.” Diabetes Research 5: 93-7.
192
Dean, B. M., Walker, R., et al. (1985). “Pre-diabetes in the spontaneously diabetic BB/E rat: lymphocyte subpopulations in the pancreatic infiltrate and expression of rat MHC class II molecules in endocrine cells.” Diabetologia 28: 464-6.
Degnbol, B. and Green, A. (1978). “Diabetes mellitus among first- and second- degree relatives of early onset diabetics.” Annals of Human Genetics 42: 25-47.
Deschamps, I., Hors, J., et al. (1990). “Excess of maternal HLA-DR3 antigens in HLA DR3,4 positive type 1 (insulin-dependent) diabetic patients.” Diabetologia 33: 425-30.
Diabetes Epidemiology Research International ( 1987). “Preventing insulin dependent diabetes mellitus: the environmental challenge.” British Medical Journal 295: 479-81.
Diabetes Epidemiology Research International Group ( 1988). “Geographic patterns of childhood insulin-dependent diabetes mellitus.” Diabetes 37: 11 13-9.
Donald, J. A., Barendse, W., et al. (1989). “Linkage studies of HLA and insulin gene restriction fragment length polymorphisms in families with IDDM.” Genetic Epidemiology 6: 77-8 1.
Doniach, I. and Morgan, A. G. (1973). “Islets of Langerhans in juvenile diabetes mellitus.” Clinical Endocrinology 2: 233-48.
Dorman, J. S., LaPorte, R. E., et al. (1990). “Worldwide differences in the incidence of type I diabetes are associated with the amino acid variation at position 57 of the HLA-DQ chain.” Proceedings of the National Academy of Science of the United States of America 87: 7370-74.
Dosch, H. M., Karjalainen, J., et al. (1992). Nutritional triggers of IDDM. Epidemiology and etiology of insulin-dependent diabetes in the young. Basel, Switzerland, Karger. 202- 17.
Easteal, S., Kohonen-Corish, M. R. J., et al. (1990). “HLA-DP variation as additional risk factor in IDDM.” Diabetes 39: 855-7.
193
Elliott, R. B. and Martin, J. M. (1984). “Dietary protein: a trigger of insulin- dependent diabetes in the BB rat ?” Diabetologia 26: 297-9.
Erickson, R. P. (1989). “Why isn’t a mouse more like a man?” Trends in Genetics 5: 1-3.
Eto, M., Watanabe, K., et al. (1986). “Apolipoprotein E polymorphism and hyperlipidaemia in type II diabetics.” Diabetes 35: 1374-82.
Falk, C. T. (1987). HLA haplotype sharing in IDDM affected sib pairs as a function of HLA-DR genotype. Genetic epidemiology: applications and comparisons of methods. New York, Alan R Liss. 353-8.
Falk, C. T. (1989). “Characteristics of a mutiplex IDDM sample: unexplained differences with other samples.” Genetic Epidemiology 6: 95-100.
Falk, C. T., Field, L. L., et al. (1987). “Transmission of diabetic alleles within the HLA complex.” New England Journal of Medicine 317: 768.
Farr, A. G. and Anderson, S. K. (1985). “In-situ ultrastructural demonstration of cells bearing Ia antigens in the murine pancreas.” Diabetes 34 987-90.
Faustman, D., Eisenbarth, G., et al. (1989). “Abnormal T-lymphocyte subsets in type 1 diabetes.” Diabetes 38: 1462-8.
Feutren, G., Papoz, L., et al. (1986). “Cyclosporin increases the rate and length of remissions in insulin-dependent diabetes of recent onset. Results of a multicentre double-blind trial.” Lancet ii: 119-24.
Field, L. L. (1989). “Genes predisposing to IDDM in multiplex families.” Genetic Epidemiology 6: 101-6.
Field, L. L. (1991). Non-HIA region genes in insulin dependent diabetes mellitus. Bailliere’s Clinical Endocrinology and Metabolism. 413-38.
194
Field, L. L. and McArthur, R. G. (1987). “The genetics of susceptibility to insulin dependent diabetes mellitus - possible new markers.” Clinical and Investigative Medicine 10: 437-43.
Field, L. L., Stephure, D. K., et al. (1991). “Interaction between T-cell receptor beta chain and immunoglobulin heavy chain region genes in susceptibility to insulin dependent diabetes mellitus.” Americal Journal of Human Genetics 4 9 627-34.
Finkelstein, S., Zeller, E., et al. (1972). “No relation between HL-A and juvenile diabetes.” Tissue Antigens 2: 74-7.
Fletcher, J., Mijovic, C., et al. (1988). “Trans-racial studies implicate HLA-DQ as a component of genetic susceptibility to type 1 (insulin-dependent) diabetes.” Diabetologia 31: 864-70.
Fletcher, J., Mijovic, C., et al, (1988). “HLA-DR and DQ-DNA polymorphism in subjects of Asian Indian and White Caucasian origin.” Molecular Immunology 25: 41 1-7.
Fletcher, J., Odugbesan, O., et al. (1988). “Class II HLA DNA polymorphism in type 1 diabetic patients of North Indian origin.” Diabetologia 31: 343-350.
Foulis, A. K. (1989). “In type 1 diabetes, does a non-cytopathic viral infection of insulin-secreting beta-cells initiate the disease process leading to their autoimmune destruction?” Diabetic Medicine 6: 666-74.
Foulis, A. K., Liddle, C. N., et al. (1986). “The histopathology of the pancreas in type 1 (insulin-dependent) diabetes mellitus: a 25-year review of deaths in patients under 20 years of age in the United Kingdom.” Diabetoloeia 2 9 267-74.
Foulis, A. K., McGill, M., et al. (1992). “Cytomegalovirus DNA is not found in pancreases of patients with recently diagnosed type 1 diabetes (abstract).” Diabetic Medicine 9(Suppl 2.): S11.
195
Froguel, P., Vaxillaire, M., et al. (1992). “Close linkage of glucokinase locus on chromosome 7p to early-onset non-insulin-dependent diabetes mellitus.” Nature 356: 162-4.
Gay, E. C., Hamman, R. F., et al. (1989). “Colorado IDDM registry: lower incidence of IDDM in Hispanics.” Diabetes Care 12: 701-8.
Genovese, S., Bonifacio, E., et al. (1992). “Distinct cytoplasmic islet cell antibodies with different riskd for type 1 (insulin-dependent) diabetes mellitus.” Diabetologia 35: 385-8.
Gepts, W. (1965). “Pathologic anatomy of the pancreas in juvenile diabetes mellitus.” Diabetes 14: 619-33.
Gianani, R., Pugliese, A., et al. (1992). “Pronostically significant heterogeneity of cytoplasmic islet cell antibodies in relatives of patients with type 1 diabetes.” Diabetes 41: 347-53.
Ginsberg-Fellner, F., Witt, M. E., et al. (1984). “Congenital rubella syndrome as a model for type 1 (insulin-dependent) diabetes mellitus: increased prevalence of islet cell surface antibodies.” Diabetologia 27: 87-9.
Glerum, M., Robinson, B. H., et al. (1989). “Could bovine serum albumin be the initiating antigen ultimately responsible for the development of insulin-dependent diabetes mellitus?” Diabetes Research 1 0 103-7.
Gottlieb, M. S . (1980). “Diabetes in offspring and siblings of juvenile- and maturity-onset-type diabetes.” Journal of Chronic Disease 33: 331-9.
Green, E. K., Bain, S. C., et al. (1991). “Detection of human apolipoprotein E3, E2 and E4 genotypes by an allele-specific oligonucleotide primed polymerase chain reaction assay: development and validation.” Clinical Chemistry 37: 1263-8.
Hattersley, A. T., Turner, R. C., et al. (1992). “Type 2 diabetes is linked to the glucokinase gene in a large pedigree.” Lancet 339: 1307- 10.
196
Heme, C. M., Ghosh, S., et al. (1992). “Microsatellites for linkage analysis of genetic traits.” Trends in Genetics 8: 288-94.
Heutink, P., van der Mey, A. G . L., et al. (1992). “A gene subject to genomic imprinting and responsible for hereditary paragangliomas maps to chromosome 11q23-qter.” Human Molecular Genetics 1( 1): 7-10.
Hiltunen, M., Hyoty, H., et al. (1991). “Study Group of Childhood Diabetes in Finland. DiMe project: defective antibody reactivity to mumps virus antigen in type 1 diabetes (abstract).” Acta Endocrinol 124 (suppl 3): 15.
Hitman, G. A., Kambo, P. A., et al. (1991). “An analysis of ampified insulin gene products in diabetics of Indian origin.” Journal of Medical Genetics 28: 97-100.
Hitman, G. A., Tarn, A. C., et al. (1985). “Type 1 (insulin-dependent) diabetes and a highly variable locus close to the insulin gene on chromosome 11.” Diabetologia 28: 218-22.
Hoover, M. L., Angelini, G., et al. (1986). “HLA-DQ and T-cell receptor genes in insulin dependent diabetes mellitus.” Cold Spring; Harbor Symposia On Quantitative Biology 51: 803-9.
Hoover, M. L., Black, K. E., et al. (1989). Polymorphisms of the human T-cell receptor a and ß chain genes and their relationship to insulin-dependent diabetes mellitus. Immunobiology of HLA. New York, Springer-Verlag. 41 1-2.
Horn, G. T., Bugawan, T. L., et al. (1988). “Allelic sequence variation of the HLA-DQ loci: Relationship to serology and to insulin-dependent diabetes susceptibility.” Proceedings of the National Academy of Science of the United States of America 85: 6012-6.
Hyer, R. N., Julier, C., et al. (1991). “High-resolution linkage mapping for susceptibility for genes in human polygenic disease: insulin-dependent diabetes mellitus and chromosome 1 1q.” American Journal of Human Genetics 48: 243-57.
197
Jacob, C. O., Aiso, S., et al. (1990). “Prevention of diabetes in nonobese diabetic mice by tumor necrosis factor (TNF): Similarities between TNF- and interleukin 1.” Proceedings of the National Academy of Science of the United States of America 87: 968-72.
Jacobs, K. H., Jenkins, D., et al. (1992). “An investigation of Japanese subjects maps susceptibility to type 1 (insulin-dependent) diabetes mellitus close to the DQA1 gene.” Human Immunology 33:24-8.
Jenkins, D., Mijovic, C., et al. (1990). “Identification of susceptibility loci for type 1 (insulin-dependent) diabetes by trans-racial gene mapping.” Diabetolo-ia 33: 387-95.
Jenkins, D., Mijovic, C., et al. (1991). “Allele specific gene probing supports the DQ molecule as a determinant of inherited susceptibility to type 1 diabetes.” Diabetologia 34: 109- 13.
Jenkins, D., Penny, M. A., et al. (1991). “Tumour Necrosis Factor-Beta polymorphism is unlikely to determine susceptibility to type 1 (insulin-dependent) diabetes mellitus.” Diabetologia 34: 576-8.
Jenson, A. B., Rosenberg, H. S., et al. (1980). “Pancreatic islet cell damage in children with fatal viral infections.” Lancet i: 354-8.
Johannesen, J., Pociot, F., et al. (1993). “A nationwide population based study of the familial prevalence of childhood IDDM in Denmark (abstract).” Journal of Autoimmunity : in press.
Johnston, C., Pyke, D. A., et al. (1983). “HLA-DR typing in identical twins with insulin-dependent diabetes: difference between concordant and discordant pairs.” British Medical Journal 286: 253-55.
Joner, G . and Sovik, O. (1991). ”The incidence of type 1 (insulin-dependent) diabetes mellitus 15-29 years in Norway 1978-1982.” Diabetologia 34: 271-4.
198
Julier, C., Hyer, R. N., et al. (1991). “Insulin-IGF2 region on chromosome 1 1p encodes a gene implicated in HLA-DR4-dependent diabetes susceptibility.” Nature 354: 155-9.
Junien, C. and van Heyningen, V. (1991). “Report of the committee on the genetic constitution of chromosome 11.” Cytogenetics and Cell Genetics 58: 459-554.
Junker, K., Egeberg, J., et al. (1977). “An autopsy study of the islets of Langerhans in acute-onset juvenile diabetes mellitus.” Acta Pathologica Et Microbiologica Scandinavia 85: 699-706.
Karjalainen, J., Martin, J. M., et al. (1992). “A bovine albumin peptide as a possible trigger of insulin-dependent diabetes mellitus.” New England Journal of Medicine 327: 302-7.
Karjalainen, J., Salmela, P., et al. (1989). “A comparison of childhood and adult type 1 diabetes mellitus.” New England Journal of Medicine 320(14): 881-6.
Khalil, I., d‘Auriol, L., et al. (1990). “A combination of HLA-DQb Asp57- negative and HLA-DQa Arg52 confers susceptibility to insulin-dependent diabetes mellitus.” Journal of Clinical Investigation 85: 1315-9.
Kim, S. J. (1985). “Identification of a polymorphic variant associated with HLA- DQw3 and characterised by specific restriction sites within the DQ -chain gene.” Proceedings of the National Academy of Science of the United States of America 82: 8139-43.
Knip, M., Vahasalo, P., et al. (1992). “Natural course of pre-type 1 diabetes in high risk individuals.” Diabetologia 35(Suppl. 1): A32.
Kobayashi, T., Itoh, T., et ai. (1987). “Time course of islet cell antibodies and cell function in non-insulin dependent stage of type 1 diabetes.” Diabetes 36: 510- 17.
199
Kohonen-Corish, M. R. J., Serjeantson, S. W., et al. (1987). “Insulin-dependent Diabetes Mellitus: HLA-DR and -DQ genotyping in three ethnic groups.” Disease Markers 5: 153-64.
Kontiainen, S., Scheinin, T., et al. (1988). “Differences in HLA types in children with insulin-dependent diabetes diagnosed in 1960s, 1970s, and 1980s.” Lancet ii: 2 19.
Krensky, A. M., Weiss, A., et al. (1990). “T-lymphocyte-antigen interactions in transplant rejection.” New England Journal of Medicine 322: 510-17.
Kuller, L. H., Becker, D. J., et al. (1990). “Evolution of the Pittsburgh Studies of the epidemiology of insulin-dependent diabetes mellitus.” Genetic Epidemiology 7: 105-19.
Kwok, W. W., Mickelson, E., et al. (1990). “Polymorphic and interactions dictate HLA class II determinants of allo-recognition.” Journal of Experimental Medicine 171: 85-95.
Lander, E. S., Green, P., et al. (1987). “MAPMAKER: an interactive computer package for constructing primary genetic linkage maps of experimental and natural populations.” Genomics 1: 174-81.
Landin-Olsson, M., Karlsson, A., et al. (1989). “Islet cell and other organ specific autoantibodies in all children developing type 1 (insulin-dependent) diabetes in Sweden during one year and in matched control children.” Diabetologia 32: 387- 95.
Lathrop, G. M., Lalouel, J. M., et al. (1984). “Strategies for multilocus linkage analysis in humans.” Proceedings of the National Academy of Science of the United States of America 81: 3443-6.
Lawrence, R. L. (1951). “Types of Human Diabetes.” British Medical Journal : 373-5.
200
Lench, N., Stanier, P., et al. (1988). “Simple non-invasive method to obtain DNA for gene analysis.” Lancet i: 1356-8.
Like, A. A., Guberski, D. L., et al. (1991). “Influence of environmental viral agents on frequency and tempo of diabetes mellitus in BB/Wor rats.” Diabetes 40: 259-62.
Lo, D., Burkly, L. C., et al. (1988). “Diabetes and tolerance in transgenic mice expressing class II MHC molecules in pancreatic beta cells.” Cell 53: 159-68.
Love, J. M., Knight, A. M., et al. (1990). “Towards construction of a high resolution map of the mouse genome using PCR-analysed microsatellites.” Nucleic Acids Research 18: 4123-30.
Ludvigsson, J. and Afoke, A. O. (1989). “Seasonality of type 1 (insulin- dependent) diabetes mellitus: values of C-peptide, insulin antibodies and haemoglobin show evidence of a more rapid loss of insulin secretion in epidemic patients.” Diabetoloeia 32: 84-91.
Lund, T., OReilly, L., et al. (1990). “Prevention of insulin dependent diabetes in non-obese diabetic mice by transgenes encoding modified I-A or normal I- E Nature 345: 727-9.
Lundin, K. E. A., Gauderernack, G., et al. (1988). “T-lymphocytes clones recognising an HLA-DQw3.2-associated epitope involving residue 57 on the chain.” Human Immunology 22: 235-46.
MacCuish, A. C., Irvine, W. J., et al. (1974). “Antibodies to pancreatic islet cells in insulin-dependent diabetics with coexistant autoimmune disease.” Lancet ii: 1529-3 1.
Maki, M., Hallstrom, O., et al. (1984). “Increased prevalence of coeliac disease in diabetes.” Archives of Disease in Childhood 59: 739-42.
Martin, J. M., Trink, B., et al. (1991). “Milk proteins in the etiology of insulin- dependent diabetes mellitus (IDDM).” Annals of Medicine 23: 447-52.
201
Matsuani, A., Janssen, R., et al. (1992). “A polymorphic (CA),, repeat element
maps the human glucokinase gene (GCK) to chromosome 7p.” Genomics 12: 319- 325.
Mayer, E. J., Hammar, R. F., et al. (1988). “Reduced risk for IDDM among breast-fed children.” Diabetes 37: 1625-32.
McCulloch, D. K., Klaff, L. J., et al. (1990). “Nonprogression of subclinical beta- cell dysfunction among first-degree relatives of IDDM patients. 5-yr follow-up of the Seattle Family Study.” Diabetes 3 9 549-56.
McDevitt, H. O. and Bodmer, W. F. (1974). “HL-A, immune-response genes and disease.” Lancet i: 1269-75.
McGinnis, R. E., Spielman, R. S. , et al. (1991). “Linkage between the insulin gene (IG) and susceptibility to insulin-dependent diabetes mellitus (IDDM)(abstract).” American Journal of Human Genetics 4 9 476A.
Mensen, M. A., Forrest, J. M., et al. (1978). “Rubella infection and diabetes mellitus.” Lancet i: 57-60.
Metcalfe, M. A. and Baum, J. D. (1991). “Incidence of insulin dependent diabetes in children aged under 15 years in the British Isles during 1988.” British Medical Journal 302: 443-7.
Michelsen, B. and Lernmark, A. (1987). “Molecular cloning of a polymorphic DNA endonuclease fragment that associates insulin-dependent diabetes with HLA- DQ.” Journal of Clinical Investigation 79: 1144-52.
Mijovic, C., Jenkins, D., et al. (1991). “HLA-DQA1 and DQB1 alleles are associated with genetic susceptibility to type 1 diabetes in a Black population.” Diabetes 40: 748-53.
Millward, B. A., Alviggi, L., et al. (1986). “Immune changes associated with insulin dependent diabetes may remit without causing the disease: a study in identical twins.” British Medical Journal 292: 793-6.
202
Millward, B. A., Welsh, K. I., et al. (1987). “T-cell receptor beta chain poly morphisms are associated with insulin-dependent diabetes. ” Clinical and Experimental Immunology 70: 152-7.
Miyazaki, T., Uno, M., et al. (1990). “Direct evidence for the contribution of the unique to the development of insulitis in non-obese diabetic mice.” Nature 345: 722-4.
Morton, N. E. (1955). “Sequential tests for the detection of linkage.” American Journal of Human Genetics 7: 277-3 18.
Murphy, M. (1992). “Unravelling the genetics of insulin dependent diabetes: the B.D.A. - Warren Repository.” Balance (February/March): 44-5.
Nadeau, J. H. (1989). “Maps of linkage and synteny homologies between mouse and man.” Trends in Genetics 5: 82-6.
Nepom, B. S., Palmer, J., et al. (1986). “Specific genomic markers for the HLA- DQ subregion discriminate between DR4+ insulin dpendent diabetes mellitus and DR4+ seropositive juvenile rheumatoid arthritis.” Journal of Experimental Medicine 164: 345-50.
Nepom, B. S., Schwarz, D., et al. (1987). “Transcomplementation of HLA genes in IDDM.” Diabetes 36: 114-7.
Nerup, J., Cathelineau, C., et al. (1977). HLA and endocrine disease. HLA and disease. Munksgaard, Copenhagen,
Nerup, J., Platz, P., et al. (1974). “HL-A antigens and diabetes mellitus.” Lancet ii: 864-6.
Ohashi, P. S., Oehen, S., et al. (1991). “Ablation of tolerance and induction of diabetes by virus infection in virai antigen transgenic mice.” Cell 65: 305-17.
203
Oldstone, M. B. A., Nerenberg, M., et al. (1991). “Virus infection triggers insulin- dependent diabetes mellitus in a transgenic model: role of anti-self (virus) immune response.” Cell 65: 3 19-3 1.
Olmos, P., A’Hern, R., et al. (1988). “The significance of the concordance rate for type 1 (insulin-dependent) diabetes in identical twins.” Diabetologia 31: 747-50.
Owerbach, D., Gunn, S. , et al. (1990). “Multigenic basis for type 1 diabetes: association of HRAS 1 polymorphism with HLA-DR3, DQw2/DR4, DQw8.” Diabetes 39: 1504-9.
Owerbach, D., Lernmark, A., et al. (1983). “HLA-D region chain DNA endonuclease fragments differ between HLA-DR identical healthy and insulin- dependent diabetic individuals.” Nature 303: 8 15-7.
Owerbach, D. and Nerup, J. (1982). “Restriction fragment length polymorphism of the insulin gene in diabetes mellitus.” Diabetes 31: 275-7.
Pak, C . Y., Cha, C. Y., et al. (1990). “Human pancreatic islet cell specific 38 kilodalton autoantigen identified by cytomegalovirus induced monoclonal islet cell antibody.” Diabetologia 33: 569-72.
Palmer, J. P., Asplin, C. M., et al. (1983). “Insulin antibodies in insulin- dependent diabetes before insulin treatment.” Science 222: 1337-9.
Palmer, J. P. and McCulloch, D. K. (1991). “Prediction and prevention of IDDM- 1991.” Diabetes 40: 943-7.
Patel, P., Lo, Y.-M. D., et al. (1993). “Rapid detection of susceptibility alleles to insulin-dependent diabetes mellitus at the DRB1, DQB1 and DQA1 loci by multiplex allele-specific PCR.” Tissue Antigens : in press.
Penny, M. A., Jenkins, D., et al. (1992). “Susceptibility to IDDM in a Chinese population.” Diabetes 41: 914-9.
204
Pociot, F., Johannesen, J., et al. (1993). “Comparison of genetic susceptibility factors in familial IDDM index cases and ”true sporadic” IDDM cases (abstract).” Journal of Autoimmunity : in press.
Prochazka, M., Leiter, E. H., et al. (1987). “Three recessive loci required for insulin-dependent diabetes in nonobese diabetic mice.” Science 237: 286-9.
Raffel, L. J., Vadheim, C. M., et al. (1991). “HLA-DR and the 5’ insulin gene polymorphism in insulin-dependent diabetes.” Metabolism 40: 1244-8.
Reijonen, H., Ilonen, J., et al. (1991). “HLA-DQB1 alleles and absence of Asp 57 as susceptibility factors of IDDM in Finland.” Diabetes 4 0 1640-44.
Rich, S. S. (1990). “Mapping genes in diabetes.” Diabetes 39: 13 15-9.
Rich, S. S., French, L. R., et al. (1993). “HLA-associated susceptibility to type 2 (non-insulin-dependent) diabetes mellitus: the Wadena City Health Study.” Diabetologia 36: 234-8.
Rich, S. S., Panter, S. S., et al. (1991). “Shared genetic susceptibility of type 1 (insulin-dependent) and type 2 (non-insulin-dependent) diabetes mellitus: contributions of HLA and haptoglobin.” Diabetologia 34: 350-55.
Riley, W. J., Maclaren, N. K., et al. (1990). “A prospective study of the development of diabetes in relatives of patients with insulin-dependent diabetes.” New England Journal of Medicine 323: 1167-72.
Riley, W. J., Maclaren, N. K., et al. (1981). “Thyroid autoimmunity in insulin- dependent diabetes mellitus: the case for routine screening.” Journal of Pediabics 98: 350-54.
Riley, W. J., Maclaren, N. K., et al. (1980). “Adrenal autoantibodies and Addison’s disease in insulin-dependent diabetes mellitus.” Journal of Pediatrics 97: 191-5.
205
Risch, N. (1987). “Assessing the role of HLA-linked and unlinked determinants of disease.” American Journal of Human Genetics 40: 1-14.
Risch, N. (1989). “Genetics of IDDM: Evidence for complex inheritance with HLA.” Genetic Epidemiology 6: 143-8.
Risch, N. (1990). “Linkage strategies for genetically complex traits. 1. Multilocus models.” Amen ‘can Journal of Human Genetics 46: 222-8.
Risch, N. (1990). “Linkage strategies for genetically complex traits. II. The power of affected relative pairs.” American Journal Human Genetics 4 6 229-41.
Risch, N. (1990). “Linkage strategies for genetically complex traits. III. The effect ofmarker polymorphism on analysis of affected relative pairs.” American Journal of Human Genetics 46: 242-53.
Risch, N. (1991). “A note on multiple testing procedures in linkage analysis.” American Journal of Human Genetics 48: 1058-64.
Rosenbloom, A. L., Hunt, S. S., et al. (1982). “Ten-year prognosis of impaired glucose tolerance in siblings of patients with insulin-dependent diabetes.” Diabetes 31: 385-7.
Rotter, J. I., Vadheim, C . M., et ai. (1987). HLA haplotype sharing and proband genotype in IDDM. Genetic epidemiology: applications and comparisons of methods. New York, Alan R Liss. 347-52.
Rotwein, P., Chyn, R., et al. (1981). “Polymorphism in the 5’-flanking region of the human insulin gene and its possible relation to type 2 diabetes.” Science 213: 11 17-20.
Rotwein, P. S., Chirgwin, J., et al. (1983). “Polymorphism in the 5’ flanking region of the human insulin gene: a genetic marker for non-insulin-dependent diabetes.” New England Journal of Medicine 308: 65-71.
206
Rowe, B. R., Bain, S. C., et al. (1990). “Mapping the future.” Balance 119(Oct/Nov): 48-9.
Rubinstein, P. (1991). “HLA and IDDM: Facts and speculations on the disease gene and its mode of inheritance.” Human Immunology 30: 270-77.
Rubinstein, P. and Ginsberg-Fellner, F. (1990). The genetics of insulin-de-pendent diabetes mellitus suceptibility differs among Caucasoids: New York families of Askenazi Jewish and Northern Euroman descent. Third International Congress on Jewsih Genetic Diseases, Tel Aviv, Oxford University Press.
Rubinstein, P., Walker, M., et al. (1986). “Excess of DR3/4 in type 1 diabetes. What does it portend?” Diabetes 35: 985-9.
Sadelain, M. W. J., Quin, H. Y., et al. (1990). “Prevention of type 1 diabetes in NOD mice by adjuvant immunotherapy.” Diabetes 39: 583-9.
Sarvetnick, N., Liggitt, D., et al. (1988). “Insulin-dependent diabetes mellitus induced in transgenic mice by ectopic expression of class II MHC and interferon- gamma.” Cell 52: 773-82.
Savilanhti, E., Simell, O., et al. (1986). “Coeliac disease in insulin-dependent diabetes mellitus.” Journal of Paediatrics 108: 690-93.
Scott, F. W. (1990). “Cow milk and insulin dependent diabetes mellitus: is there a relationship?” American Journal of Clinical Nutrition 51: 489-9 1.
Serrem, D. V., Leiter, E. H., et al. (1988). “Molecular mimicry between insulin and retroviral antigen p73. Development of cross-reactive autoantibodies in sera of NOD and C57BL/KsJ db/db mice.” Diabetes 37: 35 1-8.
Shah, S. C., Malone, J. I., et al. (1989). “A randomized trial of intensive insulin therapy in newly diagnosed insulin-dependent diabetes mellitus. ” New England Journal of Medicine 320: 550-54.
207
She, J. X., Bui, M. M., et al. (1993). “Association and linkage analyses of insulin- dependent diabetes (abstract).” Journal of Autoimmunity : in press.
Sheehy, M. J., Scharf, S. J., et al. (1989). “A diabetes-susceptible HLA haplotype is best defined by a combination of HLA-DR and -DQ alleles.” Journal of Clinical Investigation 83: 830-35.
Simpson, N. E. (1969). “Heritabilities of liability to diabetes when sex and age at onset are considered.” Annals of Human Genetics 32: 283-303.
Singal, D. P. and Blajchman, M. A. (1973). “Histocompatibility (HL-A) antigens, lymphocytotoxic antibodies and tissue antibodies in patients with diabetes mellitus.” Diabetes 22: 429-32.
Slattery, R. M., Kjer-Nielson, L., et al. (1990). “Prevention of diabetes in non- obese diabetic transgenic mice.” Nature 345 724-6.
Smith, C. P., Archibald, H. R., et al. (1988). “Basal and stimulated insulin levels rise with advancing puberty.” Clinical Endocrinology 28: 7- 14.
Smith, C. P., Tarn, A. C., et al. (1988). “Between and within subject variation of the first phase insulin response to intravenous glucose.” Diabetologia 31: 123-5.
Spielman, R. S., Baur, M. P., et al. (1989). “Genetic analysis of IDDM: summary of the G.A.W.5 IDDM results.” Genetic Epidemiology 6: 43-58.
Srikanta, S., Ganda, O. P., et al. (1984). “Pre-type 1 diabetes: linear loss of response to intravenous glucose.” Diabetes 33: 717-20.
Srikanta, S., Ganda, O. P., et al. (1983). “Type 1 diabetes mellitus in monozygotic twins: chronic progressive beta cell dysfunction.” Annals of Internal Medicine 99: 320-26.
Srikanta, S., Ganda, O. P., et al. (1985). “First-degree relatives of patients with type 1 diabetes mellitus.” New England Journal of Medicine 313: 461-64.
208
Sterkers, G., Zeliszewski, D., et al. (1988). “HLA-DQ rather than the HLA-DR region might be involved in dominant nonsusceptibility to diabetes.” Proceedings of the National Academy of Science of the United States of America 85: 6473-7.
Suarez, B. K. and Hodge, S. E. (1979). “A simple method to detect linkage for rare recessive diseases: An application to juvenile diabetes.” Clinical Genetics 15: 126-36.
Suzuki, T., Yamada, T., et al. (1987). Diabetogenic effects of lymphocyte transfusion on the NOD or NOD nude mouse. Immune-Deficient Animals in Biomedical Research. Copenhagen, Karger. 112-6.
Svejgaard, A. and Ryder, L. P. (1989). “HLA and insulin-dependent diabetes: an overview.” Genetic Epidemiology 6 1-14.
Tait, B. D., Mraz, G., et al. (1988). “Association of HLA-DQw3 (TA10-) with type 1 diabetes occurs with DR3/4 but not DR1/4 patients.” Diabetes 37: 926-9.
Takeda, J., Seino, S., et al. (1992). “Human Oct3 gene family: cDNA sequences, alternative splicing, gene organisation, chromosomal location, and expression at low levels in adult tissues.” Nucleic Acids Research 20: 4613-20.
Tarn, A. C., Smith, C. P., et al. (1987). “Type 1 (insulin-dependent) diabetes: a disease of slow clinical onset?” British Medical J o d 294: 342-5.
Tarn, A. C., Thomas, J. M., et al. (1988). “Predicting insulin-dependent diabetes.” Lancet i: 845-60.
Tattersall, R. B. and Fajans, S. S. (1975). “A difference between the inheritance of classical juvenile-onset and maturity-onset type diabetes of young people.” Diabetes 2 4 44-53.
ten Wolde, S., Breedveld, F. C., et al. (1993). “Influence of non-inherited maternal HLA antigens on occurrence of rheumatoid arthritis.” Lancet 341: 200-2.
209
The DCCT Research Group (1987). “Effects of age, duration and treatment of insulin-dependent diabetes mellitus on residual function: observations during eligibility testing for the Diabetes Control and Complications Trial (DCCT).” Journal of Clinical Endocrinology and Metabolism 65: 30-6.
Thivolet, C., Beaufiere, B., et al. (1988). “Islet cell and insulin autoantibodies in subjects at high risk for development of Type 1 (insulin-dependent) diabetes mellitus: the Lyon family study.” Diabetologia 31: 741-6.
Thivolet, C., Beaufiere, B., et al. (1991). ”Autoantibodies and genetic factors associated with the development of type 1 (insulin-dependent) diabetes mellitus in first degree relatives of diabetic patients.” Diabetologia 34 186-9 1.
Thomas, D. J. B., Young, A., et al. (1983). “Evidence for an association between rheumatoid arthritis and autoimmune endocrine disease.” Annals of the Rheumatic Diseases 42: 297-300.
Thomson, G., Robinson, W. P., et al. (1989). “HLA and insulin gene associations with IDDM.” Genetic Epidemiology 6: 155-160.
Thomson, G., Robinson, W. P., et al. (1988). “Genetic heterogeneity, modes of inheritance, and risk estimates for a joint study of Caucasians with insulin- dependent diabetes mellitus.” American Journal of Human Genetics 43: 799-816.
Tillil, H. and Kobberling, J. (1987). “Age-corrected empirical genetic risk estimates for first-degree relatives of IDDM patienta” Diabetes 36: 93-9.
Timsit, J., Caillet-Zucman, S., et al. (1992). “Islet cell antibody heterogeneity among type 1 (insulin-dependent) diabetic patients.” Diabetologia 35: 792-5.
Todd, J. A. (1990). “Genetic control of autoimmunity in type 1 diabetes.” Immunology Today 11: 122-9.
Todd, J. A. (1991). “Assessing genetic risk of type 1 diabetes.” Horizons in Medicine 3: 323-38.
210
Todd, J. A. (1991). “A protective role of the environment in the development of type 1 diabetes?” Diabetic Medicine 8: 906-10.
Todd, J. A., Acha-Orbea, H., et al. (1988). “A molecular basis for MHC class II- associated autoimmunity.” Science 240: 1003-9.
Todd, J. A., Aitman, T. J., et al. (1991). “Genetic analysis of autoimmune type 1 diabetes mellitus in mice.” Nature 351: 542-7.
Todd, J. A. and Bain, S. C. (1992). “A practical approach to the identification of susceptibility genes for type 1 diabetes.” Diabetes 41: 1029-34.
Todd, J. A., Bell, J. I., et al. (1987). “HLA-DQß gene contributes to susceptibility and resistance to insulin-dependent diabetes mellitus.” Nature 329: 599-604.
Todd, J. A., Mijovic, C., et al. (1989). “Identification of susceptibility loci for insulin-dependent diabetes mellitus by trans-racial gene mapping.” Nature 338: 587-9.
Tuomilehto, J., Rewers, M., et al. (1991). “Increasing trend in type 1 (insulin- dependent) diabetes mellitus in childhood in Finland.” - 3 4 282-287.
Tuomilehto, J., Tuomilehto-Wolf, E., et al. (1990). “Coffee consumption as trigger for insulin dependent diabetes mellitus in childhood.” British Medical Journal 300 642-3.
Tuomilehto-Wolf, E, Tuomilehto, J., et al. (1989). “New susceptibility haplotype for type 1 diabetes.” Lancet ii: 299-302.
Ul-Hague Chowdhury, M., Sher, K., et al. (1992). “Type 1 diabetes and coeliac disease (abstract).” Diabetic Medicine 9(Suppl. 2): S46.
Utermann, G. (1987). “Apolipoprotein E polymorphism in health and disease.” American Heart Journal 113: 433-40.
211
Vadheim, C. M., Rotter, J. I., et al. (1986). “Preferential transmission of diabetic alleles within the HLA gene complex.” New England Journal of Medicine 315: 1314-8.
Vardi, P., Ziegler, A. G., et al. (1988). “Concentration of insulin autoantibodies at onset of type 1 diabetes.” Diabetes Care 11: 736-9.
Vialettes, B., Mattei-Zevaco, C., et al. (1988). “Low acute insulin response to intravenous glucose. A sensitive but non-specific marker of early stages of type 1 (insulin-dependent) diabetes.” Diabetologia 31: 592-6.
Vionnet, N., Stoffel, M., et al. (1992). “Nonsense mutation in the glucokinase gene causes earl y-onset non-insulin-dependent diabetes mellitus.” Nature 356: 72 1-2.
Wagener, D. K., Sacks, J. M., et al. (1982). “The Pittsburg study of insulin- dependent diabetes mellitus. Risk for diabetes among relatives of IDDM.” Diabetes 31: 136-44.
Warram, J. H., Krolewski, A. S . , et al. (1984). “Differences in risk of insulin- dependent diabetes in offspring of diabetic mothers and diabetic fathers.” New England Journal of Medicine 311: 149-52.
Weber, J. L. and May, P. E. (1989). “Abundant class of human DNA polymorphisms which can be typed using the polymerase chain reaction.” American Journal of Human Genetics 44: 388-96.
Weissenbach, J., Gyapay, G., et al. (1992). “A second-generation linkage map of the human genome.” Nature 359: 794-801.
Wenham, P. R., Sedky, A., et al. (1991). “Apolipoprotein E phenotyping: a word of caution.” Annals of Clinical Biochemistry 28: 599-605.
WHO Expert Committee on Diabetes Mellitus (1980). WHO Expert Committee on Diabetes Mellitus. Second Report. Geneva, WHO.
212
Wicker, L. S., Miller, B. J., et al. (1987). “Genetic control of diabetes and insulitis in the nonobese diabetic (NOD) mouse.” Journal of Experimental Medicine 165: 1639-54.
Wilbertz, S., Partke, H. J., et al. (1991). “Persistent MHV (mouse hepatitis virus) infection reduces the incidence of diabetes mellitus in non-obese diabetic mice.” Diabetologia 34: 2-5.
Winocour, P. H., Tetlow, L., et al. (1989). “Apolipoprotein E polymorphism and lipoproteins in insulin-treated diabetes mellitus.” Atherosclerosis 75: 167-73.
Wolf, E., Spencer, K. M., et al. (1983). “The genetic susceptibility to type 1 (insulin-dependent) diabetes: analysis of the HLA-DR association.” Diabetologia 24: 224-30.
Wong, F. S., Hibberd, M. L., et al. (1993). “Heterogeneity of type 1 diabetes in relation to genetic susceptibility at different ages of onset (abstract).” Journal of Autoimmunity : in press.
Wong, S., Moore, S., et al. (1991). “Susceptibility to type 1 diabetes in women is associated with the CD3 epsilon locus on chromosome 11.” Clinical and Experimental Immunology 83: 69-73.
Woolf, B. (1955). “On estimating the relation between blood group and disease.” Annals of Human Genetics 19: 251-3.
Yoon, J. W., Austin, M., et al. (1989). “Virus induced diabetes mellitus: isolation of a virus from the pancreas of a child with diabetic ketoacidosis.” New England Journal of Medicine 300: 1173-9.
Zhang, Y. and Tycko, B. (1992). “Monoallelic expression of the human H19 gene.” Nature Genetics 1: 40-44.
Zhang, Z. J., Davidson, L., et al. (1991). “Suppression of diabetes in nonobese diabetic mice by oral administration of porcine insulin.” Proceedings ‘n s of the National Academy of Science of the United States of America 88: 10252-6.
213
Ziegler, A. G., Ziegler, R., et al. (1989). “Life-table analysis of progression to diabetes of anti-insulin autoantibody -positive relatives of individuals with type 1 diabetes.” Diabetes 38: 1320-5.
Ziegler, R., Alper, C. A., et al. (1991). “Specific association of HLA-DR4 with increased prevalence and level of insulin autoantibodies in first-degree relatives of patients with type 1 diabetes.” Diabetes 4 0 709-14.
214

PUBLICATIONS ARISING FROM THIS THESIS
215
Bain, S. C., Todd, J. A., et al. (1990). “The British Diabetic Association - Warren Repository.” Autoimmunity 7: 83-5.
Bain, S. C., Rowe, B. R., et al. (1990). “Coffee consumption as trigger for insulin dependent diabetes mellitus in childhood.” British Medical Journal 300 1012.
Rowe, B. R., Bain, S. C., et al. (1990). “Mapping the future.” Balance 119 (Oct/Nov): 48-9.
Bain, S. C., Barnett, A. H., et al. (1991). “Genes for diabetes.” British Medical Journal 302: 1423.
Green, E. K., Bain, S. C., et al. (1991). “Detection of human apolipoprotein E3, E2 and E4 genospes by an allele-specific oligonucleotide primed polymerase chain reaction assay: development and validation.” Clinical Chemistry 37: 1263-8.
Hyer, R. N., Julier, C., et al. (1991). “High-resolution linkage mapping for susceptibility for genes in human polygenic disease: insulin-dependent diabetes mellitus and chromosome 11q.” American Journal of Human Genetics 48: 243-57.
Bain, S. C., Prins, J. B., et al, (1992). “Insulin gene region-encoded susceptibility to type 1 diabetes is not restricted to HU-DR4-positive individuals.” Nature Genetics 2: 212-5.
Bain, S. C., Barnett, A. H., et ai. (1992). ”Lack of an association between type 1 diabetes and the glucokinase gene.” Lancet 340: 54-5.
Bain, S. C. and Barnett, A. H. (1992). “Molecular genetics of type I diabetes.” Practical Diabetes 9: 96-99.
Bain, S. C . and Todd, J. A. (1992) ”Prophylactic insulin.” Lancet 340: 376-7.
216
Cavan, D. A., Bain, S. C., et al. (1992). “The genetics of type 1 (insulin- dependent) diabetes mellitus.” Journal of Medical Genetics 29: 441-6.
Todd, J. A. and Bain, S . C. (1992). “A practical approach to the identification of susceptibility genes for type 1 diabetes.” Diabetes 41: 1029-34.
Bain, S . C. and Todd, J. A. (1993). “Mapping MHC Class II genes/disease susceptibility.” Methods in Molecular Biology. PCR: Selected protocols New Jersey, Humana. (in press).
Abstracts:
Bain, S. C., Guy, M., et al. (1990). “Glycosylation and apolipoprotein E phenotype: increased proportion of E2 may contribute to diabetic dyslipoproteinaemia .” Diabetic Medicine 7 35A.
Bain, S . C, Rowe, B. R, et al. (1991). “The British Diabetic Association-Warren Repusitory of multiplex families with type I diabetes mellitus” Diabetic Medicine 8: 28A.
Bain, S. C, Rowe, B. R, et al. (1992). “The B.D.A. - Warren Repository of multiplex families with type I diabetes mellitus.” Diabetologia 34 (suppl.2): A104.
Bain, S . C., Prins, J-B., et al. (1992). “Use of the British Diabetic Association - Warren Repository to investigate insulin gene region-associated susceptibility to type 1 diabetes mellitus.” Diabetic Medicine 9(suppl.1): 11A.
Bain, S. C., Prins, J-B., et al. (1992). “A comparison of the HLA and insulin gene region associations between probands from type 1 diabetic multiplex families and sporadic diabetics in the same population.” Diabetes 41: 91A.
Bain, S . C, Rowe, B. R, et al. (1992) “Analysis of Insulin gene region-encoded susceptibility to type 1 diabetes in a UK data set.” Diabetologia 35(suppl.1): A137.
217
Bain, S. C, Rowe, B. R, et al. (1992). “Use of the British Diabetic Association - Warren Repository to investigate a polymorphism linked to the human glucokinase gene and type 1 diabetes mellitus.” Diabetic Medicine 9(suppl.2): S26.
Bain, S. C., Green, E. K., et al. (1992). “Direct analysis of apolipoprotein E genotype shows no evidence of different allelic or genotypic frequencies in subjects with type 1 and type 2 diabetes compared with controls.” Diabetic Medicine 9(Suppl. 2): S23.
Bain, S. C., Aitman, T. J., et al. (1993). “Clinical heterogeneity of type 1 diabetes mellitus identified by genetic analysis of families.” Diabetic Medicine (in press).
2 1 8