Embed Size (px)
Citation preview
The Pennsylvania State University
The Graduate School
School of Hotel, Restaurant and Recreation Management
THE EFFECT OF PERSONAL VALUES,
ORGANIZATIONAL CULTURE, AND PERSON-
ORGANIZATION FIT ON INDIVIDUAL OUTCOMES
IN THE RESTAURANT INDUSTRY
A Thesis in
Man-Environment Relations
by
Mustafa Tepeci
2001 Mustafa Tepeci
Submitted in Partial Fulfillment of the Requirements
for the Degree of
Doctor of Philosophy
May 2001
We approve the thesis of Mustafa Tepeci.
Date of Signature
Albert L. Bartlett Assistant Professor of Hotel, Restaurant and Recreation Management Thesis Advisor Chair of Committee
Garry E. Chick Associate Professor of Hotel, Restaurant and Recreation Management
Arun Upneja Assistant Professor of Hotel, Restaurant and Recreation Management
Linda K. Trevino Professor of Organizational Behavior
William P. Andrew Associate Professor of Hotel, Restaurant and Institutional Management Professor in Charge of Graduate Programs in Hotel, Restaurant and Institutional Management
iii
ABSTRACT
Person-Organization fit seeks to identify how congruence of organizational culture
and individual values predicts individual attitudes and behaviors. This study developed the
Hospitality Industry Culture Profile (HICP), an instrument to assess perceived organizational
culture, preferred organizational culture (interpreted as individual values), and person-
organization (P-O) fit in hospitality organizations. The instrument was administered to a
sample of 326 employees representing 34 restaurants. A seven-factor structure of
organizational culture was identified. A .67 correlation among culture profiles of 26
restaurants suggests an industry-wide restaurant culture exists.
Then, perceived organizational culture, preferred organizational culture, and the fit
between the two (P-O fit) were assessed as predictors of job satisfaction, intent to remain,
and willingness to recommend the organization. Hierarchical regression analyses were
conducted at the individual-level and cross-level. Among perceived culture factors, only the
Honesty/People Orientation factor predicted the outcomes. Among preferred culture factors,
the Honesty/People Orientation and Fair Compensation/Employee Development factors
predicted the outcomes. Perceived and calculated P-O fit were assessed. Mixed and limited
results in correlating the measures indicate continuing questions about measurement of P-O
fit. Perceived fit was found to explain variance in the outcomes beyond that explained by
organizational culture and individual values, but calculated fit did not. Perceived and
calculated P-O fit explained significant variance in the outcomes when perceived and
preferred culture were not in the model.
iv
For hospitality research, the HICP provides a tool to further assess culture, individual
values, fit, and their effects. For hospitality practice, the findings support hiring and
socializing employees to enhance fit, and managing employees to demonstrate people
orientation, honesty, and overall concern for employees’ well-being.
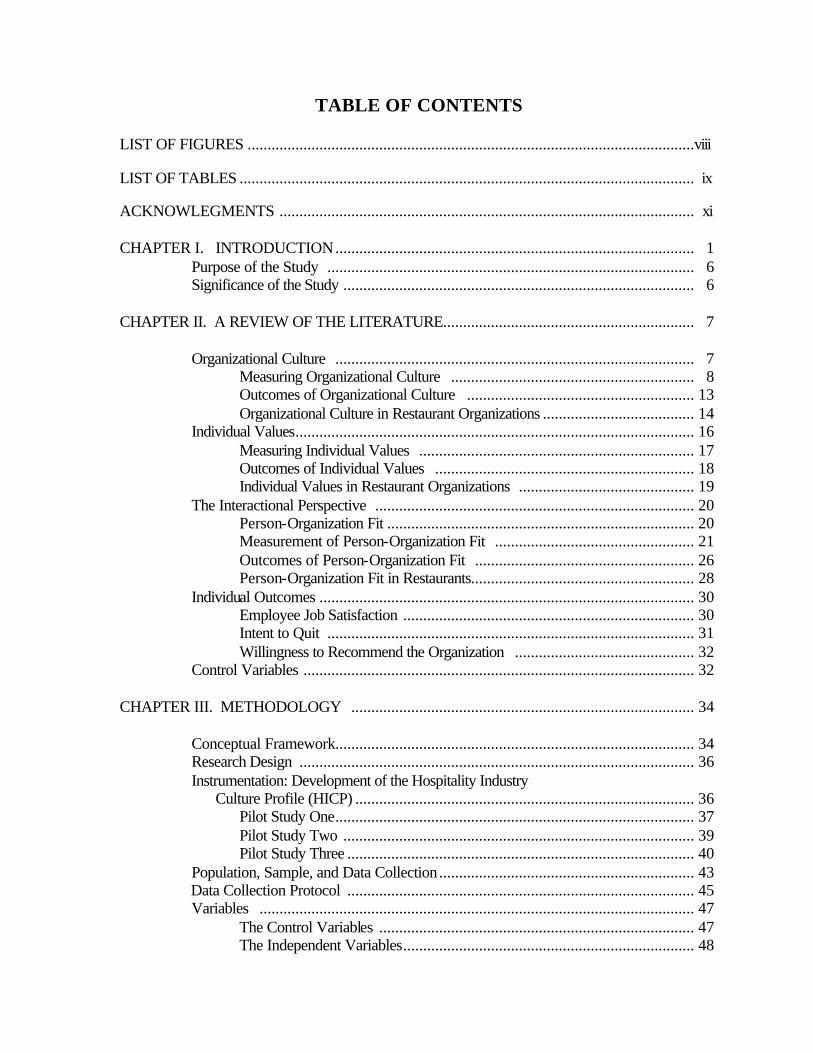
TABLE OF CONTENTS
LIST OF FIGURES ................................................................................................................viii LIST OF TABLES .................................................................................................................. ix ACKNOWLEGMENTS ........................................................................................................ xi
CHAPTER I. INTRODUCTION.......................................................................................... 1 Purpose of the Study ............................................................................................ 6 Significance of the Study ........................................................................................ 6 CHAPTER II. A REVIEW OF THE LITERATURE............................................................... 7
Organizational Culture .......................................................................................... 7
Measuring Organizational Culture ............................................................. 8 Outcomes of Organizational Culture ......................................................... 13
Organizational Culture in Restaurant Organizations ...................................... 14 Individual Values.................................................................................................... 16
Measuring Individual Values ..................................................................... 17 Outcomes of Individual Values ................................................................. 18 Individual Values in Restaurant Organizations ............................................ 19
The Interactional Perspective ................................................................................ 20 Person-Organization Fit ............................................................................. 20 Measurement of Person-Organization Fit .................................................. 21 Outcomes of Person-Organization Fit ....................................................... 26 Person-Organization Fit in Restaurants........................................................ 28
Individual Outcomes .............................................................................................. 30 Employee Job Satisfaction ......................................................................... 30 Intent to Quit ............................................................................................ 31 Willingness to Recommend the Organization ............................................. 32
Control Variables .................................................................................................. 32
CHAPTER III. METHODOLOGY ...................................................................................... 34 Conceptual Framework.......................................................................................... 34
Research Design ................................................................................................... 36 Instrumentation: Development of the Hospitality Industry
Culture Profile (HICP) ..................................................................................... 36 Pilot Study One.......................................................................................... 37
Pilot Study Two ........................................................................................ 39 Pilot Study Three ....................................................................................... 40
Population, Sample, and Data Collection................................................................ 43 Data Collection Protocol ....................................................................................... 45 Variables ............................................................................................................. 47
The Control Variables ............................................................................... 47 The Independent Variables......................................................................... 48
vi
TABLE OF CONTENTS (Continued)
The Dependent Variables........................................................................... 49 Data Analysis ....................................................................................................... 51
Factor Analysis of Organizational and Individual Values ............................. 51 Reliability Assessment of the Factor Scales and Dependent Variables Used in the Study .............................................................................. 52 Calculation and Reliability Assessment of the Aggregate Culture Profiles of Restaurants ....................................................................... 52 Calculation of Person-Organization Fit Scores ........................................... 53 Hierarchical Regression Analyses................................................................ 55 Revised Model .......................................................................................... 55 Strength and Limitations of the Study’s Design ........................................... 56
CHAPTER IV. ANALYSIS OF THE DATA ....................................................................... 58
Representativeness of the Sample ........................................................................... 59
Factor Analyses ..................................................................................................... 62 Factor Dimensions of Perceived Restaurant Culture .................................... 63
Factor Dimensions of Preferred Restaurant Culture..................................... 66 Comparability of Perceived and Preferred Culture Profiles ......................... 67
The Cross-Level Sample........................................................................................ 70 Calculation of Person-Organization Fit.................................................................... 74 The Dependent Variables ..................................................................................... 75 Comparison of Fit and Outcome Scores According to Demographics .................... 76
Relationships Among Variables in the Study .......................................................... 78 Relationships Among Person-Organization Fit Scores ........................................... 78
Hierarchical Regression Analyses............................................................................ 83 Individual Level Hierarchical Regression Analysis ....................................... 84 Cross Level Hierarchical Regression Analysis ............................................ 89
CHAPTER V. CONCLUSION ............................................................................................. 94
Restatement of the Problem.................................................................................... 94
Summary of Procedures......................................................................................... 95 Summary of Findings and Conclusion...................................................................... 95 Development of the Hospitality Industry Culture Profile (HICP) and Objective Measurement of Restaurant Culture ............................. 96
Multiple Measures of Person-Organization Fit............................................. 97 Culture, Individual Values, and Person-Organization Fit as Predictors of Attitudes and Behavioral Intentions ................................................ 98 Implications............................................................................................................100 Limitations .............................................................................................................102 Recommendations for Future Research...................................................................103
REFERENCES ... ..................................................................................................................105

vii
TABLE OF CONTENTS (Continued)
APPENDIX A: FACTOR LOADINGS OF 39 VALUE ITEMS ON PERCEIVED
AND PREFERRED ORGANIZATIONAL CULTURE .............................................114 APPENDIX B: SURVEY INSTRUMENT..............................................................................116 APPENDIX C: COVER LETTER...........................................................................................120 APPENDIX D1: ORGANIZATIONAL CULTURE DIMENSIONS AND VALUE
ITEMS FOR FRONT- OF- THE-HOUSE SAMPLE.................................................121
APPENDIX D2: ORGANIZATIONAL CULTURE DIMENSIONS AND VALUE ITEMS FOR BACK- OF- THE-HOUSE SAMPLE ..................................................122
viii
LIST OF FIGURES
2.1 The Original Organizational Culture Profile (Q-sort) Format .............................................. 12 2.2 Person-Organization Fit Calculation by Correlation (Q) Method........................................ 25 3.1 Relationship Between Organizational Culture, Individual Values, Person-Organization Fit and Individual Outcomes ............................................................ 35 3.2 Revised Model ................................................................................................................ 56

ix
LIST OF TABLES 2.1 Organizational Value (Culture) Dimensions Found by the Five Value Instruments............... 9 2.2 Dimensions of Dinner-House Restaurant Culture ....................................................... 15 3.1 Organizational Culture and Individual Value Dimensions .......................................... 37 3.2 Eight Dimensions and 32 Value Items Tested in Pilot Study One........................................ 38 3.3 Ten Dimensions and 40 Value Items Tested in Pilot Study Three....................................... 41 3.4 Eight Perceived Culture and Six Preferred Culture Dimensions Derived From Pilot Study Three ........................................................................................................ 42 3.5 Thirty-six Value Items to Measure Nine Culture and Preferred Culture Dimensions in Restaurants ........................................................................................... 43 4.1 Comparison of Sample and Population Characteristics ...................................................... 61 4.2 Goodness-of-Fit Measures For Confirmatory Factor Analyses.......................................... 63 4.3 Factor Analysis Scores for the Perceived Organizational Culture Dimensions ..................... 65 4.4 Factor Analysis Scores for the Preferred Culture (Individual Value) Dimensions................. 68 4.5 Perceived and Preferred Culture Dimensions Identfied in the Study.................................... 69 4.6 Reliability Scores of Aggregate Culture Profile for Each Restaurant.................................... 71 4.7 Correlations Among Restaurant Culture Profiles................................................................ 73 4.8 Descriptive Statistics for Person-Organization Fit Scores................................................... 74 4.9 Alphas, Means, and Standard Deviations for the Dependent Variables .............................. 75 4.10 Fit and Dependent Variable Mean Scores, Compared According to Demographic Categories ............................................................................................ 77 4.11 Correlations Among All Variables in Entire Sample .......................................................... 79 4.12 Correlations Among All Variables in High Consensus Restaurants .................................... 81 4.13 Individual-Level Hierarchical Regression Results for the Effects of Demographic Variables, Culture, Preferred Culture, and Person-Organization Fit on the Dependent Variables.................................................................................................. 85

x
4.14 Individual-Level Hierarchical Regression Results for the Effects of Fit on the Dependent Variables Without Controlling for Perceived and Preferred Culture ............ 88 4.15 Cross-Level Hierarchical Regression Results for the Effects of Demographic Variables, Culture, Preferred Culture, and Person-Organization Fit on the Dependent Variables.................................................................................................. 90 4.16 Cross-Level Hierarchical Regression Results for the Effects of Fit on the Dependent Variables Without Controlling for Perceived and Preferred Culture ............ 92 5.1 Culture and Individual Value Dimensions Identified in the Study......................................... 96
xi
ACKNOWLEDGEMENTS
I wish to express my sincere gratitude to everyone who helped to make this
dissertation possible. First, my grateful appreciation is extended to my doctoral committee
chair, Dr. Bart Bartlett, for his invaluable supervision and advice throughout my study. His
guidance and instruction made this study possible.
Second, I would like to acknowledge the members of my committee for their
assistance and guidance in this research. I would like to thank Dr. Gary E. Chick for offering
many insights and recommendations that contributed to this study. A special thanks to Dr.
Arun Upneja for being an outstanding research methods professor and making his extensive
knowledge available to me when I needed. I wish to thank Dr. Linda K. Trevino for offering
her expertise and for being a true delight with whom to work.
Third, I would like to convey my sincerest gratitude to my former advisor Dr. Angela
L. Farrar for her friendliness, help, and support. My sincerest appreciation is extended to Dr.
Parks, Dr. DeMicco, Dr. Shafer, and Dr. Mount who provided their valuable time and
expertise throughout my study. Their nurturing of my academic interests and professional
development is gratefully appreciated. I also thank to my friend Dr. Vivienne Wildes for her
help, support, and encouragement.
Finally, I would like to express my deepest gratitude to my wife, Filiz, for her
continued loving support and patience, and for believing in me.
CHAPTER I
INTRODUCTION
An organization can be only as effective as its people. This aphorism is especially
true for restaurant firms, which are characterized by continual and intense customer-staff
contact. Moreover, the dynamic interaction inherent in these service encounters means that
customer contact personnel in service organizations exert a strong influence on customers’
perceptions of service quality and their satisfaction with that service (Bitner, Booms, &
Tetreault, 1990; Heskett, Jones, Loveman, Sasser, & Schlesinger, 1994).
Heskett et al. (1994) proposed a model of a service-profit chain linking employee
satisfaction, customer satisfaction, and organizational performance. According to this model,
internal service quality (for example, fair rewards) drives employee satisfaction, which leads
to attentive customer service, then to customer satisfaction and loyalty, and finally to
organizational profits and growth. Meanwhile, a growing body of evidence supports an
association between employee attitudinal variables and organizational performance
(Hallowell, Schlesinger, & Zornitsky, 1996; Schmit & Allscheid, 1995). Chatman (1991)
and O’Reilly, Chatman and Caldwell (1991) found employee attitudes, as well as their
behavioral intentions, to be directly related to their demonstrated behaviors. These
researchers found that satisfied employees were likely to stay with their organization and
contribute to its financial success and that employees’ “intent to quit,” a behavioral intention,
predicted actual turnover behavior. Moreover, these attitudes and intentions influence
employee effectiveness, customer service, and organizational performance. Thus, it appears

2
that restaurant managers could gain a valuable competitive advantage by understanding the
critical factors that shape employees’ attitudes and subsequent behavioral intentions.
Despite the undeniable influence employees exert over the success of operations in
the restaurant industry, the factors that influence employee satisfaction and behavioral
intentions have been underresearched in the full-service restaurant context. Employee
satisfaction studies have been conducted in quick service restaurants (NCS and National
Food Service Security Council, 1999), in institutional food services (Bartlett, Probber, &
Scerbo, 1999), and in hotels (Mok & Finley, 1986; Pavesic & Brymer, 1990; Pizam &
Neumann, 1988; Pizam & Chandrasekar, 1983). But no study appears to have investigated
the antecedents of employees’ job satisfaction and behavioral intentions in the intense
customer-contact environment of full-service or table-service restaurants. Further, the
studies that have been done were limited to the evaluation of either individual-level or
organization-level antecedents, while a growing body of research suggests a need to examine
the combined effect of individual and organizational factors on employee satisfaction
(Chatman, 1991; Kristof, 1996).
In response to this research gap, the study reported here tests the combined ability of
individual and organizational factors to predict (1) job satisfaction, (2) intent to quit, and
(3) willingness to recommend an employee’s organization, in a full-service restaurant
context. Because of the positive relationship between employee satisfaction and
organizational performance (Hallowell et al., 1994; Wright & Staw, 1999), identifying the
factors that shape employee satisfaction in restaurant organizations is vital. Because the
intent to quit has been found to predict actual turnover (Chatman, 1991; O’Reilly et al., 1991)
and these intentions tend to hinder job performance (Sheridan, 1992), the value in exploring
3
contributing factors to turnover intention is also evident. Finally, because previous research
indicates that a large percentage of new job applicants come from referrals of existing
employees, and referred applicants often demonstrate high performance and low turnover
(Morehart, 2001; Wanous & Colella, 1989), the third dependent variable in the study is a
willingness to recommend the organization as a good place in which to work.
In studying these outcomes, organizational researchers tend to explain employee
satisfaction and behavioral intentions in terms of either organizational or individual
characteristics. Organizational characteristics researchers or “situationalists” are concerned
with how people make sense of their environment, while also identifying those
environmental elements that affect attitudes and behaviors (Davis-Blake & Pfeffer, 1989;
Sheridan, 1992). The situational perspective emphasizes measurement of the environment as
a method of predicting attitudes and behaviors. On the other hand, individual characteristics
researchers or “personalogists” suggest that such individual characteristics as personality
traits, values and beliefs affect attitudes and actions in consistent and characteristic ways
across situations and over time (Staw, Bell, & Clausen, 1986; Weiss & Adler, 1984). The
personal approach emphasizes that one can predict behavior by measuring needs, traits,
values, and motives.
Traditionally, personalogists and situationalists have tried to show how either the
person or the situation alone affects attitudes and behaviors. The personal versus situational
debate has led, however, to a school of thought contending that behavior in organizations
results from the complex interaction between features of the organizational context and
characteristics of individuals (Chatman, 1991; House, Shane, & Herold, 1996). Research
oriented this way has evolved into an interactional perspective based on the fit or
4
correspondence of individual and organizational values. Thus, person-organization
(hereafter, P-O) fit is defined as congruence between the values of organizations (their
culture) and the values of individuals (Chatman, 1989). Values—for people and
organizations—are generalized ideological justifications both for appropriate behaviors and
for the activities and functions of the system (Chatman, 1989). P-O fit is based on the
assumption that individuals seek to achieve and maintain correspondence with their
organization (Schneider, Goldstein, & Smith, 1995). Correspondence between the
employee’s values and the organization’s value system represents a measure of P-O fit, and
this correspondence can predict behavior in organizations.
Although the study and application of P-O fit offers promise for influencing behavior,
most P-O fit studies to date have proceeded in either “classroom” or “strong situations.” In
classroom studies, researchers assessed students’ personal characteristics, presented those
students with descriptions of hypothetical organizations, and found the students preferred
organizations with characteristics that matched their personalities (Bretz, Ash, & Dreher,
1989; Cable & Judge, 1994; Judge & Bretz, 1992; Turban & Keon, 1993). But because
classroom simulation involves artificial organizations, generalizability to real organizations is
in question.
A “strong situation” provides accepted rules and guidelines for behavior. For
example, in government or military settings activities are often determined by formal
organizational structures. These institutionalized rules and guidelines lead individuals to
adopt attitudes and behaviors consistent with the organizational methods and mission and
minimize the effects of the individual traits participants bring to their organizations (Davis-
Blake & Pfeffer, 1989). Therefore, P-O fit studies conducted in strong situations like
5
government agencies or public accounting firms (Boxx, Odom, & Dunn, 1991; Chatman,
1991; O’Reilly et al., 1991) may again fail to capture the fit between individual and situation.
Restaurants offer environments conducive to P-O fit studies because restaurants
provide relatively flexible situations that allow employees a greater range of responses to
work requirements, while encouraging them to add their personal interpretations to the
organizational settings. Yet although restaurants offer an ideal setting in which to study P-O
fit, only two limited studies have occurred in the restaurant industry. Enz (1988) conducted
her research in the corporate headquarters of a quick-service restaurant chain, but did not
include operations-level service employees. Tidball (1988) studied what she termed
“ideological congruence” but conceptualized and operationalized a different construct from
most fit research. In addition to the lack of research into P-O fit, only a few studies have
analyzed individual characteristics or organizational culture individually in the restaurant
industry, and none of these investigated the dependent variables used in this study. For
example, undertaking individual characteristics research, Dienhart, Gregorie, and Downey
(1990) and Groves, Gregorie and Downey (1995) studied the influence of restaurant
employees’ service orientation on such organizational performance outcomes as sales and
productivity. Studies into organizational culture in the restaurant industry (Fintel, 1989;
Woods, 1989) have been limited to only a few organizations, and their observational nature
and limited use of quantitative techniques kept those researchers from making reliable
generalizations regarding the elements of culture that affect performance. Given these
limitations, a need exists to ascertain the influence of individual values, organizational
culture, and P-O fit on employees’ attitudes and behavioral intentions in a wide sample of
restaurant organizations.

6
Purpose of the Study
This research explores how the shared values of restaurant organizations (their
culture) and the values of individual employees are associated with employees’ job-related
attitudes and behavioral intentions. More importantly, the study investigates whether person-
organization fit contributes to explanations of employee job satisfaction, intent to quit, and
willingness to recommend the organization beyond that explained by organizational culture
and individual values.
Significance of the Study
The study is significant and important for at least five reasons. First, it helps fill the
gap in individual characteristics research in restaurants by testing individual values as
predictors of attitudes and behavioral intentions. Second, it contributes to understanding of
organizational culture in restaurant organizations. Third, the introduction of quantitative
measurement to restaurant culture research invites comparisons of individual and
organizational values, and more accurate assessments of their influence. Fourth, it increases
understanding of P-O fit, compares multiple measures of fit, and provides a model that
encourages and facilitates P-O fit research in restaurants. Finally, this study adds external
validity to the P-O fit and hospitality literature by explaining human behavior in actual
organizational contexts.
CHAPTER II
A REVIEW OF THE LITERATURE
One of the biggest challenges restaurant managers face is to attract, retain, and
develop service-oriented employees. One way to meet this challenge is to ensure a match
between organizational values and the values of those they hire. Understanding person-
organization (P-O) fit can help managers select employees whose values and beliefs match
those of the organization and configure socialization experiences to strengthen that match.
Thus, research into P-O fit may provide legitimate insight into improving fit and retaining
employees over the long term. Particularly in the restaurant industry, which is imbued with a
distinct set of “service” values, but is known for high levels of employee turnover, this
information could be invaluable.
The following literature review suggests the contribution P-O fit research could make
to both hospitality scholarship and industry operations. This review examines the conceptual
and empirical developments in organizational culture, individual values, and the interactional
(P-O fit) literature, and concludes with a review of the outcome and control variables used in
the study presented here.
Organizational Culture
Despite increased research interest and industry discussion about the importance of
corporate or organizational culture, there is no consensus about exactly what the term means.
Considerable agreement and overlap do exist, however, regarding the key elements and
8
dimensions of organizational culture, including those of shared meanings, norms, values and
beliefs (Denison, 1996). Values and beliefs constitute the primary elements in organizational
researchers’ various conceptualizations of culture (Chatman, 1989, 1991; O’Reilly et al.,
1991; Schein, 1985, 1996; Vandenberghe, 1999). In this study, organizational culture is
defined as the values members of an organization share. Many researchers prefer this
definition because these shared values are relatively stable and enduring and interact with a
company’s people and organizational structure to produce patterns of behavior (Chatman,
1991).
Organizations do not possess values apart from the values of their members. Thus, an
organizational value system (or culture) is said to exist when (1) individuals know that group
support for a given belief exists, (2) a majority of active members are in agreement, and
(3) the core values of an organization are intensely held throughout the organization
(Chatman, 1991). To the extent that these criteria are met, culture is a relevant and important
unit of analysis (Chatman, 1991). Researchers use various methods and instruments to
measure organizational cultures or values, and the next section briefly describes these
methods and instruments.
Measuring Organizational Culture
Organizational culture has traditionally been assessed by such qualitative methods as
interviews and observations (Smircich, 1983). Qualitative research tools are preferable to
quantitative instruments in helping researchers understand such manifest level elements of
culture as artifacts and stories. However, observation and interviews may encourage
employees to behave differently (usually better) and respond to interview questions in a way
9
they perceive to be socially desirable. Moreover, a participant observer may interpret
observations subjectively. Quantitative methods, on the other hand, offer advantages for
cross-sectional organizational research and large-scale studies (Cooke & Rousseau, 1988).
They enable culture researchers to replicate assessments of culture in different units and to
readily compare data across studies. Objective questions are also less prone to social
desirability bias than interviews. This study uses a quantitative instrument to explore
organizational culture across a broad sample of restaurant organizations.
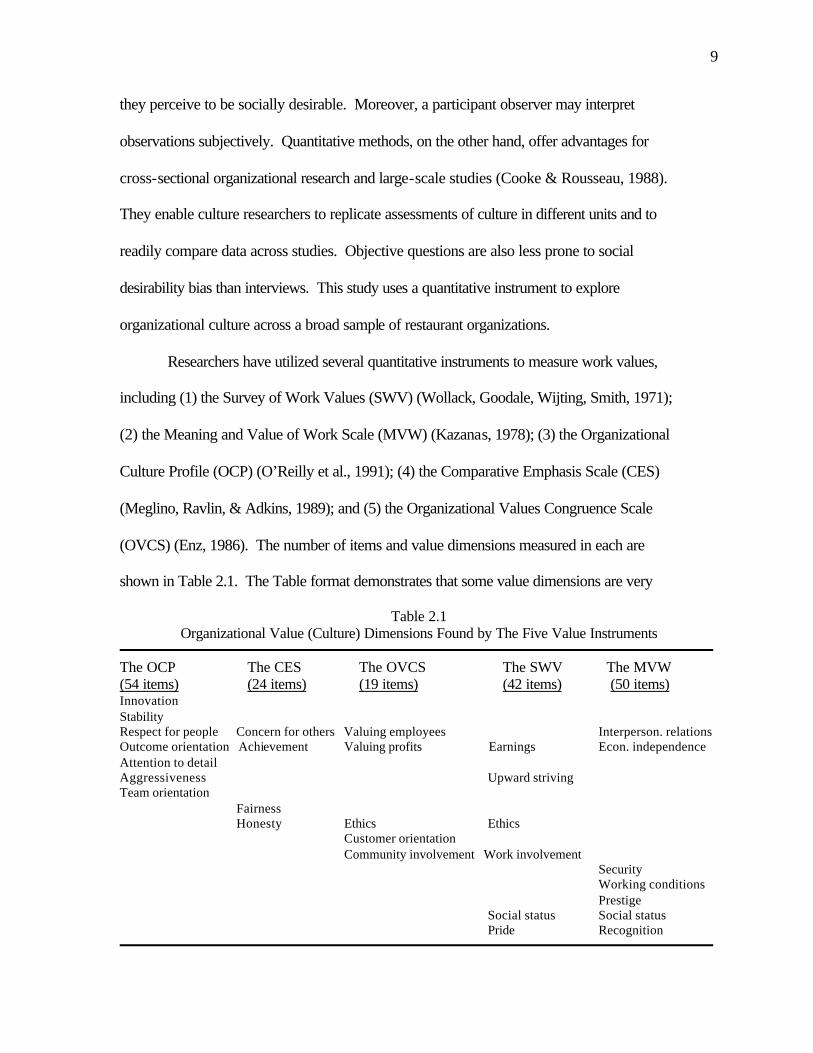
Researchers have utilized several quantitative instruments to measure work values,
including (1) the Survey of Work Values (SWV) (Wollack, Goodale, Wijting, Smith, 1971);
(2) the Meaning and Value of Work Scale (MVW) (Kazanas, 1978); (3) the Organizational
Culture Profile (OCP) (O’Reilly et al., 1991); (4) the Comparative Emphasis Scale (CES)
(Meglino, Ravlin, & Adkins, 1989); and (5) the Organizational Values Congruence Scale
(OVCS) (Enz, 1986). The number of items and value dimensions measured in each are
shown in Table 2.1. The Table format demonstrates that some value dimensions are very
Table 2.1 Organizational Value (Culture) Dimensions Found by The Five Value Instruments
The OCP The CES The OVCS The SWV The MVW (54 items) (24 items) (19 items) (42 items) (50 items) Innovation Stability Respect for people Concern for others Valuing employees Interperson. relations Outcome orientation Achievement Valuing profits Earnings Econ. independence Attention to detail Aggressiveness Upward striving Team orientation
Fairness Honesty Ethics Ethics Customer orientation Community involvement Work involvement Security Working conditions Prestige Social status Social status Pride Recognition
10
similar across multiple instruments, while other dimensions are assessed by only one of the
instruments.
For the current study, the breadth of the 7-dimension OCP offered the most promise
of capturing the cultural elements of the restaurant industry, and its dimensions have been
explored in previous restaurant (Woods, 1989), hotel (Christensen, 1988; Kent, 1990; Pizam,
1993), and service industry culture studies (Chatman & Jehn, 1994; Siehl, 1992). Yet
although the OCP has demonstrated construct validity—stable factor dimensions across
samples including accountants (Chatman, 1991; O’Reilly et al., 1991), service industry
employees (Chatman & Jehn, 1994), government employees (O’Reilly et al., 1991), health
care professionals (Vandenberghe, 1999), and students and campus recruiters (Cable &
Judge, 1997; O’Reilly et al., 1991)—its dimensions do not include elements important to
restaurant culture including (1) service quality or customer orientation (Enz, 1988; Woods,
1989), (2) honesty and ethics (Enz, 1988), (3) employee development, (4) equitable pay and
benefits, and (5) employee empowerment (NCS and National Food Service Security Council,
1999). Thus, rather than choosing dimensions for the current study a priori, a series of pilot
studies were conducted to determine the most appropriate factor dimensions.
In addition to differences in the dimensions measured, the instruments in Table 2.1
use two measurement formats or methods, which Chatman (1991) has termed normative and
ipsative. In the normative technique, respondents rate the extent to which they endorse a set
of items or statements using Likert-type rating scales. Thus, values are assessed
independently of one another (Boxx et al., 1991; Wollack et al., 1971). Ipsative methods
assess preferences between values by requiring respondents either to rank a set of values or
to choose one value at the expense of another in a forced choice format (Cable & Judge,
11
1996, 1997; Chatman, 1991; Enz, 1986, 1988; Meglino et al., 1989; O’Reilly et al., 1991;
Vandenberghe, 1999).
Researchers who utilize normative methods claim a number of advantages (Edwards,
1993, 1994; Wollack et al., 1971). First, because values are rated independently from one
another on the same scale, the resulting data may be high or low on any or all values. That
independent rating makes it possible to capture absolute—interpretable and meaningful—
differences between scores. This information is unavailable when values are ranked because
the ipsative score represents the relative strength of a value compared with others in the set.
Normative data thus lend themselves to parametric statistical analysis such as correlation and
regression analysis (Edwards, 1993, 1994). Finally, ratings are less cumbersome than
rankings, making a normative format more convenient to administer. The SWV and MVW
use normative ratings.
In contrast, other values researchers (Cable & Judge, 1996, 1997; Chatman, 1991;
Locke, 1976; Meglino et al., 1989; O’Reilly et al., 1991; Rokeach & Ball-Rokeach, 1989;
Vandenberghe, 1999) have used ipsative techniques (rank order and forced choice) that
compare values to one another. They contend that (1) because people’s values are
hierarchically organized in their value system, ipsative techniques duplicate the way values
are held by individuals, and (2) because individuals are not completely aware of their belief
structure, values are more accurately measured in choice situations. Further, because ipsative
techniques assess values in comparison to each other and all cannot be given a high rating,
ipsative instruments typically result in greater differentiation of scores and a more normal
distribution (Alwin & Krosnick, 1985). Because many values are socially desirable, the
distribution of normative rating scores is typically skewed.
12
The CES, OVCS, and OCP employ ipsative techniques, and also measure both person
and organization values in one instrument. The CES utilizes a “paired comparison” process
in which descriptions of behaviors reflecting four values (achievement, fairness, honesty, and
concern for others) are paired with one another. From a total of 24 pairs, values are rank
ordered by the number of choices made for each. The OVCS uses a “rank-order” approach
in which value-items reflecting five factors are simply ranked from highest importance to
lowest. This method thus evaluates the relative order of the values without concern for their
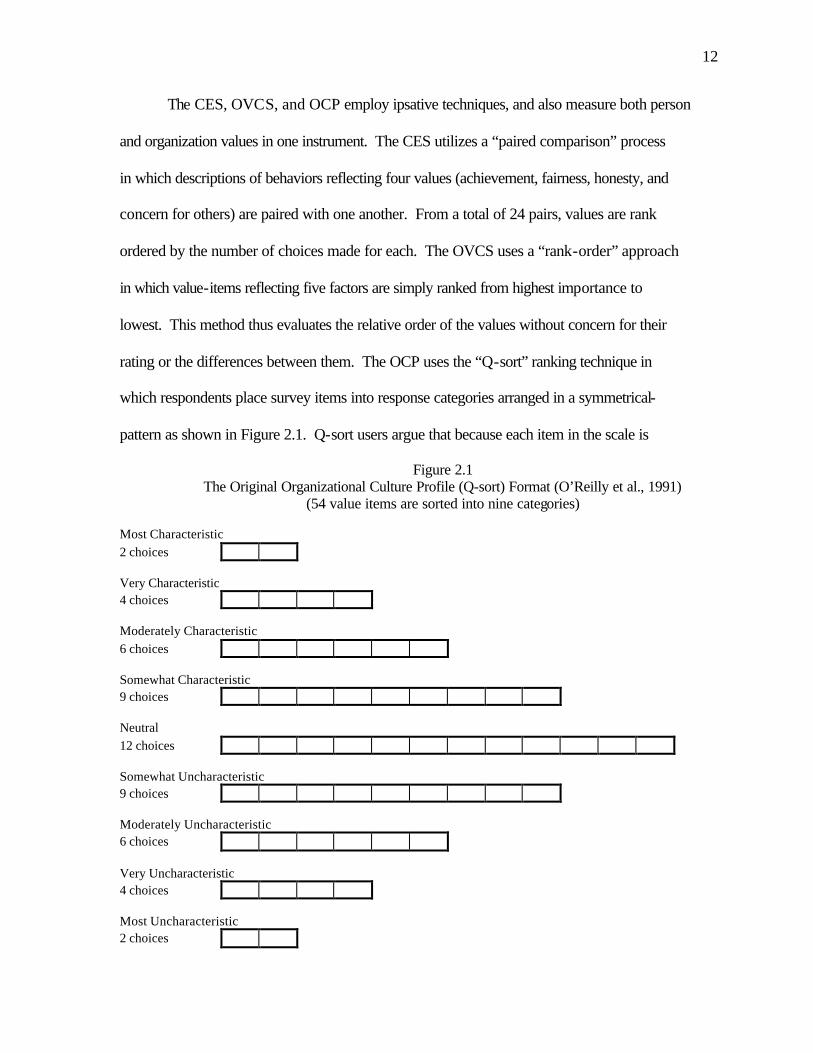
rating or the differences between them. The OCP uses the “Q-sort” ranking technique in
which respondents place survey items into response categories arranged in a symmetrical-
pattern as shown in Figure 2.1. Q-sort users argue that because each item in the scale is
Figure 2.1 The Original Organizational Culture Profile (Q-sort) Format (O’Reilly et al., 1991)
(54 value items are sorted into nine categories) Most Characteristic 2 choices Very Characteristic 4 choices Moderately Characteristic 6 choices Somewhat Characteristic 9 choices Neutral 12 choices Somewhat Uncharacteristic 9 choices Moderately Uncharacteristic 6 choices Very Uncharacteristic 4 choices Most Uncharacteristic 2 choices
13
implicitly compared to every other item, and more than one item can be placed in a category,
scores are more independent of one another than scores collected through the CES and
OVCS (Chatman, 1991).
Edwards (1993, 1994) argues against ipsative techniques, claiming that data derived
from ranking are not independent and the differences between scores are not meaningful. He
contends ipsative data must be treated as ordinal rather than interval. Cornwell and Dunlap
(1994) argue that because the sum of any individual respondent’s rankings equals a constant,
there is a linear dependency among the set of items. This dependence violates the
independence of error variance assumption of classical test theory and limits the use of
standard parametric statistical analyses. Alternatively, Baron (1996) argues that from a purist
perspective even normative scales are not true interval measures, and that the theoretical
advantages of forced-choice formats in eliminating response bias outweigh any statistical
disadvantage. Muting the argument, Nunnally and Bernstein (1994, p. 23) say that most
measurement methods in psychology may be treated as interval scales. In fact, Saville and
Wilson (1991) found a .78 correlation between normative and ipsative versions of the same
personality instrument, and suggest in practice that normative and ipsative data may be more
similar than the debate would indicate. Therefore, as with the factor dimensions, the decision
to use normative or ipsative measurement technique was also based on the pilot studies.
Outcomes of Organizational Culture
Research indicates that culture plays at least four important roles in organizations.
First, culture forms a collective identity that helps its members associate themselves with
their organization’s policies and mission, and feel themselves a part of it (Hofstede, 1998;
14
Peters & Waterman, 1982). Second, organizational culture prescribes norms of acceptable
and unacceptable behavior, making it clear for employees what they should say or do in a
given situation (Kotter & Heskett, 1992; Schein, 1990). Third, these norms help employees
work together to meet customers’ needs and respond to external pressures (Schneider &
Bowen, 1995). Fourth, culture provides structure and control without relying on an
authoritative management style that can lessen motivation and creativity (O’Reilly &
Chatman, 1996).
When organizations promote a certain set of values, like respect for people and high
pay for good performance, they create a social energy or motivation that influences
employees’ attitudes and behaviors. For instance, Peters and Waterman (1982) found
excellent organizations held values about quality, service, the importance of people as
individuals, and innovation that motivated employees to improve performance and increase
their morale, satisfaction, and commitment. Sommer, Bae and Luthans (1996) found that
employees who perceived greater warmth, supportiveness, assigned responsibility, and
rewards in their organizations increased their organizational commitment. Sheridan (1992)
found that firms emphasizing interpersonal relationship values retained employees more
successfully than firms emphasizing work task values. To explore how and why restaurant
organizations’ culture influences employee attitudes and behaviors, one needs to understand
restaurant industry culture, which the next section explains.
Organizational Culture in Restaurant Organizations
Restaurant organizations promote such core values as service to guests, fairness with
employees, caring and empathy, promotion from within, attention to detail, innovation, and
15
teamwork (Fintel, 1989; Withiam, 1996; Woods, 1989). Such cultural values motivate
employees and further enforce desired behaviors and standards for customer service.
Woods (1989), one of the first researchers to study and describe restaurant culture,
investigated five restaurant firms and the culture of the “dinner-house” segment of the
restaurant industry. Using interviews and direct observation, he identified three levels of
culture: (1) the visible or manifest level (artifacts and stories); (2) the strategic level (vision
and market expectations); (3) and the deeply rooted level (values and assumptions). The five
restaurant companies demonstrated different cultural aspects on the surface (manifest) level,
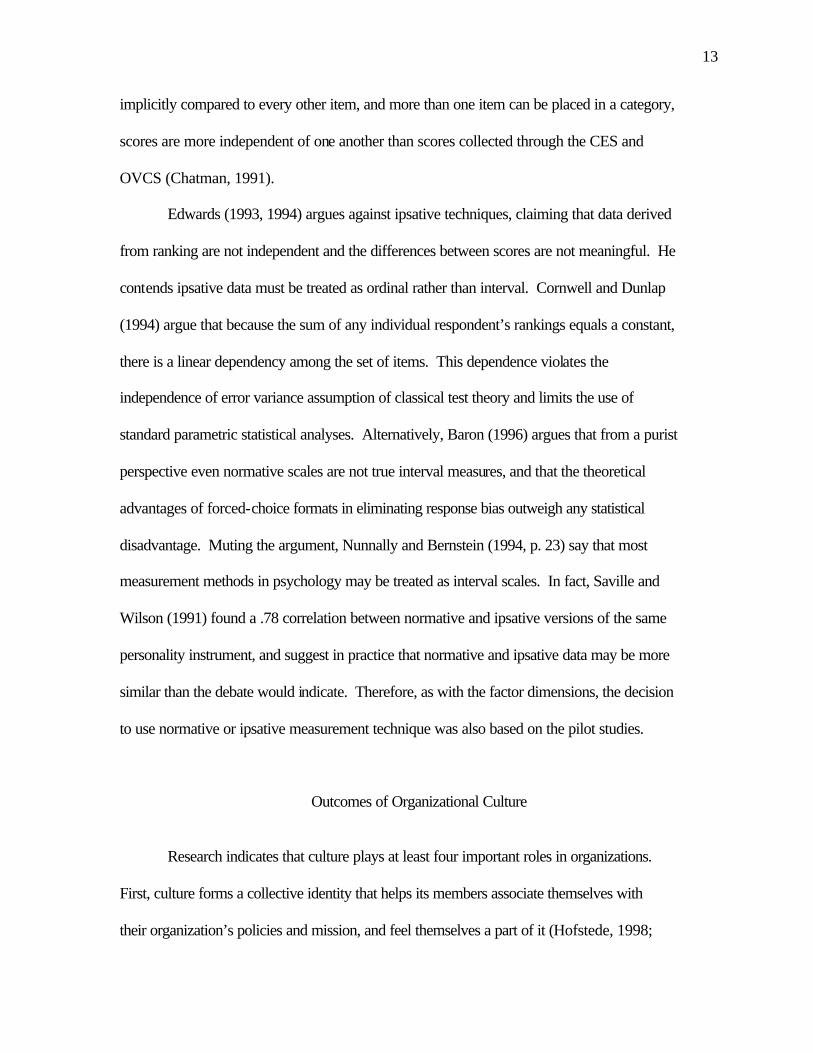
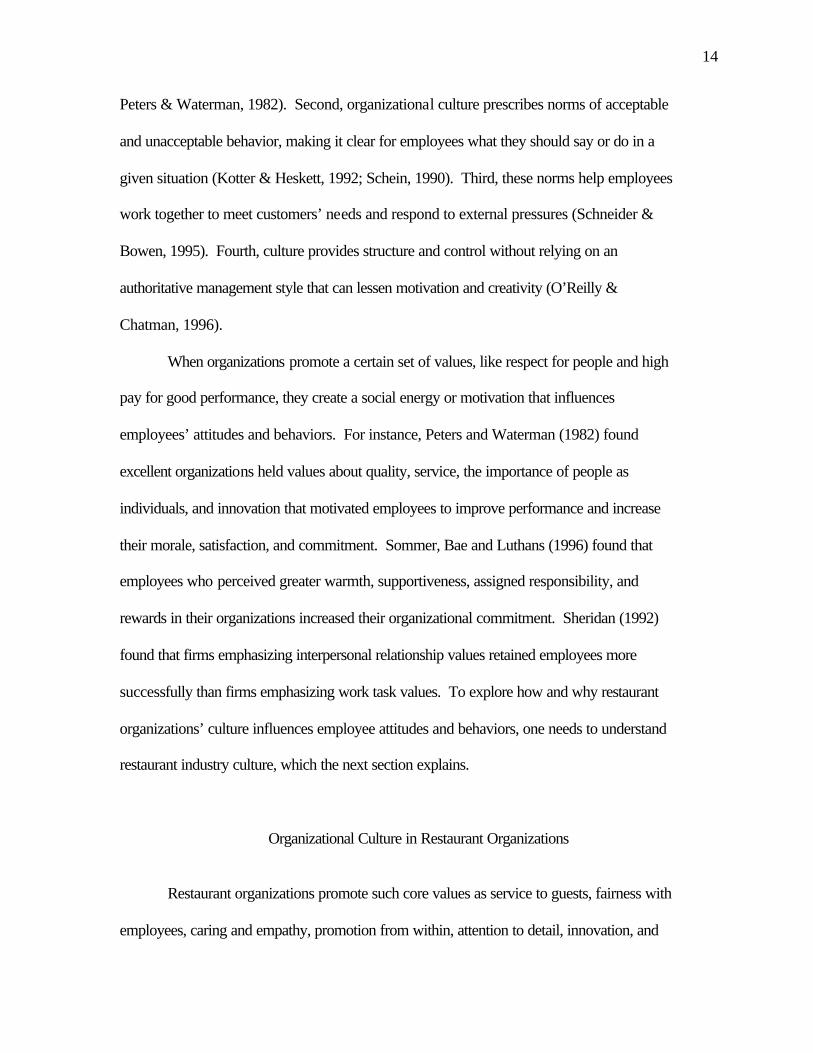
but had remarkably similar values and assumptions on the deepest levels of culture. Table
2.2 summarizes the shared organizational values of dinner-house restaurants identified by
Woods. This study is particularly noteworthy for its detailed descriptions of manifest level
elements of restaurant culture, which are inherently difficult to isolate with quantitative
measurement. For example, one can examine the stories told in employee meetings and
ceremonies only with qualitative methods.
Table 2.2
Dimensions of Dinner-House Restaurant Culture (Woods, 1989)
People make a difference in the success or failure of the company. A people-oriented personality profile fits the industry. The industry requires hard work and burnout is a big problem. Teamwork is essential and fun is important. Successful people have energy and a clear sense of direction. Training is important. Managers rise through the industry ranks.
A recent study of over 1,400 employees from 11 different fast-food restaurants
investigated employee theft in the fast-food restaurant industry (NCS and National Food

16
Service Security Council, 1999) and identified eight favorable characteristics of restaurant
culture: (1) fairness with employees, (2) caring and empathy (3) employee empowerment, (4)
career-enriching opportunities, (5) equitable pay and benefits, (6) accurate matches between
person and job, (7) ethics and honesty, and (8) safe working conditions. The study reports
that theft is epidemic in the restaurant industry but companies that establish and
communicate positive corporate values can experience a significant reduction in
counterproductive behavior and workplace theft. Unfortunately, the report does not indicate
the methodology by which the set of eight characteristics was determined.
The right set of organizational values may help restaurant operators meet such
industry challenges as long work hours, physical demands, and constant contact with often
dissatisfied customers. For instance, Christensen (1988) noted that such organizational
values as guest service and striving for innovation powerfully influenced employee attitudes
and, in return, organizational success and growth. As restaurant managers cope with the
industry’s inherent challenges, the role of organizational values or culture remains a matter of
great interest and concern for hospitality researchers and industry executives.
Individual Values
As an alternative to culture, the “personalogist” view explains behavior based on
individual personality characteristics including values, beliefs, and traits. Values are
fundamental and enduring aspects of both people and organizations. Because values are
common to both organizational culture and individual personality, they are typically used as

17
the individual measure when studying P-O fit (Chatman, 1991; Enz, 1986, 1988; Meglino et
al., 1989, 1992; O’Reilly et al., 1991; Vandenberghe, 1999).
Rokeach (1973) defined individual values as “enduring beliefs through which a
specific mode of conduct (behavior) or end-state (outcome) is personally preferable to its
opposite” (p. 5). Instrumental values relate to behaviors such as honesty, creativity, and
decisiveness. Terminal values refer to outcomes a person strives to achieve, like a
comfortable life, happiness, and wisdom. Rokeach proposed a relationship between
instrumental and terminal values wherein values concerning modes of behavior facilitate the
attainment of the valued outcomes. This study assesses individuals’ instrumental values
because they are similar to the values used to describe organizational culture (Chatman,
1991; Schein, 1985), facilitating comparison of person and organization.
Measuring Individual Values
As with culture, individual values can also be assessed by both qualitative and
quantitative methods. For instance, one can assess personal values by observation or
interview. But as with the qualitative study of culture, drawing inferences about an
individual’s values from their behavior or interview responses is problematic because:
(1) interpreting and quantifying values is difficult; (2) the observer’s (or researcher’s) own
values may influence the assessment; and (3) a person might not be willing or able to talk
about his values, or might be selective in revealing them (Rokeach, 1973). Though
qualitative measurement might be more appropriate for generating a list of values, once that
list is developed quantitative instruments facilitate data collection and analysis, particularly
the proposed comparisons of individual and organizational values.

18
Researchers have utilized several quantitative instruments to measure individual
values. Popular examples include the Value Survey (Schwartz, 1992), the Meaning and
Value of Work Scale (Kazanas, 1978), and the Human Value Index (Ronen, 1978). The
values measured by these instruments, however, do not correspond with organization-level
values in a way that allows fit to be assessed.
Outcomes of Individual Values
In addition to the role of organization level values, both the theoretical and empirical
literatures indicate that individual values are also related to employee attitudes and behaviors.
Dawis and Lofquist (1984), Epstein (1979), and Ronen (1978) viewed values as an integral
part of an individual’s personality structure, and argued that one’s personal value system is a
relatively stable and fundamental component of the individual’s psychological makeup which
influences attitudes and behavior.
Several studies support the influence of individual values on job related attitudes and
behaviors. For example, Kazanas (1978) found employees with intrinsic work value
orientation (for example, independence, self-discipline, and self-actualization) were more
satisfied with their jobs and more productive than employees with extrinsic work value
orientations (for example, working conditions, interpersonal relations, and security). Ronen
(1978) found such personal values as wealth, power, prestige, humanitarianism,
equalitarianism, aestheticism, and intellectualism explained 32 percent of the variance in
employee satisfaction. In a hotel sample, Tepeci and Farrar (2000) found the individual
value-item of being careful explained 4 percent of the variance in employee satisfaction, and
the individual value-items of enthusiasm for the job and high pay for good performance
19
explained 8 percent of the variance in intent to quit. Employees who are highly
conscientious (competent, organized, systematic, self-disciplined, and achievement oriented)
tend to seek a high degree of involvement in work (Hogan & Ones, 1997) and perform better
(Barrick & Mount, 1991) than those who are not so conscientious.
Individual Values in Restaurant Organizations
Because service work requires employees to interact with customers and co-workers,
and because employees influence customers’ perceptions of service quality (Schneider &
Bowen, 1995), restaurant organizations tend to prefer employees who have such personal
values as empathy, commitment, people orientation, and team orientation (Hayes, 1991;
Samenfink, 1992). Heskett (1986) suggested successful service employees should have such
personal values as flexibility, tolerance for ambiguity, and empathy for the customer.
Employees with these values tend “to go the extra mile” for customers and take their jobs
seriously (Hayes, 1991). In fact, restaurant managers have difficulty finding enough of these
potentially successful employees.
Determining the personal characteristics that make employees successful should be of
intense interest to hospitality managers and researchers, but little empirical evidence
associates personal characteristics with success for restaurant or hotel employees. Studies
have assessed the personality traits of self-monitoring (Samenfink, 1994), service-orientation
(Dienhart et al., 1990; Groves et al., 1995), and positive and negative mood types (Ross,
1995). Sammons (1994) studied organizational citizenship behavior, or OCB. No restaurant
research appears to have studied employee values. Thus, research into employee values in
20
restaurant organizations seems likely to improve understanding of individual attitudes,
behaviors, and performance in the restaurant context.
The Interactional Perspective
Interactional researchers do not try to explain behavior in organizations in terms of
individual or situational variables alone (Chatman, 1989, 1991; House et al., 1996; O’Reilly
et al., 1991; Schneider et al., 1995). They contend, rather, that an individual’s behavior is a
function of personal and situational attributes in interaction. This interactional perspective
offers the potential to increase our understanding of employee attitudes and intentions in
organizations because it acknowledges that both the person and the organization influence
behavior. Because persons and settings are not just inseparable but interdependent
(Schneider, 1987), an interactional perspective, which is operationalized as person-
organization (P-O) fit may offer the best way to examine behavior in organizations.
Person-Organization Fit
Person-organization fit has been defined and conceptualized in four ways (Kristof,
1996): value congruence (Chatman, 1991); goal congruence (Vancouver & Schmitt, 1991);
the match between the employee’s needs and preferences and the reinforcers available in the
work environment (Cable & Judge, 1994); and the match between the (non-value)
personality of the individual and organizational culture (Bowen, Ledford, & Nathan, 1991).
Researchers use value congruence as the operationalization of person-organization fit
because (1) values are fundamental and enduring characteristics of both individuals and
21
organizations (Chatman, 1991), and (2) values predict a variety of individual outcomes
including satisfaction and behavioral intentions (Meglino et al., 1992).
Measurement of Person-Organization Fit
Early studies of the interaction between employee and organization used measures of
personality or other individual variables that did not correspond with the measures of
organizations (Bem & Funder, 1978; Tom, 1971). Thus, people were described in one
“language” while situations were described in a totally different “language” (Schneider,
1987). To better assess fit, “commensurate measurement” utilizes a common standard or
measure (Chatman, 1989). The Organizational Culture Profile (O’Reilly et al., 1991), the
Comparative Emphasis Scale (Meglino et al., 1989), and the Organizational Values
Congruence Scale (Enz, 1988) operationalize organizational culture as respondents’
perception of the extent to which a set of value dimensions exist in their current organization.
Then, to allow comparisons, they assess individual values by asking whether the same
dimensions would exist in respondents’ “ideal” organization.
Issues related to measurement of P-O fit include: (1) the distinctions between direct
(perceived) and indirect (calculated) fit, (2) the distinctions between individual and cross-
level measures of indirect fit, and (3) alternative methods for calculating indirect fit.
Direct and Indirect Fit
Direct (or perceived) P-O fit measurement assumes fit exists if the respondent
perceives it to exist, regardless of whether the respondent’s values are actually similar to the
22
organization’s values. Thus, it can be measured by simply asking respondents to estimate the
extent their values are similar to those of the organization. Perceived fit has been shown to
predict departmental power (Enz, 1988), even when fit as calculated by a comparison of
individual and organizational values failed to predict it. Kristof (1996, p. 11), however,
criticized direct measurement of fit because if the value characteristics to be considered are
not explicitly described, one cannot be sure that commensurate dimensions are being
compared. She further points out that direct measurement of fit as a predictor of employee
attitudes may lead to a consistency bias (for example, “I think that I fit well, so I must be
satisfied with my job”).
Because of these shortcomings, most P-O fit research relies on indirect measurement
instruments like the OCP to assess objective or calculated fit (Cable & Judge, 1996, 1997;
Chatman, 1991; O’Reilly et al., 1991; Vandenberghe, 1999). Indirect measures of fit use
commensurate measurement—separate rankings for perceived (or existing) and preferred (or
desired) culture using the same value-items. Perceived and preferred organizational values
are then compared. Cable and Judge (1996, 1997) correlated employees’ perceived fit
(measured by a three-item normative instrument) with their calculated P-O fit (assessed by
the OCP). The relationship between perceived fit and calculated fit, though significant, was
relatively small in both studies (r= .26, p< .01; r= .25, p< .01 respectively). Enz (1988) also
reports only a moderate correlation (r= .37, p< .05) between perceived fit (measured by a
twenty-four-item normative instrument) and calculated fit (assessed by the OVCS). Thus,
the relationship of calculated and perceived P-O fit is an empirical question that deserves
further investigation. Both were measured in the current research.
23
Individual-level and Cross-level Indirect Fit
Individual-level fit measures the relationship between each employee’s preferred
organizational characteristics and their individual perception of the existing organization.
Hence, calculation of individual-level indirect fit relies on the individual as the unit of
analysis. Cross-level fit aggregates employee perceptions of the organization to determine
the organizational profile, and compares individual employee’s preferred values to this
aggregate. For the aggregate to be meaningful, however, agreement between individual
responses must be demonstrated, typically > .70 interrater reliability (Chatman, 1991;
Kristof, 1996; Nunnally & Bernstein, 1994).
Debate over individual-level versus cross-level measurement continues (James, 1982;
Kristof, 1996; Rousseau, 1985). Kristof contends that aggregation of individual scores
should be used in the measurement of calculated P-O fit because when variables are
measured by perceptions, an aggregate is more likely to approach an objective “reality” of
the organizational characteristics. Nisbett and Ross (1980) claim individual-level
measurement is appropriate because people’s perceptions of reality drive their cognitive
appraisals of and reactions to specific situations. Kristof (1996) states individual-level fit
may have a stronger effect on individual outcome variables than would a fit with the
organization’s aggregate because individual-level differences are more real for the
individual. Again, rather than choose one side in this debate a priori, the current research
assessed individual-level and cross-level indirect fit, and compared their ability to predict the
outcomes.
24
Alternative Methods of Calculating Indirect Fit At the individual-level and cross-level, fit can be calculated three ways: (1) difference
scores, (2) correlations between individual and organizational value items (profiles), and
(3) polynomial regression (Edwards, 1993, 1994; Kristof, 1996; Tisak & Smith, 1994).
In the difference score method, the arithmetic difference between perceived and
preferred value ratings is calculated for each of the commensurate value items. P-O fit is
then calculated as the sum of differences (D1), the sum of absolute value of the differences
(|D|), or the sum of squared differences (D2). D1 distinguishes between positive and negative
differences, but when summed the positive and negative values offset each other. |D| assigns
equal weight to differences regardless of direction so the sum is more meaningful. D2 is also
nondirectional (because all squares are positive) but also assigns greater weight to differences
of larger magnitude. Though straightforward, Edwards (1993, 1994) has criticized difference
scores for at least four problems: (1) the effects of positive and negative differences are the
same; (2) summing conceals the contribution of individual differences to the overall score;
(3) because the same individuals generate person and organization profiles, their correlation
is artificially inflated and reliability of the difference scores is reduced; and (4) difference
scores often fail to explain outcome variance beyond that explained by component measures
individually.
Despite Edwards’ objections to summing difference scores as a measure of fit, Tisak
and Smith (1994) argue that assessment of fit should incorporate multiple value dimensions.
Because so many aspects of organizations and individuals influence attitudes and behaviors,
they claim overall P-O fit is more meaningful than fit on each value dimension
independently. Tisak and Smith also argue that difference scores capture something
25
conceptually different from their (individual and organizational) component variables, and
can explain more variance than their component measures. They maintain the reliability of
differences is an empirical question to be addressed on a study-by-study basis.
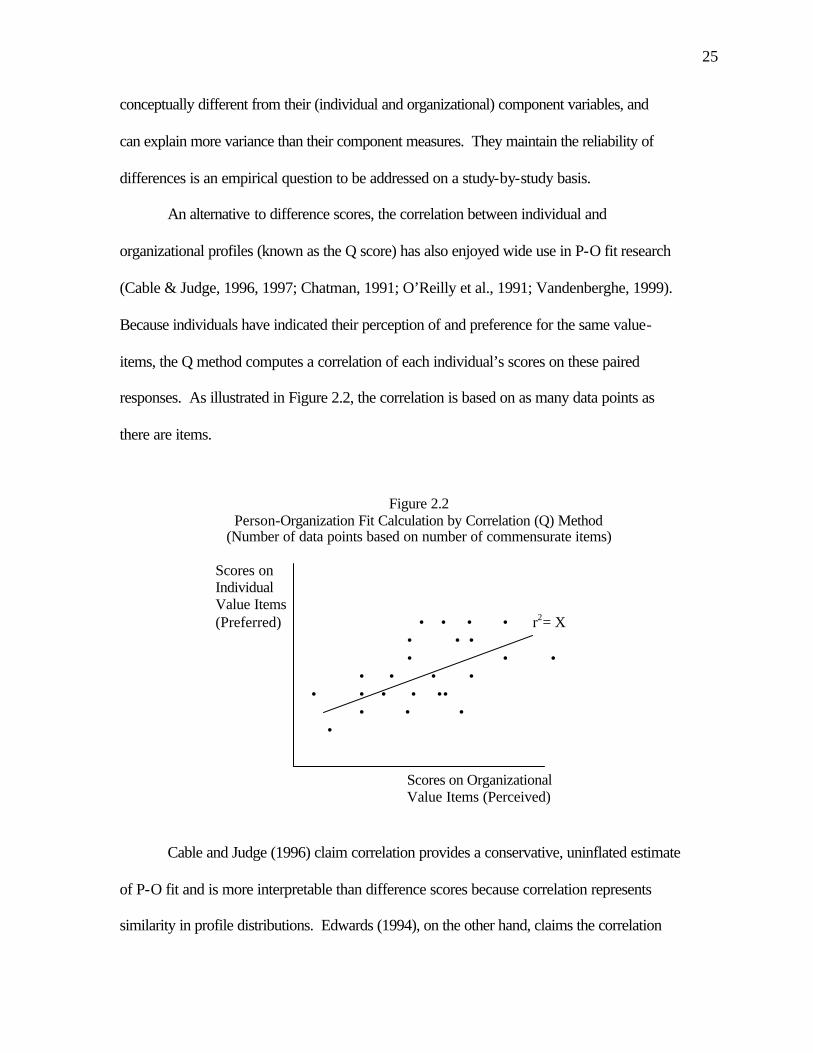
An alternative to difference scores, the correlation between individual and
organizational profiles (known as the Q score) has also enjoyed wide use in P-O fit research
(Cable & Judge, 1996, 1997; Chatman, 1991; O’Reilly et al., 1991; Vandenberghe, 1999).
Because individuals have indicated their perception of and preference for the same value-
items, the Q method computes a correlation of each individual’s scores on these paired
responses. As illustrated in Figure 2.2, the correlation is based on as many data points as
there are items.
Figure 2.2 Person-Organization Fit Calculation by Correlation (Q) Method
(Number of data points based on number of commensurate items)
Scores on Individual
Value Items (Preferred) • • • • r2= X • • •
• • • • • • • • • • • •• • • • •
Scores on Organizational Value Items (Perceived)
Cable and Judge (1996) claim correlation provides a conservative, uninflated estimate
of P-O fit and is more interpretable than difference scores because correlation represents
similarity in profile distributions. Edwards (1994), on the other hand, claims the correlation

26
method shares many of the shortcomings of difference scores (concealing the contribution of
individual differences to the overall P-O fit score, low reliability, and inability to explain
additional variance). Further, he claims, perceived and preferred profiles with large
discrepancies but similar shapes may produce high correlation values, while profiles with
small discrepancies but dissimilar in shape may produce low or even negative correlation
scores.
Edwards (1993, 1994) therefore recommended using polynomial regression to assess
the relative effect of person (P), organization (O), and fit. In this method, the outcome is
regressed on P and O, and the P x O interaction term serves as the measure of fit. Edwards
found polynomial regression increased the proportion of variance explained in the dependent
variable over the use of difference scores or correlation. Kristof (1996) recognizes that the
“fit score” versus polynomial regression debate continues, and recommends using both
methods.
Outcomes of Person-Organization Fit
Several sources provide theoretical justification and empirical evidence that person-
organization fit has positive effects. Locke (1976) and Schneider (1987) suggested that
individuals are generally attracted to and feel most comfortable in organizations with
characteristics similar to their own. Chatman (1989) proposed that individuals who fit the
organization in terms of similarity of values were likely to be satisfied and competent and to
continue with the firm. Meglino et al. (1989) contend that individuals who hold values and
beliefs similar to those of the organization interact more efficiently with their organizational
27
value system, reducing uncertainty and conflict, which in turn increases satisfaction and
commitment.
Although interactionalists accept that personal and situational variables have
individual effects on attitudes and behaviors, they contend that the additional unique effect of
person-organization congruency is crucial to understanding attitudes and behaviors
(Chatman, 1991; House et al., 1996; Schneider, 1987). That is, the construct of fit or match
increases the explanation of attitudes and behavior in organizations beyond that explained by
“a strong culture” or “deeply rooted individual beliefs.” A closeness between “this is the
way I believe things are” and “this is the way I believe things should be” can capture a
number of reactions or responses that are not inherent in either the person or the situation but
are a result of the interaction between these parts (Chatman, 1991; Schneider, 1987).
Studying the outcomes of P-O fit, O’Reilly et al. (1991) found positive correlations of
P-O fit with satisfaction and commitment, and a negative association of P-O fit with intent to
leave and actual turnover. Vandenberghe (1999) found that recruits whose value profile is
close to that of their employing organization are more likely to stay with it during the early
employment period. Kristof’s (1996) summary of empirical results supports the positive
effects of P-O fit on employee satisfaction, organizational commitment, extra-role behaviors,
work performance, stress, and employee behavioral intentions and turnover. Yet although
several studies have investigated P-O fit, only Chatman (1991) studied whether P-O fit
explains additional variance in individual outcomes beyond that explained by individual and
organizational characteristics. She found P-O fit to be a better predictor of satisfaction,
commitment, turnover intention, and length of stay than either personal characteristics or
situational characteristics, or both combined. The current study attempted to replicate
28
Chatman’s findings in a more flexible work situation where high person and organization
interaction occurs.
Despite the generally positive outcomes of P-O fit, Schneider et al. (1995) warn that
high P-O fit can potentially cause troublesome homogeneity in an organization. While high
levels of P-O fit among organizational members may lead to increased satisfaction, increased
commitment and fewer conflicts, excessive P-O fit may lead to conformity and stagnate
innovation. Schneider and his colleagues suggested that homogeneity may be beneficial
early in the history of an organization because it enhances coordination and communication,
but later can lead to inflexibility and resistance to change. Thus, selecting applicants with
high P-O fit may be a bad idea in a rapidly changing environment. More research is needed
to more accurately determine the long-term organizational outcomes of P-O fit.
Person-Organization Fit in Restaurants
With the U.S. unemployment rate at a 30-year low and an aging population,
restaurant companies are facing significant challenges in finding and retaining qualified and
motivated labor (Restaurant Industry Forecast, 2000). The industry’s primary labor pool
consists of a continuous cycle of workers between the ages of 18 to 27 (Marshall-Mims,
1999), and employment tenure for the typical restaurant employee (1.3 years) is one third that
of all employed persons in the U.S. (Restaurant Industry Employee Profile, 2000). Further
distinguished by 100 to 300 percent employee turnover (Woods, 1992), the restaurant
industry offers a setting in which the study of P-O fit is both novel and potentially
advantageous.
29
Studying P-O fit in restaurant organizations promises to advance our understanding of
its effects on individual and organizational outcomes in dynamic service settings.
Nevertheless, as we have seen, only Enz (1988) and Tidball (1988) have focused on the
restaurant industry. Enz selected the corporate headquarters of a quick-service restaurant
chain and a robotics company for her study, and investigated how similarity in values
between departmental members and top management determined power. She found that
perceived similarity of organizational values between department and top management
significantly contributed to the department’s power within the organization, but calculated
value congruity, assessed by the OVCS, did not account for significant percentages of
variance in power.
In another restaurant industry study, Tidball (1988) conceptualized “fit” as the extent
to which “ideologies” were consistent at different levels rather than measuring fit between
individuals and organizations. The three levels were: (1) formal ideology; the principles in
which the top management or founders believe, (2) espoused ideology; the aspirations widely
shared by all members of the organization, and (3) operating ideology; the “insider’s” view
of how things really operate within the organization. When espoused and formal ideologies
were congruent with operating ideology, employees awarded higher managerial competence
scores. Congruence of espoused and operating ideologies explained 31 percent of the
variance in profitability. The three congruencies explained 41 percent of the variance in
organizational commitment. Although Tidball’s congruence study measured a different
construct than P-O fit, her work confirms that culture and ideological congruence can affect
both employee behavior and organizational performance in at least one restaurant
organization.
30
Individual Outcomes
The study reported here uses employee satisfaction and behavioral intentions as
outcome measures. Attitudes or intentions were chosen because actual behavior is often
influenced by exogenous variables, whereas attitudes and intentions are determined by the
employee (Shore, Newton, & Thornton, 1990). Behavioral intentions are also preferred
because assessing actual behaviors requires longitudinal data collection beyond the scope of
the current research. Thus, this research investigates the influence of individual values,
organizational culture, and P-O fit on (1) employee job satisfaction, (2) intent to quit, and (3)
willingness to recommend the organization as a good place to work.
Employee Job Satisfaction
Job satisfaction is defined as a positive or negative evaluative judgment of one’s job
or job situation (Weiss & Cropanzano, 1996). Job satisfaction is among the most important
areas of concern in organizational studies because of its influence on employee behavior and
job performance (Wright & Staw, 1999) and subsequent economic benefits. Identifying the
determinants of employee satisfaction should help restaurant managers choose strategies to
improve employee satisfaction and, in turn, realize greater profits.
As previously stated, several employee satisfaction studies have been conducted in
hospitality organizations. But these earlier researchers focused on job characteristics
(Bartlett et al., 1999; Pizam & Neumann, 1988), employee demographics (Mok & Finley,
1986), or advancement opportunities or financial considerations (Pavesic & Brymer, 1990;
Pizam & Chandrasekar, 1983) as predictors of employee satisfaction. Using individual and
31
organizational values, this study set out to increase criterion-related validity by explaining a
higher percentage of the variance in employee satisfaction than the average 25 percent
organizational researchers have so far been able to explain by using single sets of variables
like job characteristics (Agho, Mueller, & Price, 1993).
Satisfaction can be assessed as the sum of a series of facets (co-workers, pay, the
work) or as a feeling about the job overall. Global job satisfaction appears to be more
inclusive than facet satisfaction, assessing all attitude components (Cammann, Fichman,
Jenkins, & Klesh, 1983). In this study, in order to assess internal consistency reliability of
the scale, overall job satisfaction was measured using a three-item global satisfaction scale
adapted from Cammann et al. (1983).
Intent to Quit
As stated in Chapter One, no empirical research has addressed the factors that shape
employees’ intention-to-quit in a restaurant context. Chatman (1991) and O’Reilly et al.
(1991) found that intent to quit predicts actual turnover among accountants, and Sheridan
(1992) found it to affect organizations’ profitability in the accounting industry. Although no
evidence yet links intent to quit to actual behavior or performance in hospitality, Perrewe,
Brymer, Stepina, and Hassell (1991) also used intent to quit as an outcome in their study of
burnout and job satisfaction among hotel managers. Exploring the relative influence of
individual and organizational characteristics on employees’ intent to quit could easily help
restaurant managers to decrease actual employee turnover. The results could include
improvements in customer service, employee productivity, and organizational profitability
(Woods, 1992).
32
Willingness to Recommend the Organization
A large percentage of new job applicants are referrals from existing employees, and
referred applicants on average stay longer than other applicants and demonstrate better
performance (Morehart, 2001; Wanous & Colella, 1989). When existing employees
recommend their organizations to friends and acquaintances, those organizations are likely to
attract higher numbers of qualified applicants and to improve their reputations among
customers. With low unemployment posing a major problem for the restaurant industry,
determining factors that improve an employee’s willingness to recommend his or her
organization provides a competitive tool for restaurant managers seeking to employ the best
performers.
Control Variables
To assess the discrete influences of individual values, organizational culture, and P-O
fit on the outcome or dependent variables, the influence of other variables must be controlled.
A review of the P-O fit and hospitality management literature indicates a significant
relationship between the following demographic variables and the dependent variables used
in this study: gender—women are more likely to stay with their organization than men (Bretz
& Judge, 1994); age—as people get older they tend to be more satisfied and stay longer
(Agho et al., 1993; Tidball, 1988); marital status—married people are more likely to stay
with their organization than unmarried people (Bretz & Judge, 1994); tenure with the
organization—as the length of work increases, employees are more likely to be satisfied and
intend to stay longer (Judge & Bretz, 1992); educational degree achieved—as employees’
33
education level increases their job satisfaction increases (Judge & Bretz, 1994), and full- or
part-time status—full-time employees are more satisfied than part-time (Tidball, 1988).
Further potential confounds to be controlled include restaurants’ chain or independent status
and front- versus back-of-the- house job positions. All of these variables were assessed in
the questionnaire and controlled in the statistical analysis.
CHAPTER III
METHODOLOGY
Understanding employee attitudes and behavioral intentions can help restaurant
managers gain a competitive edge. As Chapters One and Two have indicated, an
interactional perspective can promote understanding beyond that of individual and
organizational characteristics alone. This study investigates whether the match between
employee and organizational values affects the satisfaction and behavioral intentions of
restaurant employees. This chapter first sets forth the conceptual framework for the study
and states the research questions. Then, sections devoted to research design, instrumentation,
population, sample and data collection, data collection protocol, variables, and data analyses
detail the methodology.
Conceptual Framework
Figure 3.1 depicts the conceptual framework for the study and how organizational
culture, individual values, and the match between them determine employees’ job
satisfaction, intent to quit, and willingness to recommend the organization. First, the
influence of organizational culture and individual values on the three outcomes is measured.
Then the study investigates whether person-organization fit contributes to explanations of
employee job satisfaction, intent to quit, and willingness to recommend his or her
organization beyond that explained by organizational culture and individual values.
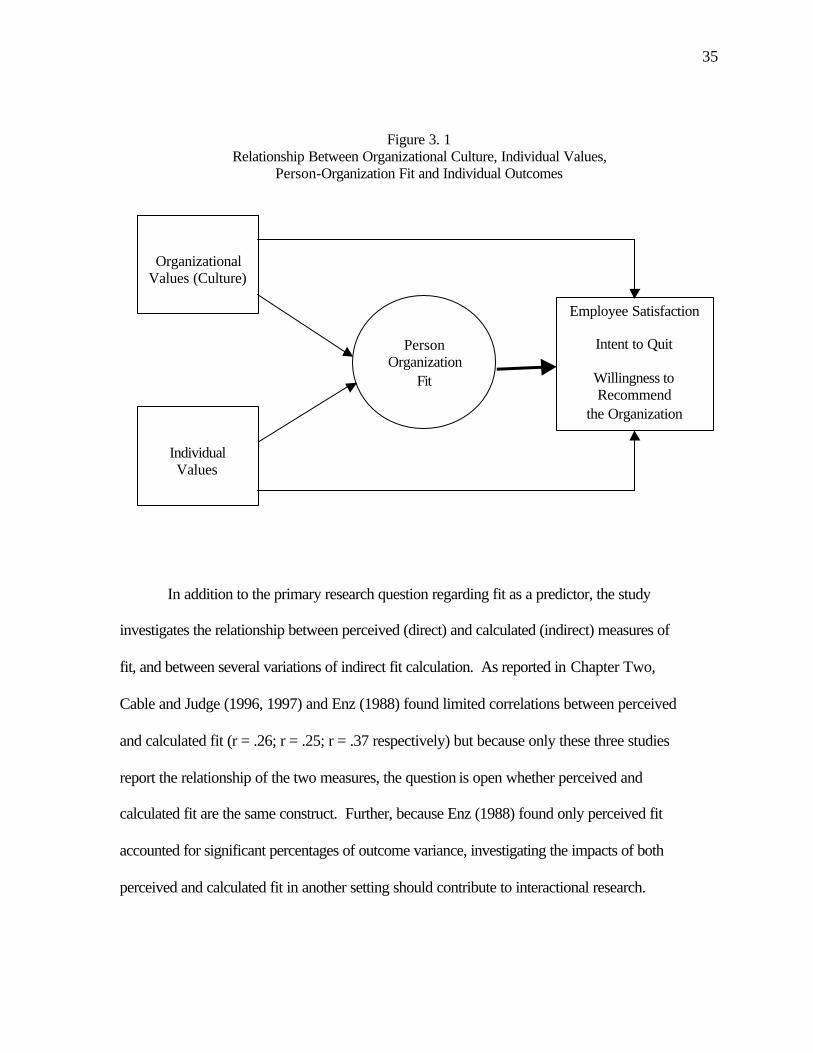
35
Figure 3. 1 Relationship Between Organizational Culture, Individual Values,
Person-Organization Fit and Individual Outcomes
In addition to the primary research question regarding fit as a predictor, the study
investigates the relationship between perceived (direct) and calculated (indirect) measures of
fit, and between several variations of indirect fit calculation. As reported in Chapter Two,
Cable and Judge (1996, 1997) and Enz (1988) found limited correlations between perceived
and calculated fit (r = .26; r = .25; r = .37 respectively) but because only these three studies
report the relationship of the two measures, the question is open whether perceived and
calculated fit are the same construct. Further, because Enz (1988) found only perceived fit
accounted for significant percentages of outcome variance, investigating the impacts of both
perceived and calculated fit in another setting should contribute to interactional research.
Organizational Values (Culture)
Person
Organization Fit
Employee Satisfaction
Intent to Quit
Willingness to Recommend
the Organization
Individual Values
36
Research Design
The research described here examines the influence of personal and organizational
values and P-O fit on employee satisfaction and behavioral intentions in restaurant
organizations. The author undertakes a field study to investigate naturally occurring P-O fit
interactions. Actual organizational settings tend to increase external validity. The study’s
design is non-experimental because there is no manipulation of the independent variables and
no random assignment of subjects to treatment and control groups. This study was approved
by the Penn State Institutional Review Board for the Protection of Human Subjects in
Research.
Instrumentation: Development of the Hospitality Industry Culture Profile (HICP)
In designing the data collection instrument for this study, it was important to identify
a set of cultural dimensions appropriate to the restaurant industry, and value-items that
accurately measure those dimensions. Because the survey was completed in real restaurant
organizations, time constraints and ease of response were also important considerations. To
test alternative questionnaire items and formats, a series of three pilot studies was conducted,
which are detailed in the following pages. The sample for these pilot studies were hospitality
management students in the School of Hotel, Restaurant, and Recreation Management at
Penn State. Everyone in the sample had hospitality work experience as a requirement of the
major. Data were collected during Fall Semester 2000.

37
Pilot Study One
The first instrument tested was based largely on the OCP (O’Reilly et al., 1991). The
1991 version of the OCP comprises 54 items. Cable and Judge (1996) and Judge and Cable
(1997) reduced the OCP to 40 value-items without compromising the underlying factors. To
develop a shortened set of items to represent values in the restaurant industry, the factor
structure of the OCP was examined (Appendix A). As Table 3.1 shows, a total of ten factors
emerged, including seven dimensions of perceived organizational culture and eight
dimensions of preferred culture. Sixteen items loaded on the same dimensions in both
perceived and preferred culture to create five factors that “overlap,” including Innovation,
Results Orientation, Attention to Detail, Aggressiveness, and Team Orientation. Three
dimensions were found in the individual profile that did not emerge in the culture profile, and
two were found in the culture profile that did not emerge in the individual profile.
Table 3.1
Organizational Culture and Individual Value Dimensions (O’Reilly et al., 1991)
Perceived Values Preferred Values Innovation (1) Innovation Attention to detail (2) Attention to detail Outcome orientation (3) Outcome orientation Aggressiveness (4) Aggressiveness Team orientation (5) Team orientation Stability (6) Respect for people (7)
(6) Decisiveness (7) Supportiveness
(8) Emphasis on rewards
In the first pilot, the original OCP/Q-sort format was utilized. The five OCP
dimensions that emerged in both perceived and preferred culture were retained. Based on
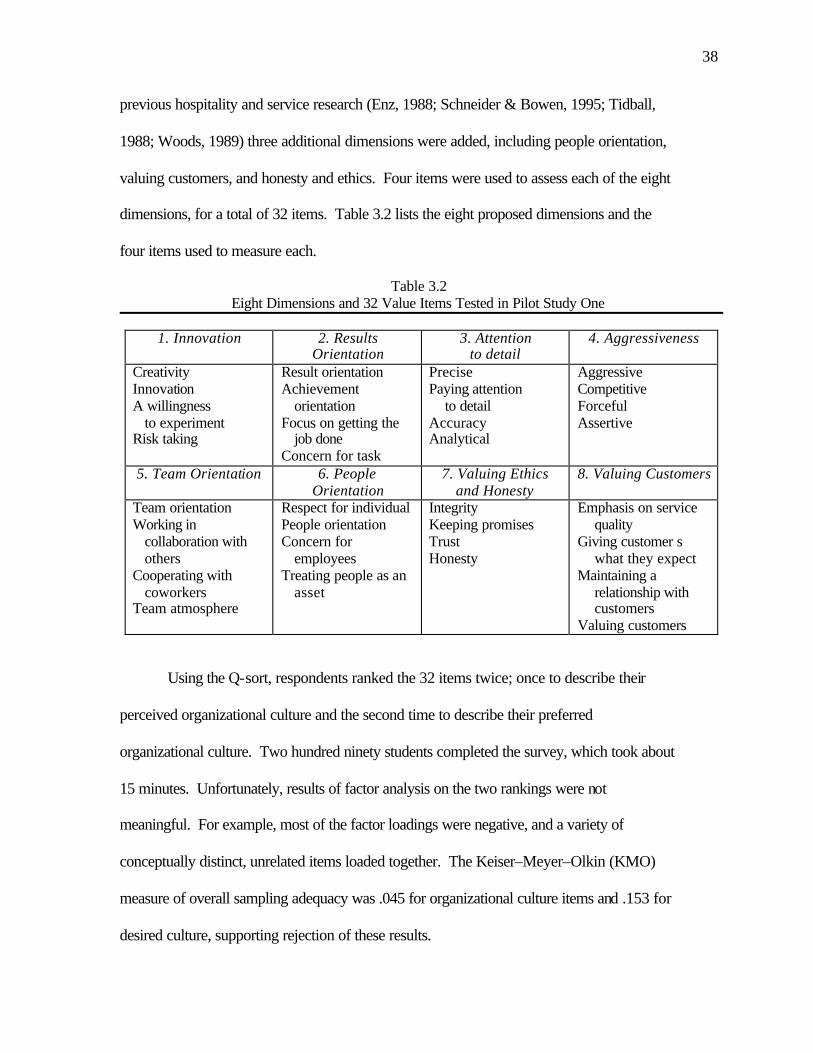
38
previous hospitality and service research (Enz, 1988; Schneider & Bowen, 1995; Tidball,
1988; Woods, 1989) three additional dimensions were added, including people orientation,
valuing customers, and honesty and ethics. Four items were used to assess each of the eight
dimensions, for a total of 32 items. Table 3.2 lists the eight proposed dimensions and the
four items used to measure each.
Table 3.2 Eight Dimensions and 32 Value Items Tested in Pilot Study One
1. Innovation 2. Results
Orientation 3. Attention
to detail 4. Aggressiveness
Creativity Innovation A willingness
to experiment Risk taking
Result orientation Achievement
orientation Focus on getting the
job done Concern for task
Precise Paying attention to detail Accuracy Analytical
Aggressive Competitive Forceful Assertive
5. Team Orientation 6. People Orientation
7. Valuing Ethics and Honesty
8. Valuing Customers
Team orientation Working in
collaboration with others
Cooperating with coworkers
Team atmosphere
Respect for individual People orientation Concern for
employees Treating people as an
asset
Integrity Keeping promises Trust Honesty
Emphasis on service quality
Giving customer s what they expect
Maintaining a relationship with customers
Valuing customers
Using the Q-sort, respondents ranked the 32 items twice; once to describe their
perceived organizational culture and the second time to describe their preferred
organizational culture. Two hundred ninety students completed the survey, which took about
15 minutes. Unfortunately, results of factor analysis on the two rankings were not
meaningful. For example, most of the factor loadings were negative, and a variety of
conceptually distinct, unrelated items loaded together. The Keiser–Meyer–Olkin (KMO)
measure of overall sampling adequacy was .045 for organizational culture items and .153 for
desired culture, supporting rejection of these results.
39
Pilot study respondents were given only 32 items (rather than 54) to sort, but written
and verbal feedback indicated: (1) although it was relatively easy for respondents to choose
the most characteristic or the least characteristic value items, differentiating value items for
the middle categories was more difficult; (2) several of the items were too similar; and (3)
they wanted to place more items in the “characteristic” or “desirable” categories, but the Q-
sort did not allow this. Training the respondents and giving more detailed instructions and
time could have lessened those above problems, but might also bias the results.
Pilot Study Two
Because the Q-sort results were not meaningful, an alternative ipsative format (paired
comparisons, Meglino et al., 1989) and a normative format (Likert type scales) were tested in
the second pilot study, using the same eight cultural dimensions and 32 value items. To limit
the time required, respondents were asked to evaluate only their existing organizations. One
hundred fifty students completed the survey. In the normative format respondents rated on
one-to-seven scales how characteristic of their organizational culture each of the 32 items
was. Factor analysis of this data identified six dimensions, including: (1) team and people
orientation, (2) innovation, (3) valuing customers, (4) honesty and ethics, (5) attention to
detail, and (6) focus on getting the job done (results orientation). Team- and people-
orientation were expected to emerge as separate factors but loaded together. Aggressiveness
did not emerge as a separate factor. The six factors explained 68% of the variance among the
32 items, and the six factors had reliability ranging from .71 to .92. The KMO measure of
overall sampling adequacy was .868. In combination, these results indicated this was a
reasonable solution and an acceptable instrument design.
40
In the “paired comparisons” format each of the eight culture dimensions was paired
with every other dimension (8x7/2= 28 paired comparisons). Respondents circled the one
from each pair that was most characteristic of their organization, and each dimension thus
received a score from zero to seven based on the number of times it was selected. To assess
the similarity of the normative and ipsative results, the scores generated for each factor by
paired comparisons were correlated with scores for the corresponding factors from Likert
ratings. Because aggressiveness did not emerge as a factor, it was not included in the
correlation. The separate Team Orientation and People Orientation factors from the paired
comparisons were each correlated with the combined Team and People Orientation factor
from the Likert ratings. Five of seven paired comparison factors demonstrated moderate
(p< .01) correlation with normative factors: Team Orientation (r= .44), People Orientation
(r= .42), Innovation (r= .49), Valuing Customers (r= .35), and Attention to Detail (r= .26).
Correlations for Results Orientation and Honesty and Ethics were very low and not
significant. The positive results from the normative instrument, combined with the
inconsistent results using Q-sort and paired comparison rankings, indicated the use of a
Likert type rating scale for the instrument format.
Pilot Study Three
To verify appropriateness of the format and the value dimensions being measured, a
third pilot study was conducted. The final pilot study instrument used a simple rating
method with Likert-type scales in which respondents were simply to assess how well the
value items described both their actual and ideal organizations. Scales were anchored from
“very uncharacteristic” (1) to “very characteristic” (7). One hundred eighty-two respondents
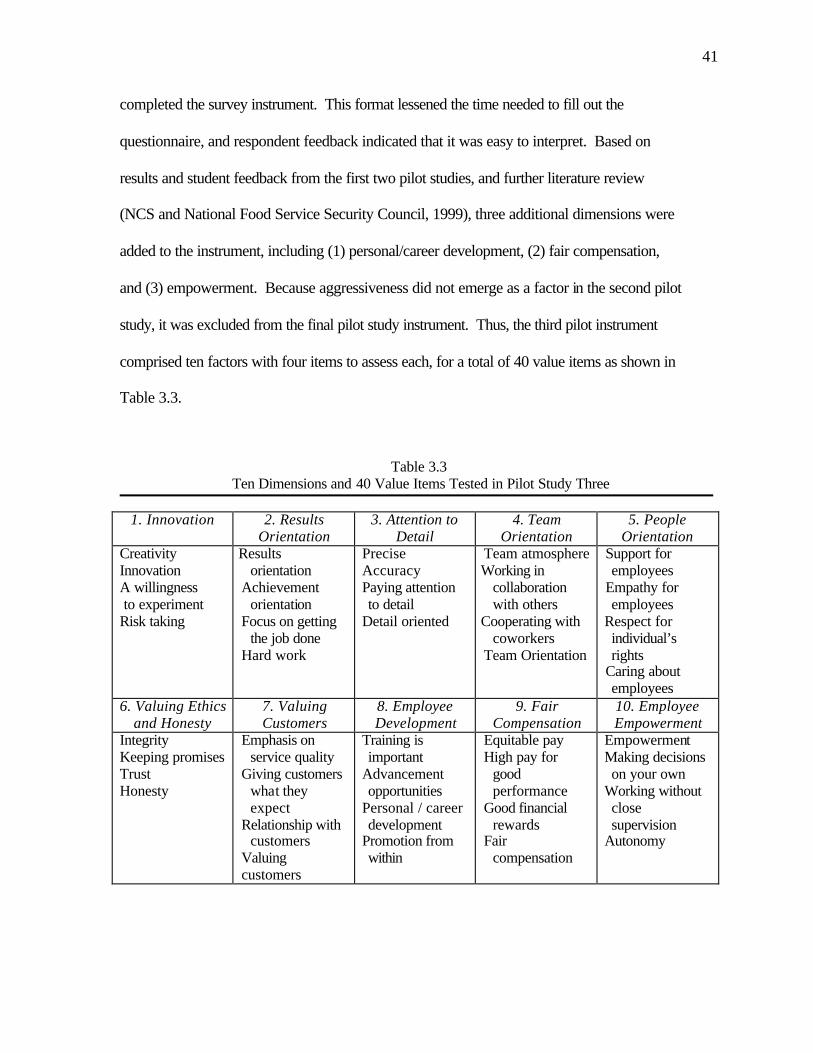
41
completed the survey instrument. This format lessened the time needed to fill out the
questionnaire, and respondent feedback indicated that it was easy to interpret. Based on
results and student feedback from the first two pilot studies, and further literature review
(NCS and National Food Service Security Council, 1999), three additional dimensions were
added to the instrument, including (1) personal/career development, (2) fair compensation,
and (3) empowerment. Because aggressiveness did not emerge as a factor in the second pilot
study, it was excluded from the final pilot study instrument. Thus, the third pilot instrument
comprised ten factors with four items to assess each, for a total of 40 value items as shown in
Table 3.3.
Table 3.3 Ten Dimensions and 40 Value Items Tested in Pilot Study Three
1. Innovation 2. Results
Orientation 3. Attention to
Detail 4. Team
Orientation 5. People
Orientation Creativity Innovation A willingness to experiment Risk taking
Results orientation
Achievement orientation
Focus on getting the job done
Hard work
Precise Accuracy Paying attention to detail
Detail oriented
Team atmosphere Working in
collaboration with others
Cooperating with coworkers
Team Orientation
Support for employees
Empathy for employees
Respect for individual’s rights
Caring about employees
6. Valuing Ethics and Honesty
7. Valuing Customers
8. Employee Development
9. Fair Compensation
10. Employee Empowerment
Integrity Keeping promises Trust Honesty
Emphasis on service quality
Giving customers what they expect
Relationship with customers
Valuing customers
Training is important
Advancement opportunities
Personal / career development
Promotion from within
Equitable pay High pay for
good performance
Good financial rewards
Fair compensation
Empowerment Making decisions on your own
Working without close supervision
Autonomy
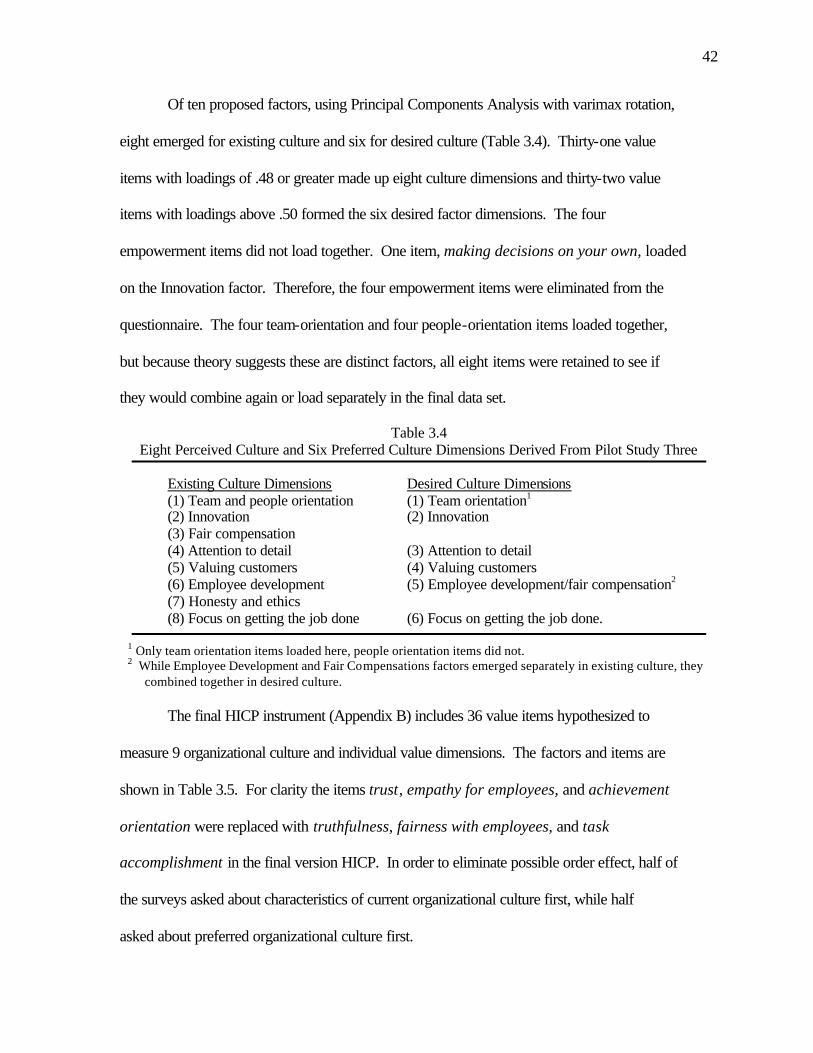
42
Of ten proposed factors, using Principal Components Analysis with varimax rotation,
eight emerged for existing culture and six for desired culture (Table 3.4). Thirty-one value
items with loadings of .48 or greater made up eight culture dimensions and thirty-two value
items with loadings above .50 formed the six desired factor dimensions. The four
empowerment items did not load together. One item, making decisions on your own, loaded
on the Innovation factor. Therefore, the four empowerment items were eliminated from the
questionnaire. The four team-orientation and four people-orientation items loaded together,
but because theory suggests these are distinct factors, all eight items were retained to see if
they would combine again or load separately in the final data set.
Table 3.4 Eight Perceived Culture and Six Preferred Culture Dimensions Derived From Pilot Study Three
Existing Culture Dimensions Desired Culture Dimensions (1) Team and people orientation (1) Team orientation1 (2) Innovation (2) Innovation (3) Fair compensation (4) Attention to detail (3) Attention to detail (5) Valuing customers (4) Valuing customers (6) Employee development (5) Employee development/fair compensation2 (7) Honesty and ethics
(8) Focus on getting the job done (6) Focus on getting the job done.
1 Only team orientation items loaded here, people orientation items did not. 2 While Employee Development and Fair Compensations factors emerged separately in existing culture, they
combined together in desired culture.
The final HICP instrument (Appendix B) includes 36 value items hypothesized to
measure 9 organizational culture and individual value dimensions. The factors and items are
shown in Table 3.5. For clarity the items trust, empathy for employees, and achievement
orientation were replaced with truthfulness, fairness with employees, and task
accomplishment in the final version HICP. In order to eliminate possible order effect, half of
the surveys asked about characteristics of current organizational culture first, while half
asked about preferred organizational culture first.
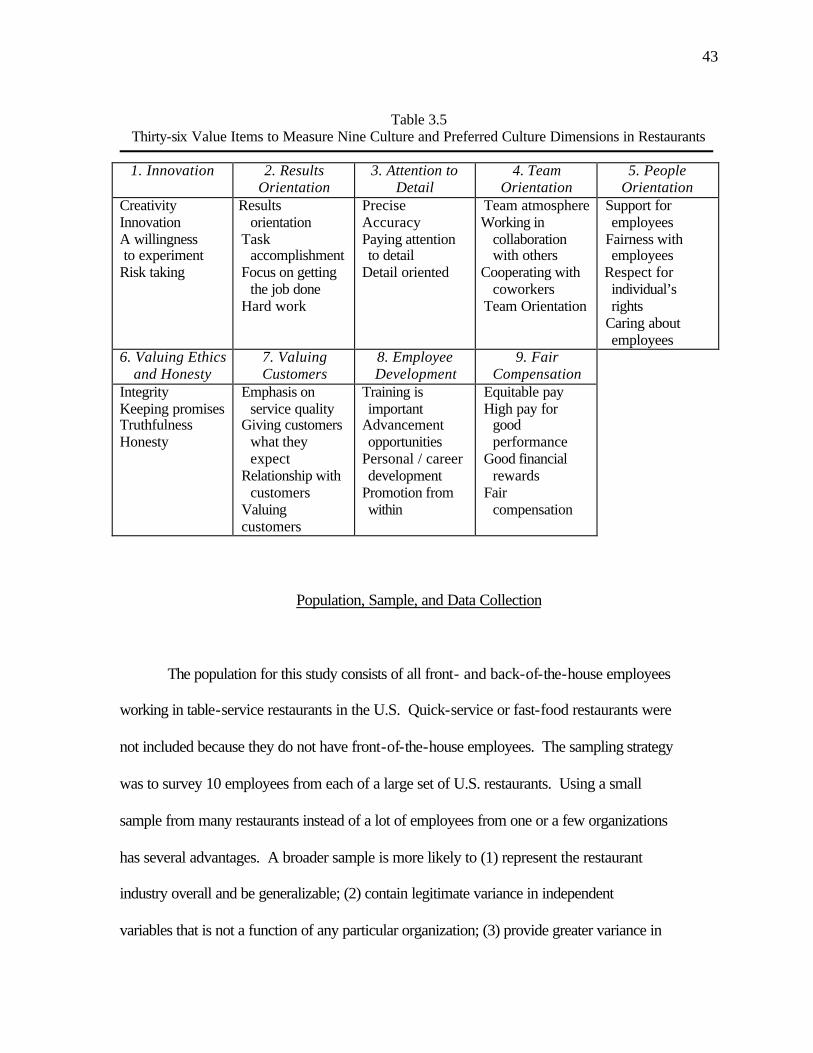
43
Table 3.5
Thirty-six Value Items to Measure Nine Culture and Preferred Culture Dimensions in Restaurants
1. Innovation 2. Results Orientation
3. Attention to Detail
4. Team Orientation
5. People Orientation
Creativity Innovation A willingness to experiment Risk taking
Results orientation
Task accomplishment
Focus on getting the job done
Hard work
Precise Accuracy Paying attention to detail
Detail oriented
Team atmosphere Working in
collaboration with others
Cooperating with coworkers
Team Orientation
Support for employees
Fairness with employees
Respect for individual’s rights
Caring about employees
6. Valuing Ethics and Honesty
7. Valuing Customers
8. Employee Development
9. Fair Compensation
Integrity Keeping promises Truthfulness Honesty
Emphasis on service quality
Giving customers what they expect
Relationship with customers
Valuing customers
Training is important
Advancement opportunities
Personal / career development
Promotion from within
Equitable pay High pay for
good performance
Good financial rewards
Fair compensation
Population, Sample, and Data Collection
The population for this study consists of all front- and back-of-the-house employees
working in table-service restaurants in the U.S. Quick-service or fast-food restaurants were
not included because they do not have front-of-the-house employees. The sampling strategy
was to survey 10 employees from each of a large set of U.S. restaurants. Using a small
sample from many restaurants instead of a lot of employees from one or a few organizations
has several advantages. A broader sample is more likely to (1) represent the restaurant
industry overall and be generalizable; (2) contain legitimate variance in independent
variables that is not a function of any particular organization; (3) provide greater variance in
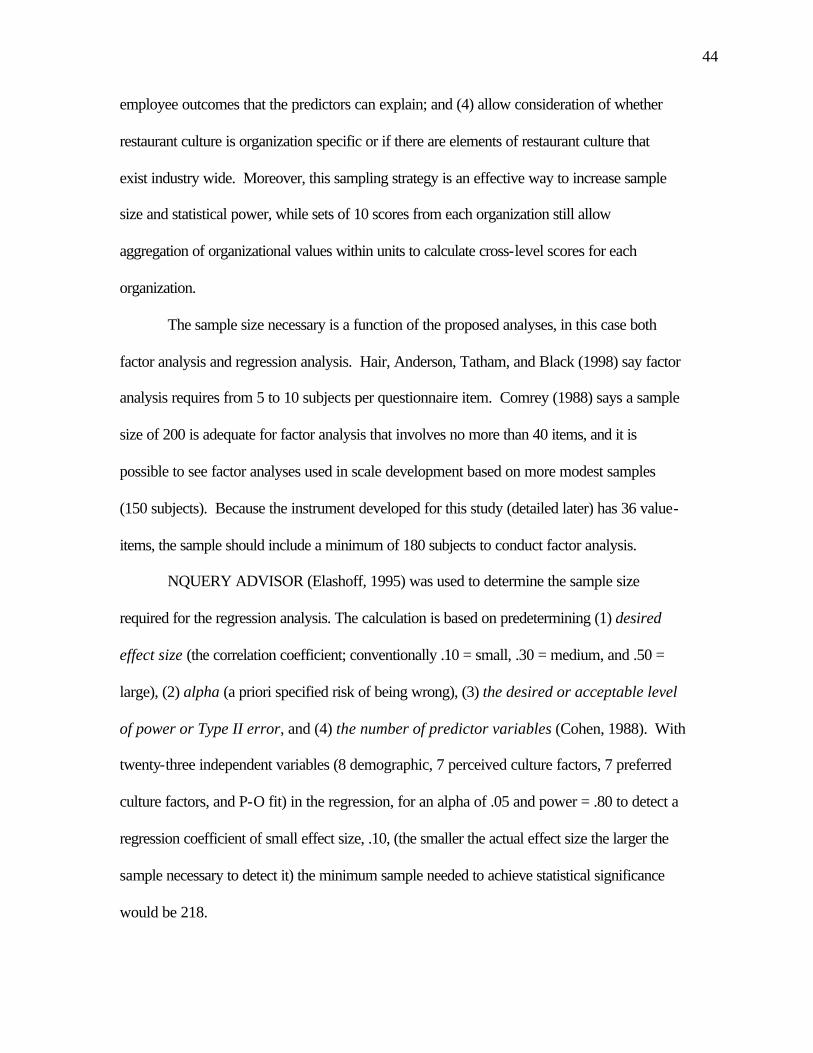
44
employee outcomes that the predictors can explain; and (4) allow consideration of whether
restaurant culture is organization specific or if there are elements of restaurant culture that
exist industry wide. Moreover, this sampling strategy is an effective way to increase sample
size and statistical power, while sets of 10 scores from each organization still allow
aggregation of organizational values within units to calculate cross-level scores for each
organization.
The sample size necessary is a function of the proposed analyses, in this case both
factor analysis and regression analysis. Hair, Anderson, Tatham, and Black (1998) say factor
analysis requires from 5 to 10 subjects per questionnaire item. Comrey (1988) says a sample
size of 200 is adequate for factor analysis that involves no more than 40 items, and it is
possible to see factor analyses used in scale development based on more modest samples
(150 subjects). Because the instrument developed for this study (detailed later) has 36 value-
items, the sample should include a minimum of 180 subjects to conduct factor analysis.
NQUERY ADVISOR (Elashoff, 1995) was used to determine the sample size
required for the regression analysis. The calculation is based on predetermining (1) desired
effect size (the correlation coefficient; conventionally .10 = small, .30 = medium, and .50 =
large), (2) alpha (a priori specified risk of being wrong), (3) the desired or acceptable level
of power or Type II error, and (4) the number of predictor variables (Cohen, 1988). With
twenty-three independent variables (8 demographic, 7 perceived culture factors, 7 preferred
culture factors, and P-O fit) in the regression, for an alpha of .05 and power = .80 to detect a
regression coefficient of small effect size, .10, (the smaller the actual effect size the larger the
sample necessary to detect it) the minimum sample needed to achieve statistical significance
would be 218.
45
To reach the sample, data were collected with the assistance of (1) graduates and
(2) current students of Penn State’s Hotel, Restaurant and Institutional Management (HRIM)
program who are currently employed in table-service restaurants. To access the alumni, a
mailing list was obtained from the Penn State Alumni Office and a set of 25 with current data
indicating restaurant employment were contacted by telephone and asked to participate.
Twenty graduates agreed to participate; five could not be reached or chose not to participate.
Those who agreed to participate were mailed packets of survey materials. Seventeen
packages were returned, representing 85% of the 20 distributed and 68% of the original 25.
The second means of access was students enrolled in a junior-level hospitality
management class who also work in table-service restaurants. The students were offered
extra credit if they would arrange with their restaurant managers for survey distribution and
return. (Students not working in restaurants were offered alternative extra credit). The
students also provided the managers’ name and address information so results of the study
could be mailed to them. Of 20 survey packages distributed, ten were returned by students
who collected data in out-of-town restaurants, and seven were returned by students who
collected data in local restaurants. These 17 packages represent an 85% response rate. The
total response was 34 of 40 packages distributed, 85%. Out of 340 questionnaires distributed
to the employees in these 34 restaurants, 326 surveys were returned, a 96% response rate.
Data Collection Protocol
The packages of materials distributed to the restaurant managers included (1) a cover
letter including survey distribution protocol (Appendix C), (2) eleven four-page
46
questionnaires, (3) eleven envelopes for return of the individual surveys, and (4) a large
stamped and self-addressed envelope for returning the surveys. To allow data collection with
as little intrusion as possible, managers had the option to (1) have a group of employees fill
out the survey at the same time (for example, before or after a shift or at an employee
meeting), or (2) have employees fill out the survey on a break at some point during their shift
and return when it was completed.
In either case, managers were instructed to randomly select five front- and five back-
of-the-house employees. After the sample was selected, the managers explained the study’s
purpose and provided instructions for filling out the questionnaire. Employees were assured
their decision to participate or not participate had no impact on their employment. Then,
those who chose to participate completed the survey, sealed it in a letter envelope, and
returned it to the manager. To guarantee anonymity no personally identifying information
was requested. When all questionnaires were returned, the manager sealed them in the larger
envelope and mailed it to the researcher or returned it to the student contact.
To increase participation the managers themselves were also asked to complete a
survey. The researcher hoped that this demonstrated support from the managers would
encourage employees to participate as well. Further, managers who assisted with data
collection were promised an executive summary of the study results. The employee
respondents were encouraged by management to participate, and received a Penn State pen as
a small incentive.
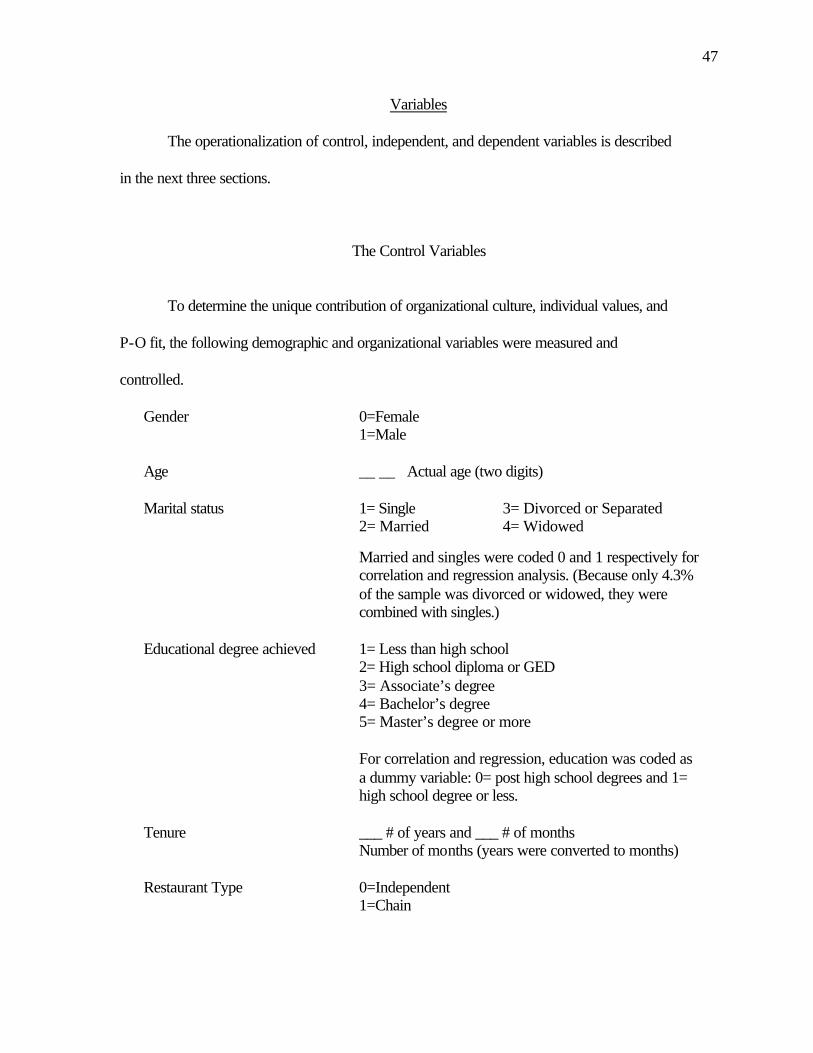
47
Variables
The operationalization of control, independent, and dependent variables is described
in the next three sections.
The Control Variables
To determine the unique contribution of organizational culture, individual values, and
P-O fit, the following demographic and organizational variables were measured and
controlled.
Gender 0=Female 1=Male Age __ __ Actual age (two digits) Marital status 1= Single 3= Divorced or Separated 2= Married 4= Widowed
Married and singles were coded 0 and 1 respectively for correlation and regression analysis. (Because only 4.3% of the sample was divorced or widowed, they were combined with singles.)
Educational degree achieved 1= Less than high school 2= High school diploma or GED
3= Associate’s degree 4= Bachelor’s degree
5= Master’s degree or more For correlation and regression, education was coded as a dummy variable: 0= post high school degrees and 1= high school degree or less.
Tenure ___ # of years and ___ # of months Number of months (years were converted to months)
Restaurant Type 0=Independent 1=Chain
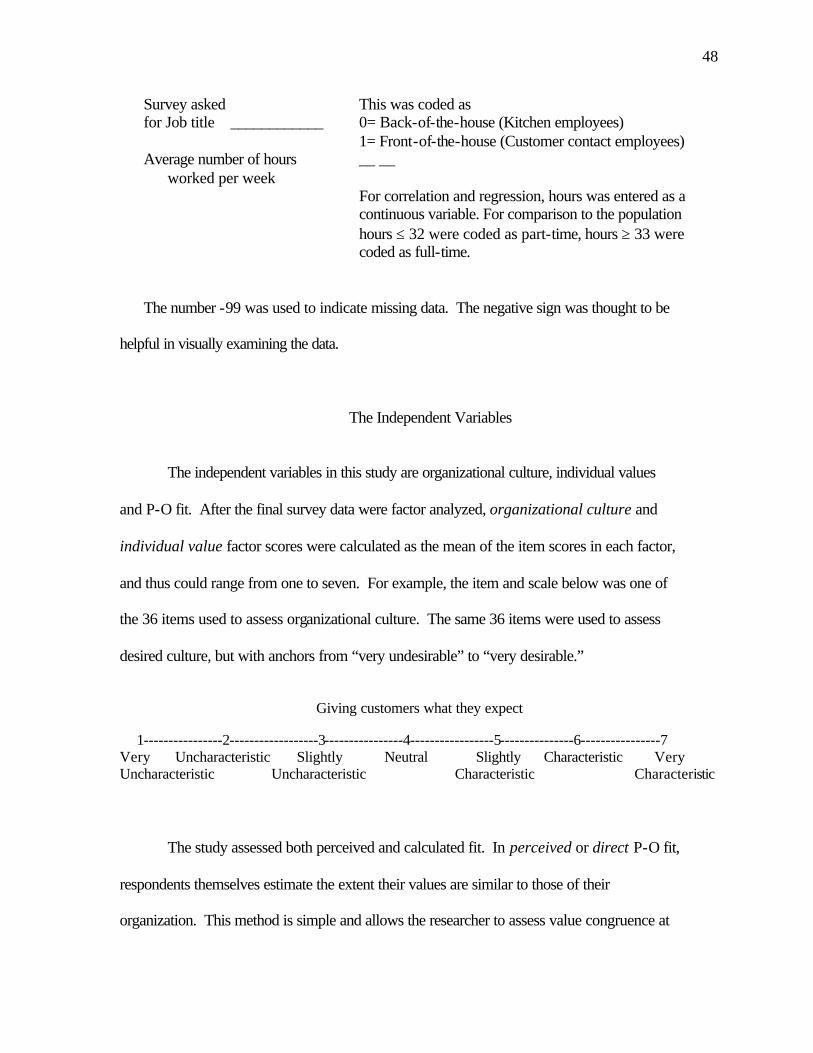
48
Survey asked This was coded as for Job title ____________ 0= Back-of-the-house (Kitchen employees)
1= Front-of-the-house (Customer contact employees) Average number of hours __ __ worked per week
For correlation and regression, hours was entered as a continuous variable. For comparison to the population hours ≤ 32 were coded as part-time, hours ≥ 33 were coded as full-time.
The number -99 was used to indicate missing data. The negative sign was thought to be
helpful in visually examining the data.
The Independent Variables
The independent variables in this study are organizational culture, individual values
and P-O fit. After the final survey data were factor analyzed, organizational culture and
individual value factor scores were calculated as the mean of the item scores in each factor,
and thus could range from one to seven. For example, the item and scale below was one of
the 36 items used to assess organizational culture. The same 36 items were used to assess
desired culture, but with anchors from “very undesirable” to “very desirable.”
Giving customers what they expect
1----------------2------------------3----------------4-----------------5---------------6----------------7 Very Uncharacteristic Slightly Neutral Slightly Characteristic Very Uncharacteristic Uncharacteristic Characteristic Characteristic
The study assessed both perceived and calculated fit. In perceived or direct P-O fit,
respondents themselves estimate the extent their values are similar to those of their
organization. This method is simple and allows the researcher to assess value congruence at
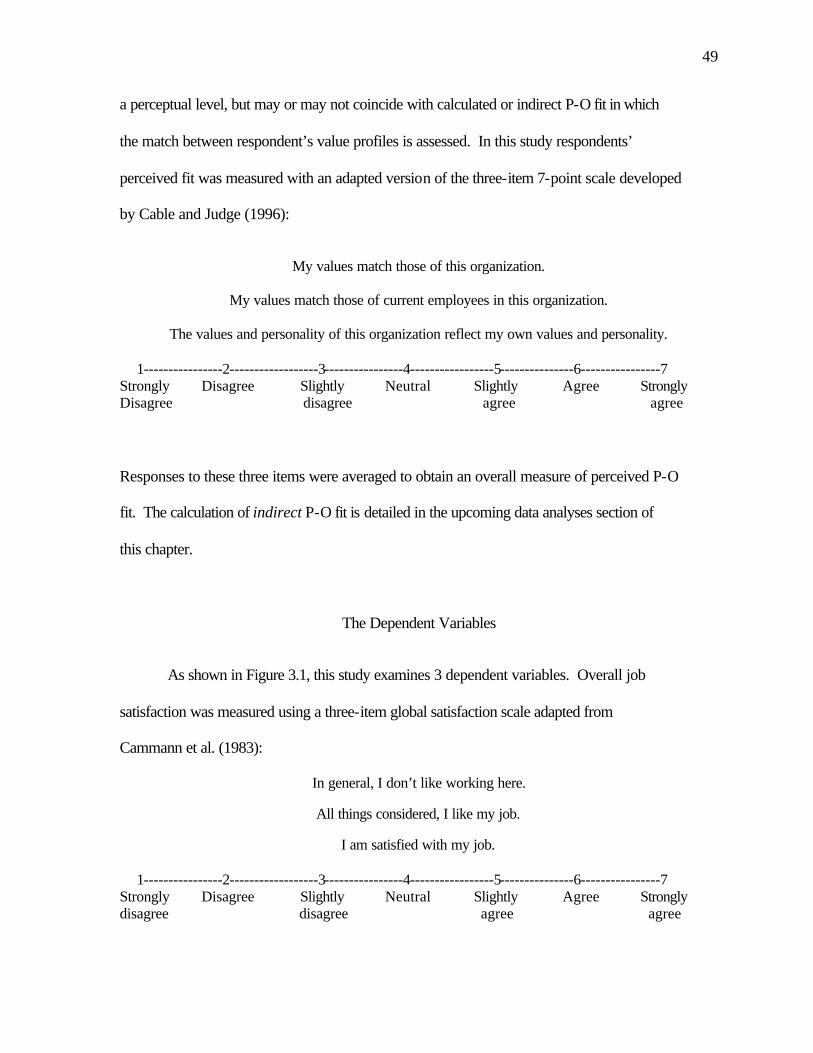
49
a perceptual level, but may or may not coincide with calculated or indirect P-O fit in which
the match between respondent’s value profiles is assessed. In this study respondents’
perceived fit was measured with an adapted version of the three-item 7-point scale developed
by Cable and Judge (1996):
My values match those of this organization.
My values match those of current employees in this organization.
The values and personality of this organization reflect my own values and personality.
1----------------2------------------3----------------4-----------------5---------------6----------------7 Strongly Disagree Slightly Neutral Slightly Agree Strongly Disagree disagree agree agree
Responses to these three items were averaged to obtain an overall measure of perceived P-O
fit. The calculation of indirect P-O fit is detailed in the upcoming data analyses section of
this chapter.
The Dependent Variables
As shown in Figure 3.1, this study examines 3 dependent variables. Overall job
satisfaction was measured using a three-item global satisfaction scale adapted from
Cammann et al. (1983):
In general, I don’t like working here.
All things considered, I like my job.
I am satisfied with my job.
1----------------2------------------3----------------4-----------------5---------------6----------------7 Strongly Disagree Slightly Neutral Slightly Agree Strongly disagree disagree agree agree
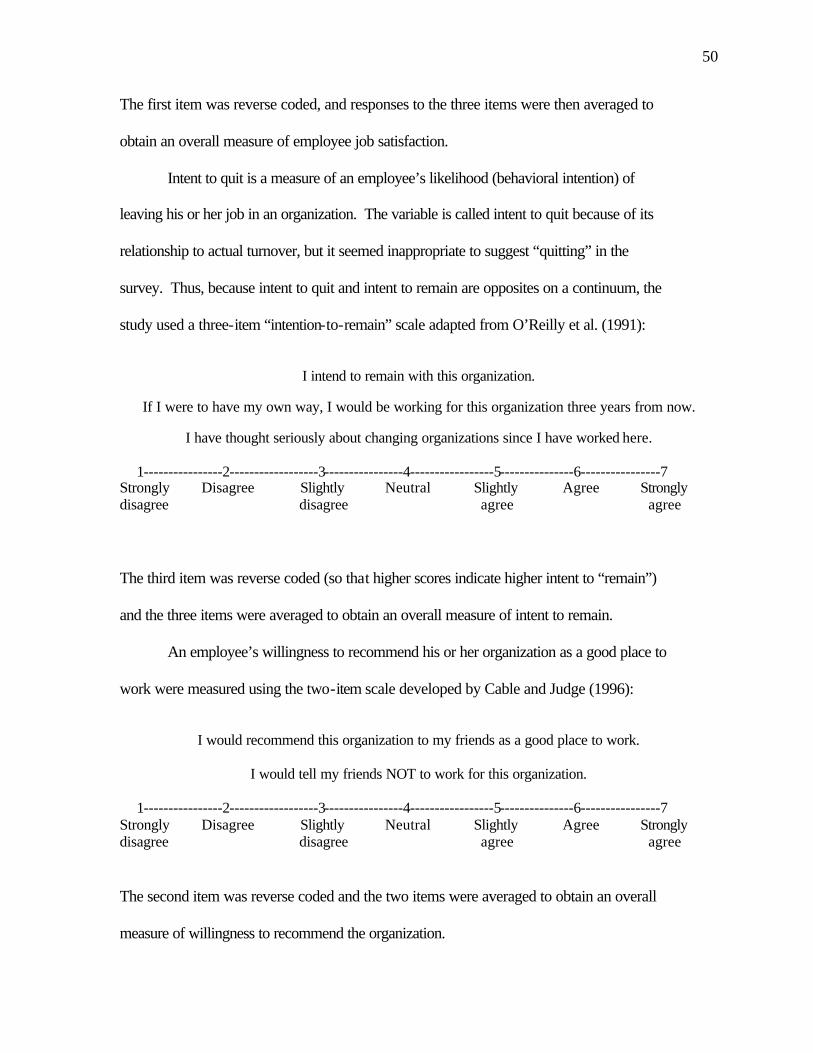
50
The first item was reverse coded, and responses to the three items were then averaged to
obtain an overall measure of employee job satisfaction.
Intent to quit is a measure of an employee’s likelihood (behavioral intention) of
leaving his or her job in an organization. The variable is called intent to quit because of its
relationship to actual turnover, but it seemed inappropriate to suggest “quitting” in the
survey. Thus, because intent to quit and intent to remain are opposites on a continuum, the
study used a three-item “intention-to-remain” scale adapted from O’Reilly et al. (1991):
I intend to remain with this organization.
If I were to have my own way, I would be working for this organization three years from now.
I have thought seriously about changing organizations since I have worked here.
1----------------2------------------3----------------4-----------------5---------------6----------------7 Strongly Disagree Slightly Neutral Slightly Agree Strongly disagree disagree agree agree
The third item was reverse coded (so that higher scores indicate higher intent to “remain”)
and the three items were averaged to obtain an overall measure of intent to remain.
An employee’s willingness to recommend his or her organization as a good place to
work were measured using the two-item scale developed by Cable and Judge (1996):
I would recommend this organization to my friends as a good place to work.
I would tell my friends NOT to work for this organization.
1----------------2------------------3----------------4-----------------5---------------6----------------7 Strongly Disagree Slightly Neutral Slightly Agree Strongly disagree disagree agree agree
The second item was reverse coded and the two items were averaged to obtain an overall
measure of willingness to recommend the organization.

51
Data Analysis
Responses to the questionnaires were coded and entered into the SPSS (Norusis,
1999), and most of the analyses used SPSS. SPSS-Amos (Arbuckle & Werner, 1999) was
used for Confirmatory Factor Analyses. In addition to descriptive statistics, the analyses
included (1) confirmatory factor analyses to test the proposed nine factor model, (2)
exploratory factor analysis of the organizational and individual value sets to test alternative
factor structures, (3) reliability assessment of the values scales identified in the factor
analyses, and of perceived fit and the dependent scales, (4) calculation and reliability
assessment of the aggregate (cross-level) culture profile of each restaurant, (5) calculation of
multiple indirect fit scores, and (6) hierarchical regression analyses to assess the influences
of individual values, organizational culture, and P-O fit on employee attitudes and intentions.
These analyses are detailed in the following sections.
Factor Analyses of Organizational and Individual Values
Confirmatory factor analysis was conducted using SPSS-Amos to determine whether
the data supported the proposed nine-factor structure for perceived and desired organizational
values. The overall model fit was assessed statistically by the chi-square (X2) test, and
heuristically using two goodness-of-fit indices. To compensate for shortcomings of any one
of the methods, researchers often use at least three methods to evaluate a data sets’ fit to the
model (Hair et al., 1998, p. 621).
Exploratory factor analyses followed the same steps completed with the pilot data,
using Principal Components Factor Analysis. To confirm whether the factoring procedure

52
was appropriate, the Kaiser-Meyer-Olkin (KMO) statistic—also called the measure of
sampling adequacy—was referenced. Based on Hair et al. (1998, p. 99), a KMO value of .60
or above is acceptable to justify the appropriateness of factor analysis. From a scree test,
factors with eigenvalues greater than 1.0 were extracted. Within these factors, items with
factor loadings of at least .50 were retained.
Reliability Assessment of the Factor Scales and Dependent Variables Used in the Study
After an acceptable factor structure for perceived and preferred values was identified,
the internal consistency reliability of the value scales, perceived fit, and the dependent
variable scales was assessed using Cronbach’s Alpha. Hair et al. 1998 (p.118) suggest an
alpha value greater than .60 is acceptable for a newly developed instrument, and that standard
was applied for this study. SPSS also calculates a reliability score if items are deleted, and
items that reduced scale reliability were eliminated. After reliability was confirmed, items in
each scale were averaged to obtain a composite scale score for use in the subsequent
analyses.
Calculation and Reliability Assessment of the Aggregate Culture Profiles of Restaurants
To obtain an aggregate culture profile for each restaurant, the perceived culture
profiles of employees in that restaurant were averaged. For this aggregate to be meaningful,
however, a majority of employees should be in agreement. Reliability of the aggregate
profile of a firm culture shows the degree of consensus about the patterning of values within
each organization.

53
There is ongoing debate in psychology regarding pros and cons of reliability indices
(James, Demaree, Wolf, 1993; Kozlowski & Hattrup, 1992; Schmidt & Hunter, 1989).
Chatman (1991) suggests using interrater and coefficient alpha reliability indices to
compensate either one’s shortcomings. Thus, reliability was assessed using both methods.
To calculate average interrater reliability, the perceived culture profile of every respondent
from a restaurant was correlated with the profile of every other respondent from that
restaurant (10 x 9 / 2 = 45 correlation). The average of these 45 interrater correlations is the
reliability of a firm profile. Second, coefficient alphas were used to compare each restaurant
employee’s rating of the restaurant to the aggregate restaurant profile. For both interrater and
coefficient alpha reliability, a score of at least .70 (Chatman, 1991; Nunnally & Bernstein,
1994) is acceptable for aggregating a composite firm profile. If either reliability score of any
restaurant did not reach this standard, that restaurant was not included in the cross-level
analysis.
Calculation of Person-Organization Fit Scores
Two issues affect indirect fit calculation. First, P-O fit can be assessed at the
individual-level or cross-level. As Chapter Two explained, individual-level assessment
compares an individual’s preferred culture to their own assessment of the organization. The
cross-level technique compares individuals’ preferred culture to the aggregate of
organizational culture as assessed by all individuals in that organization.
The second issue is the calculation measure used. For individual-level and cross-
level analyses, difference scores, correlations, and polynomial regression can be used to
calculate fit. Again, the theoretical arguments for each of these methods are detailed in
54
Chapter Two, but none has conclusively been demonstrated to be superior. Rather than
choosing any one measure a priori, in this study as many measures as possible are collected
and compared. Because polynomial regression requires scales to be equivalent at the
individual and organization level, it was not appropriate and could not be used. The three
methods remaining include (1) the sum of the absolute value of the differences (|D|), (2) the
sum of the squared differences (D2), and (3) profile correlations (Q). Each was calculated at
the individual-level and cross-level.
1) The sum of the absolute value of the differences (|D|): For individual-level, each
employee’s score for each value statement in the “perceived culture” profile was subtracted
from his or her score for the same value statement in the “preferred culture” profile. For
cross-level, each employee’s score for each value statement in the “preferred culture” profile
was subtracted from the aggregate perceived culture profile of his or her restaurant. P-O fit
were calculated as the sum of the absolute values of the 36 differences. Using absolute
values assumes that unit differences are equally influential regardless of their direction or
sign.
2) The sum of the squared differences (D2): In this method, the 36 individual and
cross level differences for each employee are squared before they are summed. This method
gives larger differences a proportionally greater impact on the fit score.
3) The correlation between the two profiles (Q): In this method, individuals preferred
culture profiles were correlated with their individual level perceived profile and with the
aggregate perceived profile. The Q score is the correlation of the two 36-point profiles.
In total, fit is measured four ways. As indicated earlier, perceived fit was measured
with a three-item scale. Calculated fit was assessed at two levels of analyses, as the sum of
55
the absolute value of the differences, the sum of the squared differences, and as the
correlation of perceived and preferred profiles. All four measures of fit were tested for their
ability to predict the dependent variables.
Hierarchical Regression Analyses
Hierarchical Regression Analyses were used to ascertain the relative contribution of
the control variables and each of the independent variables (organizational culture, individual
values, and P-O fit). In the first step of the hierarchical regression procedure, the control
variables (gender, age, marital status, education, tenure, restaurant type, position employed,
and number of work hours) were entered to determine the variance they explain in employee
satisfaction, intent to remain, and willingness to recommend the organization.
Next, the perceived organizational culture and then individual value factors were
entered as separate sets to determine their influence on the dependent variables. Finally, each
of the four measures of P-O fit was each entered into the regression model to determine if
they explain additional variance in the three dependent variables. The four-step hierarchical
regression procedure made it possible to determine whether P-O fit contributes to the
outcome variables over and above organizational culture and individual characteristics.
Revised Model
After introducing all variables in the study, and explaining their operationalization
and calculation, the revised hypothesized model is illustrated in detail in Figure 3.2. As
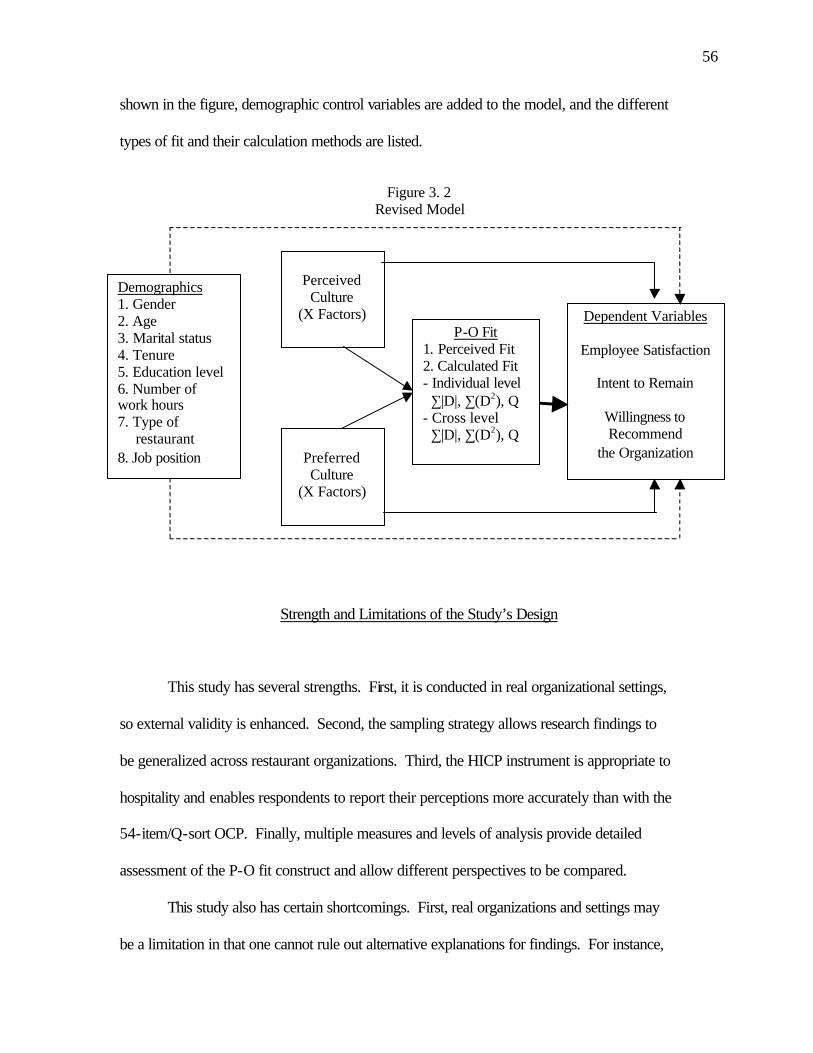
56
shown in the figure, demographic control variables are added to the model, and the different
types of fit and their calculation methods are listed.
Figure 3. 2
Revised Model
Strength and Limitations of the Study’s Design
This study has several strengths. First, it is conducted in real organizational settings,
so external validity is enhanced. Second, the sampling strategy allows research findings to
be generalized across restaurant organizations. Third, the HICP instrument is appropriate to
hospitality and enables respondents to report their perceptions more accurately than with the
54-item/Q-sort OCP. Finally, multiple measures and levels of analysis provide detailed
assessment of the P-O fit construct and allow different perspectives to be compared.
This study also has certain shortcomings. First, real organizations and settings may
be a limitation in that one cannot rule out alternative explanations for findings. For instance,
Perceived
Culture (X Factors)
Preferred Culture
(X Factors)
Dependent Variables
Employee Satisfaction
Intent to Remain
Willingness to Recommend
the Organization
P-O Fit 1. Perceived Fit 2. Calculated Fit - Individual level ∑|D|, ∑(D2), Q - Cross level ∑|D|, ∑(D2), Q
Demographics 1. Gender 2. Age 3. Marital status 4. Tenure 5. Education level 6. Number of work hours 7. Type of
restaurant 8. Job position
57
such factors as the labor market, pay, management type, or work design could influence
individual outcomes. Second, because this study collects data at one point in time, there is
no assurance that the data are stable. Third, the employees sampled from each restaurant
may or may not be representative of the organization as a whole. Fourth, because data were
collected in multiple operations, data collection may not have been precisely the same for all
employees and restaurants. Overall, the benefits appear to outweigh the limitations, as the
results presented in Chapter Four will show.

CHAPTER IV
ANALYSIS OF THE DATA
This chapter presents the results of the study. First, data collection and
representativeness of the sample is evaluated. Next, results of confirmatory and exploratory
factor analyses that determined the factor dimensions are presented. Third, the cross-level
sample is determined so individual-level and cross-level analyses can be conducted. Then
P-O fit and dependent variable scores are provided, and differences in these scores based on
demographic categories are presented and compared to historical findings. Finally,
Hierarchical Regression Analyses show the relative contribution of the (1) control variables,
(2) organizational culture dimensions, (3) individual value dimensions, and (4) P-O fit in
explaining the dependent variables.
Prior to the data analysis, several issues were resolved to ensure reliability. These
issues were (1) accuracy of data entry, (2) missing values, (3) fit of the data set with
multivariate assumptions of normality, linearity, independence of error terms, and
homoscedasticity. Accuracy of the data was verified through examination of descriptive
statistics (minimum and maximum values) and graphic representations of the variables. For
missing values, just 13 out of 23,472 data points were missing for the value items, and these
were replaced with the individual restaurant mean value for that particular item. Nine of
2,608 data points for the dependent variable items were missing. Seven were replaced with
the mean scores of the other two items measuring the same dependent variable for that
respondent. Because one individual did not respond to 2 of three items in the intent to remain
scale, this entire score was not included, so one of the 978 possible dependent scales was
59
missing. Eighteen of 2,608 data points were missing among demographic variables. Missing
demographic variables were not replaced. Deletion was preferred to estimation for those
missing values because there was no information to reliably estimate the scores or categories
(e.g., male and female). As a result of these decisions, the sample size varied slightly.
Normality of variables was assessed by statistical methods: skewness and kurtosis.
Skewness and kurtosis values were, on average, smaller than one, and deviations from
normality were very minor. Logarithm, square, and square root transformations of the data
did not lessen these deviations, so data were retained in their original form. Tabachnick and
Fidell (1996) say the impact of small skewness and kurtosis deviations from zero disappears
in a sample of 200 or more. Since the current sample size is over 300, slight skewness and
kurtosis should not influence the overall analyses and results. Linearity was assessed based
on residual plots from the regression analyses. Normally and independently distributed
residuals indicated independence of error terms. Bivariate scatterplots between variables
showed relationships were homoscedastic and evenly distributed. In combination, these
analyses indicate the data are reliable and appropriate for further analyses.
Representativeness of the Sample
The final sample included responses from 34 table-service restaurants, a mix of 28
“full service” (e.g., Olive Garden) and 6 “family dining” (e.g., Denny’s) restaurants. The
sample included 326 restaurant employees: 173 employees working in front-of-the-house
(dining room) positions and 153 working in back-of-the-house (kitchen) positions (managers
responded to the survey, but data collected from them were not included in the analyses).
60
The Penn State graduates and students who assisted in the data collection clearly do
not represent a random sample of restaurant employees. There is no reason, however, that
their employees and coworkers from whom data were collected, in 34 distinct and
geographically dispersed restaurants, would not be representative. Although characteristics
of the table-service restaurant employee population are difficult to determine because
available data combine table-service and quick-service restaurant employees, compared to a
national profile of restaurant employees overall (Restaurant Industry Employee Profile,
2000) the sample was similar on most dimensions (Table 4.1). Fifty-eight percent of the
restaurant employee population is female; while males and females are almost equally
represented in this sample (50.6% versus 49.4%). In comparing age, the sample is
underrepresented in the-less-than- 18 and over 45 categories, but this is probably because fast
food restaurants are excluded. Carlino (1999) notes that many fast food companies utilize
older workers as a labor source. Note that when “all employees less than 24” and “all
employees over 24” are compared, the sample and population are nearly equal.
In terms of marital status, the sample is nearly equal to the population in proportion of
married people, but somewhat higher in singles and lower in the proportion who are
separated, divorced, or widowed. The sample is more highly educated than the restaurant
employee population, but this would be expected because the sample excluded fast-food
restaurants in which many high school students are employed. In fact, when the “less than
high school” and “high school graduates” categories are combined, the difference of sample
(66.3%) to population (70%) is far less evident. Similarly, when post high school degrees are
combined the sample (33.1%) and population (30%) again compare favorably.
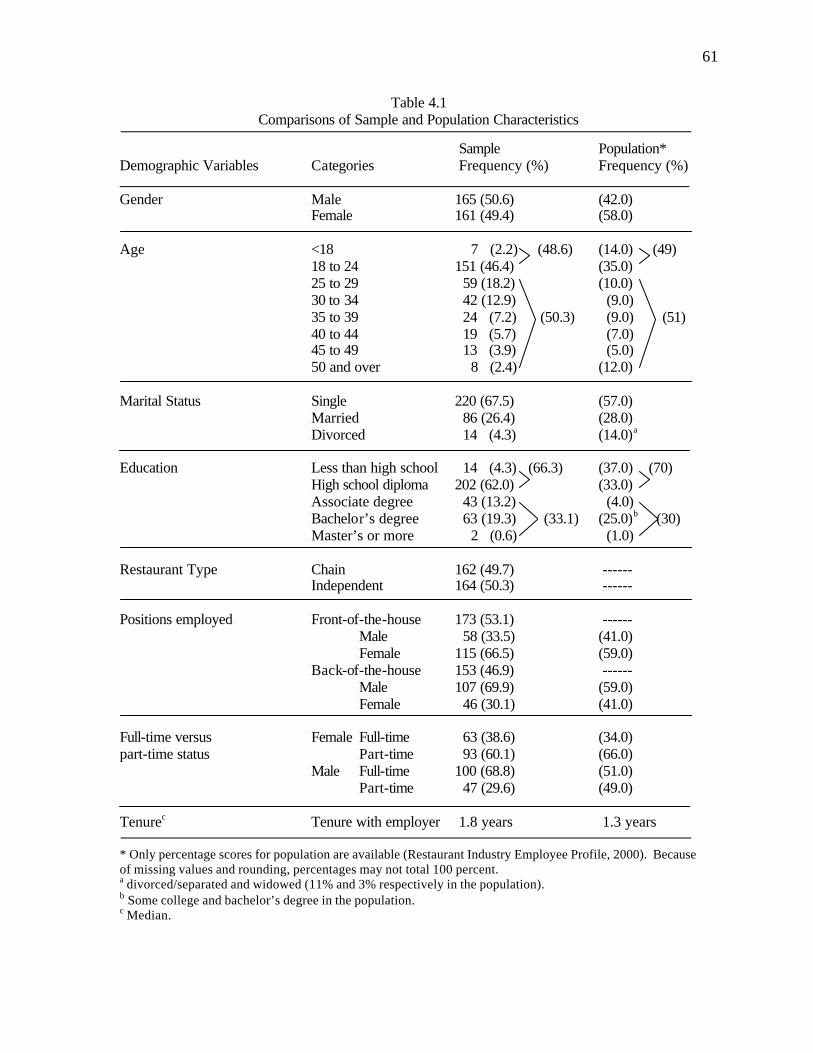
61
Table 4.1 Comparisons of Sample and Population Characteristics
Sample Population*
Demographic Variables Categories Frequency (%) Frequency (%) Gender Male 165 (50.6) (42.0) Female 161 (49.4) (58.0) Age <18 7 (2.2) (48.6) (14.0) (49) 18 to 24 151 (46.4) (35.0) 25 to 29 59 (18.2) (10.0) 30 to 34 42 (12.9) (9.0) 35 to 39 24 (7.2) (50.3) (9.0) (51) 40 to 44 19 (5.7) (7.0) 45 to 49 13 (3.9) (5.0) 50 and over 8 (2.4) (12.0) Marital Status Single 220 (67.5) (57.0) Married 86 (26.4) (28.0) Divorced 14 (4.3) (14.0)a Education Less than high school 14 (4.3) (66.3) (37.0) (70) High school diploma 202 (62.0) (33.0) Associate degree 43 (13.2) (4.0) Bachelor’s degree 63 (19.3) (33.1) (25.0)b (30)
Master’s or more 2 (0.6) (1.0) Restaurant Type Chain 162 (49.7) ------ Independent 164 (50.3) ------ Positions employed Front-of-the-house 173 (53.1) ------ Male 58 (33.5) (41.0) Female 115 (66.5) (59.0)
Back-of-the-house 153 (46.9) ------ Male 107 (69.9) (59.0) Female 46 (30.1) (41.0)
Full-time versus Female Full-time 63 (38.6) (34.0) part-time status Part-time 93 (60.1) (66.0) Male Full-time 100 (68.8) (51.0) Part-time 47 (29.6) (49.0) Tenurec Tenure with employer 1.8 years 1.3 years * Only percentage scores for population are available (Restaurant Industry Employee Profile, 2000). Because of missing values and rounding, percentages may not total 100 percent. a divorced/separated and widowed (11% and 3% respectively in the population). b Some college and bachelor’s degree in the population. c Median.
62
Employees working in chain and independent restaurants were almost equally
represented in the sample. Slightly more employees work in front-of-the-house (53.1%) than
in back-of-the-house positions (46.9%), and the population pattern of more females working
in front-of-the-house positions and more males in back-of-the-house positions is even more
pronounced in the current sample. Consistent with the restaurant employee population,
females are more likely to be part-time and males are more likely to be full-time. The sample
reports slightly longer employment terms (1.8 years) than the population average (1.3 years),
which may again be due to the exclusion of fast-food restaurants. Compared to other
industries, all employed persons in the U.S. had a median of 3.6 years employment tenure
(Restaurant Industry Employee Profile, 2000). Considering all the similarities between the
sample and the population employees, the findings of this study can be cautiously
generalized to the overall population of table-service restaurant employees.
Factor Analyses
Factor analyses were conducted to determine the factor structure among the value-
items. Confirmatory factor analysis seeks to “confirm” whether a proposed factor structure is
supported by the data. Exploratory factor analysis does not specify any structure a priori but
constructs a model that best fit the data (Hair et al., 1998).
This study developed the 36-item HICP instrument to assess 9 hypothesized factor-
dimensions of perceived and preferred restaurant culture. To investigate whether the data
confirmed the proposed 9-factor structure, confirmatory factor analyses were conducted for
both the perceived culture and preferred culture ratings. The overall model fit was assessed
63
by the chi-square (X2) test and two other goodness-of-fit indices (Table 4.2). The significant
X2 statistic indicates the data do not support the nine factor model for perceived or preferred
culture. Because the X2 test is sensitive to sample size (Hair et al., 1998), two heuristic
measures of model fit (the Root Mean Square Error of Approximation and Parsimonious
Comparative Fit Index) were also calculated. As the table indicates, none of the values met
the specified threshold to demonstrate fit, indicating the nine factor model is not supported
for perceived or preferred culture.
Table 4.2
Goodness-of-Fit Measures For Confirmatory Factor Analyses
Goodness-of-Fit Measures Perceived Preferred Culture Culture
1Chi-square (X2) test (df= 597) 3872.70 (p< .000) 4088.33 (p< .000)
2Root Mean Square Error of Approximation (RMSEA)130 n.s. .134 n.s.
3Parsimonious Comparative Fit Index (PCFI) .828 n.s. .836 n.s. 1. The significant X2 statistic indicates the data do not support the nine factor model. 2. A RMSEA less than .05 has been suggested as an indicator of fit 3. Minimum recommended level for accepting the model is .90 (Hair et al., 1998, p. 623)
Factor Dimensions of Perceived Restaurant Culture
Because the nine-factor model was not confirmed, exploratory factor analyses were
conducted to determine a factor structure that better fit the data. Principal components
analysis, with varimax (orthogonal) rotation, was used to assess how the 36 value items were
grouped for both perceived and preferred culture. For the perceived culture data, the Keiser–
Meyer–Olkin (KMO) measure of overall sampling adequacy was 0.923, which supported
factor analysis of the data (Hair et al., 1998). The analysis yielded seven distinct factors with
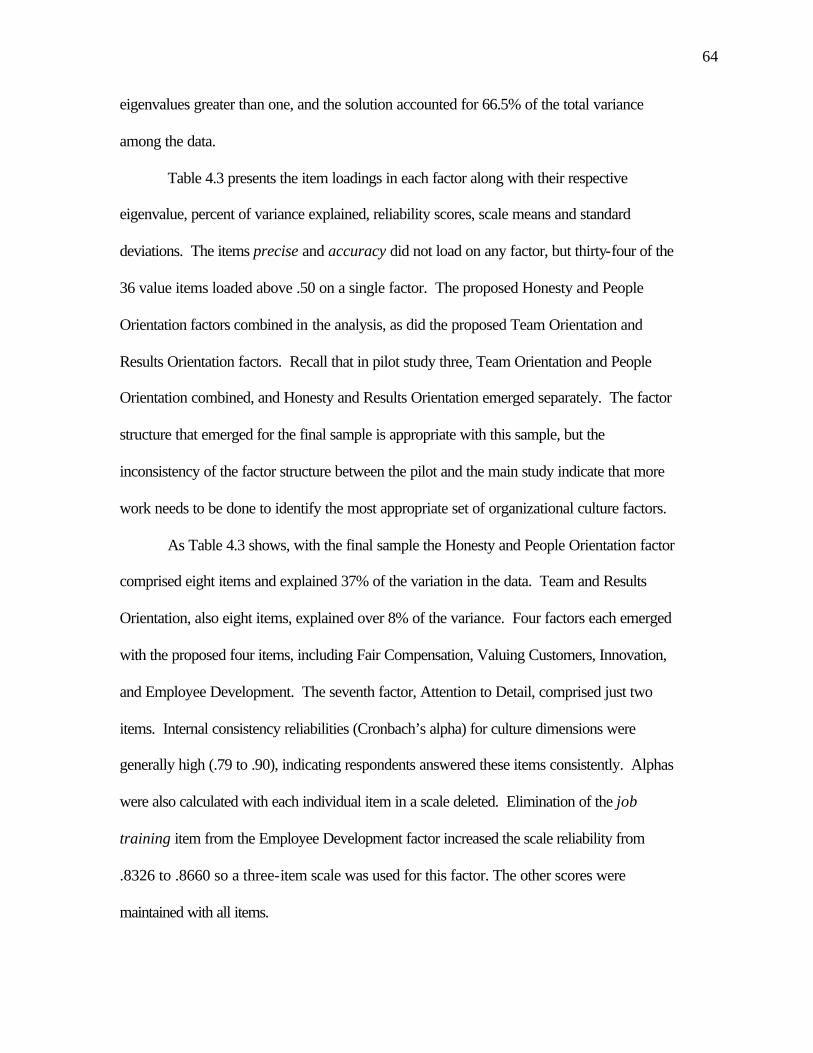
64
eigenvalues greater than one, and the solution accounted for 66.5% of the total variance
among the data.
Table 4.3 presents the item loadings in each factor along with their respective
eigenvalue, percent of variance explained, reliability scores, scale means and standard
deviations. The items precise and accuracy did not load on any factor, but thirty-four of the
36 value items loaded above .50 on a single factor. The proposed Honesty and People
Orientation factors combined in the analysis, as did the proposed Team Orientation and
Results Orientation factors. Recall that in pilot study three, Team Orientation and People
Orientation combined, and Honesty and Results Orientation emerged separately. The factor
structure that emerged for the final sample is appropriate with this sample, but the
inconsistency of the factor structure between the pilot and the main study indicate that more
work needs to be done to identify the most appropriate set of organizational culture factors.
As Table 4.3 shows, with the final sample the Honesty and People Orientation factor
comprised eight items and explained 37% of the variation in the data. Team and Results
Orientation, also eight items, explained over 8% of the variance. Four factors each emerged
with the proposed four items, including Fair Compensation, Valuing Customers, Innovation,
and Employee Development. The seventh factor, Attention to Detail, comprised just two
items. Internal consistency reliabilities (Cronbach’s alpha) for culture dimensions were
generally high (.79 to .90), indicating respondents answered these items consistently. Alphas
were also calculated with each individual item in a scale deleted. Elimination of the job
training item from the Employee Development factor increased the scale reliability from
.8326 to .8660 so a three-item scale was used for this factor. The other scores were
maintained with all items.
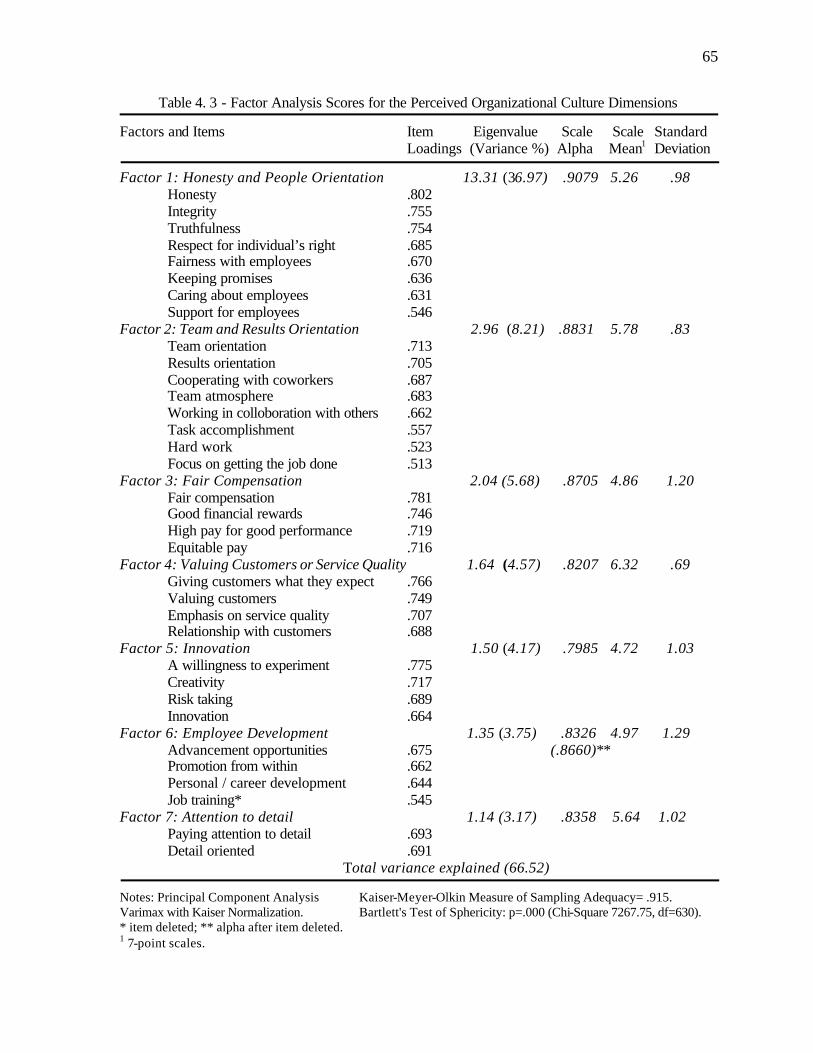
65
Table 4. 3 - Factor Analysis Scores for the Perceived Organizational Culture Dimensions Factors and Items Item Eigenvalue Scale Scale Standard Loadings (Variance %) Alpha Mean1 Deviation Factor 1: Honesty and People Orientation 13.31 (36.97) .9079 5.26 .98
Honesty .802 Integrity .755 Truthfulness .754 Respect for individual’s right .685 Fairness with employees .670 Keeping promises .636 Caring about employees .631 Support for employees .546 Factor 2: Team and Results Orientation 2.96 (8.21) .8831 5.78 .83
Team orientation .713 Results orientation .705 Cooperating with coworkers .687 Team atmosphere .683 Working in colloboration with others .662 Task accomplishment .557 Hard work .523 Focus on getting the job done .513
Factor 3: Fair Compensation 2.04 (5.68) .8705 4.86 1.20 Fair compensation .781
Good financial rewards .746 High pay for good performance .719 Equitable pay .716
Factor 4: Valuing Customers or Service Quality 1.64 (4.57) .8207 6.32 .69 Giving customers what they expect .766 Valuing customers .749 Emphasis on service quality .707 Relationship with customers .688
Factor 5: Innovation 1.50 (4.17) .7985 4.72 1.03 A willingness to experiment .775 Creativity .717 Risk taking .689 Innovation .664 Factor 6: Employee Development 1.35 (3.75) .8326 4.97 1.29
Advancement opportunities .675 (.8660)** Promotion from within .662 Personal / career development .644 Job training* .545
Factor 7: Attention to detail 1.14 (3.17) .8358 5.64 1.02 Paying attention to detail .693 Detail oriented .691 Total variance explained (66.52)
Notes: Principal Component Analysis Kaiser-Meyer-Olkin Measure of Sampling Adequacy= .915. Varimax with Kaiser Normalization. Bartlett's Test of Sphericity: p=.000 (Chi-Square 7267.75, df=630). * item deleted; ** alpha after item deleted. 1 7-point scales.
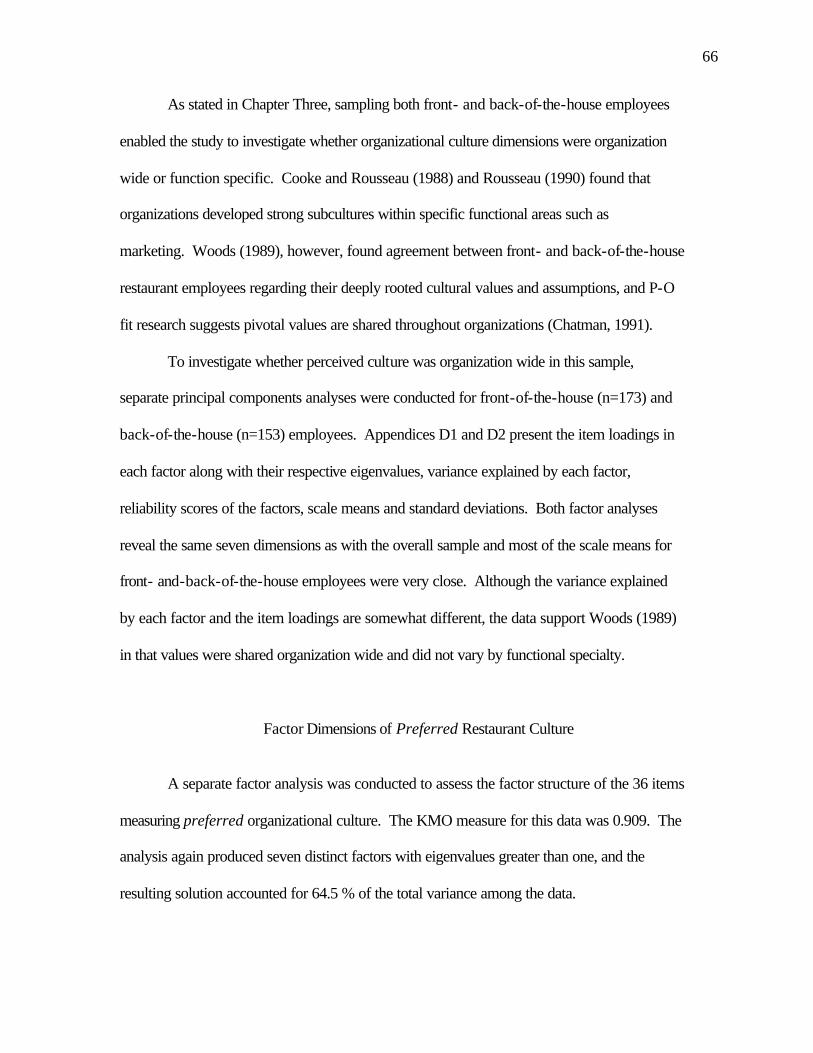
66
As stated in Chapter Three, sampling both front- and back-of-the-house employees
enabled the study to investigate whether organizational culture dimensions were organization
wide or function specific. Cooke and Rousseau (1988) and Rousseau (1990) found that
organizations developed strong subcultures within specific functional areas such as
marketing. Woods (1989), however, found agreement between front- and back-of-the-house
restaurant employees regarding their deeply rooted cultural values and assumptions, and P-O
fit research suggests pivotal values are shared throughout organizations (Chatman, 1991).
To investigate whether perceived culture was organization wide in this sample,
separate principal components analyses were conducted for front-of-the-house (n=173) and
back-of-the-house (n=153) employees. Appendices D1 and D2 present the item loadings in
each factor along with their respective eigenvalues, variance explained by each factor,
reliability scores of the factors, scale means and standard deviations. Both factor analyses
reveal the same seven dimensions as with the overall sample and most of the scale means for
front- and-back-of-the-house employees were very close. Although the variance explained
by each factor and the item loadings are somewhat different, the data support Woods (1989)
in that values were shared organization wide and did not vary by functional specialty.
Factor Dimensions of Preferred Restaurant Culture
A separate factor analysis was conducted to assess the factor structure of the 36 items
measuring preferred organizational culture. The KMO measure for this data was 0.909. The
analysis again produced seven distinct factors with eigenvalues greater than one, and the
resulting solution accounted for 64.5 % of the total variance among the data.

67
Table 4.4 shows the item loadings in each factor along with their respective
eigenvalue, percent of variance explained, reliability scores, scale means and standard
deviations. The items emphasis on service quality, keeping promises, support for employees,
and caring about employees did not load on any factor, but 32 of 36 items loaded above .50
on a single factor. In this data set the Fair Compensation and Employee Development factors
combined into a 7-item scale explaining over 32% of the variation in the data. The Honesty
and People Orientation factors again loaded together, which in this case explained over 10%
of the variance. Four four-item factors emerged as proposed, including Team Orientation,
Attention to Detail, Innovation, and Results Orientation. Valuing Customers comprised three
items.
Alphas ranged from .74 to .89, all higher than the .60 minimum proposed by Hair et
al. (1998). Again, alphas were calculated with each item in a scale deleted. Elimination of
the job training item increased reliability of the Team Orientation scale from .8061 to .8078
(though only a small increase, elimination is also appropriate because this item was not
proposed as part of Team Orientation). Elimination of the risk taking item increased
reliability of the Innovation scale from .7742 to .7797. Therefore, three-item scales of these
factors were used in final regression analyses. The relatively narrow range of mean scores
(5.75 - 6.53) suggests all of these factors are desired in the preferred culture.
Comparability of Perceived and Preferred Culture Profiles
Although the hypothesized nine-factor structure did not emerge for perceived culture
or preferred culture, 34 of the 36 value items loaded above .50 on a single factor for
perceived culture, 32 of 36 loaded above .50 for preferred culture, and 28 of 36 value items
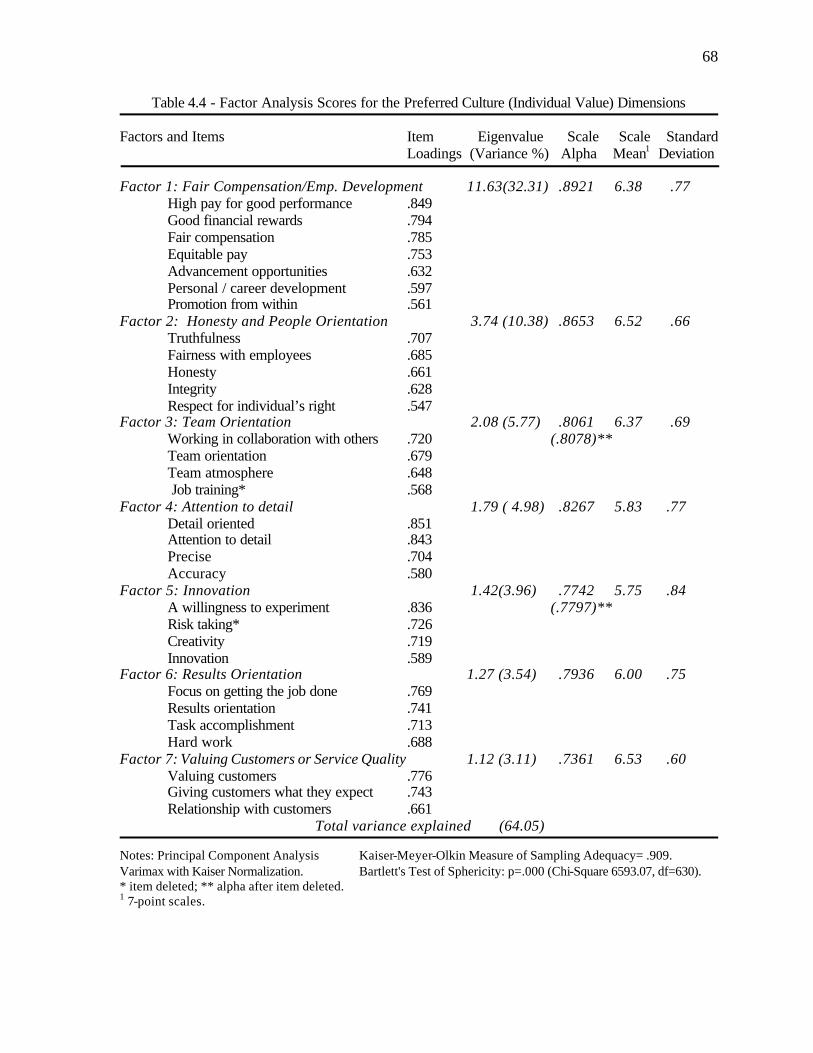
68
Table 4.4 - Factor Analysis Scores for the Preferred Culture (Individual Value) Dimensions Factors and Items Item Eigenvalue Scale Scale Standard Loadings (Variance %) Alpha Mean1 Deviation Factor 1: Fair Compensation/Emp. Development 11.63(32.31) .8921 6.38 .77
High pay for good performance .849 Good financial rewards .794 Fair compensation .785 Equitable pay .753 Advancement opportunities .632
Personal / career development .597 Promotion from within .561 Factor 2: Honesty and People Orientation 3.74 (10.38) .8653 6.52 .66
Truthfulness .707 Fairness with employees .685 Honesty .661
Integrity .628 Respect for individual’s right .547 Factor 3: Team Orientation 2.08 (5.77) .8061 6.37 .69
Working in collaboration with others .720 (.8078)** Team orientation .679 Team atmosphere .648
Job training* .568 Factor 4: Attention to detail 1.79 ( 4.98) .8267 5.83 .77
Detail oriented .851 Attention to detail .843 Precise .704 Accuracy .580
Factor 5: Innovation 1.42(3.96) .7742 5.75 .84 A willingness to experiment .836 (.7797)** Risk taking* .726 Creativity .719 Innovation .589
Factor 6: Results Orientation 1.27 (3.54) .7936 6.00 .75 Focus on getting the job done .769 Results orientation .741 Task accomplishment .713 Hard work .688
Factor 7: Valuing Customers or Service Quality 1.12 (3.11) .7361 6.53 .60 Valuing customers .776 Giving customers what they expect .743 Relationship with customers .661
Total variance explained (64.05) Notes: Principal Component Analysis Kaiser-Meyer-Olkin Measure of Sampling Adequacy= .909. Varimax with Kaiser Normalization. Bartlett's Test of Sphericity: p=.000 (Chi-Square 6593.07, df=630). * item deleted; ** alpha after item deleted. 1 7-point scales.
69
loaded above .50 on the same dimension. The factor loadings indicate a seven-factor
structure that is similar but not identical in the two analyses (Table 4.5).
Table 4.5
Perceived and Preferred Culture Dimensions Identified in the Study Perceived Culture Dimensions Preferred Culture Dimensions (1) Honesty and people orientation (1) Honesty and people orientation (2) Attention to detail (2) Attention to detail (3) Valuing customers (3) Valuing customers (4) Innovation (4) Innovation (5) Fair compensation (5) Fair compensation and (6) Employee development employee development (7) Team and results orientation (6) Team orientation
(7) Results orientation
This overlap between perceived and preferred cultural dimensions increases the
potential meaningfulness of P-O fit, but because the factors combined differently and slightly
different items make up each dimensions, direct comparison of perceived and preferred
factors is not possible. Nonetheless, recall in the O’Reilly et al. (1991) study that just 20 of
54 value-items loaded at .40 or above for both the perceived and preferred culture
dimensions, and four value items loaded on different factors in the perceived and preferred
culture dimensions. In this study just one item (job training) loaded on different factors in
the two analyses. These results may indicate that, compared to O’Reilly et al’s.
heterogeneous sample of accountants, government employees, and MBA students, a
homogenous restaurant employee sample may lead to better correspondence between
individual and organizational values, and in turn may be more conducive to studying P-O fit.
Analysis of the scale means for the factors provides interesting insights. In perceived
culture, the factor perceived to exist at the highest level was Valuing Customers or Service
Quality (6.32), which would be expected in service businesses. The combined Team and
70
Results Orientation factor—emphasis on getting the job done—was also high (5.78). Factors
that might indicate valuing individual employees, however, were perceived to exist at much
lower levels, including Innovation (4.72), Fair Compensation (4.86), and Employee
Development (4.97). Apparently, employees perceive that “getting the job done” takes
precedence over their needs. The assumption that employees desire more attention is borne
out in the factor means for preferred culture. The Valuing Customers or Service Quality
factor still has the highest mean score (6.53), but that score is only .21 higher than that
factor’s score on the perceived scale. For the factors indicating concern for individuals,
however, the perceived and preferred differences are dramatic. For the combined Fair
Compensation and Employee Development factor, the preferred factor score (6.38) was a full
1.52 points above perceived Fair Compensation (4.86) and 1.41 points above perceived
Employee Development (4.97). For Honesty and People Orientation, the perceived level was
5.26 while the preferred level was 6.52, a 1.26 difference. In combination these comparisons
indicate employees’ perceived and preferred organizations are relatively close on customer
service and productivity dimensions, but are much further apart on factors of concern to
individual employees.
The Cross-Level Sample
As described in Chapter Two, individual-level fit compares each employee’s
preferred organizational characteristics with their individual perception of the existing
organization. Hence, calculation of individual-level indirect fit relies on the individual as the
unit of analysis. Cross-level assessment of P-O fit aggregates employee perceptions of the
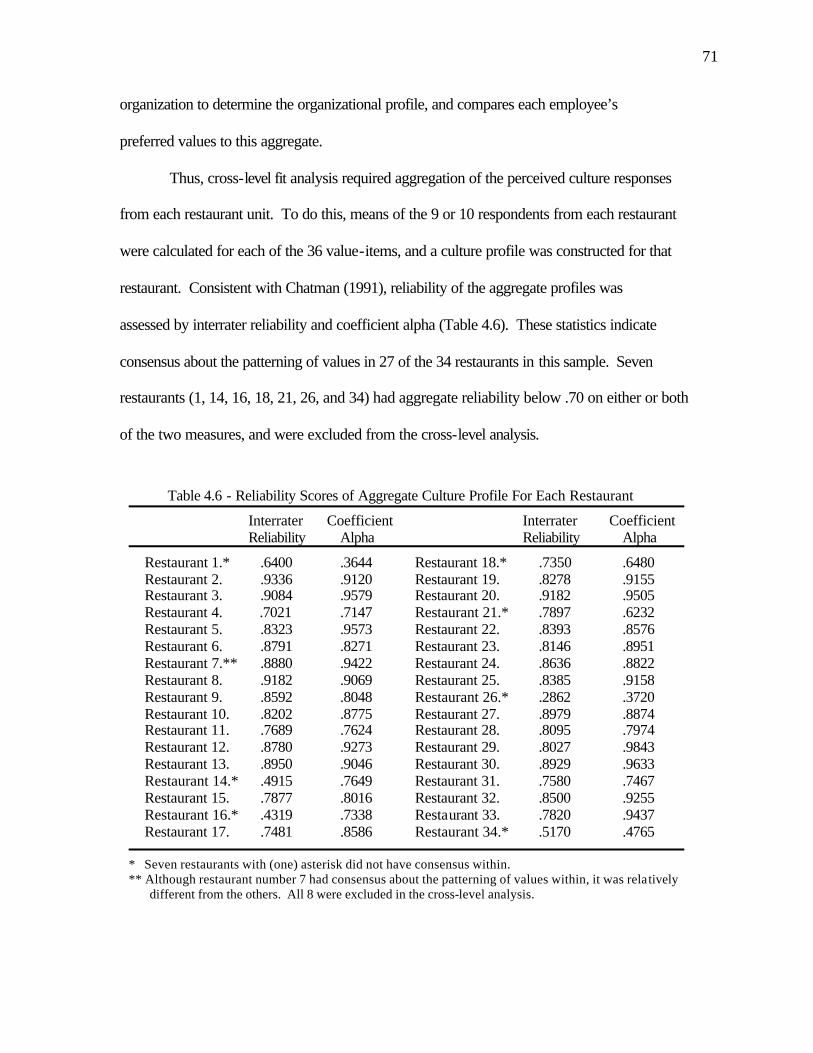
71
organization to determine the organizational profile, and compares each employee’s
preferred values to this aggregate.
Thus, cross-level fit analysis required aggregation of the perceived culture responses
from each restaurant unit. To do this, means of the 9 or 10 respondents from each restaurant
were calculated for each of the 36 value-items, and a culture profile was constructed for that
restaurant. Consistent with Chatman (1991), reliability of the aggregate profiles was
assessed by interrater reliability and coefficient alpha (Table 4.6). These statistics indicate
consensus about the patterning of values in 27 of the 34 restaurants in this sample. Seven
restaurants (1, 14, 16, 18, 21, 26, and 34) had aggregate reliability below .70 on either or both
of the two measures, and were excluded from the cross-level analysis.
Table 4.6 - Reliability Scores of Aggregate Culture Profile For Each Restaurant
Interrater Coefficient Reliability Alpha
Restaurant 1.* .6400 .3644 Restaurant 2. .9336 .9120 Restaurant 3. .9084 .9579 Restaurant 4. .7021 .7147 Restaurant 5. .8323 .9573 Restaurant 6. .8791 .8271 Restaurant 7.** .8880 .9422 Restaurant 8. .9182 .9069 Restaurant 9. .8592 .8048 Restaurant 10. .8202 .8775 Restaurant 11. .7689 .7624 Restaurant 12. .8780 .9273 Restaurant 13. .8950 .9046 Restaurant 14.* .4915 .7649 Restaurant 15. .7877 .8016 Restaurant 16.* .4319 .7338 Restaurant 17. .7481 .8586
Interrater Coefficient Reliability Alpha
Restaurant 18.* .7350 .6480 Restaurant 19. .8278 .9155 Restaurant 20. .9182 .9505 Restaurant 21.* .7897 .6232 Restaurant 22. .8393 .8576 Restaurant 23. .8146 .8951 Restaurant 24. .8636 .8822 Restaurant 25. .8385 .9158 Restaurant 26.* .2862 .3720 Restaurant 27. .8979 .8874 Restaurant 28. .8095 .7974 Restaurant 29. .8027 .9843 Restaurant 30. .8929 .9633 Restaurant 31. .7580 .7467 Restaurant 32. .8500 .9255 Restaurant 33. .7820 .9437 Restaurant 34.* .5170 .4765
* Seven restaurants with (one) asterisk did not have consensus within. ** Although restaurant number 7 had consensus about the patterning of values within, it was relatively
different from the others. All 8 were excluded in the cross-level analysis.
72
After restaurants with low internal reliability were excluded, the 36 item firm profile for
each restaurant was correlated with the profile for every other restaurant (27 x 26 / 2= 351
profile correlations). Table 4.7 shows that the correlations among the 27 restaurants were
generally high, suggesting that restaurant culture is shared industry-wide. Despite internal
reliability, restaurant number 7 was relatively different from the others, and excluding it as
well increased the average correlation from .64 to .67 among the remaining 26 restaurants.
This compared favorably with Chatman (1991), who found a .66 average correlation among
eight accounting firms. Thus, only the 26 restaurants that demonstrated consensus of values
within the organization and a culture profile similar to the other organizations were included
in the cross-level analyses.
Because the sample was changed, exploratory factor analyses were conducted again
to determine if the factor dimensions and scores were changed. For perceived and preferred
culture, the analyses yielded the same seven dimensions that were found with the overall
sample. No items changed factors, but there were minor changes in the items that loaded.
Internal consistency reliabilities of all dimensions exceeded the minimum recommended
level of .60 (Hair et al., 1998). Thus, factor scores were calculated for these dimensions and
used for cross-level correlation and regression analyses. Most analyses are conducted
separately at the individual-level (34 restaurants, 326 employees) and the cross level (26
restaurants, 250 employees).

73
Tab
le 4
.7 -
Cor
rela
tions
Am
ong
Res
taur
ant C
ultu
re P
rofil
es
2
3
4
5
6
7
8
9
1
0
11
12
1
3
15
17
19
20
2
2 2
3
24
25
27
28
2
9 3
0 3
1 3
2 3
3
R
esta
uran
t 2
_
R
esta
uran
t 3
.73
_
R
esta
uran
t 4
.5
3 .
75
_
Res
taur
ant 5
.62
.67
.6
6
_
Res
taur
ant 6
.30
.53
.6
8 .
63
_
Res
taur
ant 7
.27
.20
. 4
3
24
.25
_
R
esta
uran
t 8
.3
1 .
45
.70
.64
.7
2 .
51
_
Res
taur
ant 9
.80
.70
.4
5 .
66
.45
.01
.3
2
_ R
esta
uran
t 10
.5
0 .
48
.53
.66
.6
5 .
32
.62
.69
_
R
esta
uran
t 11
.4
2 .
52
.42
.72
.5
3 .
07
.64
.61
.6
6
_
Res
taur
ant 1
2
.65
.69
.6
2 .
74
.68
.16
.5
5 .
66
.59
.65
_
R
esta
uran
t 13
.6
3 .
82
.64
.61
.5
1 .
07
.50
.62
.4
2 .
56
.73
_
R
esta
uran
t 15
.5
6 .
57
.72
.82
.6
4 .
32
.64
.62
.7
3 .
64
.59
.38
_
R
esta
uran
t 17
.5
2 .
68
.74
.76
.6
3 .
34
.68
.63
.7
4 .
66
.59
.52
.8
1
_
Res
taur
ant 1
9
.39
.56
.7
9 .
63
.71
.30
.7
0 .
47
.68
.39
.4
7 .
42
.75
.79
_
R
esta
uran
t 20
.2
3 .
45
.55
.64
.7
3 .
29
.73
.45
.7
2 .
64
.56
.40
.6
9 .
81
.68
_
R
esta
uran
t 22
.6
2 .
78
.78
.82
.7
2 .
24
.65
.64
.6
3 .
61
.79
.75
.7
0 .
78
.72
.71
_
R
esta
uran
t 23
.6
1 .
73
.73
.83
.6
8 .
12
.70
.67
.6
6 .
68
.71
.69
.7
7 .
83
.80
.68
.8
7
_
Res
taur
ant 2
4
.80
.71
.4
9 .
75
.45
.20
.5
2 .
83
.68
.69
.7
7 .
73
.63
.64
.4
6 .
57
.76
.71
_
R
esta
uran
t 25
.5
7 .
75
.64
.80
.6
4 .
05
.59
.66
.6
0 .
71
.66
.80
.6
4 .
71
.60
.65
.8
3 .
79
.77
_
Res
taur
ant 2
7
.64
.61
.5
8 .
63
.49
.19
.5
9 .
61
.61
.75
.7
4 .
63
.62
.73
.5
3 .
57
.69
.73
.7
7 6
8
_
Res
taur
ant 2
8
.50
.68
.6
6 .
81
.78
.20
.7
1 .
63
.69
.71
.7
1 .
61
.70
.85
.7
6 .
79
.83
.85
.6
5 7
9 .
70
_
Res
taur
ant 2
9
.41
.68
.8
4 .
69
.75
.25
.6
5 .
49
.61
.46
.6
5 .
58
.71
.79
.8
4 .
70
.80
.83
.4
9 .6
2 .
60
.75
_
Res
taur
ant 3
0
.63
.72
.5
7 .
72
.55
.03
.6
1 .
75
.56
.72
.6
8 .
70
.57
.71
.5
8 .
60
.78
.87
.7
8 7
7 .
72
.78
.61
_
R
esta
uran
t 31
.5
7 .
78
.78
.77
.6
9 .
23
.70
.69
.6
9 .
66
.72
.68
.7
6 .
83
.78
.69
.7
9 .
86
.67
.76
.68
.8
1 .
83 .
77
_
Res
taur
ant 3
2
.74
.75
.7
0 .
73
.57
.28
.5
8 .
79
.73
.59
.6
9 .
62
.77
.85
.7
4 .
64
.79
.79
.8
0 .7
2 .
77
.79
.71
.71
.8
1 _
R
esta
uran
t 33
.7
0 .
76
.78
.76
.6
6 .
24
.63
.67
.6
0 .
68
.78
.72
.7
7 .
76
.68
.60
.8
4 .
83
.75
.75
.77
.7
7 .
71 .
76
.82
.80
_
Cor
rela
tions
gre
ater
than
.45
are
sign
ific
ant a
t the
0.0
1 le
vel a
nd th
ose
grea
ter t
han
.34
are
sign
ific
ant a
t the
0.0
5 le
vel (
2-ta
iled)
.
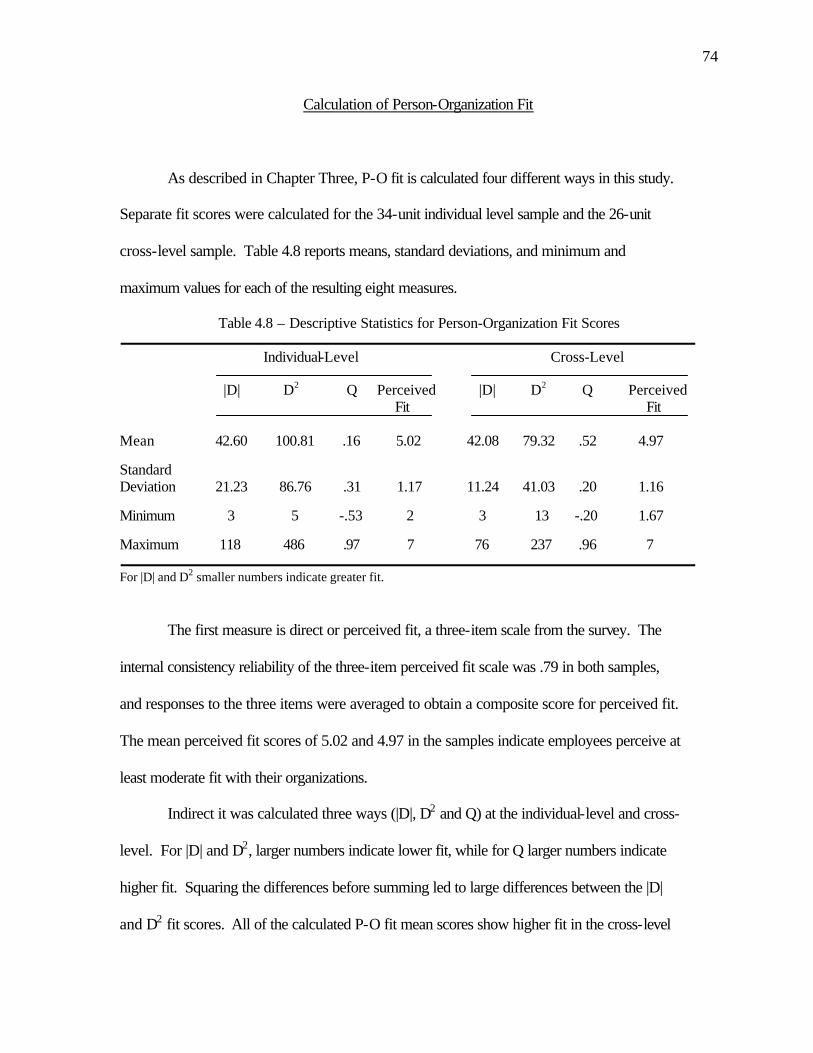
74
Calculation of Person-Organization Fit
As described in Chapter Three, P-O fit is calculated four different ways in this study.
Separate fit scores were calculated for the 34-unit individual level sample and the 26-unit
cross-level sample. Table 4.8 reports means, standard deviations, and minimum and
maximum values for each of the resulting eight measures.
Table 4.8 – Descriptive Statistics for Person-Organization Fit Scores
Individual-Level Cross-Level
|D| D2 Q Perceived |D| D2 Q Perceived Fit Fit Mean 42.60 100.81 .16 5.02 42.08 79.32 .52 4.97 Standard Deviation 21.23 86.76 .31 1.17 11.24 41.03 .20 1.16 Minimum 3 5 -.53 2 3 13 -.20 1.67 Maximum 118 486 .97 7 76 237 .96 7 For |D| and D2 smaller numbers indicate greater fit.
The first measure is direct or perceived fit, a three-item scale from the survey. The
internal consistency reliability of the three-item perceived fit scale was .79 in both samples,
and responses to the three items were averaged to obtain a composite score for perceived fit.
The mean perceived fit scores of 5.02 and 4.97 in the samples indicate employees perceive at
least moderate fit with their organizations.
Indirect it was calculated three ways (|D|, D2 and Q) at the individual-level and cross-
level. For |D| and D2, larger numbers indicate lower fit, while for Q larger numbers indicate
higher fit. Squaring the differences before summing led to large differences between the |D|
and D2 fit scores. All of the calculated P-O fit mean scores show higher fit in the cross-level
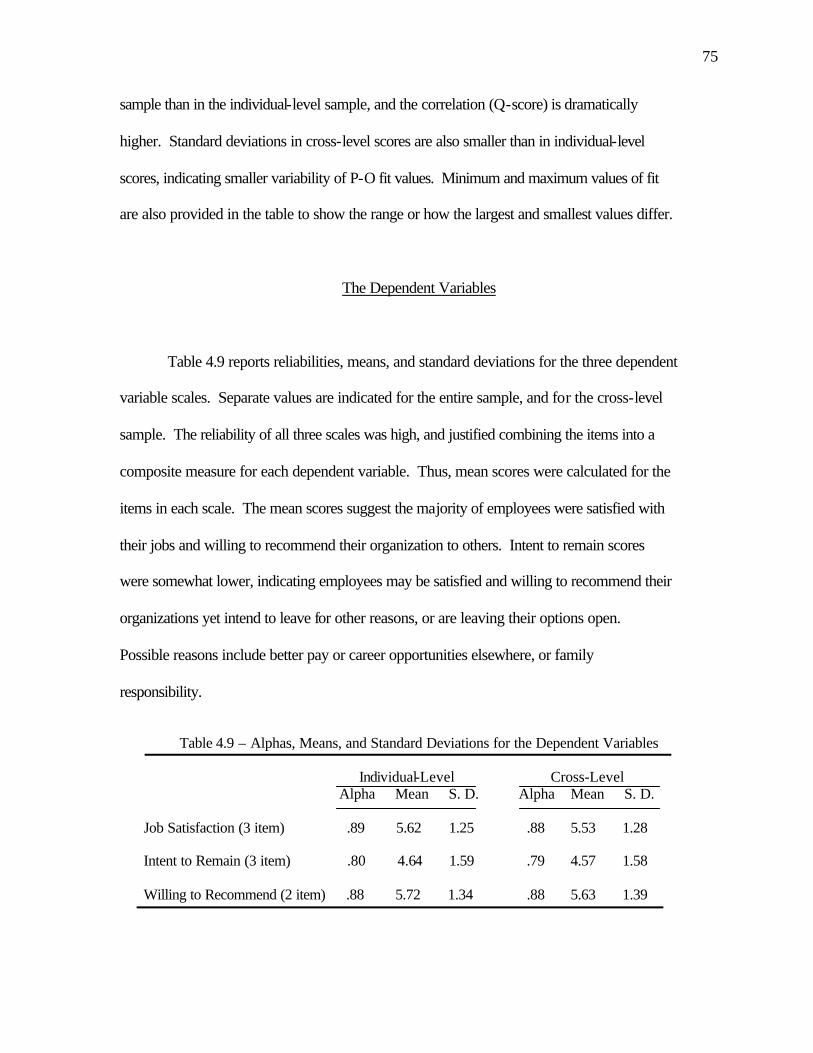
75
sample than in the individual-level sample, and the correlation (Q-score) is dramatically
higher. Standard deviations in cross-level scores are also smaller than in individual-level
scores, indicating smaller variability of P-O fit values. Minimum and maximum values of fit
are also provided in the table to show the range or how the largest and smallest values differ.
The Dependent Variables
Table 4.9 reports reliabilities, means, and standard deviations for the three dependent
variable scales. Separate values are indicated for the entire sample, and for the cross-level
sample. The reliability of all three scales was high, and justified combining the items into a
composite measure for each dependent variable. Thus, mean scores were calculated for the
items in each scale. The mean scores suggest the majority of employees were satisfied with
their jobs and willing to recommend their organization to others. Intent to remain scores
were somewhat lower, indicating employees may be satisfied and willing to recommend their
organizations yet intend to leave for other reasons, or are leaving their options open.
Possible reasons include better pay or career opportunities elsewhere, or family
responsibility.
Table 4.9 – Alphas, Means, and Standard Deviations for the Dependent Variables
Individual-Level Cross-Level Alpha Mean S. D. Alpha Mean S. D.
Job Satisfaction (3 item) .89 5.62 1.25 .88 5.53 1.28 Intent to Remain (3 item) .80 4.64 1.59 .79 4.57 1.58 Willing to Recommend (2 item) .88 5.72 1.34 .88 5.63 1.39
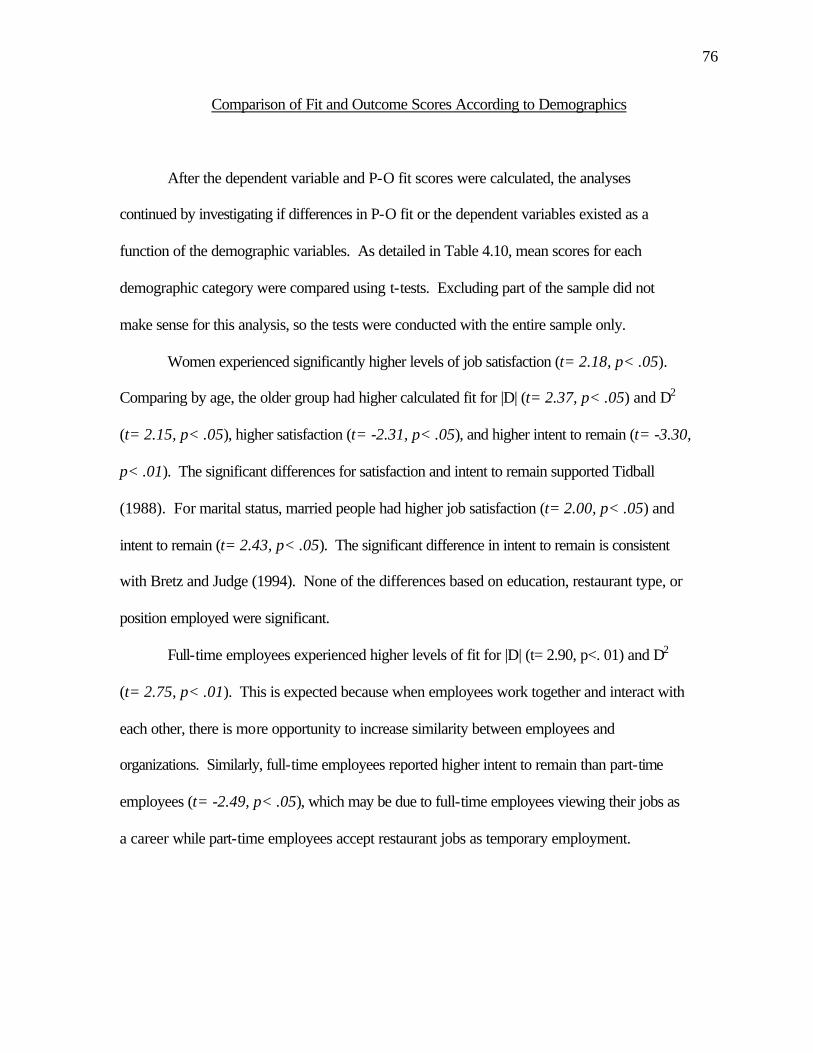
76
Comparison of Fit and Outcome Scores According to Demographics
After the dependent variable and P-O fit scores were calculated, the analyses
continued by investigating if differences in P-O fit or the dependent variables existed as a
function of the demographic variables. As detailed in Table 4.10, mean scores for each
demographic category were compared using t-tests. Excluding part of the sample did not
make sense for this analysis, so the tests were conducted with the entire sample only.
Women experienced significantly higher levels of job satisfaction (t= 2.18, p< .05).
Comparing by age, the older group had higher calculated fit for |D| (t= 2.37, p< .05) and D2
(t= 2.15, p< .05), higher satisfaction (t= -2.31, p< .05), and higher intent to remain (t= -3.30,
p< .01). The significant differences for satisfaction and intent to remain supported Tidball
(1988). For marital status, married people had higher job satisfaction (t= 2.00, p< .05) and
intent to remain (t= 2.43, p< .05). The significant difference in intent to remain is consistent
with Bretz and Judge (1994). None of the differences based on education, restaurant type, or
position employed were significant.
Full-time employees experienced higher levels of fit for |D| (t= 2.90, p<. 01) and D2
(t= 2.75, p< .01). This is expected because when employees work together and interact with
each other, there is more opportunity to increase similarity between employees and
organizations. Similarly, full-time employees reported higher intent to remain than part-time
employees (t= -2.49, p< .05), which may be due to full-time employees viewing their jobs as
a career while part-time employees accept restaurant jobs as temporary employment.
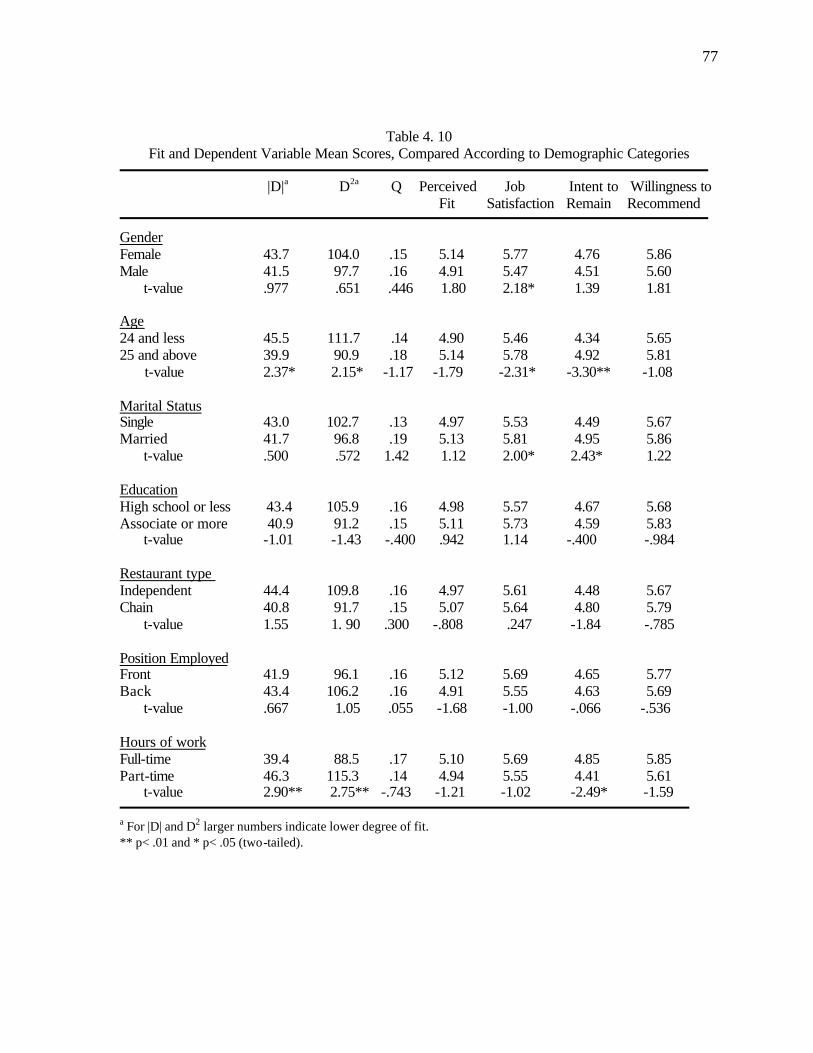
77
Table 4. 10 Fit and Dependent Variable Mean Scores, Compared According to Demographic Categories
|D|a D2a Q Perceived Job Intent to Willingness to Fit Satisfaction Remain Recommend Gender Female 43.7 104.0 .15 5.14 5.77 4.76 5.86 Male 41.5 97.7 .16 4.91 5.47 4.51 5.60
t-value .977 .651 .446 1.80 2.18* 1.39 1.81 Age 24 and less 45.5 111.7 .14 4.90 5.46 4.34 5.65 25 and above 39.9 90.9 .18 5.14 5.78 4.92 5.81 t-value 2.37* 2.15* -1.17 -1.79 -2.31* -3.30** -1.08 Marital Status Single 43.0 102.7 .13 4.97 5.53 4.49 5.67 Married 41.7 96.8 .19 5.13 5.81 4.95 5.86
t-value .500 .572 1.42 1.12 2.00* 2.43* 1.22 Education High school or less 43.4 105.9 .16 4.98 5.57 4.67 5.68 Associate or more 40.9 91.2 .15 5.11 5.73 4.59 5.83
t-value -1.01 -1.43 -.400 .942 1.14 -.400 -.984 Restaurant type Independent 44.4 109.8 .16 4.97 5.61 4.48 5.67 Chain 40.8 91.7 .15 5.07 5.64 4.80 5.79
t-value 1.55 1. 90 .300 -.808 .247 -1.84 -.785 Position Employed Front 41.9 96.1 .16 5.12 5.69 4.65 5.77 Back 43.4 106.2 .16 4.91 5.55 4.63 5.69
t-value .667 1.05 .055 -1.68 -1.00 -.066 -.536 Hours of work Full-time 39.4 88.5 .17 5.10 5.69 4.85 5.85 Part-time 46.3 115.3 .14 4.94 5.55 4.41 5.61
t-value 2.90** 2.75** -.743 -1.21 -1.02 -2.49* -1.59 a For |D| and D2 larger numbers indicate lower degree of fit. ** p< .01 and * p< .05 (two-tailed).

78
Relationships Among Variables in the Study
To begin detailing relationships of the P-O fit scores with one another and with other
variables, correlation matrices of all twenty-nine variables at the individual level (Table 4.11)
and cross-level (Table 4.12) are provided. Because all independent variables in regression
analysis (including demographics) are intercorrelated to some extent, the correlation matrix
allows one to see relationships among variables and interpret the regression results
accordingly (Pedhazur, 1997; Tabachnick & Fidell, 1996).
Measures of correlation indicate both the strength and the direction of the relationship
between variables. For example, as can be seen in Table 4.11, job satisfaction and
willingness to recommend are highly and positively correlated (.78). That is, high values on
job satisfaction are associated with high values on willingness to recommend. Because larger
|D| and D2 values indicate a lower degree of fit, however, the relationships between these two
measures and the other variables are interpreted in reverse in both levels of analyses. For
example, the -.41 correlation between |D| and job satisfaction is actually a positive
association.
Relationships Among Person-Organization Fit Scores
Of particular interest in this study were the relationships among the different measures of P-
O fit, which are shown in Tables 4.11 and 4.12. Since |D| and D2 are derivations of the same
numbers, the correlation between them is quite high at the individual (.96) and cross (.82)
levels. P-O fit calculated by the Q method had relatively low correlation with |D| and D2 in
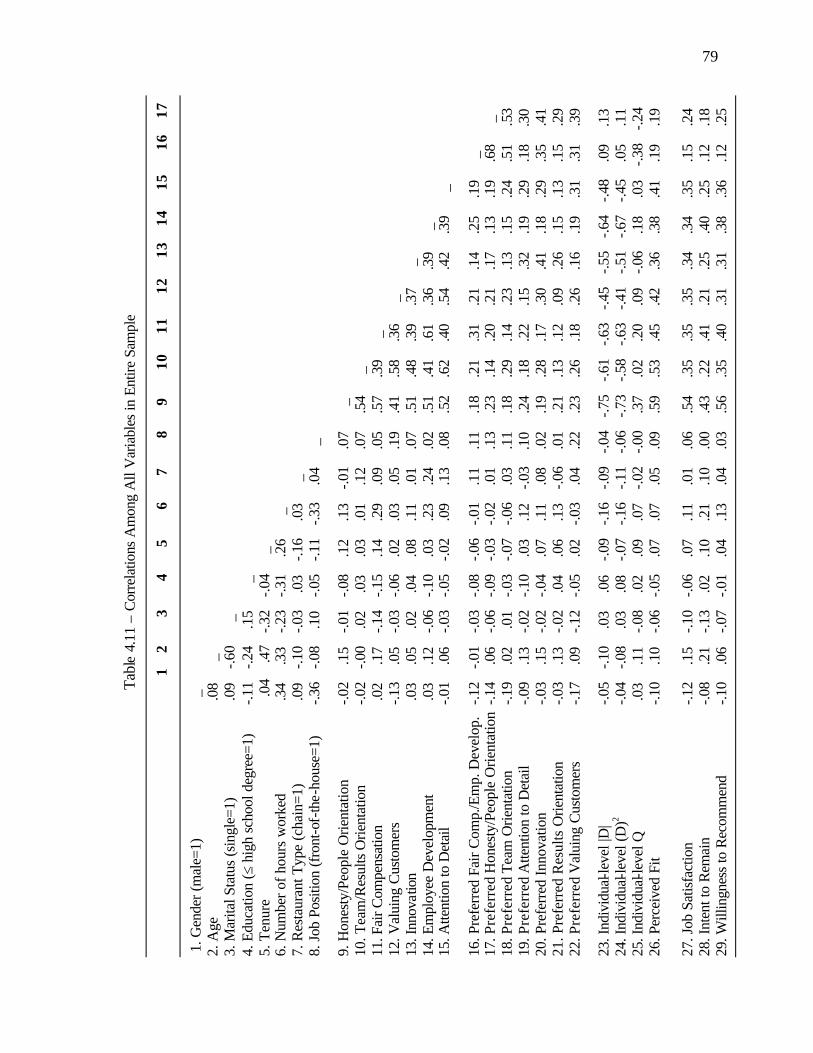
79
Ta
ble
4.11
– C
orre
latio
ns A
mon
g A
ll V
aria
bles
in E
ntire
Sam
ple
1
2
3
4
5
6
7
8
9
10
11
12
1
3
14
15
16
1
7
1. G
ende
r (m
ale=
1)
_
2.
Age
.08
_
3. M
arita
l Sta
tus
(sin
gle=
1)
.0
9
-.60
_
4.
Edu
catio
n (≤
hig
h sc
hool
deg
ree=
1)
-.1
1
-.24
.1
5
_
5. T
enur
e
.
04
.47
-.32
-.04
_
6.
Num
ber o
f hou
rs w
orke
d
.34
.33
-.23
-.31
.26
_
7.
Res
taur
ant T
ype
(cha
in=1
)
.0
9 -.1
0 -.0
3 .0
3 -.1
6 .0
3 _
8.
Job
Pos
ition
(fro
nt-o
f-th
e-ho
use=
1)
-.3
6 -.0
8 .1
0 -.0
5 -.1
1 -.3
3 .0
4 _
9.
Hon
esty
/Peo
ple
Orie
ntat
ion
-.02
.15
-.01
-.08
.12
.13
-.01
.07
_
10
. Tea
m/R
esul
ts O
rient
atio
n
-.0
2 -.0
0 .0
2 .0
3 .0
3 .0
1 .1
2 .0
7 .5
4 _
11
. Fai
r Com
pens
atio
n
.02
.17
-.14
-.15
.14
.29
.09
.05
.57
.39
_
12
. Val
uing
Cus
tom
ers
-.13
.05
-.03
-.06
.02
.03
.05
.19
.41
.58
.36
_
13. I
nnov
atio
n
.03
.05
.02
.04
.08
.11
.01
.07
.51
.48
.39
.37
_
14
. Em
ploy
ee D
evel
opm
ent
.0
3 .1
2 -.0
6 -.1
0 .0
3 .2
3 .2
4 .0
2 .5
1 .4
1 .6
1 .3
6 .3
9 _
15
. Atte
ntio
n to
Det
ail
-.01
.06
-.03
-.05
-.02
.09
.13
.08
.52
.62
.40
.54
.42
.39
_
16
. Pre
ferr
ed F
air C
omp.
/Em
p. D
evel
op.
-.12
-.01
-.03
-.08
-.06
-.01
.11
.11
.18
.21
.31
.21
.14
.25
.19
_
17. P
refe
rred
Hon
esty
/Peo
ple
Orie
ntat
ion
-.14
.06
-.06
-.09
-.03
-.02
.01
.13
.23
.14
.20
.21
.17
.13
.19
.68
_
18. P
refe
rred
Tea
m O
rient
atio
n
-.1
9 .0
2 .0
1 -.0
3 -.0
7 -.0
6 .0
3 .1
1 .1
8 .2
9 .1
4 .2
3 .1
3
.15
.24
.5
1 .5
3 19
. Pre
ferr
ed A
ttent
ion
to D
etai
l
-.09
.13
-.02
-.10
.03
.12
-.03
.10
.2
4 .1
8 .2
2 .1
5 .3
2 .1
9 .2
9 .1
8 .3
0
20. P
refe
rred
Inno
vatio
n
-.0
3 .1
5 -.0
2 -.0
4 .0
7 .1
1 .0
8 .0
2 .1
9 .2
8 .1
7 .3
0 .4
1 .1
8 .2
9 .3
5 .4
1
21. P
refe
rred
Res
ults
Orie
ntat
ion
-.0
3 .1
3 -.0
2 .0
4 .0
6 .1
3 -.0
6 .0
1 .2
1 .1
3 .1
2 .0
9 .2
6 .1
5 .1
3 .1
5 .2
9
22. P
refe
rred
Val
uing
Cus
tom
ers
-.1
7 .0
9 -.1
2 -.0
5 .0
2 -.0
3 .0
4 .2
2 .2
3 .2
6 .1
8 .2
6 .1
6 .1
9 .3
1 .3
1 .3
9
23. I
ndiv
idua
l-lev
el |D
|
-.0
5 -.1
0 .0
3 .0
6 -.0
9 -.1
6 -.0
9 -.0
4 -.7
5 -.6
1 -.6
3 -.4
5 -.5
5 -.6
4 -.4
8 .0
9 .1
3
24. I
ndiv
idua
l-lev
el (D
)2
-.0
4 -.0
8 .0
3 .0
8 -.0
7 -.1
6 -.1
1 -.0
6 -.7
3 -.5
8 -.6
3 -.4
1 -.5
1 -.6
7 -.4
5 .0
5 .1
1
25. I
ndiv
idua
l-lev
el Q
.0
3 .1
1 -.0
8 .0
2 .0
9 .0
7 -.0
2 -.0
0 .3
7 .0
2 .2
0 .0
9 -.0
6 .1
8 .0
3 -.3
8 -.2
4 26
. Per
ceiv
ed F
it
-.10
.10
-.06
-.05
.07
.07
.05
.09
.59
.53
.45
.42
.36
.38
.41
.19
.19
27
. Job
Sat
isfa
ctio
n
-.1
2 .1
5 -.1
0 -.0
6 .0
7 .1
1 .0
1 .0
6 .5
4 .3
5 .3
5 .3
5 .3
4 .3
4 .3
5 .1
5 .2
4 28
. Int
ent t
o R
emai
n
-.0
8 .2
1 -.1
3 .0
2 .1
0 .2
1 .1
0 .0
0 .4
3 .2
2 .4
1 .2
1 .2
5 .4
0 .2
5 .1
2 .1
8 29
. Will
ingn
ess
to R
ecom
men
d
-.10
.06
-.07
-.01
.04
.13
.04
.03
.56
.35
.40
.31
.31
.38
.36
.12
.25
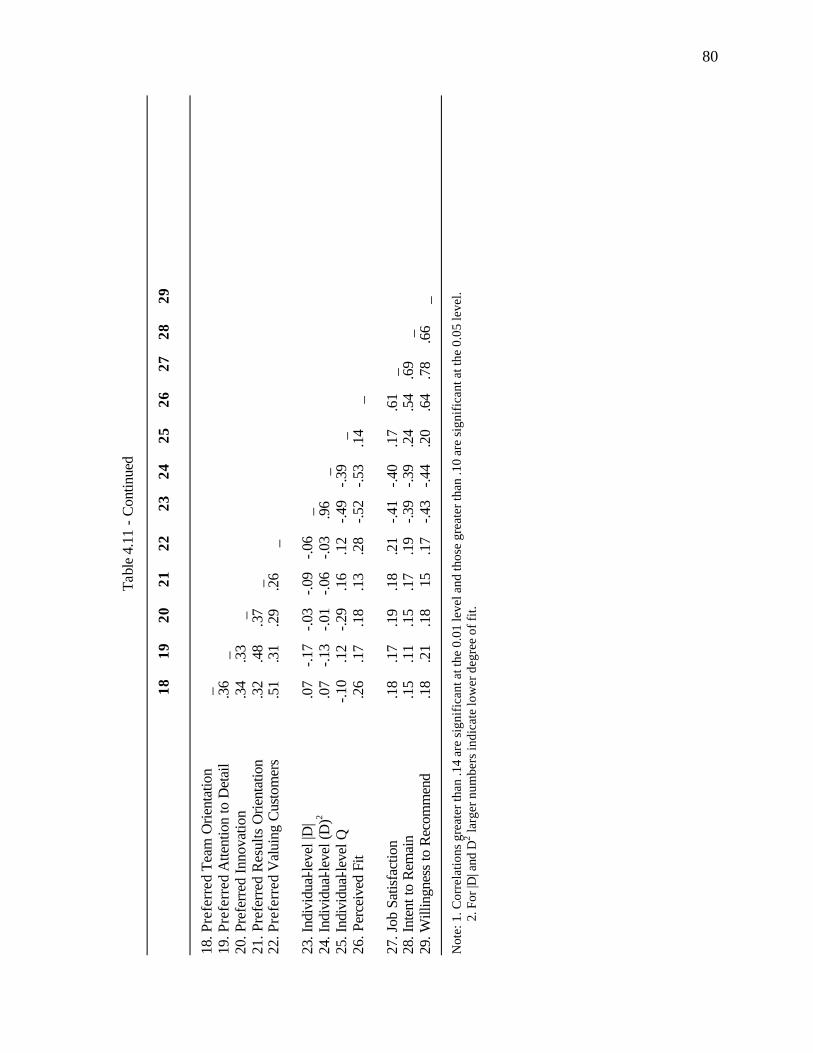
80
Tabl
e 4.
11 -
Con
tinue
d
18
19
20
21
22
23
2
4 2
5 2
6 2
7 2
8 2
9
18. P
refe
rred
Tea
m O
rient
atio
n
_
19
. Pre
ferr
ed A
ttent
ion
to D
etai
l
.36
_
20. P
refe
rred
Inno
vatio
n
.3
4 .3
3
_ 21
. Pre
ferr
ed R
esul
ts O
rient
atio
n
.32
.48
.37
_
22. P
refe
rred
Val
uing
Cus
tom
ers
.5
1 .3
1 .2
9 .2
6
_ 23
. Ind
ivid
ual-l
evel
|D|
.0
7 -.1
7 -.0
3 -.0
9 -.0
6 _
24
. Ind
ivid
ual-l
evel
(D)2
.07
-.13
-.01
-.06
-.03
.96
_
25. I
ndiv
idua
l-lev
el Q
-.10
.12
-.29
.16
.12
-.49
-.39
_
26. P
erce
ived
Fit
.26
.17
.18
.13
.28
-.52
-.53
.14
_
27
. Job
Sat
isfa
ctio
n
.18
.17
.19
.18
.21
-.41
-.40
.17
.61
_
28. I
nten
t to
Rem
ain
.1
5 .1
1 .1
5 .1
7 .1
9 -.3
9 -.3
9 .2
4 .5
4 .6
9
_
29. W
illin
gnes
s to
Rec
omm
end
.1
8 .2
1 .1
8 1
5 .1
7 -.4
3 -.4
4 .2
0 .6
4 .7
8 .6
6 _
Not
e: 1
. Cor
rela
tions
gre
ater
than
.14
are
sign
ific
ant a
t the
0.0
1 le
vel a
nd th
ose
grea
ter t
han
.10
are
sign
ific
ant a
t the
0.0
5 le
vel.
2. F
or |D
| and
D2 la
rger
num
bers
indi
cate
low
er d
egre
e of
fit.
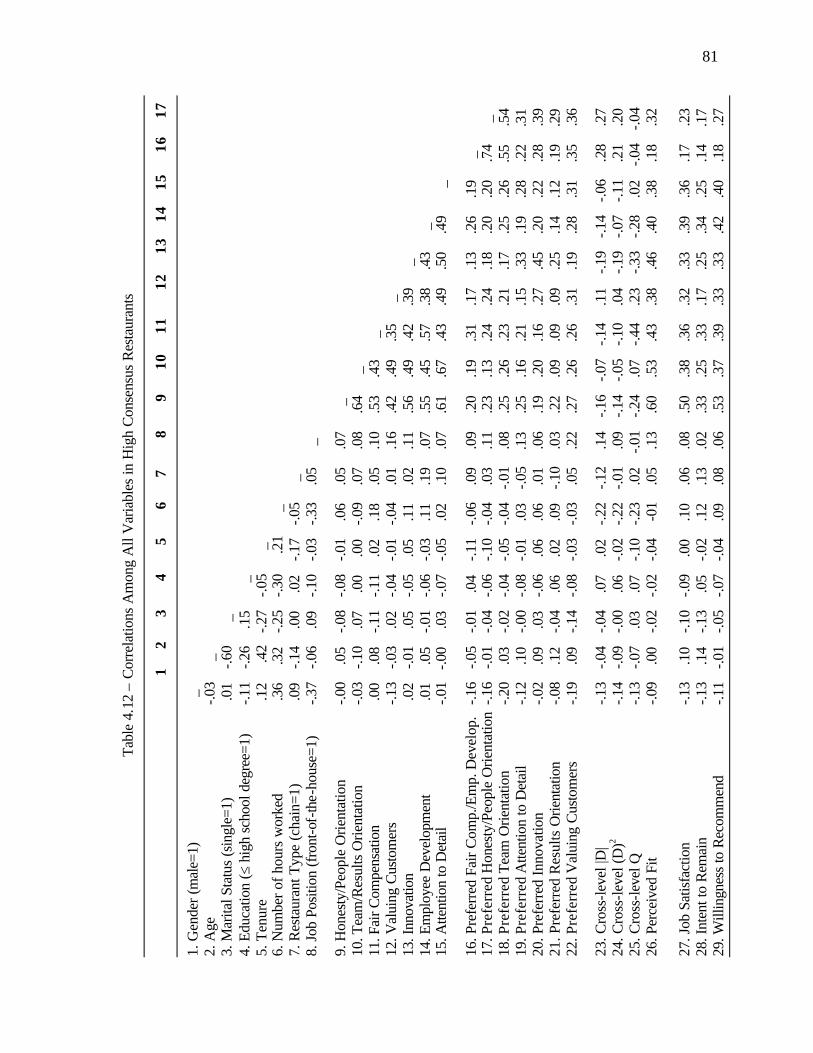
81
Tabl
e 4.
12 –
Cor
rela
tions
Am
ong
All
Var
iabl
es in
Hig
h C
onse
nsus
Res
taur
ants
1
2
3
4
5
6
7
8
9
10
11
12
1
3
14
15
16
1
7
1. G
ende
r (m
ale=
1)
_
2.
Age
-.03
_
3. M
arita
l Sta
tus
(sin
gle=
1)
.0
1
-.60
_
4.
Edu
catio
n (≤
hig
h sc
hool
deg
ree=
1)
-.1
1
-.26
.1
5
_
5. T
enur
e
.1
2
.42
-.27
-.05
_
6.
Num
ber o
f hou
rs w
orke
d
.36
.32
-.25
-.30
.2
1
_
7. R
esta
uran
t Typ
e (c
hain
=1)
.09
-.14
.00
.02
-.17
-.05
_
8. J
ob P
ositi
on (f
ront
-of-
the-
hous
e=1)
-.37
-.06
.09
-.10
-.03
-.33
.05
_
9. H
ones
ty/P
eopl
e O
rient
atio
n
-.0
0 .0
5 -.0
8 -.0
8 -.0
1 .0
6 .0
5 .0
7
_
10. T
eam
/Res
ults
Orie
ntat
ion
-.03
-.10
.07
.00
.00
-.09
.07
.08
.64
_
11. F
air C
ompe
nsat
ion
.0
0 .0
8 -.1
1 -.1
1 .0
2 .1
8 .0
5 .1
0 .5
3 .4
3 _
12. V
alui
ng C
usto
mer
s
-.1
3 -.0
3 .0
2 -.0
4 -.0
1 -.0
4 .0
1 .1
6 .4
2 .4
9 .3
5 _
13
. Inn
ovat
ion
.0
2 -.0
1 .0
5 -.0
5 .0
5 .1
1 .0
2 .1
1 .5
6 .4
9 .4
2 .3
9 _
14. E
mpl
oyee
Dev
elop
men
t
.01
.05
-.01
-.06
-.03
.11
.19
.07
.55
.45
.57
.38
.43
_
15. A
ttent
ion
to D
etai
l
-.0
1 -
.00
.03
-.07
-.05
.02
.10
.07
.61
.67
.43
.49
.50
.49
_
16. P
refe
rred
Fai
r Com
p./E
mp.
Dev
elop
. -.1
6 -.0
5 -.0
1 .0
4 -.1
1 -.0
6 .0
9 .0
9 .2
0 .1
9 .3
1 .1
7 .1
3 .2
6 .1
9 _
17
. Pre
ferr
ed H
ones
ty/P
eopl
e O
rient
atio
n -.1
6 -.0
1 -.0
4 -.0
6 -.1
0 -.0
4 .0
3 .1
1 .2
3 .1
3 .2
4 .2
4 .1
8 .2
0 .2
0 .7
4 _
18
. Pre
ferr
ed T
eam
Orie
ntat
ion
-.20
.03
-.02
-.04
-.05
-.04
-.01
.08
.25
.26
.23
.21
.1
7 .2
5 .2
6
.55
.5
4 19
. Pre
ferr
ed A
ttent
ion
to D
etai
l
-.12
.10
-.00
-.08
-.01
.03
-.05
.13
.2
5 .1
6 .2
1 .1
5 .3
3 .1
9 .2
8 .2
2 .3
1
20. P
refe
rred
Inno
vatio
n
-.0
2 .0
9 .0
3 -.0
6 .0
6 .0
6 .0
1 .0
6 .1
9 .2
0 .1
6 .2
7 .4
5 .2
0 .2
2 .2
8 .3
9
21. P
refe
rred
Res
ults
Orie
ntat
ion
-.0
8 .1
2 -.0
4 .0
6 .0
2 .0
9 -.1
0 .0
3 .2
2 .0
9 .0
9 .0
9 .2
5 .1
4 .1
2 .1
9 .2
9
22. P
refe
rred
Val
uing
Cus
tom
ers
-.1
9 .0
9 -.1
4 -.0
8 -.0
3 -.0
3 .0
5 .2
2 .2
7 .2
6 .2
6 .3
1 .1
9 .2
8 .3
1 .3
5 .3
6
23. C
ross
-lev
el |D
|
-.1
3 -.0
4 -.0
4 .0
7 .0
2 -.2
2 -.1
2 .1
4 -.1
6 -.0
7 -.1
4 .1
1 -.1
9 -.1
4 -.0
6 .2
8 .2
7
24. C
ross
-lev
el (D
)2
-.1
4 -.0
9 -.0
0 .0
6 -.0
2 -.2
2 -.0
1 .0
9 -.1
4 -.0
5 -.1
0 .0
4 -.1
9 -.0
7 -.1
1 .2
1 .2
0
25. C
ross
-leve
l Q
-.1
3 -.0
7 .0
3 .0
7 -.1
0 -.2
3 .0
2 -.0
1 -.2
4 .0
7 -.4
4 .2
3 -.3
3 -.2
8 .0
2 -.0
4 -.0
4 26
. Per
ceiv
ed F
it
-.0
9 .0
0 -.0
2 -.0
2 -.0
4 -
01
.05
.13
.60
.53
.43
.38
.46
.40
.38
.18
.32
27. J
ob S
atis
fact
ion
-.13
.10
-.10
-.09
.00
.10
.06
.08
.50
.38
.36
.32
.33
.39
.36
.17
.23
28. I
nten
t to
Rem
ain
-.13
.14
-.13
.05
-.02
.12
.13
.02
.33
.25
.33
.17
.25
.34
.25
.14
.17
29. W
illin
gnes
s to
Rec
omm
end
-.1
1 -.0
1 -.0
5 -.0
7 -.0
4 .0
9 .0
8 .0
6 .5
3 .3
7 .3
9 .3
3 .3
3 .4
2 .4
0 .1
8 .2
7
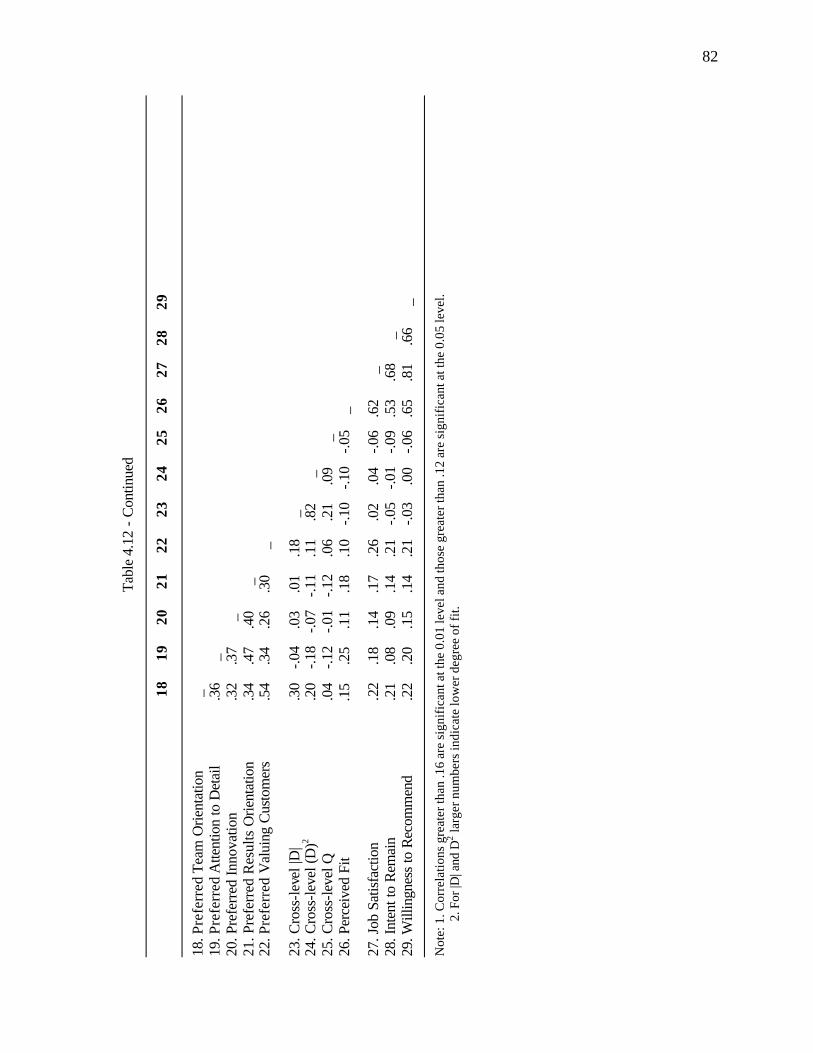
82
Tabl
e 4.
12 -
Con
tinue
d
18
19
20
21
22
23
24
25
26
27
28
29
18
. Pre
ferr
ed T
eam
Orie
ntat
ion
_
19. P
refe
rred
Atte
ntio
n to
Det
ail
.3
6 _
20
. Pre
ferr
ed In
nova
tion
.32
.37
_
21. P
refe
rred
Res
ults
Orie
ntat
ion
.3
4 .4
7 .4
0
_ 22
. Pre
ferr
ed V
alui
ng C
usto
mer
s
.54
.34
.26
.30
_
23. C
ross
-lev
el |D
|
.30
-.04
.03
.01
.18
_
24. C
ross
-lev
el (D
)2
.20
-.18
-.07
-.11
.11
.82
_
25. C
ross
-leve
l Q
.0
4 -.1
2 -.0
1 -.1
2 .0
6 .2
1 .0
9
_ 26
. Per
ceiv
ed F
it
.1
5
.25
.11
.18
.10
-.10
-.10
-.05
_
27. J
ob S
atis
fact
ion
.2
2 .1
8 .1
4 .1
7 .2
6 .0
2 .0
4 -.0
6 .6
2 _
28
. Int
ent t
o R
emai
n
.21
.08
.09
.14
.21
-.05
-.01
-.09
.53
.68
_
29
. Will
ingn
ess
to R
ecom
men
d
.22
.20
.15
.14
.21
-.03
.00
-.06
.65
.81
.66
_
Not
e: 1
. Cor
rela
tions
gre
ater
than
.16
are
sign
ific
ant a
t the
0.0
1 le
vel a
nd th
ose
grea
ter t
han
.12
are
sign
ific
ant a
t the
0.0
5 le
vel.
2.
For
|D| a
nd D
2 larg
er n
umbe
rs in
dica
te lo
wer
deg
ree
of fi
t.
83
both levels of analyses. The most likely reason for this is that respondents gave relatively
high scores to the preferred culture survey items, so the data were restricted in range (see
mean scores and standard deviations for preferred culture dimensions in Table 4.4).
Tabachnick and Fidell (1996) and Norusis (1999) claim a narrow range of scores on a
variable limits potential correlation with other variables. Thus, in this data set the Q method
did not provide meaningful information about P-O fit.
At the individual level, perceived fit correlated moderately with individual-level |D|
(r= .52, p< .01) and D2 (r= .53, p< .01), but less strongly with Q (r= .14, p< .05). Perceived
fit did not correlate significantly with the calculated fit measures at the cross-level, which is
inconsistent with other cross-level analyses. Cable and Judge (1996, 1997) found a limited
correlation between perceived fit and the Q measurement of calculated fit (r=.26, p< .01;
r=.25, p< .01 respectively) in cross-level analysis. Enz (1988) used the |D| method to
calculate P-O fit and found a correlation of .37 between perceived and calculated fit (p< .05)
in cross-level analysis. The inconsistency of individual-level and cross-level findings in this
study, and the inconsistency of this study’s cross-level finding with past research, indicate a
continuing question about the relationship of perceived and calculated fit, and further
research in both levels of analysis is needed.
Hierarchical Regression Analyses
The primary purpose of this study was to investigate the role of person-organization
fit in explaining employee job satisfaction, intent to quit, and willingness to recommend the
organization as a good place to work. Of particular interest was whether fit explained

84
variance beyond that explained by organizational culture and individual values. To assess
these relationships, hierarchical regression analyses were used to determine the contribution
of each independent variable over and above variables already entered in the equation.
Individual-level and cross-level relationships were assessed separately.
Individual-Level Hierarchical Regression Analysis
In this analysis, the independent variables were entered into regression analyses in
four steps to examine their effect on the three dependent variables. As Table 4.13 shows, the
independent variables in four steps were 1) demographics, 2) perceived culture factors,
3) preferred culture (or individual values) factors, and 4) P-O fit.
The demographic or control variables were entered into the equation first, as a set.
The first row in the table shows the variance explained (R2) in each of the three outcomes by
the entire set of demographic variables. Adjusted R square values are provided in
parenthesis. Because adding more independent variables to the model can only increase R2
and never reduce it, adjusted R2 controls for this effect by recognizing the number of
independent variables in the model (Hair et al., 1998; Norusis, 1999). Adjusted R2 thus
provides a more conservative estimate of variance explained. The beta for each individual
variable shows the significance and relative importance of that variable in the equation. As
perceived culture, preferred culture, and P-O fit are added, the row in the table shows the
total R2 to that point, the change in R2 as a result of that variable, and the F statistic showing
the significance of the change.

85
Table 4.13 – Individual-Level Hierarchical Regression Results for the Effects of Demographic Variables, Culture, Preferred Culture, and Person-Organization Fit on the Dependent Variables
Job Satisfaction Intent to Remain Willing to Recommend
Change Change Change Beta R2 R2 F Beta R2 R2 F Beta R2 R2 F Step 1: Demographics .05 (.03) .05 1.94* .11 (.09) .11 4.60** .04 (.02) .04 1.57 Gender (male=1) -.14* -.12 -.13* Age .10 .13* .11 Marital Status (single=1) .00 .05 .03 Education (≤ high=1) -.01 .14* -.02 Tenure .02 .01 -.02 Hours of work .13 .13* .08 Restaurant type (chain=1) .02 .09 .03 Job position (front=1) .04 .02 .06
Step 2: Perceived Culture .33 (.30) .28 17.59** .31 (.27) .20 11.73** .35 (.31) .31 19.4** Honesty/ People Orient .40** .18* .42** Team/Result Orient. .03 -.08 .01 Fair Compensation .00 .14 .07 Valuing customers .10 -.04 .03 Innovation .06 -.01 -.04 Employee Development .07 .13 .10 Attention to Detail .00 -.01 .03
Step 3: Preferred Culture .34 (.30) .01 .813 .33 (.27) .02 .019 .38 (.33) .03 1.93* Fair Comp./Emp. Devel. -.09 -.07 -.20* Honesty/People Orient. .13 .16* .22* Team Orientation .01 .02 .04 Attention to detail -.05 -.10 .03 Innovation -.01 .00 .04 Result Orientation .05 .07 -.02 Valuing customers .02 .05 -.04 Step 4: P-O Fit |D| .03 .34 (.29) .00 .063 -.13 .33 (.27) .00 .003 -.03 .38 (.33) .00 .044
D2 .00 .34 (.29) .00 .001 -.16 .33 (.27) .00 1.21 -.08 .38 (.33) .00 .463
Q .00 .34 (.29) .00 .013 .02 .33 (.27) .00 2.53 .13 .38 (.32) .00 .049
Perceived Fit .45** .45 (.41) .11 58.4** .43** .43 (.38) .10 51.5** .49** .51 (.47) .13 74.7**
Note: R2 values in parenthesis are adjusted R-square. N= 326; ** p< .01 and * p< .05.
86
For job satisfaction, demographics explained 5% of the variance (F=1.94, p< .05).
The beta coefficients indicate gender accounted for much of that 5%. Perceived
organizational culture explained an additional 28% (F=17.59, p< .01). In this case the
Honesty and People Orientation dimension (Beta= .40, p< .01) was largely responsible.
Preferred culture did not add significantly to the explanation of variance.
To determine if P-O fit contributed to explanation of satisfaction over and above that
explained by demographics, perceived culture, and preferred culture, fit was entered into the
equation last. Each of the four individual-level fit measures was entered and tested
separately. None of the three measures of indirect fit added to the variance explained,
but perceived fit explained an additional 11% of the variance (Beta= .45; F= 58.4,p< .01)
and increased the total variance explained in job satisfaction to 45% (41% for adjusted R-
square). This is much higher than the average 25% that organizational researchers explained
using single sets of variables (Agho et al., 1993).
For intent to remain, demographic variables explained 11% of the variance (F=4.60,
p< .01) indicative of the role that external influences play in retention. Older people, less
educated people, and those who worked more hours all expressed significantly higher
intention to remain. Perceived organizational culture explained an additional 20% of the
variance in intent to remain (F=11.73, p< .01). The factor dimension of Honesty and People
Orientation (Beta= .18, p< .05) was significant individually. This supports Sheridan (1992),
who found firms emphasizing “interpersonal relationship” values had lower turnover than
firms emphasizing “work task” values. Preferred culture dimensions did not add
significantly to the explanation of variance, and none of the indirect P-O fit calculation
methods explained additional variance. Perceived fit was again significant, contributing an
87
additional 10% to the variance explained (Beta= .43; F=51.5, p< .01). The total variance
explained in intent to remain is 43% (38% for adjusted R-square).
For willingness to recommend the organization to others, demographic variables
explained a nonsignificant 4% of the variance. Organizational culture explained an
additional 31% of the variance (F=19.4, p< .01), with Honesty and People Orientation
significant individually (Beta= .42, p< .01). Preferred culture added 3% to the explanation
of variance (F=1.93, p< .05); the Fair Compensation and Employee Development (Beta=
-.20, p<. 05) and Honesty and People Orientation (Beta= .22, p<. 05) factors were influential
here. The results indicated once again that none of the indirect P-O fit calculation methods
explained additional variance but that perceived fit was significant, contributing an additional
13% to the variance explained (Beta= .49; F=74.7, p< .01) and increasing the total variance
explained to a remarkable 51% (adjusted R-square 47%).
Following the model of Chatman (1991), the previous analysis assessed the predictive
value of fit beyond that explained by culture and preferred culture (values). Most fit
research, however, has assessed the role of fit without that constraint (Boxx et al., 1991;
Cable & Judge, 1996, 1997; Enz, 1988; Meglino et al., 1989; O’Reilly, 1991; Vandenberghe,
1999). To test such a model with this data, a separate regression analysis was conducted.
Demographic variables were entered first, and then each of the fit measures was entered and
tested.
As can be seen in Table 4.14, in this analysis all four measures of P-O fit contributed
significantly to the explanation of variance in all three independent variables. Among the
calculated fit measures, |D| and D2 were very similar in the variance they explained.
Correlation (Q) was also significant, but explained much less variance than the difference
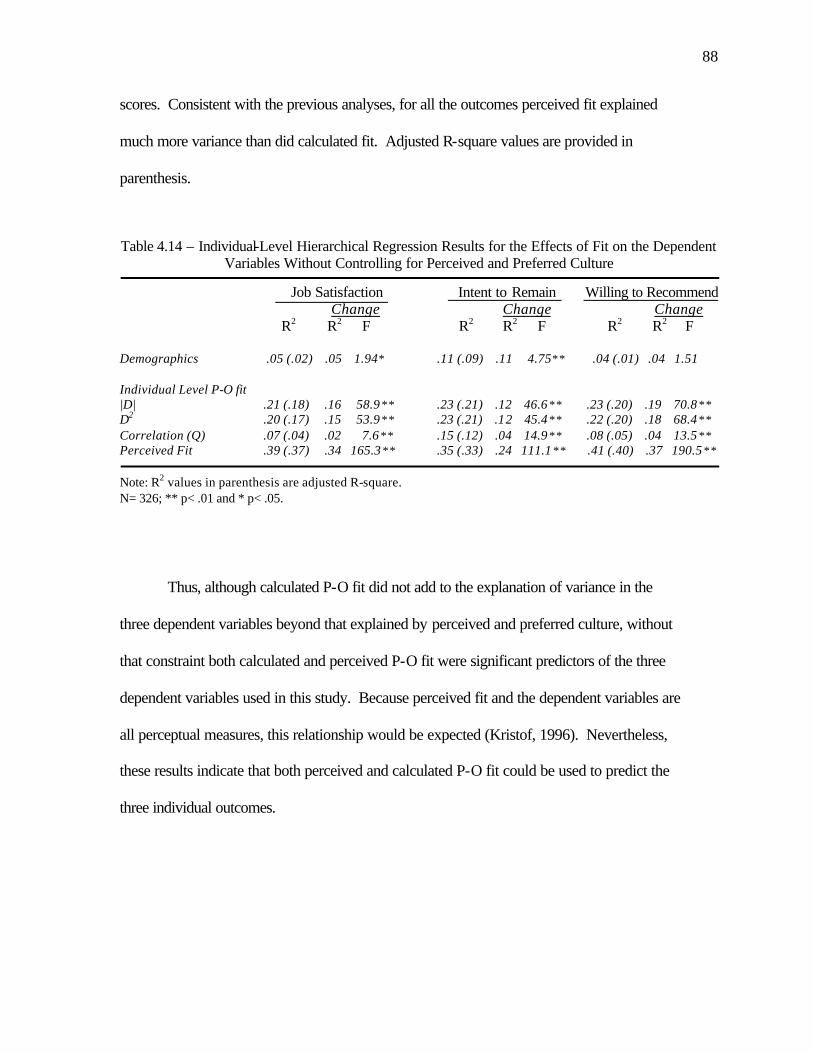
88
scores. Consistent with the previous analyses, for all the outcomes perceived fit explained
much more variance than did calculated fit. Adjusted R-square values are provided in
parenthesis.
Table 4.14 – Individual-Level Hierarchical Regression Results for the Effects of Fit on the Dependent
Variables Without Controlling for Perceived and Preferred Culture
Job Satisfaction Intent to Remain Willing to Recommend Change Change Change R2 R2 F R2 R2 F R2 R2 F Demographics .05 (.02) .05 1.94* .11 (.09) .11 4.75** .04 (.01) .04 1.51 Individual Level P-O fit |D| .21 (.18) .16 58.9** .23 (.21) .12 46.6** .23 (.20) .19 70.8** D2 .20 (.17) .15 53.9** .23 (.21) .12 45.4** .22 (.20) .18 68.4** Correlation (Q) .07 (.04) .02 7.6** .15 (.12) .04 14.9** .08 (.05) .04 13.5** Perceived Fit .39 (.37) .34 165.3** .35 (.33) .24 111.1** .41 (.40) .37 190.5** Note: R2 values in parenthesis are adjusted R-square. N= 326; ** p< .01 and * p< .05.
Thus, although calculated P-O fit did not add to the explanation of variance in the
three dependent variables beyond that explained by perceived and preferred culture, without
that constraint both calculated and perceived P-O fit were significant predictors of the three
dependent variables used in this study. Because perceived fit and the dependent variables are
all perceptual measures, this relationship would be expected (Kristof, 1996). Nevertheless,
these results indicate that both perceived and calculated P-O fit could be used to predict the
three individual outcomes.

89
Cross-Level Hierarchical Regression Analysis
The cross-level analyses, reported in Table 4.15, were conducted in the same way
that the individual-level analyses were done. The table format is the same, and adjusted R-
square values are again provided in parenthesis. For job satisfaction, demographics
explained a nonsignificant 6% of the variance. Perceived organizational culture explained an
additional 26% (F= 11.96, p< .01). The Honesty and People Orientation (Beta= .37, p< .01)
accounted for much of that 26%. Preferred culture did not add significantly to the
explanation of variance. As with the individual-level analysis, each of the four cross-level fit
measures was entered last and tested separately. P-O fit calculated as D2 (Beta= .14 p< .05)
added 1% to the variance explained (F=4.53, p< .05), but P-O fit calculated by |D| and Q did
not add to the variance explained. Perceived fit explained an additional 14% of the variance
(Beta= .51; F= 56.3, p< .01).
For intent to remain, demographic variables explained 10% of the variance (F=3.25,
p< .01). Women, older people, less educated people, those who worked more hours, and
these working in chain restaurants were all significantly more likely to remain. Perceived
organizational culture explained an additional 15% of the variance in intent to remain
(F=6.29, p< .01). The factor dimension of Honesty and People Orientation (Beta= .19,
p< .01) was significant individually. Preferred culture dimensions did not add significantly
to the explanation of variance. None of the three measures of calculated fit added to the
variance explained, but perceived fit explained an additional 13% of the variance (Beta= .48;
F= 45.3, p< .01).
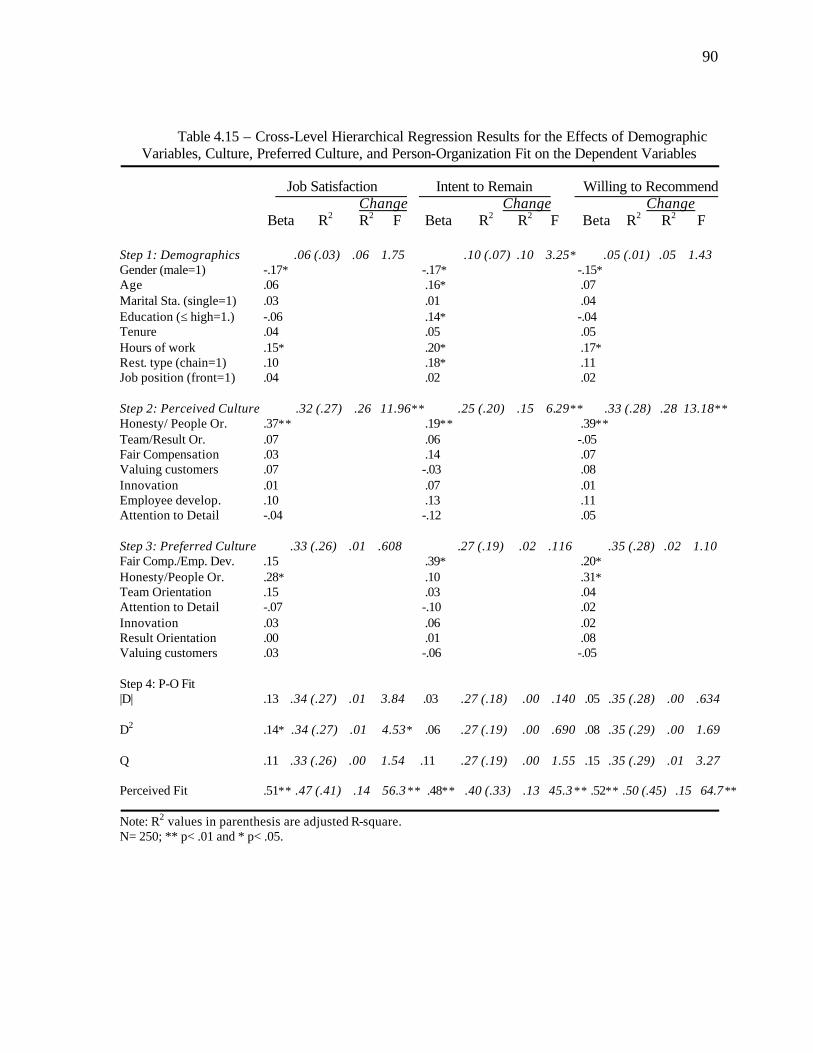
90
Table 4.15 – Cross-Level Hierarchical Regression Results for the Effects of Demographic Variables, Culture, Preferred Culture, and Person-Organization Fit on the Dependent Variables
Job Satisfaction Intent to Remain Willing to Recommend
Change Change Change Beta R2 R2 F Beta R2 R2 F Beta R2 R2 F Step 1: Demographics .06 (.03) .06 1.75 .10 (.07) .10 3.25* .05 (.01) .05 1.43 Gender (male=1) -.17* -.17* -.15* Age .06 .16* .07 Marital Sta. (single=1) .03 .01 .04 Education (≤ high=1.) -.06 .14* -.04 Tenure .04 .05 .05 Hours of work .15* .20* .17* Rest. type (chain=1) .10 .18* .11 Job position (front=1) .04 .02 .02
Step 2: Perceived Culture .32 (.27) .26 11.96** .25 (.20) .15 6.29** .33 (.28) .28 13.18** Honesty/ People Or. .37** .19** .39** Team/Result Or. .07 .06 -.05 Fair Compensation .03 .14 .07 Valuing customers .07 -.03 .08 Innovation .01 .07 .01 Employee develop. .10 .13 .11 Attention to Detail -.04 -.12 .05
Step 3: Preferred Culture .33 (.26) .01 .608 .27 (.19) .02 .116 .35 (.28) .02 1.10 Fair Comp./Emp. Dev. .15 .39* .20* Honesty/People Or. .28* .10 .31* Team Orientation .15 .03 .04 Attention to Detail -.07 -.10 .02 Innovation .03 .06 .02 Result Orientation .00 .01 .08 Valuing customers .03 -.06 -.05 Step 4: P-O Fit |D| .13 .34 (.27) .01 3.84 .03 .27 (.18) .00 .140 .05 .35 (.28) .00 .634 D2 .14* .34 (.27) .01 4.53* .06 .27 (.19) .00 .690 .08 .35 (.29) .00 1.69 Q .11 .33 (.26) .00 1.54 .11 .27 (.19) .00 1.55 .15 .35 (.29) .01 3.27
Perceived Fit .51** .47 (.41) .14 56.3** .48** .40 (.33) .13 45.3** .52** .50 (.45) .15 64.7** Note: R2 values in parenthesis are adjusted R-square. N= 250; ** p< .01 and * p< .05.
91
For willingness to recommend the organization, demographic variables explained a
nonsignificant 5% of the variance. Organizational culture explained an additional 28%
(F=13.18, p< .01), with Honesty and People Orientation (Beta= .39, p< .01) significant
individually. Perceived culture did not add significantly to the explanation of variance.
None of the three measures of calculated fit added to the variance explained on this criterion
variable. Again, perceived fit was a powerful predictor and explained an additional 15% of
the variance (Beta= .52; F= 64.7, p< .01).
The role of the individual factors comprising perceived and preferred culture is
noteworthy in these analyses. For perceived culture, despite the fact that factor analysis
identified seven factors, Honesty/People Orientation is the only one that emerges with a
significant Beta in the regression analysis, in the individual level or cross level analyses, for
any of the three outcomes. Thus, although perceived culture may be multifaceted, only one
facet is significantly related to the dependent variables. These findings suggest that the
essence of this factor—caring about employees and telling them the truth—is critical if
management is to enhance job satisfaction, intent to remain, and willingness to recommend
the organization.
Among preferred culture factors, two were significant. Honesty/People Orientation
was again the primary individual predictor, but the combined Fair Compensation/Employee
Development factor also demonstrated a significant Beta for willingness to recommend at the
individual level and for intent to remain at the cross level. These findings provide further
evidence that focusing on external customers may benefit revenue, but that maximizing
individual level employee outcomes requires attention to these internal customer issues, as
well.
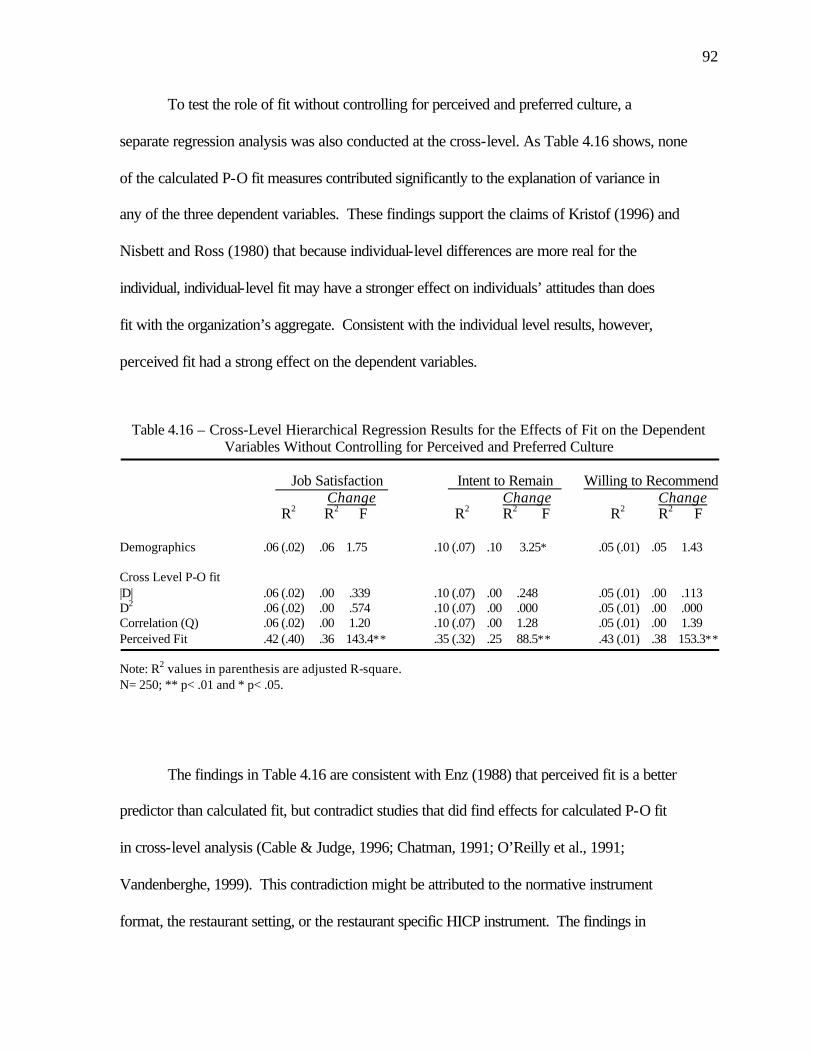
92
To test the role of fit without controlling for perceived and preferred culture, a
separate regression analysis was also conducted at the cross-level. As Table 4.16 shows, none
of the calculated P-O fit measures contributed significantly to the explanation of variance in
any of the three dependent variables. These findings support the claims of Kristof (1996) and
Nisbett and Ross (1980) that because individual-level differences are more real for the
individual, individual-level fit may have a stronger effect on individuals’ attitudes than does
fit with the organization’s aggregate. Consistent with the individual level results, however,
perceived fit had a strong effect on the dependent variables.
Table 4.16 – Cross-Level Hierarchical Regression Results for the Effects of Fit on the Dependent Variables Without Controlling for Perceived and Preferred Culture
Job Satisfaction Intent to Remain Willing to Recommend
Change Change Change R2 R2 F R2 R2 F R2 R2 F Demographics .06 (.02) .06 1.75 .10 (.07) .10 3.25* .05 (.01) .05 1.43 Cross Level P-O fit |D| .06 (.02) .00 .339 .10 (.07) .00 .248 .05 (.01) .00 .113 D2 .06 (.02) .00 .574 .10 (.07) .00 .000 .05 (.01) .00 .000 Correlation (Q) .06 (.02) .00 1.20 .10 (.07) .00 1.28 .05 (.01) .00 1.39 Perceived Fit .42 (.40) .36 143.4** .35 (.32) .25 88.5** .43 (.01) .38 153.3**
Note: R2 values in parenthesis are adjusted R-square. N= 250; ** p< .01 and * p< .05.
The findings in Table 4.16 are consistent with Enz (1988) that perceived fit is a better
predictor than calculated fit, but contradict studies that did find effects for calculated P-O fit
in cross-level analysis (Cable & Judge, 1996; Chatman, 1991; O’Reilly et al., 1991;
Vandenberghe, 1999). This contradiction might be attributed to the normative instrument
format, the restaurant setting, or the restaurant specific HICP instrument. The findings in
93
Table 4.16 seem surprising because calculated P-O fit measured by D2 did contribute
additional explanation in analysis shown in the Table 4.15. Given the meager change,
however, the 1% increase in job satisfaction and in the cross-level hierarchical regression
may have been an anomaly rather than a meaningful effect.
Thus, only perceived fit contributed significantly to the explanation of outcome
variance beyond that explained by organizational culture and individual values. However, as
Kristof (1996) and Edwards (1993, 1994) pointed out, because the perceived fit scale does
not explicitly describe what values to consider, it is impossible to ensure that respondents
considered commensurate dimensions. A consistency bias (“I think that I fit well, so I must
be satisfied with my job.”) could potentially inflate the correlation (Kristof, 1996, p.11).

CHAPTER V
CONCLUSION
This chapter reviews the purposes and need for this study, and briefly discusses the
procedures used in the investigation. Then, results of the study are summarized, and the
theoretical and practical implications of the results are considered. Finally, limitations are
addressed and suggestions are offered for future research in the area of organizational
behavior and hospitality management.
Restatement of the Problem
As discussed in Chapter One and Two, organizational researchers tend to explain
employee attitudes and behavioral intentions in terms of either organizational characteristics
(situationalists) or individual characteristics (personalogists). Many researchers agree,
however, that neither perspective sufficiently explains behavior in organizations (Chatman,
1989, 1991; House et al., 1996; O’Reilly et al., 1991; Schneider et al., 1995). They conclude
that behavior in organizations can better be explained as a function of personal and
situational attributes in interaction, or person-organization fit.
Indeed, Chatman (1991) found P-O fit to be a better predictor of individual outcomes
than either personal characteristics or organizational characteristics, or both combined. The
current study attempted to replicate Chatman’s findings in table-service restaurants where
high person and organization interaction occurs. Specifically, this study investigated whether
person-organization fit contributed to explanation of employee job satisfaction, intent to quit,
95
and willingness to recommend an organization beyond that explained by organizational
culture and individual values.
Summary of Procedures
The population for the study consisted of all front- and-back-of-the-house employees
working in table-service restaurants in the U.S. With the help of graduates and current
students of Penn State’s Hotel, Restaurant, and Institutional Management program, surveys
were distributed at 40 table-service restaurants. The final sample included 173 front-of-the-
house and 153 back-of-the-house employees from 34 restaurants. The sample and population
characteristics compared favorably.
Factor analyses determined the factor structure for perceived and preferred culture at
the individual level and cross-level. P-O fit scores were compared using correlation analysis,
and hierarchical regression analyses investigated the effect of organizational culture,
individual values, and P-O fit on the dependent variables.
Summary of Findings and Conclusions
This study provided information about restaurant culture, measurement of P-O fit,
and the value of fit in predicting attitudes and behavioral intentions. The findings in each
area are summarized and discussed in the following sections.
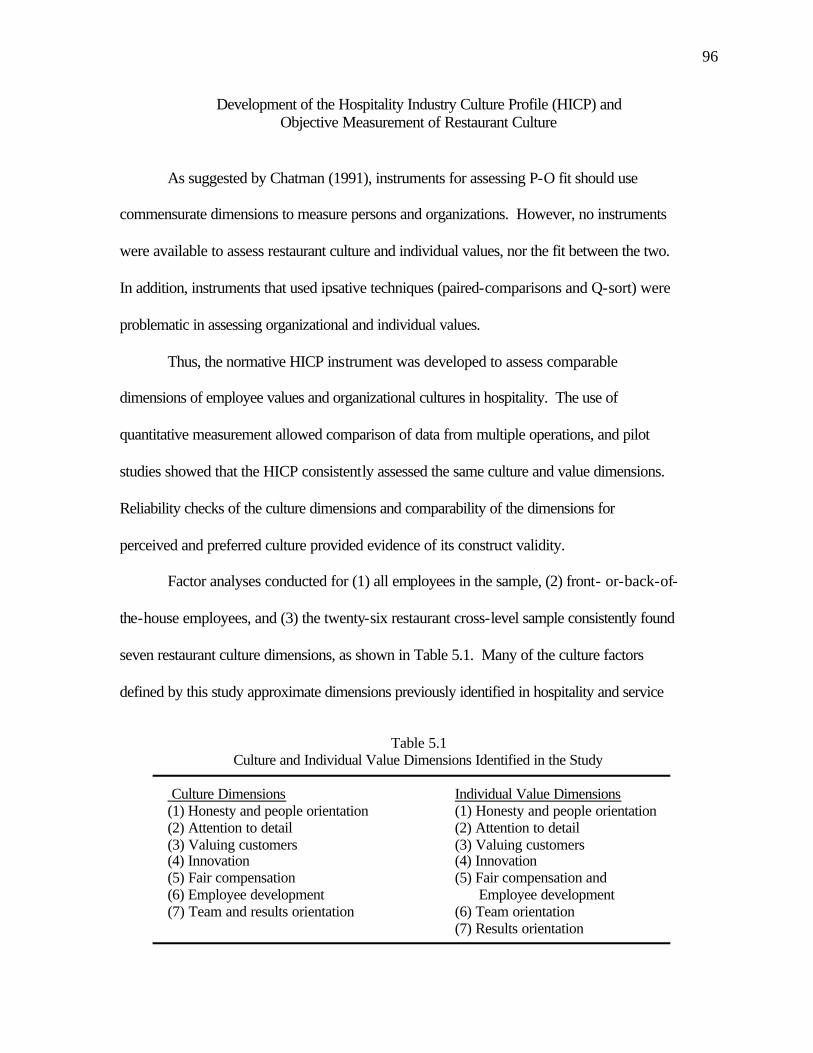
96
Development of the Hospitality Industry Culture Profile (HICP) and Objective Measurement of Restaurant Culture
As suggested by Chatman (1991), instruments for assessing P-O fit should use
commensurate dimensions to measure persons and organizations. However, no instruments
were available to assess restaurant culture and individual values, nor the fit between the two.
In addition, instruments that used ipsative techniques (paired-comparisons and Q-sort) were
problematic in assessing organizational and individual values.
Thus, the normative HICP instrument was developed to assess comparable
dimensions of employee values and organizational cultures in hospitality. The use of
quantitative measurement allowed comparison of data from multiple operations, and pilot
studies showed that the HICP consistently assessed the same culture and value dimensions.
Reliability checks of the culture dimensions and comparability of the dimensions for
perceived and preferred culture provided evidence of its construct validity.
Factor analyses conducted for (1) all employees in the sample, (2) front- or-back-of-
the-house employees, and (3) the twenty-six restaurant cross-level sample consistently found
seven restaurant culture dimensions, as shown in Table 5.1. Many of the culture factors
defined by this study approximate dimensions previously identified in hospitality and service
Table 5.1
Culture and Individual Value Dimensions Identified in the Study Culture Dimensions Individual Value Dimensions (1) Honesty and people orientation (1) Honesty and people orientation (2) Attention to detail (2) Attention to detail (3) Valuing customers (3) Valuing customers (4) Innovation (4) Innovation (5) Fair compensation (5) Fair compensation and (6) Employee development Employee development (7) Team and results orientation (6) Team orientation
(7) Results orientation

97
industry literature (NCS and National Food Service Security Council, 1999; Pizam, 1993;
Withiam, 1996; Woods, 1989). The factor structure was similar for preferred culture, which
was interpreted as individual values. Restaurant organizations prefer and invest time and
resources to attract employees who have such personal values (Hayes, 1991; Samenfink,
1992; Schneider & Bowen, 1995).
The .67 correlation among 26 restaurant organizations suggests this table-service
restaurant culture exists industry-wide. This finding is one of the most important
contributions of this study because previous culture research in the restaurant industry was
limited to only a few organizations and used qualitative research methods such as interviews
and observations (Fintel, 1989; Woods, 1989).
Multiple Measures of Person-Organization Fit
This research contributed to understanding relationships among various measures of
P-O fit. The high correlations between |D| and D2 in both levels of analyses indicates their
similarity. The correlations between difference scores and the Q method were moderate in
individual-level analysis, but very low in cross-level analysis. This may be attributed to
restricted range in the sample because many respondents indicated nearly all of the preferred
culture value items were very desirable. These findings suggest aggregation of individual-
level scores may not be appropriate (James, 1982; Nisbett & Ross, 1980). The moderate
correlations between individual-level calculated fit and perceived fit indicate that they are
somewhat related, but nonetheless distinct. Finally, no significant relationship between
cross-level calculated and perceived fit indicates they are also distinct constructs as

98
measured. Further research is needed to investigate the relationship between calculated and
perceived fit, and their relative veracity in predicting outcomes.
Edwards (1993, 1994) argued that items comprising profile similarity indices
represent conceptually distinct dimensions and should not be added to get a profile score. He
suggested polynomial regression might overcome the shortcomings of difference scores and
correlations, but polynomial regression could not be investigated in this study because the
perceived culture and preferred culture factor dimensions were different. Given the meager
effect of correlation and difference scores in the cross-level analyses Edwards’ perspective
appears to have been accurate. Moreover, the moderate correlations of calculated and
perceived fit at the individual-level increases the predictive potential for an alternative
calculation method such as polynomial regression.
Culture, Individual Values, and Person-Organization Fit as Predictors of Attitudes and Behavioral Intentions
Comparing the four independent variables, perceived fit explained the most outcome
variance, followed by culture, calculated fit, and individual values. In individual-level and
cross-level analyses, perceived P-O fit explained additional variance in employee job
satisfaction, intent to remain, and willingness to recommend beyond the effects accounted for
by organizational culture and individual values. When perceived fit was used as the only
independent variable, it explained more variance in all three outcomes than organizational
culture did it when it was entered into the equation first. Although perceived P-O fit alone
consistently predicted the dependent variables, however, similarity of the scales that assessed

99
perceived fit and the dependent variables may have contributed to the relationships (Kristof,
1996). Research using more distinct measures might help clarify this issue.
Since organizational culture demonstrated an important effect for all three outcome
variables, situationists’ belief that behavior is predicted by characteristics of organizations is
supported. The low impact of individual values suggests individuals adapted to
organizational settings (Davis-Blake & Pfeffer, 1989; Mischel, 1968; Sheridan, 1992).
The organizational culture dimension of Honesty and People Orientation was most influential
in explaining employee outcomes. Restaurant managers had better invest more time and
resources for emphasizing such values as integrity, truthfulness, and support for employees.
The most critical individual value dimensions were Fair Compensation and Employee
Development, and Honesty and People Orientation. Thus, restaurant managers should also
compensate their employees fairly and develop socialization and training programs for
improving fit.
At the individual-level results indicated that P-O fit calculated as |D|, D2, or Q did not
add to the explanation for any of the outcome variables. In cross-level analysis, calculated
P-O fit demonstrated very minor additional explanation, but these results are inconclusive.
When used as the only independent variable at the individual-level, calculated fit was a
significant predictor of individual outcomes (consistent with Boxx et al., 1991). In cross-
level analyses, however, calculated P-O fit did not explain significant variance in the
dependent variables even though this direct cross-level relationship is relatively well-
established (Cable & Judge, 1996, 1997; Chatman, 1991; Meglino et al., 1989; O’Reilly et
al., 1991; Vandenberghe, 1999). However, this finding is consistent with Enz (1988) who
found calculated cross-level P-O fit did not account for significant variance in power.
100
Implications
This research has implications for hospitality management researchers and industry
managers. For research, the study developed an instrument to assess organizational culture,
individual values, and P-O fit in hospitality organizations. A seven-factor structure of
restaurant culture is identified that represents the critical culture and individual value
dimensions influencing employee attitudes and intentions. Moderately high correlations
(.67) among 26 restaurants indicated that table-service restaurant culture is generalizable.
The instrument development process indicated that normative Likert-type scaling
yielded more reliable results than previously used ipsative measures, and the construct and
predictive validity of the HICP instrument support the use of normative scales for assessing
values. Because normative scaling permitted value profiles to be high or low on any or all
values, however, the normal distribution of organizational and individual values remains in
question.
The study contributes to interactional research by bringing the person-organization
debate into an organizational setting where high person-organization interaction occurs.
Findings provided substantial support for perceived fit as a predictor of organizational
outcomes, but limited and mixed results for the role of calculated fit. Results of the study
overall indicate that organizational culture and P-O fit were significant predictors of
employee job satisfaction, intent to remain, and willingness to recommend an employee’s
organization. Individual values were relatively unimportant in explaining individual
outcomes.
101
For practice, several potentially relevant contributions for hospitality managers are
offered. First, the HICP may be used by hospitality firms to gather information about their
culture and generate profiles of their ideal organizational culture. Once “actual” and “ideal”
culture profiles are specified, they can be compared to see where discrepancies and
similarities exist. Then, managers can decide what they want their culture to be and take
specific actions to achieve that profile. Given that the only individual factors to predict the
employee outcomes were Honesty/People Orientation and Fair Compensation/Employee
Development, and that the mean scores for these factors in perceived culture were rather low,
attention to these issues is clearly warranted.
For selection, in addition to matching applicants’ knowledge, skills, and abilities with
job requirements, an ideal process might also seek to match applicants’ values with the
organization’s culture. Selection based on P-O fit potentially improves effectiveness because
employees who feel they belong to the organization are satisfied, intend to remain, and are
willing to recommend their organizations.
Finally, in addition to selecting employees with high P-O fit, restaurant organizations
can develop socialization programs to improve fit (Bowen et al., 1991; Chatman, 1991). This
may be more appropriate early in an organization’s life cycle when P-O fit would enhance
coordination, communication, and employees’ sense of belonging. As suggested by
Schneider et al. (1995), later in an organization’s life individuals with low P-O fit may bring
new ideas and a competitive edge.
102
Limitations
At least three limitations of the study are apparent. First, it did not address the
possibility of reverse causality between fit and employee outcomes. It is plausible, for
example, that job satisfaction might cause an employee to alter their values toward better fit.
In a longitudinal study, Chatman (1991) found that when employees’ values became more
closely aligned with the organization’s values over the first year, corresponding increases in
satisfaction and intent to stay also occurred. Although this is not evidence of causal direction
(Cook & Campbell, 1979), there are theoretical reasons to believe that value congruence is
responsible for changes in attitudes, as opposed to the reverse. For example, Chatman (1989)
and Rokeach (1973) argue that values and beliefs influence attitudes and behavioral
intentions because they are more general and stable while attitudes and behavioral intentions
are more time specific and directed more toward particular objects.
A second limitation of the study is the use of a relatively homogenous sample. While
homogeneity of the sample provided better correspondence between perceived and preferred
culture compared to O’Reilly et al. (1991), it reduced the outcome variance and provided a
conservative test of the impact of P-O fit. The potentially higher variance in a heterogeneous
sample might allow calculated P-O fit to explain outcome variance beyond that explained by
organizational culture and individual values.
Finally, while the sampling strategy provided a broad spectrum of restaurants, it is not
assured that managers chose employees randomly. They might have given the surveys to
more cooperative employees, who would likely have higher P-O fit. Moreover, though the
data collection procedure should have guaranteed anonymity, employees might have altered
their responses out of concern that managers would see them.
103
Recommendations for Future Research
This study investigated the influence of P-O fit on employee attitudes and intentions
in the restaurant industry. The results suggest a number of additional research questions and
topics.
(1) Restaurant organizations were selected for this study because they seemed more
conducive to P-O fit studies than previous settings. Such homogenous work settings might
decrease the predictive ability of P-O fit, however. Research incorporating more
heterogeneous settings would aid understanding of P-O fit.
(2) The most appropriate method of measuring values remains to be resolved. As
discussed in this paper, both ipsative and normative instruments may be theoretically and
statistically appropriate. Although a normative instrument was selected in this study,
multiple approaches are suggested for future research, possibly in a study comparing the two.
(3) The most appropriate measure of fit also remains unresolved. Further research
should utilize alternative measures of perceived fit and continue to use multiple measures of
calculated fit, including correlations, difference scores, and polynomial regression, to better
understand the influence or predictive power of P-O fit in two levels of analysis.
(4) P-O fit research could be improved through greater use of longitudinal analysis.
Longitudinal data collection could shed light on the long-term effects of P-O fit on employee
attitudes and behaviors, and also provide evidence as to the causal direction of P-O fit and
individual outcome relationships.
(5) Although P-O fit has been found related to attitudes and behavioral intentions,
relationships with behavioral outcomes such as performance have not been investigated.
104
In conclusion, this study provides support for the ability of P-O fit to predict
employee satisfaction, intent to remain, and willingness to recommend the organization. In
an analysis that included four different assessments of fit, only perceived fit contributed
significantly to explanation of variance beyond that explained by organizational culture and
individual values. This study has provided an important first step in determining the role of
P-O fit in table-service restaurants. The proposed seven-factor structure of hospitality culture
and preferred culture is interesting in itself, and warrants further testing. Both personalagist
and situationalist hospitality researchers should consider interactional theories to contribute
to the literature and to industry practice.
REFERENCES
Alwin, D. F., & Krosnick, J. A. (1985). The measurement of values in surveys: a
comparison of ratings and rankings. Public Opinion Quarterly, 49 (4), 535-552. Agho, A. O., Mueller, C. W., & Price, J. L. (1993). Determinants of employee job
satisfaction: an empirical test of a causal model. Human Relations, 46 (8), 1007-1027. Arbuckle, J. L., & Werner, W. (1999). Amos 4.0 user's guide. Chicago, IL.
SmallWaters Corporation. Baron, H. (1996). Strengths and limitations of ipsative measurement. Journal of
Occupational and Organizational Psychology, 69, 49-56. Barrick, M. R., & Mount, M. K. (1991). The Big Five personality dimensions and job
performance: a meta analysis. Personnel Psychology, 44, 1-26. Bartlett, A. L., Probber, J. K., Scerbo, F. B. (1999). Student employees in university
food service: job design, job characteristics, and job satisfaction. The Journal of the National Association of College & University Food Services, 21, 14-29.
Bem, D. J., & Funder, D. C. (1978). Predicting more of the people more of the time:
assessing the personality of situations. Psychological Review, 85, 485-501. Bitner, M. J., Booms, B. H., & Tetreault, M. S. (1990). The service encounter:
diagnosing favorable and unfavorable incidents. Journal of Marketing, 54 (January), 71-84. Boxx, W. R., Odom, R. Y., & Dunn, M. G. (1991). Organizational values and value
congruency and their impact on satisfaction, commitment, and cohesion: an empirical examination within the public sector. Public Personnel Management, 20 (1), 195-205.
Bowen D. E., Ledford, G. E., & Nathan, B. R. (1991). Hiring for the organization, not the job. Academy of Management Executive, 5 (4), 35-49.
Bretz, R. D. Jr., & Ash, R. A., & Dreher, G. F. (1989). Do people make the place? An examination of the attraction-selection-attrition hypothesis. Personnel Psychology, 42, 561-581.
Bretz, R. D. Jr., & Judge, T. A. (1994). Person-organization fit and the theory of work adjustment: implications for satisfaction, tenure, and career success. Journal of Vocational Behavior, 44, 32-54.
Cable, D., & Judge, T. A. (1994). Pay preferences and job search decisions: a person-
organization fit perspective. Personnel Psychology, 47, 317-348.
106
Cable, D., & Judge, T. A. (1996). Person-organization fit, job choice decisions, and
organizational entry. Organizational Behavior and Human Decision Processes, 67 (3), 294-311.
Cable, D., & Judge, T. A. (1997). Interviewers’ perceptions of person-organization fit and organizational selection decisions. Journal of Applied Psychology, 82 (4), 546-561.
Cammann, C., Fichman, M., Jenkins, G. D. Jr., & Klesh, J. R. (1983). Assessing the
attitudes and perceptions of organizational members. In S. E. Seashore, E. E. III, Lawler, P. H. Mirvis, & C. Cammann, (Eds.), Assessing organizational change: a guide to methods, measures, and practices (pp. 71-138). New York, NY: Wiley.
Carlino, B. (1999, May 24). Diversity at work: senior citizens. Nation's Restaurant
News, 33 (21), 230-232. Chatman, J. A. (1989). Improving interactional organizational research: a model of
person-organization fit. Academy of Management Review, 14 (3), 333-349. Chatman, J. A. (1991). Matching people and organizations: selection and socialization
in public accounting firms. Administrative Science Quarterly, 36, 459-484. Chatman, J. A., & Jehn, K. A. (1994). Assessing the relationship between industry
characteristics and organizational culture: how different can you be? Academy of Management Journal, 37 (3), 522-553.
Christensen, G. (1988). Managing workforce diversity: changing culture at South Seas
Plantation. Cornell Hotel and Restaurant Administration Quarterly, 29 (2), 30-34. Cohen, J. (1988). Statistical power analysis for the behavioral sciences. Hillsdale, NJ:
Lawrence Erlbaum Associates, Inc. Comrey, A. L. (1988). Factor analytic methods of scale development in personality
and clinical psychology. Journal of Consulting and Clinical Psychology, 56, 754-761. Cook, T. D., & Campbell, D. T. (1979). Quasi-Experimentation: design & analysis
issues for field settings. Boston, MA: Houghton Mifflin Company. Cooke, R. A., & Rousseau, D. M. (1988). Behavioral norms and expectations: A
quantitative approach to the assessment of organizational culture. Group & Organization Studies, 13 (3), 245-273.
Davis-Blake, A., & Pfeffer, J. (1989). Just a mirage: the search for dispositional effects
in organizational research. Academy of Management Review, 14 (3), 385-400.

107
Dawis, R. V., & Lofquist, L. H. (1984). A psychological theory of work adjustment.
Minneapolis, MN: University of Minnesota Press. Denison, D. R. (1996). What is the difference between organizational culture and
organizational climate? A native's point of view on a decade of paradigm wars. Academy of Management Review, 21 (3), 619-654.
Dienhart, J. R., Gregorie, M. B., & Downey, R. (1990). Service orientation of
restaurant employees, Hospitality Research Journal, 14 (2), 421-430. Edwards, J. R. (1993). Problems with the use of profile similarity indices in the study
of congruence in organizational research. Personnel Psychology, 46, 641-665. Edwards, J. R. (1994). Regression analysis as an alternative to difference scores.
Journal of Management, 20 (3), 683-689.
Elashoff, J. (1995). NQUERY ADVISOR. Version 2. Saugus, MA: Statistical Solutions, Inc.
Enz, C. A. (1986). Power and shared values in the corporate culture. Ann Arbor, MI:
UMI Resdearch Press. Enz, C. A. (1988). The role of value congruity in intraorganizational power.
Administrative Science Quarterly, 33, 284-304. Fintel, J. (1989). Restaurant cultures: positive cultures can keep company healthy.
Restaurant USA, 9 (10), 12-16. Groves, J., Gregorie, M. B., & Downey, R. (1995). Relationship between the service
orientation of employees and operational indicators in a multiunit restaurant corporation. Hospitality Research Journal, 19 (3), 33-43.
Hair J. F., Anderson, R. E., Tatham, R. L., & Black, W. C. (1998). Multivariate Data
Analysis (Fifth Edition). Upper Saddle River, NJ: Prentice-Hall, Inc. Hallowell, R., Schlesinger, L. A., & Zornitsky, J. (1996). Internal service quality,
customer and job satisfaction: linkages and implications for management. Human Resource Planning, 19 (2), 20-31.
Hayes, L.R.(1991). In search of the perfect employee. Restaurant Hospitality, 75 (10),
68. Heskett, J. L., Jones, T. O., Loveman, G. W., Sasser, W.E., & Schlesinger, L.A. (1994).
Putting the service-profit chain to work. Harvard Business Review, 72 (2), 164-174.
108
Hofstede, G. (1998). Attitudes, values, and organizational culture: disentangling the
concepts. Organization Studies, 19 (3), 477-492. Hogan, J., & Ones, D. S. (1997). Conscientiousness and integrity at work. In R.
Hogan, J. A Johnson, & S. Briggs (Eds.), Handbook of personality psychology, 24, (pp. 849-870). San Diego, CA: Academic Press, Inc.
House, R. J., Shane, S. A. & Herold, D. M. (1996). Rumors of the death of
dispositional research are vastly exaggerated. Academy of Management Review, 21 (1), 203-224.
James, L. R. (1982). Aggregation bias in estimates of perceptual agreement. Journal of
Applied Psychology, 67 (2), 219-229. James, L. R., Demaree, R. G., & Wolf, G. (1993). rwg: an assessment of within-group
interrater agreement. Journal of Applied Psychology, 78 (2), 306-309. Judge, T. A., & Bretz, R. D., Jr. (1992). Effects of work values on job choice
decisions. Journal of Applied Psychology, 77, 261-271. Judge, T. A., & Cable, D. M. (1997). Applicant personality, organizational culture, and
organization attraction. Personnel Psychology, 50, 359-393. Kazanas, H. C. (1978). Relationship of job satisfaction and productivity to work values
of vocational education graduates. Journal of Vocational Behavior, 12, 155-164. Kent, W. E. (1990). Putting up the Ritz: using culture to open a hotel. Cornell Hotel
and Restaurant Administration Quarterly, 31 (3), 16-24. Kotter, J. P., & Heskett, J. L. (1992). Corporate culture and performance. New York,
NY: Free Press. Kozlowski, S. W. J., & Hattrup, K. (1992). A disagreement about within-group
agreement: disentangling issues of consistency versus consensus. Journal of Applied Psychology, 77 (2), 161-167.
Kristof, A. L. (1996). Person-organization fit: an integrative review of its
conceptualizations, measurement, and implications. Personnel Psychology 49, 1-49. Locke, E. A. (1976). The nature and causes of job satisfaction. In M. D. Dunnette
(Ed), Handbook of Industrial and Organizational Psychology, (pp. 1297-1349). Chicago, IL: Rand McNally.
Marshall-Mims, P. (1999, July 26). Aging work force creates new challenges for
restaurant industry. Nation's Restaurant News, 33 (30), 82.
109
Meglino, B. M., Ravlin, E. C., & Adkins, C. L. (1989). A work values approach to
corporate culture: a field test of the value congruence process and its relationship to individual outcomes. Journal of Applied Psychology, 74 (3), 424-432.
Meglino, B. M., Ravlin, E. C., & Adkins, C. L. (1992). The measurement of work
value congruence: a field study comparison. Journal of Management, 18 (1), 33-43. Mok, C., & Finley, D. (1986). Job satisfaction and its relationship to demographics
and turnover of hotel food-service workers in Hong Kong. International Journal of Hospitality Management, 5 (2), 71-78.
Morehart, K. K. (2001). How to create an employee referral program that really works.
HRFocus, 78 (1), 3-5. NCS and National Food Service Security Council. (1999). Fourth annual survey of
restaurant and fast food employees. Rosemont, IL: National Computer Systems, Inc. and National Food Service Security Council.
Nisbett, R. E., & Ross, L. (1980). Human inference: strategies and shortcomings of
social judgment. Englewood Cliffs, NJ: Prentice-Hall, Inc. Norusis, M. J. (1999). SPSS 9.0 guide to data analysis. Upper Saddle River, NJ:
Prentice-Hall, Inc Nunnally, J. C., & Bernstein, I. H. (1994). Psychometric Theory. New York, NY:
McGraw-Hill, Inc. O’Reilly, C. A., & Chatman, J. A. (1996). Culture as social control: corporations, cults,
and commitment. Research in Organizational Behavior, 18, 157-200. O’Reilly, C. A., Chatman, J. A., & Caldwell, D. F. (1991). People and organizational
culture: a profile comparison approach to assessing person-organization fit. Academy of Management Journal, 34 (3), 487-516.
Pavesic, D. V., & Brymer, R. A. (1990). Job satisfaction: what’s happening to the
young managers? Cornell Hotel and Restaurant Administration Quarterly, 30 (4), 90-96. Pedhazur, E. J. (1997). Multiple regression in behavioral research. Orlando, FL: Holt,
Rinehart, and Winston, Inc. Perrewe, P. L., Brymer, R. A., Stepina, L. P., & Hassell, B. L. (1991). A causal model
examining the effects of age discrimination on employee psychological reactions and subsequent turnover intentions. International Journal of Hospitality Management, 10 (3), 245-258.
110
Peters, T. J., & Waterman, R. H. (1982). In search of excellence: Lessons from
America's best-run companies. New York, NY: Harper & Row. Pizam, A. (1993). Managing cross-cultural hospitality enterprises. In P. Jones & A.
Pizam (Eds.), The International Hospitality Industry: Organizational and Operational Issues. (pp. 205-225). London: Pitman Publishing.
Pizam, A., & Chandrasekar, V. (1983). You do like your work. Cornell Hotel and
Restaurant Administration Quarterly, 24 (2), 5-10. Pizam, A., & Neumann, Y. (1988). The effect of task characteristics on hospitality
employees’ job satisfaction and burnout. Hospitality Education & Research Journal, 12, 99-105.
Restaurant Industry Forecast. (2000). National Restaurant Association Research and
Information Services Division. Washington D.C. Restaurant Industry Employee Profile. (2000). National Restaurant Association
Research and Information Services Division. Washington D.C. Rokeach, M. (1973). The nature of human values. New York: The Free Press. Rokeach, M., & Ball-Rokeach, S. J. (1989). Stability and change in American values,
1969-1981. American Psychologists, 44, 775-784. Ronen, S. (1978). Personal values: a basis for work motivational set and work attitude.
Organizational Behavior and Human Performance 21, 80-107. Ross, G. F. (1995). Work stress and personality measures among hospitality industry
employees. International Journal of Contemporary Hospitality Management, 7 (6), 9-13. Rousseau, D. M. (1985). Issues of level in organizational research: Multilevel and
cross-level perspectives. In L. L Cummings and B. M Staw (Eds.), Research in Organizational Behavior, 7, 1-37. Greenwich, CT: JAI Press.
Rousseau, D. M. (1990). Quantitative assessment of organizational culture: The case of multiple measures. In B. Schneider (Ed.), Organizational Climate and Culture. (pp. 153-192). San Francisco: Jossey-Bass.
Samenfink, W. H. (1992). Identifying the service potential of an employee through the
use of the self-monitoring scale. Hospitality Research Journal, 15 (2), 1-10. Samenfink, W. H. (1994). A quantitative analysis of certain interpersonal skills
required in the service encounter. Hospitality Research Journal,17 (2), 3-15.
111
Sammons, G. E. (1994). A study of the relationship between service orientation,
organizational citizenship behavior and service performance in hotels. Unpublished doctoral dissertation, University Park, PA: Pennsylvania State University.
Saville, P., & Wilson, E. (1991). The reliability and validity of normative and ipsative
approaches in the measurement of personality. Journal of Occupational Psychology, 64, 219-238.
Schein, E. H. (1985). Organizational Culture and Leadership: A dynamic view. San
Fransisco. CA.: Jossey-Bass Inc. Schein, E. H. (1990). Organizational culture. American Psychologist, 45 (2), 109-119. Schein, E. H. (1996). Culture: The missing concept in organization studies.
Administrative Science Quarterly, 41, 229-240. Schneider, B. (1987). The people make the place. Personnel Psychology, 40, 437-453. Schneider, B., & Bowen, D. E. (1995). Winning the service game. Boston: Harvard
Business School Press.
Schneider, B., Goldstein, H. W., & Smith, D. B. (1995). The ASA framework: an update. Personnel Psychology, 48, 747-773.
Schmit, M. J., & Allscheid, S. P. (1995). Employee attitudes and customer satisfaction:
making theoretical and empirical connections. Personnel Psychology, 48, 521-536. Schmidt, F. L., & Hunter, J. E. (1989). Interrater reliability coefficients cannot be
computed when only one stimulus is rated. Journal of Applied Psychology 74 (2), 368-370. Schwartz, S. H. (1992). Universals in the content and structure of values: theoretical
advances and empirical tests in 20 countries. Advances in Experimental Social Psychology, 25, 1-65.
Sheridan, J. E. (1992). Organizational culture and employee retention. Academy of Management Journal, 35 (5), 1036-1056.
Shore, L. M., Newton, L.A., & Thornton, G. C. (1990). Job and organizational
attitudes in relation to employee behavioral intentions. Journal of Organizational Behavior, 11, 57-67.
Siehl, C. (1992). Cultural leadership in service organizations. International Journal of
Service Industry Management, 3 (2), 17-22.
112
Smircich, L. (1983). Concepts of culture and organizational analysis. Administrative
Science Quarterly, 28, 339-358. Sommer, S. M., Bae, S. H., & Luthans, F. (1996). Organizational commitment across
cultures: the impact of antecedents on Korean employees. Human Relations, 49 (7), 977-992.
Staw, B. M., Bell, N. E., Clausen, J. A. (1986). The dispositional approach to job
attitudes: a lifetime longitudinal test. Administrative Science Quarterly, 31, 56-77. Tabachnick, B. G., & Fidell, L. S. (1996). Using Multivariate Statistics (Third Edition).
New York, NY: Harper-Collins College Publishers Inc. Tepeci, M., & Farrar, A. L. (2000). Person-organization fit, employee satisfaction and
intent to quit in the hotel industry. In Connie C. B. Mok and Agnes L. DeFranco (Eds.), Proceedings of Advances in Hospitality and Tourism Research, (pp. 298-302). Houston, TX: University of Houston.
Tidball, K. H. (1988). Creating a culture that builds your bottom line. Cornell Hotel
and Restaurant Administration Quarterly, 29 (1), 63-69. Tisak, J., & Smith, C.S. (1994). Defending and extending difference score methods.
Journal of Management, 20 (3), 675-682. Tom, V. R. (1971). The role of personality and organizational images in the recruiting
process. Organizational Behavior and Human Performance, 6, 573-592. Turban, D. B., & Keon, T. L. (1993). Organizational attractiveness: an interactionist
perspective. Journal of Applied Psychology, 78, 184-193. Vancouver, J. B., & Schmitt, N. W. (1991). An exploratory examination of person-
organization fit: organizational goal congruence. Personnel Psychology, 44, 333-352. Vandenberghe, C. (1999). Organizational culture, person-culture fit, and turnover: a
replication in the health care industry. Journal of Organizational Behavior, 20, 175-184.
Wanous, J. P., & Colella, A. (1989). Organizational entry research: current status and future directions. In G. R. Ferris & K. M. Rowland (Eds.), Research in Personnel and Human Resources Management, 7, (pp. 59-120). Greenwich, CT: JAI Press.
Weiss, H., & Adler, S. (1984). Personality and organizational behavior. In B. M. Staw
& L. L. Cummings (Eds.), Research in Organizational Behavior, 4 (1), 1-50. Greenwich, CT: JAI Press.
113
Weiss, H. M., & Cropanzano, R. (1996). Affective events theory: a theoretical
discussion of the structure, causes, and consequences of affective experiences at work. Research in Organizational Behavior, 18, 1-74.
Withiam, G. (1996). Beating employee theft with a winning restaurant culture. Cornell Hotel & Restaurant Administration Quarterly, 37 (3), 12.
Wollack, S., Goodale, J. G., Wijting, J. P., & Smith, P. C. (1971). Development of the survey of work values. Journal of Applied Psychology, 55, 331-338.
Woods, R. H. (1989). More alike than different: the culture of the restaurant industry. Cornell Hotel and Restaurant Administration Quarterly, 30 (2), 82-98.
Woods, R. H. (1992). Managing Hospitality Human Resources. East Lansing,
Michigan: Educational Institute of the American Hotel & Motel Association. Wright, T. A., & Staw B. M. (1999). Affect and favorable work outcomes: two
longitudinal tests of the happy-productive worker thesis. Journal of Organizational Behavior, 20, 1-23.
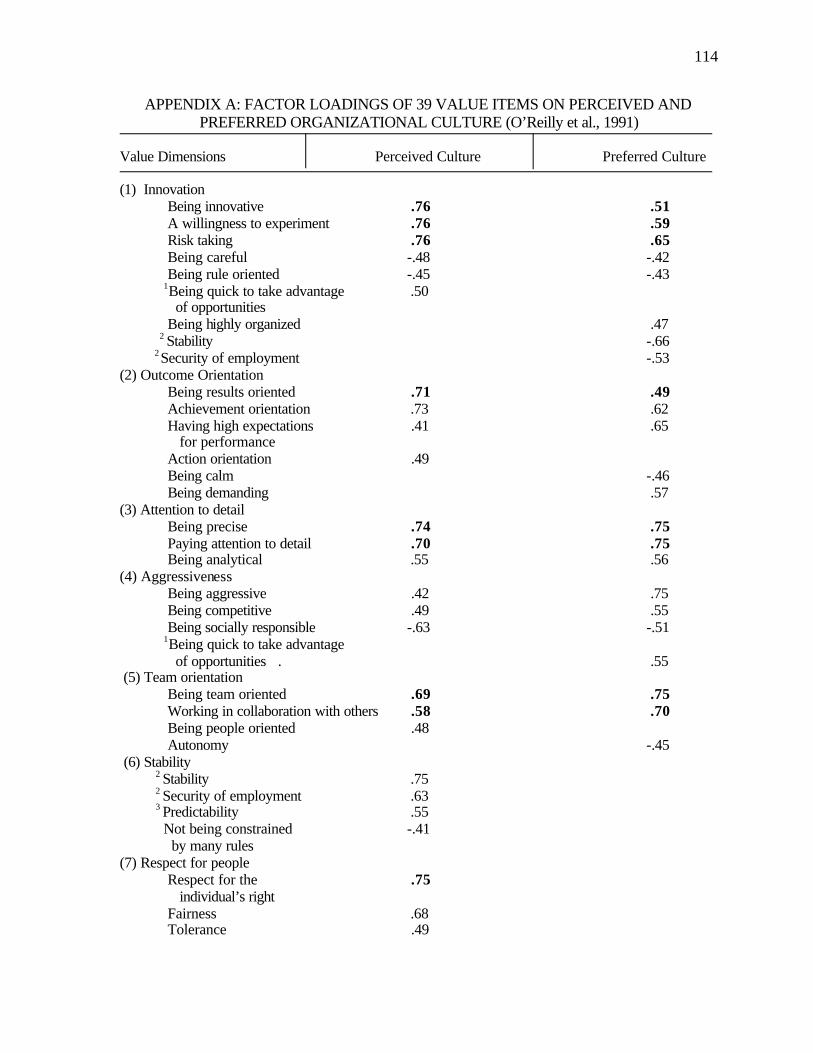
114
APPENDIX A: FACTOR LOADINGS OF 39 VALUE ITEMS ON PERCEIVED AND PREFERRED ORGANIZATIONAL CULTURE (O’Reilly et al., 1991)
Value Dimensions Perceived Culture Preferred Culture (1) Innovation
Being innovative .76 .51 A willingness to experiment .76 .59 Risk taking .76 .65
Being careful -.48 -.42 Being rule oriented -.45 -.43 1Being quick to take advantage .50
of opportunities Being highly organized .47 2 Stability -.66 2 Security of employment -.53 (2) Outcome Orientation
Being results oriented .71 .49 Achievement orientation .73 .62 Having high expectations .41 .65 for performance Action orientation .49 Being calm -.46
Being demanding .57 (3) Attention to detail
Being precise .74 .75 Paying attention to detail .70 .75 Being analytical .55 .56
(4) Aggressiveness Being aggressive .42 .75 Being competitive .49 .55 Being socially responsible -.63 -.51
1Being quick to take advantage of opportunities . .55 (5) Team orientation
Being team oriented .69 .75 Working in collaboration with others .58 .70
Being people oriented .48 Autonomy -.45 (6) Stability
2 Stability .75
2 Security of employment .63 3 Predictability .55 Not being constrained -.41
by many rules (7) Respect for people
Respect for the .75 individual’s right
Fairness .68 Tolerance .49

115
APPENDIX A CONTINUED Value Dimensions Perceived Culture Preferred Culture Supportiveness (6) Being supportive .63
Offers praise for .54 good performance
Working long hours -.53 Sharing information freely .44 Emphasis on Rewards (7) Opportunities for professional growth .68 High pay for good performance .66 Fitting in .41 Decisiveness (8) Decisiveness .65 Low level of conflict .56
3 Predictability .44 1 Being quick to take advantage of opportunities loaded on Innovation among organizational culture dimension,
and on Aggressiveness among preferred culture (or individual value) dimension. 2 Stability and security of employment loaded on Stability among organizational culture dimension, and on
Innovation among individual value dimension. 3 Predictability loaded on Stability among organizational culture dimension, and on Decisiveness among
individual value dimension. Notes: Items selected for 36-item OCP were marked with bold font in Appendix A. Only loadings above .40 are
shown in the table.
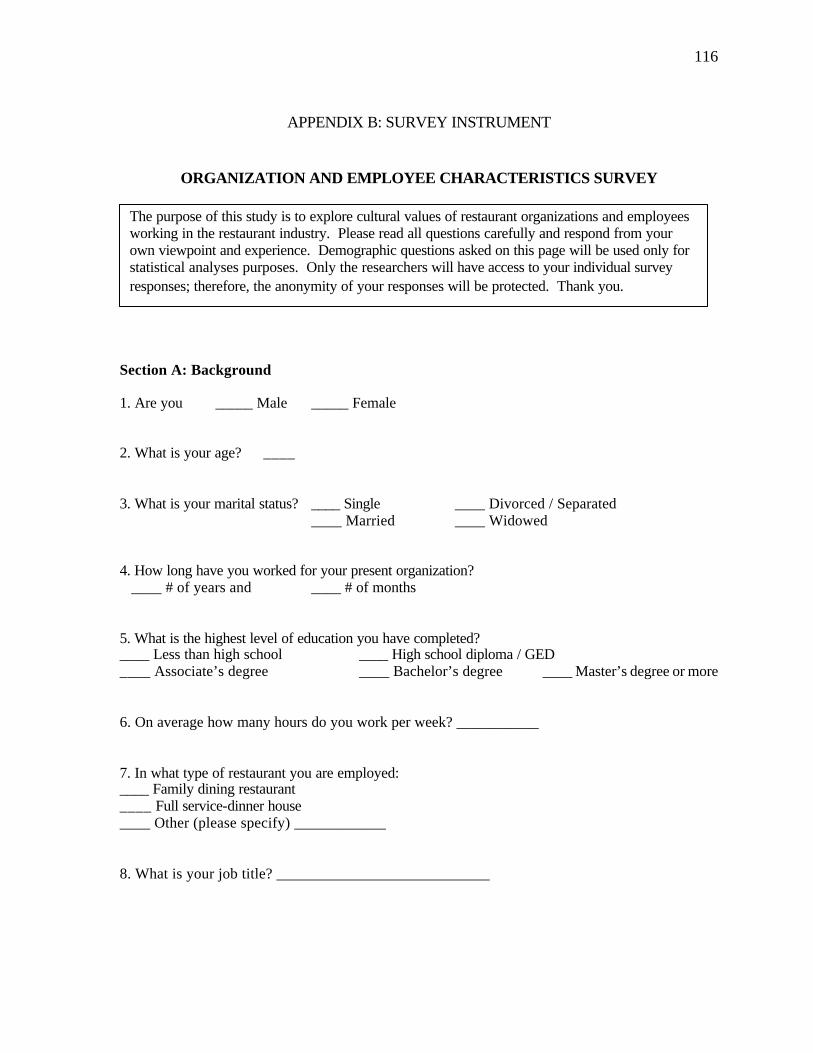
116
APPENDIX B: SURVEY INSTRUMENT
ORGANIZATION AND EMPLOYEE CHARACTERISTICS SURVEY
Section A: Background 1. Are you _____ Male _____ Female 2. What is your age? ____ 3. What is your marital status? ____ Single ____ Divorced / Separated ____ Married ____ Widowed 4. How long have you worked for your present organization? ____ # of years and ____ # of months 5. What is the highest level of education you have completed? ____ Less than high school ____ High school diploma / GED ____ Associate’s degree ____ Bachelor’s degree ____ Master’s degree or more 6. On average how many hours do you work per week? ___________ 7. In what type of restaurant you are employed: ____ Family dining restaurant ____ Full service-dinner house ____ Other (please specify) ____________ 8. What is your job title? ____________________________
The purpose of this study is to explore cultural values of restaurant organizations and employees working in the restaurant industry. Please read all questions carefully and respond from your own viewpoint and experience. Demographic questions asked on this page will be used only for statistical analyses purposes. Only the researchers will have access to your individual survey responses; therefore, the anonymity of your responses will be protected. Thank you.
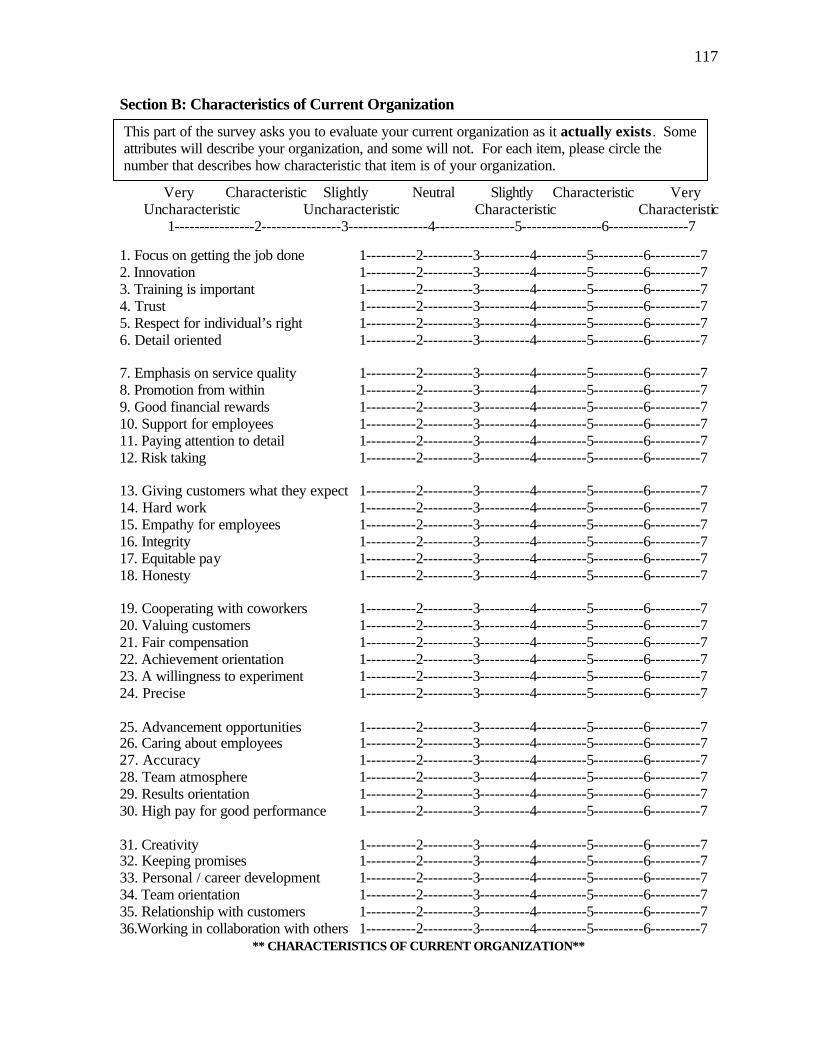
117
Section B: Characteristics of Current Organization Very Characteristic Slightly Neutral Slightly Characteristic Very Uncharacteristic Uncharacteristic Characteristic Characteristic
1----------------2----------------3----------------4----------------5----------------6----------------7 1. Focus on getting the job done 1----------2----------3----------4----------5----------6----------7 2. Innovation 1----------2----------3----------4----------5----------6----------7 3. Training is important 1----------2----------3----------4----------5----------6----------7 4. Trust 1----------2----------3----------4----------5----------6----------7 5. Respect for individual’s right 1----------2----------3----------4----------5----------6----------7 6. Detail oriented 1----------2----------3----------4----------5----------6----------7 7. Emphasis on service quality 1----------2----------3----------4----------5----------6----------7 8. Promotion from within 1----------2----------3----------4----------5----------6----------7 9. Good financial rewards 1----------2----------3----------4----------5----------6----------7 10. Support for employees 1----------2----------3----------4----------5----------6----------7 11. Paying attention to detail 1----------2----------3----------4----------5----------6----------7 12. Risk taking 1----------2----------3----------4----------5----------6----------7 13. Giving customers what they expect 1----------2----------3----------4----------5----------6----------7 14. Hard work 1----------2----------3----------4----------5----------6----------7 15. Empathy for employees 1----------2----------3----------4----------5----------6----------7 16. Integrity 1----------2----------3----------4----------5----------6----------7 17. Equitable pay 1----------2----------3----------4----------5----------6----------7 18. Honesty 1----------2----------3----------4----------5----------6----------7 19. Cooperating with coworkers 1----------2----------3----------4----------5----------6----------7 20. Valuing customers 1----------2----------3----------4----------5----------6----------7 21. Fair compensation 1----------2----------3----------4----------5----------6----------7 22. Achievement orientation 1----------2----------3----------4----------5----------6----------7 23. A willingness to experiment 1----------2----------3----------4----------5----------6----------7 24. Precise 1----------2----------3----------4----------5----------6----------7 25. Advancement opportunities 1----------2----------3----------4----------5----------6----------7 26. Caring about employees 1----------2----------3----------4----------5----------6----------7 27. Accuracy 1----------2----------3----------4----------5----------6----------7 28. Team atmosphere 1----------2----------3----------4----------5----------6----------7 29. Results orientation 1----------2----------3----------4----------5----------6----------7 30. High pay for good performance 1----------2----------3----------4----------5----------6----------7 31. Creativity 1----------2----------3----------4----------5----------6----------7 32. Keeping promises 1----------2----------3----------4----------5----------6----------7 33. Personal / career development 1----------2----------3----------4----------5----------6----------7 34. Team orientation 1----------2----------3----------4----------5----------6----------7 35. Relationship with customers 1----------2----------3----------4----------5----------6----------7 36.Working in collaboration with others 1----------2----------3----------4----------5----------6----------7
** CHARACTERISTICS OF CURRENT ORGANIZATION**
This part of the survey asks you to evaluate your current organization as it actually exists. Some attributes will describe your organization, and some will not. For each item, please circle the number that describes how characteristic that item is of your organization.
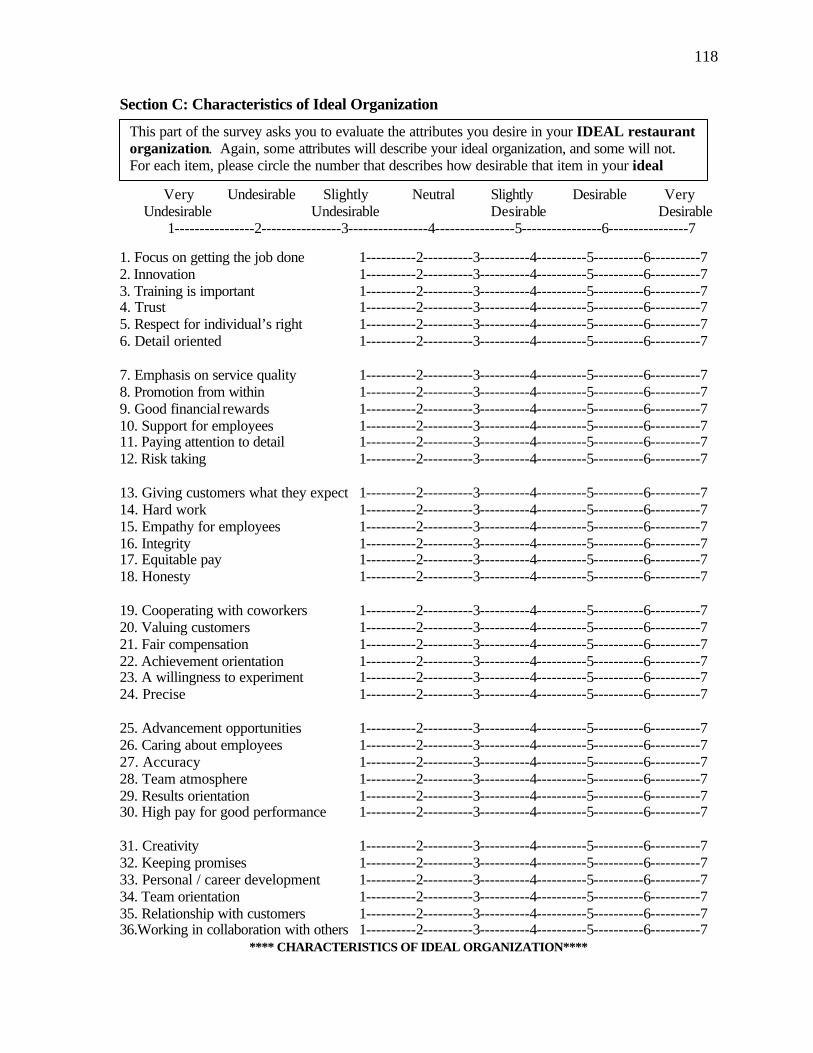
118
Section C: Characteristics of Ideal Organization Very Undesirable Slightly Neutral Slightly Desirable Very Undesirable Undesirable Desirable Desirable
1----------------2----------------3----------------4----------------5----------------6----------------7 1. Focus on getting the job done 1----------2----------3----------4----------5----------6----------7 2. Innovation 1----------2----------3----------4----------5----------6----------7 3. Training is important 1----------2----------3----------4----------5----------6----------7 4. Trust 1----------2----------3----------4----------5----------6----------7 5. Respect for individual’s right 1----------2----------3----------4----------5----------6----------7 6. Detail oriented 1----------2----------3----------4----------5----------6----------7 7. Emphasis on service quality 1----------2----------3----------4----------5----------6----------7 8. Promotion from within 1----------2----------3----------4----------5----------6----------7 9. Good financial rewards 1----------2----------3----------4----------5----------6----------7 10. Support for employees 1----------2----------3----------4----------5----------6----------7 11. Paying attention to detail 1----------2----------3----------4----------5----------6----------7 12. Risk taking 1----------2----------3----------4----------5----------6----------7 13. Giving customers what they expect 1----------2----------3----------4----------5----------6----------7 14. Hard work 1----------2----------3----------4----------5----------6----------7 15. Empathy for employees 1----------2----------3----------4----------5----------6----------7 16. Integrity 1----------2----------3----------4----------5----------6----------7 17. Equitable pay 1----------2----------3----------4----------5----------6----------7 18. Honesty 1----------2----------3----------4----------5----------6----------7 19. Cooperating with coworkers 1----------2----------3----------4----------5----------6----------7 20. Valuing customers 1----------2----------3----------4----------5----------6----------7 21. Fair compensation 1----------2----------3----------4----------5----------6----------7 22. Achievement orientation 1----------2----------3----------4----------5----------6----------7 23. A willingness to experiment 1----------2----------3----------4----------5----------6----------7 24. Precise 1----------2----------3----------4----------5----------6----------7 25. Advancement opportunities 1----------2----------3----------4----------5----------6----------7 26. Caring about employees 1----------2----------3----------4----------5----------6----------7 27. Accuracy 1----------2----------3----------4----------5----------6----------7 28. Team atmosphere 1----------2----------3----------4----------5----------6----------7 29. Results orientation 1----------2----------3----------4----------5----------6----------7 30. High pay for good performance 1----------2----------3----------4----------5----------6----------7 31. Creativity 1----------2----------3----------4----------5----------6----------7 32. Keeping promises 1----------2----------3----------4----------5----------6----------7 33. Personal / career development 1----------2----------3----------4----------5----------6----------7 34. Team orientation 1----------2----------3----------4----------5----------6----------7 35. Relationship with customers 1----------2----------3----------4----------5----------6----------7 36.Working in collaboration with others 1----------2----------3----------4----------5----------6----------7
**** CHARACTERISTICS OF IDEAL ORGANIZATION****
This part of the survey asks you to evaluate the attributes you desire in your IDEAL restaurant organization. Again, some attributes will describe your ideal organization, and some will not. For each item, please circle the number that describes how desirable that item in your ideal organization
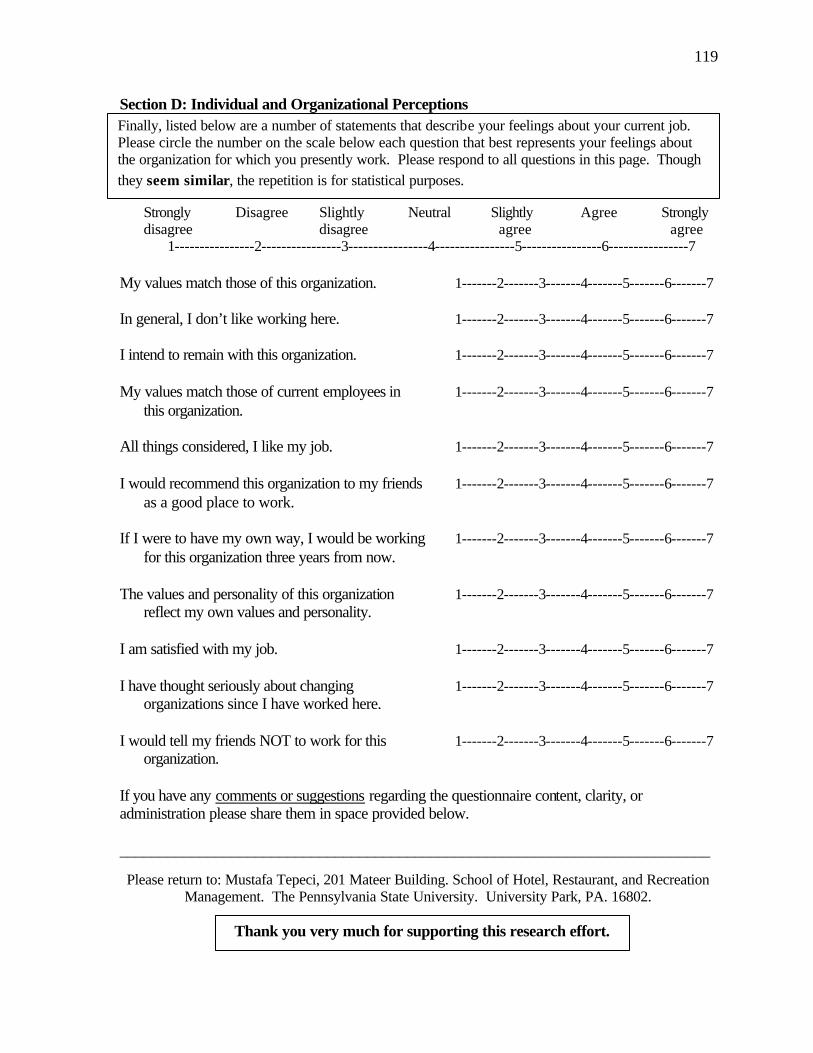
119
Section D: Individual and Organizational Perceptions Strongly Disagree Slightly Neutral Slightly Agree Strongly disagree disagree agree agree
1----------------2----------------3----------------4----------------5----------------6----------------7 My values match those of this organization. 1-------2-------3-------4-------5-------6-------7
In general, I don’t like working here. 1-------2-------3-------4-------5-------6-------7 I intend to remain with this organization. 1-------2-------3-------4-------5-------6-------7 My values match those of current employees in 1-------2-------3-------4-------5-------6-------7 this organization. All things considered, I like my job. 1-------2-------3-------4-------5-------6-------7 I would recommend this organization to my friends 1-------2-------3-------4-------5-------6-------7 as a good place to work. If I were to have my own way, I would be working 1-------2-------3-------4-------5-------6-------7 for this organization three years from now. The values and personality of this organization 1-------2-------3-------4-------5-------6-------7 reflect my own values and personality. I am satisfied with my job. 1-------2-------3-------4-------5-------6-------7 I have thought seriously about changing 1-------2-------3-------4-------5-------6-------7 organizations since I have worked here. I would tell my friends NOT to work for this 1-------2-------3-------4-------5-------6-------7 organization. If you have any comments or suggestions regarding the questionnaire content, clarity, or administration please share them in space provided below. __________________________________________________________________________ Please return to: Mustafa Tepeci, 201 Mateer Building. School of Hotel, Restaurant, and Recreation
Management. The Pennsylvania State University. University Park, PA. 16802.
Thank you very much for supporting this research effort.
Finally, listed below are a number of statements that describe your feelings about your current job. Please circle the number on the scale below each question that best represents your feelings about the organization for which you presently work. Please respond to all questions in this page. Though they seem similar, the repetition is for statistical purposes.
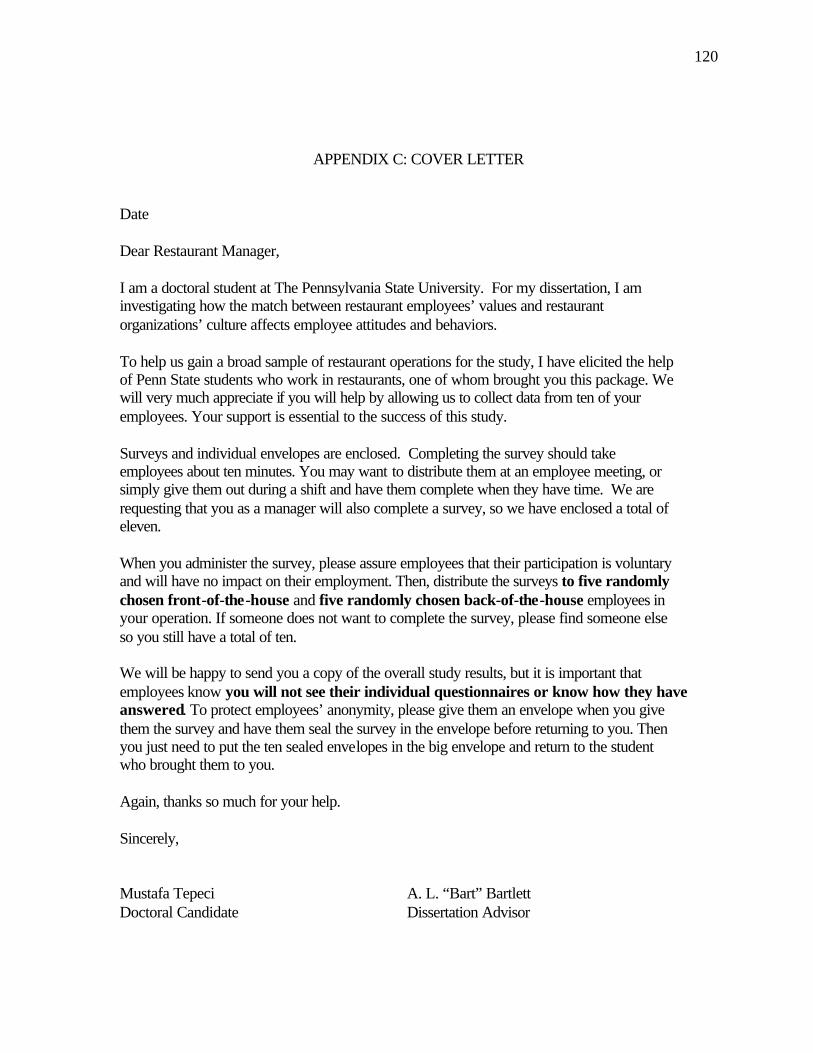
120
APPENDIX C: COVER LETTER
Date Dear Restaurant Manager, I am a doctoral student at The Pennsylvania State University. For my dissertation, I am investigating how the match between restaurant employees’ values and restaurant organizations’ culture affects employee attitudes and behaviors. To help us gain a broad sample of restaurant operations for the study, I have elicited the help of Penn State students who work in restaurants, one of whom brought you this package. We will very much appreciate if you will help by allowing us to collect data from ten of your employees. Your support is essential to the success of this study. Surveys and individual envelopes are enclosed. Completing the survey should take employees about ten minutes. You may want to distribute them at an employee meeting, or simply give them out during a shift and have them complete when they have time. We are requesting that you as a manager will also complete a survey, so we have enclosed a total of eleven. When you administer the survey, please assure employees that their participation is voluntary and will have no impact on their employment. Then, distribute the surveys to five randomly chosen front-of-the-house and five randomly chosen back-of-the-house employees in your operation. If someone does not want to complete the survey, please find someone else so you still have a total of ten. We will be happy to send you a copy of the overall study results, but it is important that employees know you will not see their individual questionnaires or know how they have answered. To protect employees’ anonymity, please give them an envelope when you give them the survey and have them seal the survey in the envelope before returning to you. Then you just need to put the ten sealed envelopes in the big envelope and return to the student who brought them to you. Again, thanks so much for your help. Sincerely, Mustafa Tepeci A. L. “Bart” Bartlett Doctoral Candidate Dissertation Advisor

121
APPENDIX D1: ORGANIZATIONAL CULTURE DIMENSIONS AND VALUE ITEMS FOR FRONT- OF- THE-HOUSE SAMPLE
Value Items / Factors
Team/ Results Orien tation
Honesty/ People Orien tation
Fair Compen
sation
Emplo yee
Develop ment
Valuing Custo mers
Innova tion
Atten tion to
Detail Team orientation Team atmosphere Working in collaboration with others Results orientation Accuracy Cooperating with cowor. Focus on getting the job done Fairness with employees Honesty Truthfulness Respect for individual Caring about employees Keeping promises Integrity Support for employees Equitable pay Fair compensation Financial rewards High pay for good perf. Advancement opportuni. Promotion from within Personal/career develop. Valuing customers Giving customers what they expect Relationship with custo. Cooperating coworkers Emphasis on servquality Willingness to experime. Risk taking Creativity Innovation Detail oriented Paying attention to detail Scale Reliability Eigenvalue Variance Explained Scale Mean Standard Deviation
.823
.787
.733
.681
.646
.621
.550
.8919 11.80 32.77 5.71 .90
.781
.752
.712
.703
.681
.648
.638
.599
.8961 3.02 8.38 5.26 .98
.779
.697
.696
.691
.8526 2.52 7.01 4.86 1.20
.820
.779
.649
.8316 1.94 5.38 4.97 1.29
.828
.684
.680
.610
.7570 1.60 4.45 6.32 .69
.780
.730
.614
.579
.7349 1.35 3.74 4.72 1.03
.520
.584
.542 .8051 1.24 3.45 5.64 1.02
Notes: Total Variance Explained: 65.18 Principal Component Analysis. Kaiser-Meyer-Olkin Measure of Sampling Adequacy.= .879 Varimax with Kaiser Normalization Bartlett's Test of Sphericity: p=.000 (Chi-Square 3736.36, df=630)
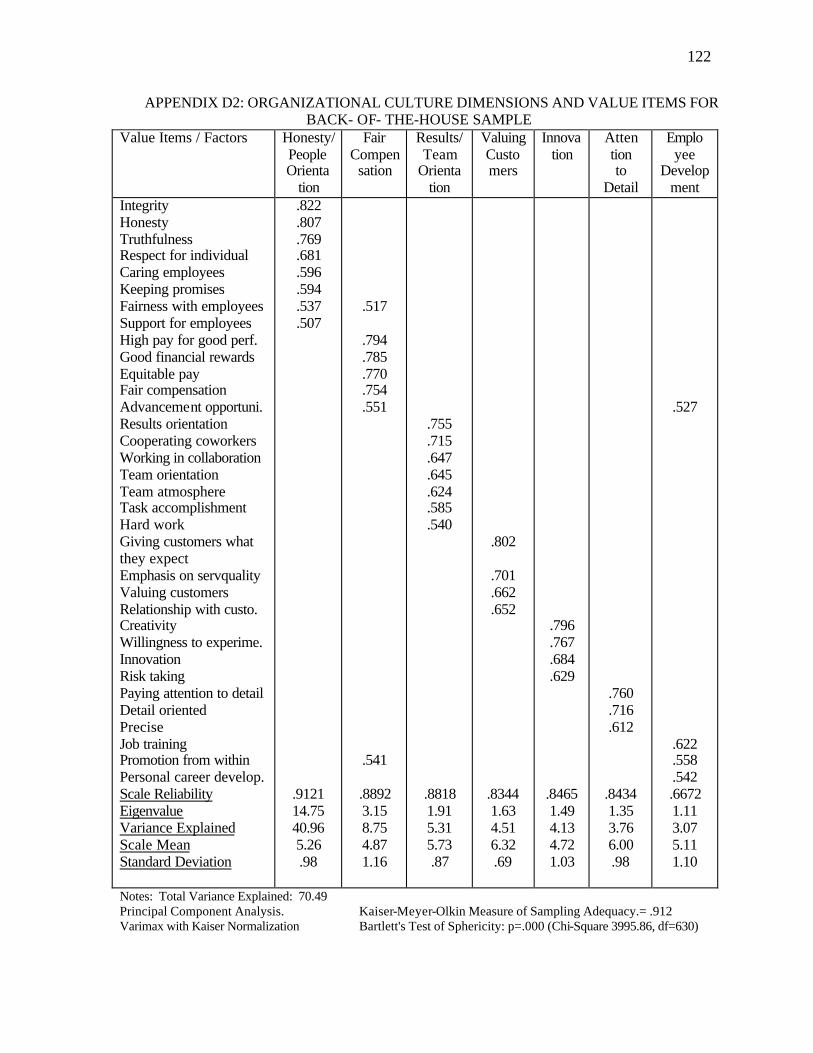
122
APPENDIX D2: ORGANIZATIONAL CULTURE DIMENSIONS AND VALUE ITEMS FOR BACK- OF- THE-HOUSE SAMPLE
Value Items / Factors Honesty/ People Orienta
tion
Fair Compen
sation
Results/ Team
Orienta tion
Valuing Custo mers
Innova tion
Atten tion to
Detail
Emplo yee
Develop ment
Integrity Honesty Truthfulness Respect for individual Caring employees Keeping promises Fairness with employees Support for employees High pay for good perf. Good financial rewards Equitable pay Fair compensation Advancement opportuni. Results orientation Cooperating coworkers Working in collaboration Team orientation Team atmosphere Task accomplishment Hard work Giving customers what they expect Emphasis on servquality Valuing customers Relationship with custo. Creativity Willingness to experime. Innovation Risk taking Paying attention to detail Detail oriented Precise Job training Promotion from within Personal career develop. Scale Reliability Eigenvalue Variance Explained Scale Mean Standard Deviation
.822
.807
.769
.681
.596
.594
.537
.507
.9121 14.75 40.96 5.26 .98
.517
.794
.785
.770
.754
.551
.541
.8892 3.15 8.75 4.87 1.16
.755
.715
.647
.645
.624
.585
.540
.8818 1.91 5.31 5.73 .87
.802
.701
.662
.652
.8344 1.63 4.51 6.32 .69
.796
.767
.684
.629
.8465 1.49 4.13 4.72 1.03
.760
.716
.612
.8434 1.35 3.76 6.00 .98
.527
.622
.558
.542 .6672 1.11 3.07 5.11 1.10
Notes: Total Variance Explained: 70.49 Principal Component Analysis. Kaiser-Meyer-Olkin Measure of Sampling Adequacy.= .912 Varimax with Kaiser Normalization Bartlett's Test of Sphericity: p=.000 (Chi-Square 3995.86, df=630)
Vita of Mustafa Tepeci
Education Ph.D. in Man-Environment Relations , May 2001. Concentration area: Management and Organizational Behavior. School of Hotel, Restaurant, and Recreation Management, The Pennsylvania State University.
M.S. in Hospitality and Tourism, May 1996. School of Hotel, Restaurant, and Travel Administration. University of New Haven, West Haven, CT.
B.S. in Tourism and Hotel Management, May 1991. School of Tourism and Hotel Management. Uludag University, Balikesir, Turkey.
Publications
Tepeci, M., Seo, W., Upneja, A., & DeMicco, F. (2001). Supply and Demand for Hospitality/Tourism Management Faculty in the United States. Journal of Hospitality & Tourism Education, 12 (4), (in press).
Tepeci, M . (1999). Increasing brand loyalty in the hospitality industry. International Journal of Contemporary Hospitality Management, 11 (5), 223-229. Tepeci, M . (1999). Selecting service-oriented employees based on person-organization fit. In K. S. (Kaye) Chon (Ed.), The Practice of Graduate Research in Hospitality and Tourism. (pp. 3-21). Binghamton, NY: The Haworth Hospitality Press.
Experience Teaching and Research Assistant, School of Hotel, Restaurant, and Recreation Management, The Pennsylvania State University. August 2000- May 2001. Research Assistant. School of Hospitality and Tourism Administration. Mersin University, Mersin. Turkey, July 1993-January 1994.
Awards The Edward R. and Helen Skade Hintz Graduate Educational Enhancement Fellowship. The Pennsylvania State University, 1999-2000.
Marvin Ashner Graduate Student Scholarship Award. The Pennsylvania State University, 1998-1999.
Graduate Scholarship Award. Mersin University, Turkey, 1994-2000.
Certification Learning to teach, teaching to learn, Instructional Development Certificate (Spring 2000). Center for Excellence in Learning and Teaching. The Pennsylvania State University.