Embed Size (px)
Citation preview

VTT RESEARCH NOTES 2470VTT CREATES BUSINESS FROM TECHNOLOGY�Technology�and�market�foresight�•�Strategic�research�•�Product�and�service�development�•�IPR�and�licensing�•�Assessments,�testing,�inspection,�certification�•�Technology�and�innovation�management�•�Technology�partnership
•�•�•��VTT�RESEA
RC
H�N
OTES�2470��Fu
TuR
E�dEVElO
PmEN
T�TREN
dS�IN
�ElECTR
ICITy�d
EmA
Nd
ISBN 978-951-38-7273-1(URL: http://www.vtt.fi/publications/index.jsp)ISSN 1455-0873 (URL: http://www.vtt.fi/publications/index.jsp)
Göran Koreneff, Maija Ruska, Juha Kiviluoma, Jari Shemeikka, Bettina Lemström, Raili Alanen & Tiina Koljonen
Future development trends in electricity demand
The future electricity demand and demand trends in Finland and in the Nordic countries are the main focus of this report. The electricity demand per capita is high in Finland, Sweden and Norway.
EU’s recent 20-20-20-10 policy decisions for the year 2020 will have an impact on the electricity system. The future trends do not only affect annual consumption, but also the load curves and system peak load behaviours. Using consumer type load models and sector wise annual energy estimates, we model the Nordic load curves for each country for the years 2020 and 2030.
The authors of this report see industrial electricity demand, electric heating and heat pumps, and electric vehicles as the most important individual factors that may affect electricity demand in the future. The impacts of large scale penetration of the latter two are further analysed using what-if cases with special regard to effect on system peak load. The report studies what would happen if a large number of the oil heated detached houses are converted to heat pumps, a large number of electric heated houses get heat pumps, and half of all personal vehicles were electric vehicles. We study the impacts of the different cases for both Finland and the Nordic countries.


VTT TIEDOTTEITA – RESEARCH NOTES 2470
Future development trends in electricity demand
Göran Koreneff, Maija Ruska, Juha Kiviluoma, Jari Shemeikka, Bettina Lemström, Raili Alanen & Tiina Koljonen

2
ISBN 978-951-38-7273-1 (URL: http://www.vtt.fi/publications/index.jsp) ISSN 1455-0865 (URL: http://www.vtt.fi/publications/index.jsp)
Copyright © VTT 2009
JULKAISIJA – UTGIVARE – PUBLISHER
VTT, Vuorimiehentie 5, PL 1000, 02044 VTT puh. vaihde 020 722 111, faksi 020 722 4374
VTT, Bergsmansvägen 5, PB 1000, 02044 VTT tel. växel 020 722 111, fax 020 722 4374
VTT Technical Research Centre of Finland, Vuorimiehentie 5, P.O. Box 1000, FI-02044 VTT, Finland phone internat. +358 20 722 111, fax +358 20 722 4374
Technical editing Leena Ukskoski

3
Göran Koreneff, Maija Ruska, Juha Kiviluoma, Jari Shemeikka, Bettina Lemström, Raili Alanen & TiinaKoljonen. Future development trends in electricity demand. Espoo 2009. VTT Tiedotteita – Research Notes2470. 79 p.
Keywords electricity demand, load modelling, load curves, system peak load, electric vehicles, heat pumps
Abstract The future electricity demand and demand trends in Finland and in the Nordic countries (excluding Iceland) are the main focus of this report. The electricity demand per capita is high on a European and even on a global scale in Finland, Sweden and Norway. One reason is the high share of electric heating combined with a cold climate; another reason is the relatively low price level of electricity which has led to extensive electricity intensive industry. The estimated Nordic business as usual (BAU) demand for year 2020 is 435 TWh and for year 2030 454 TWh.
EU’s recent policy decisions regarding increased use of renewables, greenhouse gas emission reductions and improved energy efficiency will have an impact on the electricity system. The basic demand is expected to decrease compared to the BAU scenario. The future trends do not only affect annual consumption, but also the load curves and system peak load behaviours. Using consumer type load models and sectorwise annual energy estimates, we model the Nordic load curves for each country for the years 2020 and 2030.
EU 20-20-20 policies will change how electricity is used. The authors of this report see industrial electricity demand, electric heating and heat pumps, and electric vehicles as the most important individual factors that may affect electricity demand in the future, and even increase it considerably. The impacts of large scale penetration of the latter two are further analysed with special regard to effect on system peak load. The analysis was done using what-if cases.
The future of oil heating is under the spotlight especially in Finland according to the long-term climate and energy strategy of the Ministry of Employment and the Economy. If 200 000 of the oil heated detached houses are converted to heat pumps, then the electricity consumption would rise with more than 2 TWh. At the same time the peak load will rise with 1100 MW. On the other hand, if a similar chunk of direct electric heated houses get heat pumps, it will more than compensate for the rise in consumption. But not for the rise in peak load as there will still remain a net increase of 700 MW.
The deployment of electric vehicles (EV) and their effect on the electricity power system was studied. The results indicate that a small amount of EVs (5% to 10% market share) will increase electricity demand by a negligible amount, less than 0.5–1 % in Finland. If half of all personal vehicles were EVs, a realistic possibility by 2030, the electricity consumption would rise in Finland by 3 TWh and in the Nordic countries by

4
15 TWh. However, it will not require any extraordinary changes to the system peak load management if smart distribution network charging is selected as the preferred charging method. Our results show an increase in the system peak load of 1000 MW on the Nordic level.
Large scale penetration of both heat pumps and electric vehicles on a Nordic level are studied with two case studies, case A being a worst case scenario with regard to load impact and case B a more realistic alternative. In case B also electric heated houses get heat pumps, not only oil heated houses as in case A. Both cases show a substantial (3.000–4.000 MW) peak load increase at -25°C, whereas peak load increase is quite small for case B at -10°C. A simultaneous cold spell in the Nordic countries is in our opinion better described by -10°C than by -25°C, thus EVs and heat pumps might not affect the peak capacity requirements in the Nordic countries as adversely as beforehand was anticipated.
Considering all demand issues presented in this report, it is clear that electricity is a high value source of energy offering possibilities to overall energy savings and an increased share of renewables. This will further boost the electrification of the society.

5
Preface
This report contains the research results related to future development trends in electricity demand. The research behind this study was done by VTT Technical Research Centre of Finland (VTT). The topic is included in the subtask concerning electricity market development in the research project “SEKKI – The Competitiveness of Finnish Energy Industry under Developing Climate Policy”. Results from other subtasks of the SEKKI research project are presented in separate reports and conference articles. The main results of SEKKI are in addition presented in a summary report.
The SEKKI research was carried out as a joint research project of VTT, MTT Agrifood Research Finland (MTT) and the Bank of Finland Institute for Economics in Transition (BOFIT). The coordinating partner was VTT. The research was part of Climbus-programme by Tekes, the Finnish Funding Agency for Technology. SEKKI was financed by Fingrid Oyj, Fortum Oyj, Gasum Oyj, Metso Power Oy, the Federation of Finnish Technology Industries, Ministry of Foreign Affairs of Finland, ÅF-Consult, VTT and MTT in addition to Tekes.
The coordinators and responsible managers of the joint research project were Technology Manager Sanna Syri (until 30.9.2008) and Vice President, R&D Kari Larjava (since 1.10.2008). As project manager served Senior Research Scientist Tiina Koljonen from VTT. Responsible manager of MTT’s subproject was Senior Researcher Katri Pahkala and of BOFIT’s subproject Research Supervisor Iikka Korhonen. Chairman of the project’s advisory board was Risto Lindroos (Fingrid). Members of the advisory board were Marjatta Aarniala (Tekes), Björn Ahlnäs (Gasum), Timo Airaksinen (the Federation of Finnish Technology Industries), Karoliina Anttonen (Ministry of Foreign Affairs of Finland), Pekka Järvinen (ÅF-Consult), Pirjo Peltonen-Sainio (MTT), Matti Rautanen (Metso Power), Eero Vartiainen (Fortum), Pekka Sutela (BOFIT), Satu Helynen (VTT), Kari Larjava (VTT), Sanna Syri (VTT) and Tiina Koljonen (secretary, VTT).
The researchers thank the project’s advisory board for its active participation and its guidance. February 2009 Göran Koreneff

6
Contents
Abstract........................................................................................................................... 3
Preface ........................................................................................................................... 5
1. Introduction ............................................................................................................... 8
2. Trends in electricity demand by sector...................................................................... 9 2.1 Drivers ........................................................................................................................................ 9 2.2 Heating systems ....................................................................................................................... 10 2.3 Residential ................................................................................................................................ 14 2.4 Industry ..................................................................................................................................... 17 2.5 Other sectors ............................................................................................................................ 19
2.5.1 Services and public consumption ............................................................................... 19 2.5.2 Transportation ............................................................................................................ 20 2.5.3 Agriculture, mining...................................................................................................... 20
3. Load profiles for aggregate (country-level) hourly demand..................................... 21 3.1 Load estimation with hourly consumption indexes – method ...................................................... 21 3.2 Finland ...................................................................................................................................... 24 3.3 Sweden..................................................................................................................................... 26 3.4 Norway...................................................................................................................................... 28 3.5 Denmark ................................................................................................................................... 29 3.6 Modelling results for year 2006................................................................................................. 31
4. Electricity demand scenarios by country................................................................. 36 4.1 Finland ...................................................................................................................................... 37 4.2 Sweden..................................................................................................................................... 39 4.3 Norway...................................................................................................................................... 40 4.4 Denmark ................................................................................................................................... 41
5. Heat pumps............................................................................................................. 42 5.1 Heat pump types....................................................................................................................... 42
5.1.1 Ground source heat pump.......................................................................................... 43

7
5.1.2 Air heat pumps ........................................................................................................... 44 5.1.3 Exhaust air heat pumps.............................................................................................. 44
5.2 Heat pumps in the Nordic countries .......................................................................................... 45 5.3 New houses being built in Finland up to 2020........................................................................... 47 5.4 Load profiles for heat pumps..................................................................................................... 48
5.4.1 Methods ..................................................................................................................... 48 5.4.2 General information of the case single-family house from 1970’s .............................. 49 5.4.3 Description of heat pump systems used..................................................................... 50 5.4.4 Case results – electricity consumptions ..................................................................... 53
6. Electric vehicles ...................................................................................................... 56 6.1 Transforming the transport sector ............................................................................................. 56 6.2 Technology of electric vehicles ................................................................................................. 57 6.3 Charging infrastructure ............................................................................................................. 58 6.4 Driving patterns......................................................................................................................... 58 6.5 Rate of adoption for EV’s .......................................................................................................... 59 6.6 Influence of EVs on the electricity consumption........................................................................ 60
6.6.1 Case 1: 1 million EVs in Finland................................................................................. 62 6.6.2 Case 2: 5 million EVs in the Nordic countries (excluding Iceland).............................. 62 6.6.3 Case 3: 5 million EVs with smart charging in the Nordic countries............................. 64
6.7 Other effects on the power system ........................................................................................... 65
7. Aggregate demand scenarios for years 2020 and 2030 ......................................... 66 7.1 Demand forecasts..................................................................................................................... 66 7.2 Effect of demand changes on market price............................................................................... 68 7.3 Aggregate load case studies..................................................................................................... 69
8. Summary and conclusions ...................................................................................... 74
References ................................................................................................................... 77

1. Introduction
8
1. Introduction
Demand for electricity has risen constantly in most parts of the world. Electricity has the advantage that it can be put to very versatile uses, from tools and equipment to lighting, heating and transport. When the power system infrastructure once has been built, there is an ease of use with electricity. Plugged in equipment can be left to take care of themselves, without user measures as refuelling, restarting, oiling etc.
The growing demand for energy has to slow down and even turn downwards in developed countries. EU is in the forefront of world policy development. Energy efficiency in EU has been given impressive targets to be reached by 2020, an improvement of 20%. And the trend will not stop in 2020, but continue. On the other hand, energy efficiency has a tendency to lead to increasing use of electricity, as several measures involve change from other fuels to electricity, as well as more control apparatus.
The demand for electricity in Finland as well as in the other Nordic countries, excluding Iceland, is taken into closer inspection in this study. Different sector trends are described, but especially two developments important for the future deserve a closer look: heat pumps and electric vehicles. And not just the annual energies, but the hourly loads, perhaps even with a keener eye. What will happen to the Finnish electricity peak load, if there are one million electric vehicles, amounting to half of all personal vehicles, in use?
The loads for heat pumps and charging of electric vehicles are estimated using specific detailed models. These load estimates are turned into traditional index series. The future total load curves of Finland and the Nordic countries are approximated using these estimated index series together with existing index series for different end uses.
Trends in electricity demand are looked at in Chapter 2. Chapter 3 gives an overview of how the Nordic hourly demand is modelled using load profiles, whereas Chapter 4 presents sectoral annual electricity consumption forecasts for the Nordic countries. Chapter 5 is an in-depth study of heat pumps and of how they might affect system load during peak load, whereas Chapter 6 does the same for electric vehicles. Chapter 7 shows aggregate results from Chapters 4, 5 and 6. Chapter 8 presents a short conclusion.
2. Trends in electricity demand by sector
9
2. Trends in electricity demand by sector
The value of the overall electricity consumption of a country is usually not that informative. We can compare countries to each other, but if we do not know the specifics of each country, then it is much harder to draw correct conclusions of the future consumption. Electricity consumption is here studied by sector, although heating is studied on its own. Electricity use for heating is quite high in Finland, Sweden and Norway. On the other hand, this represents a huge potential for electricity savings.
2.1 Drivers
The main driver or one of the main drivers of future demand trends is the technological development. Electricity is used to get tasks like refrigeration, heating, lighting, work etc done. The manufacturers are improving processes and designs constantly, usually resulting in same tasks being done with a whole lot of less energy and electricity.
The trends are not just technology based. Some small changes in electricity use and human behaviour can already today be noticed compared to the 20th century: stores have longer opening hours and are often open on Sundays as well, people are awake later in the evenings, and the use of warm water boilers is more irregular. Some changes concern the time when something is done, while others concern how much electricity is used. The impact of tariffs on loads for example will grow with the penetration of smart and real time metering and, by conjunction, dynamic tariffs. Loads will flatten out to a certain degree in the future, but it is difficult to say how much.
There is a lot going on at the moment affecting future demand. EU strives strongly to improve energy efficiency, which is resulting in new national and EU measures and directives etc being issued in a constant flow:
• Green Paper on Energy Efficiency, “Doing more with less” (COM(2005) 265) • Action Plan for Energy Efficiency (COM(2006) 545) • Energy Using Products -directive (EUP-directive, 2005/32/EC) • Energy Services -directive (ESD, 2006/32/EC)

2. Trends in electricity demand by sector
10
o National allocation plans, e.g. Finnish NEEAP for 2008–2010 issued 26.6.2007
o Energy efficiency and savings contracts with industry, service sector and the energy sector
o Motiva Efficiency programme for electric heating, ELVARI.
The ESD sets an indicative energy savings target of 9% (=17.8 TWh) between 2008 and 2016, compared to what would have been used otherwise. It is to be noted that early actions done before 2008 cover already 6.8 TWh by 2007. National allocation plans (NEEAP) of how to reach the target are issued every three years up to 2016. Action plan for energy efficiency goes even beyond ESD having a target of 20% energy savings by 2020.
Not all energy efficiency measures lead to a decrease of electricity use. On the contrary, several methods will increase electricity consumption considerably while diminishing overall energy use. Two current energy efficiency trends are of special interest in this respect, heat pumps and electric vehicles. They will be studied in more detail in chapters of their own.
End use trends are studied in different sectors and Nordic countries. Electricity demand per inhabitant is quite high in Finland, Sweden and Norway, as there is a lot of heavy industry situated here. Residential use is also high, but then North Europe has a cold climate to live in, and a very short daylight time during the winter. Besides, Scandinavia and Finland are wealthy compared to several other European areas, thus households are well equipped.
2.2 Heating systems
Heating and cooling consume at least 40% of all primary energy within the EU. Heating is an important part of life in cold regions. About 20% of energy used in Finland is for heating buildings and about a third part of that is used for heating small residential houses. Figure 1 shows the development of energy sources for heating between 1975 and 2006. In the early 1970’s there were mainly three heat sources, whereof oil was the most used. District heating was common only in larger cities, while wood heating was deployed in rural areas where wood was available free of charge from own forests. The oil crisis changed all that, oil use decreased rapidly hand in hand with the overall demand for heating energy, due to increased energy efficiency. The demand for heating has risen steadily since the early eighties, with sharp peaks at 1985–1988 due to a spell of cold winters. District heating has today the decidedly largest share of the heating market. Electricity use has grown, bringing it on the same level with oil and wood.

2. Trends in electricity demand by sector
11
0
10
20
30
40
50
60
70
1975 1980 1985 1990 1995 2000 2005
TWh
Biofuels Oil Peat and fossils District heat Electric heating Heat pumps
Figure 1. Energy sources for heating residential, commercial and public buildings in Finland between 1975 and 2006. Use of electricity for heating has increased considerably. Heat pumps (ground source heat etc.) have a small share, but the growth rate is high. Electricity used for heat pumps is not included here in the statistics of heat pumps, but are presumably more or less part of electric heating (data: Statistics Finland 2008).
Rising fuel and electricity prices as well as an increased environmental awareness has brought heating of houses and buildings to the fore once again. Several trends concerning heating can be observed:
• change of heating source in existing buildings
• climate change will diminish the need for heating, one estimate being with 12% by 2030
• changes in preferences of heat source to new buildings
• installation of auxiliary heating equipment like air-source heat pumps and solar heat panels to existing buildings
• increased heat recovery (e.g. from exhaust air and from food market refrigeration apparatus)
• new buildings are built to be more energy efficient because of better insulation
• the concepts of low-energy and passive houses are developed.
Although all kind of buildings are affected by the trends, detached houses are the most important ones in regard to changes. At the moment there are in Finland 260 000 small residential houses that use oil for heating and over 400 000 small residential houses that use purchased electricity for heating. The total number of detached houses is almost 1.1

2. Trends in electricity demand by sector
12
million in Finland at the end of 2007, of which just about 1 million are permanently inhabited.
The total floor area of the Finnish single family house stock is around 140 million m2, comprising 1.1 million houses, and is estimated to be 160 million m2 in year 2020, equalling approximately 1.2 million housing units. The main heating system in small residential houses of Finland is electricity, see Figure 2. If we compare the solutions chosen for new houses in 2005 and 2007 (Figure 3) to the existing shares in 2005, several trends can be seen. Electric heating is still the number one, although some of its momentum seems to have been lost. Use of oil is clearly decreasing, with almost no new houses selecting oil as their main heating system in 2007. Surprisingly, biomass is also recessing, which may be a result of price hikes of wood in recent years. Heat pumps are cornering the market really fast, having shares of 30% of the yearly market already in 2007. Air heat pumps are usually not used as main heat source, which is why they aren’t a separate entity in Figure 3. District heating is gaining markets, increasing its total share slowly but steadily. Will it be worthwhile in the future to connect at no low expense to the district heating network, if heat load drops significantly because of stricter efficiency standards?
0 % 20 % 40 % 60 % 80 % 100 %
ElectricityGround source heatWood, peatDistrict heatingOilOther
Figure 2. Heating systems of small Finnish residential houses (data: Finnish Oil- and Gas Federation 2008).
0 % 20 % 40 % 60 % 80 % 100 %
2005
2007ElectricityGround source heatBiomassDistrict heatingOilExhaust air heat pump
Figure 3. Main heating systems of new detached houses in 2005 and in 2007. Pellets comprised 4%-points of biomass share in 2007 (data: www.suomirakentaa.fi).

2. Trends in electricity demand by sector
13
Apartment and service buildings will keep to district or area heating if it’s only available. The second choice has been oil, but the future may be heat pumps. There is an increased interest for comfort at the same time, which could be an indicator for systems capable of cooling also.
The shares of various main fuels used in the single family houses are estimated for 2020 in Table 1. The estimates are based on the situation in 2006 and the number of new houses built in 2007. It was assumed that the amounts and shares would not change from year 2007 towards year 2020. The energy consumption of new houses is assumed to be the average of standard and low energy houses, estimations of which are given in Table 13 on page 47. The statistical classification of “free” or “new” heat generated by heat pumps is a bit vague at the moment. It is or sometimes isn’t part of the primary energy, usually it isn’t but sometimes it is part of final energy, and it is part of useful energy. For further reading the EU 2020 20% directive on renewable energy would be a good starting point, as well as IEA definitions and for example (Nowacki 2007).
“Free” energy generated by all heat pumps in 2006 is given in the table, as well as the estimated “free” energy by ground or exhaust air heat pumps in houses being built before 2020. The electricity use for ground or exhaust air heat pumps in new houses is explicitly given in the table, whereas the use in old houses (estimated as 1.2 TWh for all kinds of heat pumps) is not separated from overall electric heating.
The authors of this report see heat pumps as one of the major single heating issues that will impact the overall electricity demand. The scenario given in Table 1 will fold under the pressure of EU 202020 targets much in favour of heat pumps as the main source or at least part of a mixed source system both in new and in old houses. Therefore heat pumps are looked closer upon in Chapter 5, including several case calculations.

2. Trends in electricity demand by sector
14
Table 1. Estimated final energy consumption for detached houses in 2020 by fuel type as well as estimated number of housing units. The energy given for “Ground or air heat” pumps is the “free” heat generated by the pumps. The electricity used for heat pumps is presumably included in the electric heating data of 2006. It is calculated explicitly for new houses using ground or exhaust air heat pumps (data sources: MOTIVA 2008, year 2006 data: Statistics Finland).
Share of energy 2020
Wood 9.9 10.8 35 % 295 23 %
Oil 6.0 6.0 20 % 260 20 %
District heating 1.4 1.8 6 % 80 6 %
Other (peat, gas) 0.2 0.2 1 % 10 1 %
Ground or air heat* 2.3 2.9 10 % 110 8 %
Electricity 7.1 9.0 29 % 530 42 %
- electric heating 7.1 8.6 28 % 530 42 %-electricity for ground source
and air heat pumps (1.2) 0.4( +1.2) 1 % - -
Total 26.9 25.5 100 % 1285 100 %
Share of housing unitsFuel
Heating energy (TWh/a) 2006 *
Business as usual-estimate 2020
(TWh)
Estimated housing units 2020
(thousands)**
* Amount of free energy, i.e. useful energy – electricity used.
2.3 Residential
During the last decades the residential electricity consumption has been increasing quite fast around the world. Statistics indicate that appliances are the most rapidly growing end-use in the residential sector in certain industrialized countries, growth being 57% during period 1990–2005 (IEA 2008). Typically, more and more energy is used by entertainment appliances with rising standards of living.
Household electricity has experienced a steep and steady growth also in Finland, resulting in total demand in excess of 10 TWh, see Figure 4. With a steady state continuation the demand would reach 14 TWh by 2020.
According to a recent study (Adato 2008), the use of household electricity is estimated to peak before 2020 due to the renewal of the appliances. Additional saving potential of best available technology (BAT) compared to business as usual (BAU) in 2020 is also quite large, 2.5TWh or roughly 25%. The share of lightning of the saving potential is about half.

2. Trends in electricity demand by sector
15
0
2000
4000
6000
8000
10000
12000
14000
1960 1970 1980 1990 2000 2010 2020 2030 2040 2050 20600
2000
4000
6000
8000
10000
12000
14000
1960 1970 1980 1990 2000 2010 2020 2030 2040 2050 2060
Figure 4. Annual consumption [GWh] of household electricity, excluding heating and domestic hot water. Historical development starting from 1970, and baseline future up to 2050. (Source: KTM 2007)
The size of new detached houses has increased in the last 15 years by approximately 13%, from 155 m2 in 1990 to 176 m2 in 2007. More lighting and ventilation is needed for each household with the increased size. At the same time the number of inhabitants per household has decreased. In other words, there are more households per equal population. Each household needs at least the same basic apparatus, refrigerators, stoves, increasing the total household consumption.
To better understand changes in electricity consumption we need to decompose the usage into separate components. It is done as an example for household electricity in Figure 5. Statistical data time series used in the analysis is from (ODYSSEE 2006). The number of dwellings (activity) is increasing and at the same time their average floor area (structure) is also increasing. What is left of household electricity after these influences have been cleaned can be seen as the real electricity intensity of the households. It tells of changes in the stock of appliances and lighting. As can be seen, the intensity is increasing. Although single appliances get more and more efficient, their number is increasing more rapidly. Households have 2, 3 or 4 televisions instead of just one etc.

2. Trends in electricity demand by sector
16
0,8
0,9
1
1,1
1,2
1,3
1,4
1995 1996 1997 1998 1999 2000 2001 2002 2003
1995
=100
%
Actual Activity Structure Intensity
0,8
0,9
1
1,1
1,2
1,3
1,4
1995 1996 1997 1998 1999 2000 2001 2002 2003
1995
=100
%
Actual Activity Structure Intensity
Figure 5. Household electricity use (here “actual”) has increased, but it is not all because of increased electricity intensity (electricity consumption per m2) of households. Activity, seen as number of households, is almost as much to blame. And even structure, here as m2 per household, is pushing for more electricity consumption as the average household areas increase.
According to a recent study (Adato 2008), the largest consumption section (22%) of electricity in a household is nowadays for lighting. In older studies refrigeration devices constituted the largest section of household electricity use, but improved standards have had a very positive effect. The average specific electricity consumption for household PCs is approximately 500 kWh per year, matching the consumption of typical refrigerator/freezers (Adato 2008). The consumer electronics and ICT category including computers and computer equipment and numerous appliances as televisions, DVD players, set top boxes, stereo devices etc. are continuously increasing. A considerable share of their overall consumption comes from stand-by mode, as they are most of the time switched off. Other new electricity end uses are for example floor heating, which is becoming quite common. The Finnish specialty of installing electric saunas in apartments and houses is already accounting for 8% of electricity use, with a share estimated to keep rising.
Summer cottages will more and more be electrified, as they are turning into second homes instead of traditional cabins in the wilderness. Some will form autonomous electricity supply systems, but most of them will be connected to the grid. According to the Finnish Ministry of Employment and the Economy scenarios (TEM 2008), growth of electricity consumption in summer cottages will slow down, see Figure 6. On the other hand, summer cottages do have a potential for distributed generation, thus the net load effect might be a lot smaller in the future.

2. Trends in electricity demand by sector
17
Heating is installed in summer houses, where base heating is kept on during winter. As the heating system might be left to itself without surveillance for long spells, electricity is the safest choice. All of this increases the electricity demand. Booming numbers of installations of heat pumps, especially air heat pumps, will increase the use of electricity not only during the heating season, but also for cooling especially in the summer.
0
100
200
300
400
500
600
700
800
1995 2005 2015 2025 2035 2045
0
100
200
300
400
500
600
700
800
1995 2005 2015 2025 2035 2045
Figure 6. Electricity consumption [GWh] in summer cottages in Finland, historic development and future expectations. (Source: KTM 2007)
2.4 Industry
In the Nordic region electricity prices have historically been rather low because of the large share of cost-effective hydropower and nuclear. This has resulted in an abundance of energy-intensive industry in Nordic countries: in Finland, industry’s share of total electricity consumption is well over 50%. Energy and electricity costs make up a significant part of manufacturing industry’s total costs. In Nordic countries, the most energy-intensive sectors are basic metals and forest industry.
The development of industry’s electricity demand in the Nordic region depends on several factors. Among these are
• Economic growth • Structural changes (especially forest industry) • Electricity price development
2. Trends in electricity demand by sector
18
• Political decisions regarding emissions trading and emissions price development • Political decisions regarding Norwegian metal industry • Technology change and improvement • Development of energy saving and energy-efficiency • Choice of energy carrier (gas or electricity).
Historically, electricity demand has grown in pace of GDP. This coupling has recently weakened, since industry has restructured and become more energy efficient. In the future, high economic growth may not necessarily imply rising electricity demand. However, lower economic growth and current financial crisis will result in decreased electricity consumption resulting from manufacturing industry’s temporary lay-offs. In these cases, electricity demand will recover when economic situation changes.
Finland and Sweden have both a large share of pulp and paper industry. This branch is going through structural changes, largely attributed to overcapacity of paper production in Europe and hence low profitability. In both countries, forest companies have already announced several paper mill shutdowns, which will necessitate decreasing electricity demand.
Energy-intensive industry is also sensitive to electricity price development. In the long term, high electricity price will contribute to industry’s migration to countries, where production is more cost-effective (lower energy and labour costs).
Finnish forest industry company UPM has already in 2007 sold almost 2 TWh of electricity in the power market. After closing the Kajaani paper mill (by the end of 2008), electricity sold to the market rises by 1.2 TWh (Tekniikka ja Talous 17.10.2008). Another Finnish company Stora Enso has closed paper mills in Summa and in Kemijärvi. The power consumption diminished by 1.1 TWh, the bulk of which has been bought from the power market (Tekniikka ja Talous 17.1.2008).
In Norway, energy-intensive industry has had statutory priced electricity contracts. For instance in 2007, Statkraft sold 10.3 TWh of electricity to industry in statutory terms. With an average price of NOK 166/MWh, these statutory-priced contracts produced cash flows and profits that were substantially lower than they would have been had the same volume of electricity been sold on the open market. Compared with an average system price of NOK 224/MWh, the estimated revenue shortfall from these contracts totalled NOK 587 million in 2007 (Statkraft 2008). The state subsidy provisions of the EEC agreement place strict limitations on new agreements with power-intensive industry, and on special Norwegian arrangements that provide this industry with significant advantages. Statutory priced contracts should expire by the year 2011, but some companies have secured their power prices until 2020 with low priced long-term contracts. As these statutory priced power contracts expire, Norwegian industry will face the same electricity price as industries in Sweden and in Finland. In report “Elanvändningen i Norden om tio år” (Elforsk 2006), it is said, that political decisions regarding Norwegian energy-intensive industry’s electricity prices can change Nordic electricity consumption by as much as 20 TWh.

2. Trends in electricity demand by sector
19
2.5 Other sectors
2.5.1 Services and public consumption
The use of electricity is steadily growing in the service sector. The electricity consumption in different sub sectors of the service sector is shown in Figure 7 together with estimated trends according to the Ministry of Employment and the Economy. As can be seen, the consumption in commercial buildings is estimated to grow rapidly. The recent growth has been observable to everyone. New and large markets and malls rise like mushrooms in the rain all over, amounting to sizeable loads. Shops and markets are open longer and more often, for example on Sundays. In contrast, better and more energy efficient planning will help to keep the growth at bay, at least partly. For an example, more attention has lately been given to energy efficiency of freesers in markets and to heat recovery.
0
1000
2000
3000
4000
5000
6000
7000
2000 2005 2010 2015 2020 2025 2030 2035 2040 2045 2050 2055
commercial buildingsoffice buildingstransportation facilitiescaring industry facilitiesassembly facilitieseducational facilitiesstorage facilities
0
1000
2000
3000
4000
5000
6000
7000
2000 2005 2010 2015 2020 2025 2030 2035 2040 2045 2050 2055
commercial buildingsoffice buildingstransportation facilitiescaring industry facilitiesassembly facilitieseducational facilitiesstorage facilities
Figure 7. Electricity use (GWh) in the service sector, and estimated trends to 2050 according to the Ministry of Employment and the Economy. (Source: KTM 2007)
In the future, the growing use of ventilation and cooling systems will increase the number of motor devices in buildings, and thus their electricity loads. The yearly peak load takes already place in the summer in district heated city centres. District cooling on the other hand is expected to prosper especially in urban areas, reducing the need for electric air conditioning and cooling.

2. Trends in electricity demand by sector
20
The use of ICT in the service sector is another strong growth factor. But there are also positive trends to be seen. Laptop computers for example consume typically 50–80% less electricity than corresponding desktop models, and more and more desktop models are being changed to laptops.
2.5.2 Transportation
Electricity use in transportation is not a big thing at the moment. Depending on how the introduction of electric vehicles (EV) will succeed, it might grow. Assuming all personal vehicles in Finland were EVs, either full EVs or plug-in hybrids, the effect on the annual electricity consumption will be limited, around 7 TWh. On a Nordic level the total would be about 30 TWh, a huge amount but nevertheless only 7–8% of the total Nordic demand. It would nevertheless be one of the most noticeable additional impacts on the load, which is why EVs are studied closer in Chapter 6.
Electricity is used to power trains, trams and undergrounds. The use of electricity for rail transports is roughly 0.6 TWh in Finland. Trains in Denmark run mostly on oil or diesel, whereas Sweden and Norway are pretty well electrified already. If all other rail transports were converted to electricity in the Nordic countries, it would amount to less than a 1 TWh increase in power demand according to our preliminary indicative calculations.
2.5.3 Agriculture, mining
Average farm size is growing. The electricity load of modern large piggeries for example mostly resembles that of industrial plants. For the agricultural sector as a whole, quality management in itself is more and more important, resulting in more suitable storages, drying processes, ventilation etc. More and more automation, heating, cooling and other new equipment have increasing effects on the sector loads.
One example of large users of electricity is greenhouses. The more we users want to have locally grown vegetables and fruits better suited for warmer and sunnier countries, the more energy is needed, both for heating and lighting. Will tomato growing in the Nordic winter darkness be a fading fad, or more and more important, and if so, could LEDs be used to replace the current lighting equipment?
Electricity use for mining is quite small in Finland, although the new large mine in Talvivaara might change that. Mining techniques are also being electrified, which may increase the electricity consumption in mines.

3. Load profiles for aggregate (country-level) hourly demand
21
3. Load profiles for aggregate (country-level) hourly demand
In this Chapter the country-specific electricity demand models are described. Finnish customer-type specific electricity consumption indexes, load profiles, presented in Chapter 3.1 are used to model aggregate electricity demand at transmission system level for each country. The detailed annual electricity consumption figures for each sector are published by national statistics centres for Finland, Sweden, Norway and Denmark. The annual electricity consumptions for each index series used are derived from these net consumption figures.
The method is best suitable for Finland because the original measurements of electricity consumption used for the profiles are from Finland. Countries have some differences in electricity consumption; for example the characteristic Finnish sauna-peak on Saturday evening.
Year 2006 is used as a base year for the analysis, since this is the most recent one from which all the statistics are available. In the summer of 2006 there was a heat wave, and the summer was extremely warm in most parts of Europe followed by a mild autumn. This can be seen as a deviation of the measurement from the modelling results.
3.1 Load estimation with hourly consumption indexes – method
In this method hourly consumption time series are created on the basis of
• estimates of the yearly electricity consumption for different consumer sectors and • consumption indexes based on measurements at customer sites.
The consumption indexes used in the study originate from long time load research and are based on more than 1000 consumer load recordings. The load research was conducted by the Association of Finnish Electric Utilities from 1983 to 1994, and has since then been VTT’s responsibility (Seppälä 1996).
The consumption index system consists of two index series for each customer type. The seasonal index describes the power level in two-week-periods and consists hence of 26 values. The day indexes describe the hourly consumption for three types of days:

3. Load profiles for aggregate (country-level) hourly demand
22
weekdays, Saturdays and Sundays. Each two-week-period has its own day indexes, i.e. 3 x 24 values. Holidays and eves are modelled as Sundays and Saturdays respectively. As an example the indexes for four types of dwellings are shown in Figure 8 (seasonal indexes) and Figure 9 (day indexes from the first two-week-period).
020406080
100
120140160180200
1 3 5 7 9 11 13 15 17 19 21 23 25
two-week-period
seas
onal
inde
x
detached houses; direct electric heatingdetached houses; partly acc. electric heatingflats and terrace houses; no electric heatingblock of flats
Figure 8. Seasonal indexes for four types of dwellings.
0
1
2
3
4
5
6
07:00 19:00 07:00 19:00 07:00 19:00
pow
er /
aver
age
pow
er
detached houses; direct electric heatingdetached houses; partly acc. electric heatingflats and terrace houses; no electric heatingblock of flats
SaturdayWeekday Sunday
Figure 9. Day indexes relating to the two first weeks of the year for four types of dwellings.
The outdoor temperature impacts significantly on the electric heating load. A 1 ºC change in outdoor temperature results on average in a 4% change in the power consumption of temperature sensitive load. This can be included in the consumption index method for customer types with direct or accumulating electric heating.

3. Load profiles for aggregate (country-level) hourly demand
23
This fairly detailed method catches the consumption variations generally quite well. The largest uncertainty is brought by the fact that the consumption index method is developed for modelling of distribution network loads, not aggregate system load. The accuracy is still adequate to model structural changes in electricity demand. One uncertainty is, however, caused by the consumption indexes themselves as far as they are based on older historical data.
In aggregating country-level demand, consumption indexes of altogether 32 customer types are used. For simplicity and availability reasons load estimates are calculated to match long term average temperatures. The aggregation method could be improved by utilizing actual daily temperatures. Power losses (country specific) are added to the consumption time series as a last step.
For country-level load estimation, annual energy of each consumer type (index series) is required. These are derived from electricity consumption statistics. The distribution of the country-level annual energy among the 32 customer types has to be calibrated. The year 2006 is used as a calibration year. The calibration method is rather heuristic and based on long-time experience of using index series.
Firstly, sectorial energy statistics are linked with corresponding index series. Consumer groups used in statistical databases are not the same as those used in index series. Statistical energy consumptions are therefore linked to index series based on long time experience using load profiles. Factors taken into account:
• The amount and type of electric heating is largely country-dependent (see country-specific chapters).
• Industry’s electricity consumption is to a large extent modelled by invariable electricity use, as large-scale industrial power consumers have not been modelled as index series.
• Load volatility is smaller at the transmission system level than at the distribution network level, since load variations even out. Many of the consumer index series are aimed at modelling single customers’ electricity use. Aggregate load should be modelled by aggregate models.
Once a first approximation of energy distribution among load curves/index series is done, aggregated transmission level hourly load is calculated using index series and corresponding annual energies. Derived hourly system load estimates are then compared to actual electricity demand. If significant differences are found, the energy distribution among index series is adjusted and calculation is done again. This calibration procedure is repeated until results achieved are deemed to be good enough.
The calibration method and its results are robust. A more statistically sophisticated method could be used when deciding which index series to use for a sector. However, this could lead to a black box situation, where rationale would be lost.

3. Load profiles for aggregate (country-level) hourly demand
24
3.2 Finland
Households account for 12.2% of electricity consumption in Finland, and together with residential electric heating, the share is 21.6%. Some other sectors like holiday residences, real estate (housing company common consumption), other than household residential heating are also modelled with residential load profiles.
In Finland, there is a long tradition of using 2-time tariff systems for storing electric heating. Before electricity market deregulation, all 2-time tariff customers received cheaper energy between 10 p.m. and 6 a.m. Time of use tariffs are still commonly used for houses with electric heating, but the time limits vary. Most of the households still receive cheaper energy after 10 p.m. and this can be seen in the system load as a peak. The evening peak, however, helps lowering the overall system peak load, which takes place in the morning.
The largest industrial power consuming sector in Finland is pulp and paper industry (26.4 TWh electricity consumption in 2006) followed by metal industry (5.6 TWh) and chemical industry (4.8 TWh). Industry as a whole accounts for 55% of net power consumption. Most of the electricity-intensive industry run their processes constantly, and only a minor daily rhythm can be seen in electricity use. This industry is modelled by an invariable electricity load curve.
Finnish electricity consumption in 2006 by sector is presented in Table 2.

3. Load profiles for aggregate (country-level) hourly demand
25
Table 2. Electricity consumption in Finland 2006 (Statistics Finland 2008).
Sector Electricity consumption GWh
% of net consumption
Transport 675 0.8 %
Electric Heating 9 119 10.5 %Residential buildings 8 156 9.4 %Other 963 1.1 %
Industry 47 680 54.9 %Pulp and paper 26 439 30.5 %Basic metal 5 588 6.4 %Chemicals 4 871 5.6 %Machinery, electrical equipment 1 907 2.2 %Wood and wood products 1 643 1.9 %Food, beverages, tobacco 1 470 1.7 %Other 4 728 5.4
Households 10 564 12.2 %
Real estate 1 895 2.2 %
Holiday residences 525 0.6 %
Agriculture 900 1.0 %
Construction 270 0.3 %
Services and public sector 15 152 17.5 %
Net consumption 86 780 100.0 %Losses 3 244Total consumption (incl. losses) 90 024

3. Load profiles for aggregate (country-level) hourly demand
26
3.3 Sweden
In Sweden, electric heating in the service and public sector is quite common, compared to Finland. We have no load profiles for services with electric heating; neither do we have one for pure electric heating. Electricity consumptions of the sectors service and public consumption are therefore partly modelled by residential electric heating load curve. As a consequence, week-end electricity use is estimated too high, especially during Saturday nights (sauna). The share of accumulating electric heating is smaller in Sweden than in Finland.
In Sweden, pulp and paper sector has the largest electricity demand among the industry, 23.0 TWh in 2006. Thereafter follows basic metals (8.3 TWh) and chemicals (5.7 TWh). The structure of energy-intensive industry is quite similar to that of Finland, and can be modelled as a base load. Swedish electricity consumption in 2006 by sector is presented in Table 3.

3. Load profiles for aggregate (country-level) hourly demand
27
Table 3. Electricity consumption in Sweden 2006 (Statistics Sweden 2008).
SectorElectricity
consumption GWh
% of net consumption
Manufacturing industries, mining and quarries 57 406 42.4 %Mining and quarries 2 558 1.9 %
Food, beverages, tobacco 2 482 1.8 %
Wood and wood products 2 113 1.6 %
Pulp and paper 22 975 17.0 %
Chemicals 5 741 4.2 %
Basic metals 8 320 6.1 %
Machinery and metal products 3 418 2.5 %
Manufacture of motor vehicles 2 663 2.0 %
Other 7 136 5.3 %
Services 40 039 29.5 %Trade 5 814 4.3 %
Hotels and restaurants 1 458 1.1 %
Transportation 3 892 2.9 %
Post and telecommunications 740 0.5 %
Financial intermediation 539 0.4 %
Real estates 9 406 6.9 %
Rental services 1 423 1.1 %
Public 1375 1.0 %
Education and research 2 260 1.7 %
Health and social work 3 310 2.4 %
Sports, culture 1 782 1.3 %
Other service activities 1 020 0.8 %
Agriculture 3 252 2.4 %
Households 34 807 25.7 %Permanent 32 442 23.9 %
Summer cottages 2 365 1.7 %
Net consumption 135 504 100.0 %Losses 10 860
Total consumption (incl. losses) 146 364

3. Load profiles for aggregate (country-level) hourly demand
28
3.4 Norway
Electric heating is by far the most common heating system in Norway. 98% of all households have electrical space heating and/or floor heating. Two thirds of the all households have wood stoves, but as a supplement to electrical space heaters. About 8 percent of the households had a heat pump in 2006, the bulk of which being ambient air heat pumps (Statistics Norway 2008a).
In Norway, electric space heating is also used in non-residential sites. Electric heating is not compiled separately in statistics, and the amount of heating load must therefore be estimated by comparing the modelled and actual loads. Finnish load curves have no electric heating load profile without household electricity, as mentioned earlier, thus the heating load must be modelled by using residential electric heating profiles.
As in Sweden and Finland, Norway has a lot of electricity intensive industry. The largest single branch is primary aluminium with an annual consumption of 23 TWh.
Norwegian electricity consumption in 2006 by sector is presented in Table 4.

3. Load profiles for aggregate (country-level) hourly demand
29
Table 4. Electricity consumption in Norway 2006 (Statistics Norway 2008b).
SectorElectricity
consumption GWh
% of net consumption
Paper and paper products 5 297 4.8 %
Energy intensive manufacturing 33 860 30.5 %Industrial chemicals 6 158 5.5 %Iron, steel and ferroalloys 4 673 4.2 %Primary Aluminium 23 029 20.7 %
Mining, quarrying and other manufacturing industries 10 224 9.2 %
Transport and communication 1 892 1.7 %
Other industry and services 24 132 21.7 %District heating plants 651 0.6 %Construction 714 0.6 %Trade 4 840 4.4 %Hotels and restaurants 1 381 1.2 %Financial intermediation 436 0.4 %Public administration 3 026 2.7 %Education 2 448 2.2 %Health and social work 2 186 2.0 %Streets and road lightning 539 0.5 %Other service activities 7 910 7.1 %
Private households and agriculture 35 695 32.1 %Agriculture, forestry and fishing 1 604 1.4 %Private households 32 328 29.1 %Cottages and holiday houses 1 317 1.2 %Hot-houses 446 0.4 %
Net consumption 111 100 100.0 %Losses 10 073Total consumption (incl. losses) 122 255
3.5 Denmark
Electricity consumption structure in Denmark is different as compared to the other Nordic countries. The country itself is smaller by land area, with substantially smaller electricity use; net consumption of electricity is about 35 TWh, only one fourth of that in Sweden.

3. Load profiles for aggregate (country-level) hourly demand
30
Industrial energy consumption is less concentrated to energy-intensive manufacturing branches. Largest single electricity consuming industrial sector is food, beverages and tobacco (2.5 TWh), followed by chemicals (2.4 TWh).
Households account for 29% of electricity consumption. Electric heating load is smaller compared to the other countries.
Danish electricity consumption in 2006 by sector is presented in Table 5.
Table 5. Electricity consumption in Denmark 2006 (Danish Energy Agency 2007).
SectorElectricity
consumption GWh
% of net consumption
Industry 9 881 28.9 %Food, beverages and tobacco 2 504 7.3 %Textile and leather 211 0.6 %Wood and wood products 369 1.1 %Printing and paper 634 1.9 %Chemical 2441 7.1 %Non metallic mineral products 962 2.8 %Basic metal industry 251 0.7 %Foundry 261 0.8 %Fabricated metal industry 1 780 5.2 %Other 470 1.4 %
Households 9 946 29.1 %Multi-family houses 2 670 7.8 %One- and two family houses 7 276 21.3 %
Agriculture and gardening 2 584 7.6 %
Commerce and services 10 917 31.9 %Construction 378 1.1 %Retail and wholesale trade 3315 9.7 %Service- and entertainments business 2 797 8.2 %Public services 4427 12.9 %
Other consumption 885 2.6 %
Net consumption 34 210 100.0 %Losses 1 540Total consumption (incl. losses) 35 750

3. Load profiles for aggregate (country-level) hourly demand
31
3.6 Modelling results for year 2006
Correlation coefficients between hourly metered and estimated load for the whole year are shown in Table 6. The modelled curve is adjusted to the metered annual energy, so that statistical differences do not contribute to estimation accuracy. The largest single error source is temperature, which was not used. Load estimates were made to match long-term average outdoor temperature, not actual temperatures 2006 in the different countries. The estimated load for Denmark has the highest correlation coefficient because Denmark has the lowest share of electric heating, whereby temperature dependent variation is smallest.
Table 6. Correlation coefficients for year 2006 between metered and estimated hourly load.
Country Correlation coefficientFinland 87.7
Sweden 90.3
Norway 90.9
Denmark 92.2 Modelled and realised annual loads for each country are shown in Figure 10, and summed load curves for whole Nordic region are shown in Figure 11. Generally, load profiles provide rather good estimates of the annual distribution of the system load. Year 2006 had a very warm summer and a mild autumn, and as no temperature data was used in the model, estimated loads are too high. Neither do the estimated loads capture the temperature dependent load variation during winter months.
Basic industry is modelled by invariable load, and annual holidays are not included in the model. Manufacturing industry has stoppages during Easter, Midsummer and Christmas, but the load model does not recognise this.

3. Load profiles for aggregate (country-level) hourly demand
32
Finland
0
500
1000
1500
2000
2500
Jan-06 Feb-06 Apr-06 May-06 Jul-06 Sep-06 Oct-06 Dec-06
GW
h/w
eek
Sweden
0
500
1000
1500
2000
2500
3000
3500
4000
Jan-06 Feb-06 Apr-06 May-06 Jul-06 Sep-06 Oct-06 Dec-06
GW
h/w
eek
Norway
0
500
1000
1500
2000
2500
3000
3500
Jan-06 Feb-06 Apr-06 May-06 Jul-06 Sep-06 Oct-06 Dec-06
GW
h/w
eek
Denmark
0
100
200
300
400
500
600
700
800
900
Jan-06 Feb-06 Apr-06 May-06 Jul-06 Sep-06 Oct-06 Dec-06
GW
h/w
eek
Metered load VTT load curve estimate
Finland
0
500
1000
1500
2000
2500
Jan-06 Feb-06 Apr-06 May-06 Jul-06 Sep-06 Oct-06 Dec-06
GW
h/w
eek
Sweden
0
500
1000
1500
2000
2500
3000
3500
4000
Jan-06 Feb-06 Apr-06 May-06 Jul-06 Sep-06 Oct-06 Dec-06
GW
h/w
eek
Norway
0
500
1000
1500
2000
2500
3000
3500
Jan-06 Feb-06 Apr-06 May-06 Jul-06 Sep-06 Oct-06 Dec-06
GW
h/w
eek
Denmark
0
100
200
300
400
500
600
700
800
900
Jan-06 Feb-06 Apr-06 May-06 Jul-06 Sep-06 Oct-06 Dec-06
GW
h/w
eek
Metered load VTT load curve estimateMetered load VTT load curve estimate
Figure 10. Estimated and metered countrywise load curves in 2006.

3. Load profiles for aggregate (country-level) hourly demand
33
0
2000
4000
6000
8000
10000
12000
Jan-06 Feb-06 Apr-06 May-06 Jul-06 Sep-06 Oct-06 Dec-06
GW
h/w
eek
Metered load VTT load curve estimate
Figure 11. Estimated and metered load curves for the Nordic electricity market area in 2006.
Average hourly load curves for each season are shown in Figure 12 through 15. Winter season comprises months December, January and February; spring season comprises March, April and May; summer comprises June, July and August, and autumn comprises September, October and November. Average measurement hour values for each day type are calculated as an arithmetic average of each seasons’ corresponding hours. Because of the seasonal averages, temperature fluctuations are evened out, giving a better comparison for the model’s overall performance to be judged by.
Generally, modelled load curves provide good estimates of the actual load, especially considering the aggregation level of the model. Load profiles were originally developed for load modelling in a distribution network, and are not intended to be used in estimation on the transmission system level. The aim here was not to model load to be used for state estimation of the transmission system. The aim was to provide a model which can be used in making scenarios of structural changes in the electricity consumption.

3. Load profiles for aggregate (country-level) hourly demand
34
0
5000
10000
15000
20000
25000
30000
0:00 12:00 0:00 12:00 0:00 12:00 0:00 12:00 0:00 12:00 0:00 12:00 0:00 12:00
MW
h
FI, metered FI, estimated SE, metered SE, estimatedNO, metered NO, estimated DK, metered DK, estimated
Sweden Norway
Finland Denmark
0
5000
10000
15000
20000
25000
30000
0:00 12:00 0:00 12:00 0:00 12:00 0:00 12:00 0:00 12:00 0:00 12:00 0:00 12:00
MW
h
FI, metered FI, estimated SE, metered SE, estimatedNO, metered NO, estimated DK, metered DK, estimated
Sweden Norway
Finland Denmark
Figure 12. Average week in winter 2006, modelled and metered loads.
0
5000
10000
15000
20000
25000
0:00 12:00 0:00 12:00 0:00 12:00 0:00 12:00 0:00 12:00 0:00 12:00 0:00 12:00
MW
h
FI, metered FI, estimated SE, metered SE, estimatedNO, metered NO, estimated DK, metered DK, estimated
Sweden Norway
Finland Denmark
0
5000
10000
15000
20000
25000
0:00 12:00 0:00 12:00 0:00 12:00 0:00 12:00 0:00 12:00 0:00 12:00 0:00 12:00
MW
h
FI, metered FI, estimated SE, metered SE, estimatedNO, metered NO, estimated DK, metered DK, estimated
Sweden Norway
Finland Denmark
Figure 13. Average week in spring 2006, modelled and metered loads.

3. Load profiles for aggregate (country-level) hourly demand
35
0
2000
4000
6000
8000
10000
12000
14000
16000
18000
20000
0:00 12:00 0:00 12:00 0:00 12:00 0:00 12:00 0:00 12:00 0:00 12:00 0:00 12:00
MW
h
FI, metered FI, estimated SE, metered SE, estimatedNO, metered NO, estimated DK, metered DK, estimated
Sweden Norway
Finland Denmark
0
2000
4000
6000
8000
10000
12000
14000
16000
18000
20000
0:00 12:00 0:00 12:00 0:00 12:00 0:00 12:00 0:00 12:00 0:00 12:00 0:00 12:00
MW
h
FI, metered FI, estimated SE, metered SE, estimatedNO, metered NO, estimated DK, metered DK, estimated
Sweden Norway
Finland Denmark
Figure 14. Average week in summer 2006, modelled and metered loads.
0
5000
10000
15000
20000
25000
0:00 12:00 0:00 12:00 0:00 12:00 0:00 12:00 0:00 12:00 0:00 12:00 0:00 12:00
MW
h
FI, metered FI, estimated SE, metered SE, estimatedNO, metered NO, estimated DK, metered DK, estimated
Sweden Norway
Finland Denmark
0
5000
10000
15000
20000
25000
0:00 12:00 0:00 12:00 0:00 12:00 0:00 12:00 0:00 12:00 0:00 12:00 0:00 12:00
MW
h
FI, metered FI, estimated SE, metered SE, estimatedNO, metered NO, estimated DK, metered DK, estimated
Sweden Norway
Finland Denmark
Sweden Norway
Finland Denmark
Figure 15. Average week in autumn 2006, modelled and metered loads.

4. Electricity demand scenarios by country
36
4. Electricity demand scenarios by country
Nordic countries have made electricity demand scenarios for coming decades. In this Chapter, these scenarios are shortly presented. Country-specific demand scenarios are aggregated to a Nordel level demand scenario in Chapter 7.
For comparison, electricity consumption by sector in 2006 is shown in Table 7 and Figure 16. Nordel has published statistics for the year 2007 also, but more detailed statistical information about electricity consumption from national statistics centres for the year 2007 was not available in autumn 2008, when the modelling was done. Hence, year 2006 is used as a base year for load modelling in this report.
Table 7. Electricity consumption in Nordic region 2006 (data Nordel Annual Statistics 2006).
Denmark Finland Norway Sweden Sum
Total consumption 36 392 90 111 122 572 146 366 405 366
Occasional power to electric boilers - 56 3 513 1 312 5 052
Gross consumption 36 392 90 055 119 059 145 054 400 314
Gross temp correct consumption 36 520 90 683 123 018 146 923 406 800
Losses 2 092 3 398 9 280 11 260 26 499
Pumped storage power 0 - 540 50 590
Net consumption 34 300 86 657 109 239 133 744 373 225
- housing 9 800 20 900 35 503 40 100 107 237
- industry (incl. energy sector) 10 100 50 163 48 393 59 900 175 461
- trade and services (incl. transport) 11 400 14 694 23 703 27 300 78 060
- other (incl. agriculture) 3 000 900 1 640 6 444 12 418

4. Electricity demand scenarios by country
37
29 %
24 %
32 %
30 %
30 %
58 %
44 %
45 %
33 %
17 %
21 %
20 %
9 %
1 %
5 %
1 %
0 20 40 60 80 100 120 140 160
Denmark
Finland
Norway
Sweden
TWh
Housing Industry (incl. energy sector) Trade and services (incl. transport) Other (incl. agriculture)
29 %
24 %
32 %
30 %
30 %
58 %
44 %
45 %
33 %
17 %
21 %
20 %
9 %
1 %
5 %
1 %
0 20 40 60 80 100 120 140 160
Denmark
Finland
Norway
Sweden
TWh
Housing Industry (incl. energy sector) Trade and services (incl. transport) Other (incl. agriculture)
Figure 16. Electricity net consumption 2006 by sector for Nordic countries, excluding Iceland (data Nordel Annual Statistics 2006).
4.1 Finland
The Finnish Ministry of Employment and the Economy published a National Climate and Energy Strategy in November 2008 (TEM 2008). The total consumption in a baseline and vision/target scenarios are presented in Figure 17 and in Table 8. The consumption in the target scenario is expected to be significantly lower than that in the base case-scenario, electricity consumption even stays below 100 TWh and slowly starts to decrease sometimes after 2020.

4. Electricity demand scenarios by country
38
0
20
40
60
80
100
120
140
1960 1970 1980 1990 2000 2010 2020 2030 2040 2050
TWh
Industry and Construction Housing
Electric Heating Services and Public Sector
Traffic and Agriculture Losses
Baseline Target scenario
Vision scenario Industry forecast
Figure 17. Electricity consumption in Finnish scenarios (TEM 2008 and EK 2007).
Table 8. Finnish electricity consumption scenarios (TEM 2008).
TWh 2006 2007
Baseline Target Baseline Vision Baseline Vision Baseline Vision
Industry and building 48.0 48.5 56 56 58 61 63
Households 13.0 12.5 15 13 16 17 18
Electric heating 9.1 9.0 10 8 9 9 8
Services 15.2 15.2 18 16 19 20 20
Other 1.6 1.8 2 2 2 2 3
Losses 3.2 3.3 4 4 4 4 4
Total 90.0 90.3 103 99 108 95 113 90 116 80
2020 2030 2040 2050
The Confederation of Finnish Industries EK and the Finnish Energy Industry have published their expectations on the electricity demand development in Finland (EK 2007). According to the report the consumption will be 107 TWh in 2020 and about 115 TWh in 2030. The increase is expected to be the highest within metal industry and
4. Electricity demand scenarios by country
39
the service sector. The report assumes the electricity use to become more efficient but this is compensated by the economic growth and increased use of products and services. Electrical heating is presumably increasing as well, but less than what the organisations predicted in 2004.
It can be concluded that there are large differences in the views on how the demand will develop in the future. In this report, the scenarios of Finnish Ministry of Employment and the Economy are used as primarily sources for the aggregate demand scenarios reported in Chapter 7 in this report.
4.2 Sweden
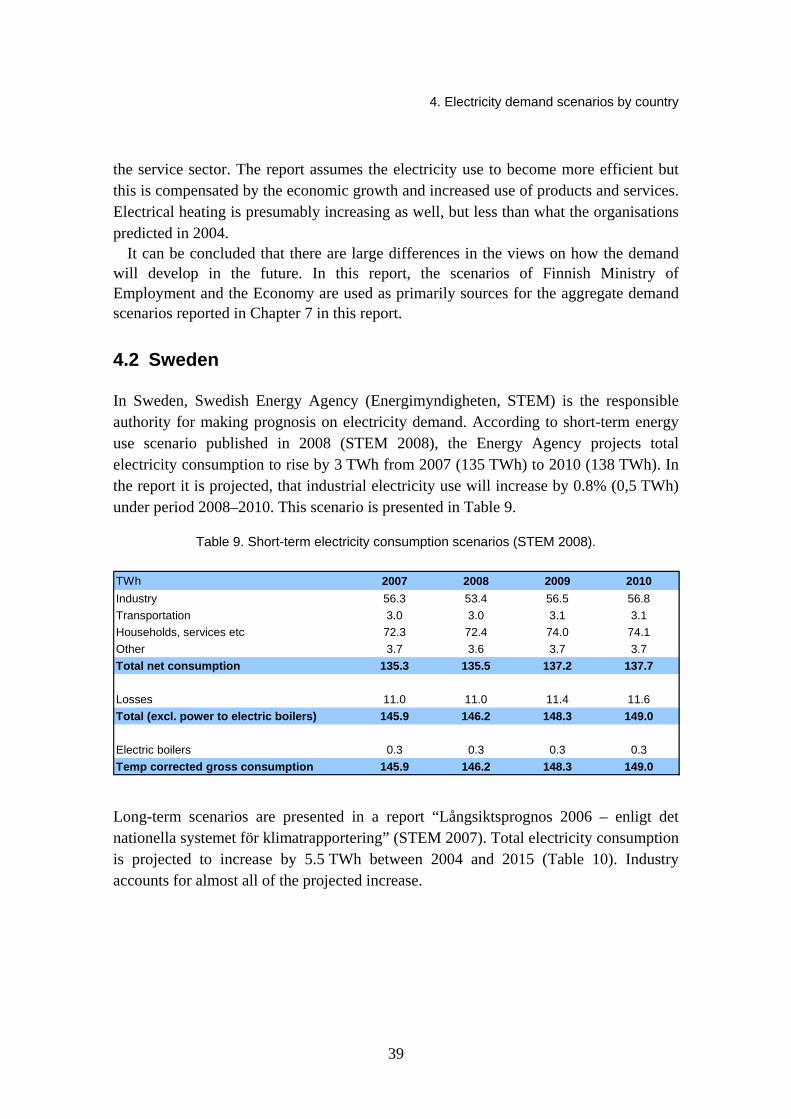
In Sweden, Swedish Energy Agency (Energimyndigheten, STEM) is the responsible authority for making prognosis on electricity demand. According to short-term energy use scenario published in 2008 (STEM 2008), the Energy Agency projects total electricity consumption to rise by 3 TWh from 2007 (135 TWh) to 2010 (138 TWh). In the report it is projected, that industrial electricity use will increase by 0.8% (0,5 TWh) under period 2008–2010. This scenario is presented in Table 9.
Table 9. Short-term electricity consumption scenarios (STEM 2008).
TWh 2007 2008 2009 2010Industry 56.3 53.4 56.5 56.8Transportation 3.0 3.0 3.1 3.1Households, services etc 72.3 72.4 74.0 74.1Other 3.7 3.6 3.7 3.7Total net consumption 135.3 135.5 137.2 137.7
Losses 11.0 11.0 11.4 11.6Total (excl. power to electric boilers) 145.9 146.2 148.3 149.0
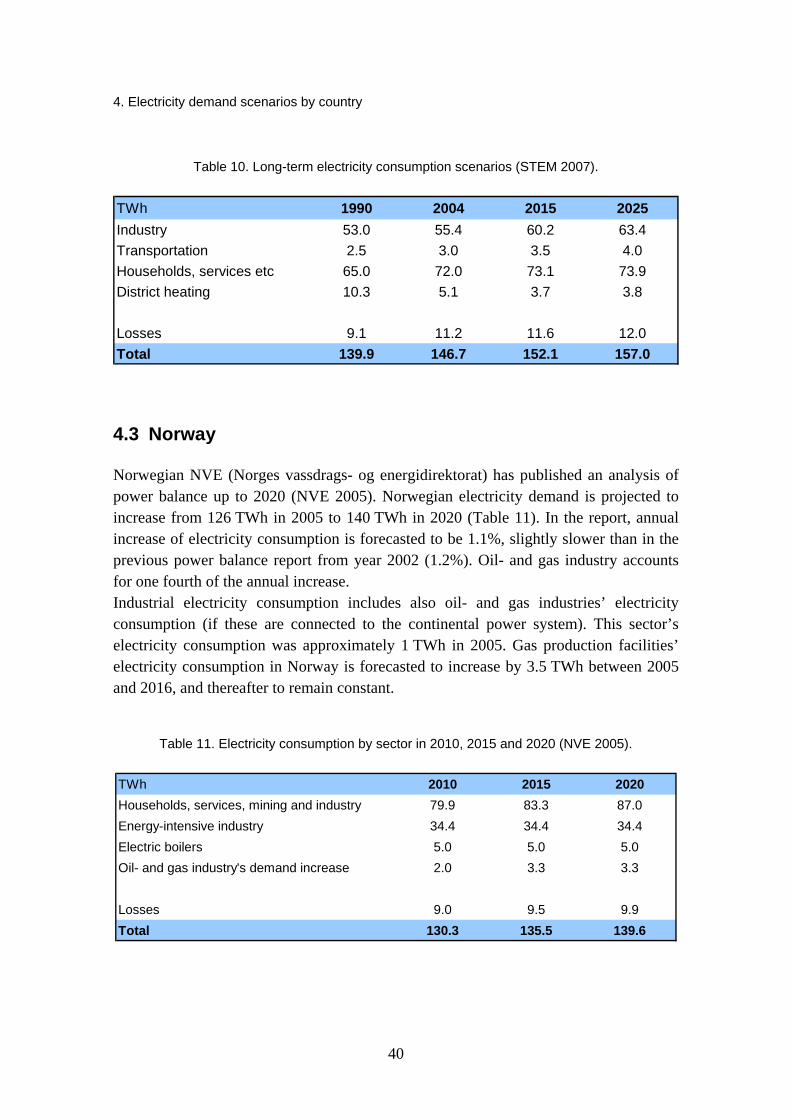
Electric boilers 0.3 0.3 0.3 0.3Temp corrected gross consumption 145.9 146.2 148.3 149.0 Long-term scenarios are presented in a report “Långsiktsprognos 2006 – enligt det nationella systemet för klimatrapportering” (STEM 2007). Total electricity consumption is projected to increase by 5.5 TWh between 2004 and 2015 (Table 10). Industry accounts for almost all of the projected increase.
4. Electricity demand scenarios by country
40
Table 10. Long-term electricity consumption scenarios (STEM 2007).
TWh 1990 2004 2015 2025Industry 53.0 55.4 60.2 63.4Transportation 2.5 3.0 3.5 4.0Households, services etc 65.0 72.0 73.1 73.9District heating 10.3 5.1 3.7 3.8
Losses 9.1 11.2 11.6 12.0Total 139.9 146.7 152.1 157.0
4.3 Norway
Norwegian NVE (Norges vassdrags- og energidirektorat) has published an analysis of power balance up to 2020 (NVE 2005). Norwegian electricity demand is projected to increase from 126 TWh in 2005 to 140 TWh in 2020 (Table 11). In the report, annual increase of electricity consumption is forecasted to be 1.1%, slightly slower than in the previous power balance report from year 2002 (1.2%). Oil- and gas industry accounts for one fourth of the annual increase. Industrial electricity consumption includes also oil- and gas industries’ electricity consumption (if these are connected to the continental power system). This sector’s electricity consumption was approximately 1 TWh in 2005. Gas production facilities’ electricity consumption in Norway is forecasted to increase by 3.5 TWh between 2005 and 2016, and thereafter to remain constant.
Table 11. Electricity consumption by sector in 2010, 2015 and 2020 (NVE 2005).
TWh 2010 2015 2020Households, services, mining and industry 79.9 83.3 87.0Energy-intensive industry 34.4 34.4 34.4Electric boilers 5.0 5.0 5.0Oil- and gas industry's demand increase 2.0 3.3 3.3
Losses 9.0 9.5 9.9Total 130.3 135.5 139.6

4. Electricity demand scenarios by country
41
4.4 Denmark
Danish transmission system operator Energinet.dk publishes yearly electricity demand scenarios. The 2008 scenario covers the period 2007–2026 (Energinet.dk 2008). The scenario is based on assumptions made on economic development (Danish Ministry of Finance), energy prices (electricity forward prices from Nord Pool and IEA’s fossil fuels price forecasts) and on assumptions made of structural changes and improvements of energy efficiency. In 2008, electricity demand forecast was downwarded due to high energy prices and lower economic growth anticipations.
According to Energinet, electricity consumption is forecasted to grow from 34.2 TWh in 2006 to 40.4 TWh in 2026. Electricity demand forecast for 2020 is 37.5 TWh. Annual demand growth is projected to be ca 1%. Electricity demand scenario is presented in Table 12.
Table 12. Danish electricity demand scenarios (Source Energinet 2008).
TWh 2010 2015 2020 2026
Households 9.9 10.1 10.4 10.9
Agriculture 2.6 2.7 2.8 2.9
Industry 10.3 10.2 10.5 11.5
Trade and services 12.3 12.9 13.8 15.2
Total 35.0 36.0 37.5 40.4
Danish Energy Authority (DEA) has also recently published electricity scenarios up to 2025 (DEA 2008). These scenarios are significantly lower compared to Energinet’s scenarios, giving for example a net consumption of 34.1 TWh in 2020 compared to Energinet’s 37.5 TWh. In the DEA forecasts up to 2025 the consumption will not exceed that of year 2007.

5. Heat pumps
42
5. Heat pumps
In this Chapter heat pumps are scrutinised more closely, and especially their effect on the power system. A short description of the different types of heat pumps in use is given, followed by some estimates on numbers and consumptions. One main question concerning heat pumps is how old oil heated houses converted to heat pumps would affect the power system and electricity demand. There is at the moment only one generic heat pump load profile available, including household electricity. To get a more realistic estimate of different heat pump load curves, hourly load profiles were calculated using a sophisticated household heating flow model (VTT House Model) and a realistic temperature time series. The estimated changes in hourly system load due to households converting to heat pumps are studied using year 2006 actual system peak loads as basis.
5.1 Heat pump types
There are several types of heat pumps, both depending on from where they pump heat and where they deliver it. Some combinations are expensive investments, as ground source heat pumps, some less expensive, as air-air heat pumps. The lower the distribution temperature of a heating system, the greater is its efficiency. For example, low-temperature floor heating has a significantly higher efficiency than a conventional radiator heating system.
Compressors and pumps in the system consume electricity. The ratio of produced heat to consumed electricity is described by the Coefficient of Performance (COP) of the heat pump. The momentary COP for a specific heat pump varies second by second, but in the statistic sense COP must be understood as the yearly average. The yearly average COP is often referred to as the Seasonal Performance Factor (SPF) just to indicate that it has been integrated over a year. Although COP can be quite high under ideal conditions, the annual average is more moderate due to less than ideal conditions as well as the use of auxiliary electric heating element. Heat pumps are usually equipped with an electric heating element, which can supply heat for peak load especially during the coldest winter days.

5. Heat pumps
43
5.1.1 Ground source heat pump
Ground source heat pump systems are becoming more and more competitive, and increases in electricity and oil prices will definitely improve their position. Moreover, as the global market for heat pumps has not yet matured and the technologies are still evolving, the investment cost per heat output can be expected to fall.
There are several ways to install heat collectors, as shown in Figure 18. One way is to bury collector pipes at the depth of 0.7–1.2 m, and 1.5 m apart. As the heat demands extensive piping, it is suitable only if the available land area is large enough and the ground appropriate. Another solution is to bore 100–200 m deep holes, and a third to put pipes in lakes. Lakes should be deep enough not to freeze to the bottom in the winter. (SULPU 2008)
Figure 18. Different types of ground source heat pump installations: bore hole, in the ground, in the lake. (Source: SULPU 2008)

5. Heat pumps
44
Ground heat pumps are usually equipped with an electrical heating element, which can supply heat during the coldest winter days. Dimensioning of the heat pump is either done according to full load or matching 60%...80% of the peak. 60% of peak is already enough to produce 90% of heating energy needed, including domestic hot water. COP is currently in the range 2.6–3.6 in the Finnish climate. Calculated from statistics at Finnish Heat Pump Association SULPU, the average COP of all installed heat pumps is 2.9. (SULPU 2008, Heljo 2008a)
5.1.2 Air heat pumps
Air heat pumps, using ambient air as heat source, represent an alternative option for reducing external energy consumption in buildings. They are typically used only as supplementary heat sources. Both investment and assembly costs of an air heat pump are, under present market conditions, substantially lower than that of a ground heat pump. The more so for an air-air heat pump than for an air-water heat pump that delivers its heat to a water-based heating system including or excluding domestic hot water (DHW). COP of air heat pumps varies strongly in relation to outdoor temperature. When the outdoor temperature falls down to below -20…-25°C, modern air heat pumps have only a small advantage. According to a Swedish study, heat pumps seem to have an increasing sensitivity to temperature at falling outdoor temperatures. It is a lot less, though, than initially feared (Larsson 2006). It is to be noted that switching off of heat pumps was expected to take place already at -5°C. One reason for this high temperature is that the air heat pump stock in Sweden is quite old compared to present technology. However, they didn’t find statistical evidence of this to happen, and not even to a significant degree at -15°C. But, -15°C days were rare occurrences in the study material.
Based on statistics from (SULPU 2008), the national COP-average of installed air heat pumps is 1.9. The air heat pump technology has made great progress in recent years and new air heat pumps have decidedly better COP than older ones.
Successful implementation of an air heat pump system can lead to 40–50% savings in the electrical heating of detached houses, but it does not have any substantial effect on reducing national power capacity. In summer, the air-air heat pump can be used as a cooler, but the superfluous electricity consumption at summertime overrides part of the electricity savings achieved in wintertime. (SULPU 2008, Heljo 2008a)
5.1.3 Exhaust air heat pumps
Exhaust air heat pumps are integrated into the exhaust air side of the ventilation system, and the heat recovered can be used for water-based heating and especially for domestic hot water. The delivered heat can very well raise the temperature to 50°C, which is

5. Heat pumps
45
almost suitable for DHW. The temperature of the DHW can be raised to 55°C using an auxiliary electric resistance. (SULPU 2008, Heljo 2008a)
Exhaust air heat pumps need an adequate rate of air exchange. The dimensioning of the heat pump is usually done for a rate of 0.5 per hour, meaning that one half of the indoor air will be changed during one hour. Many users turn down the rate of air exchange at cold spells, thus lowering the heat to be obtained from the heat pump. Extra heat is then needed, and it is usually produced with electric resistance etc. (SULPU 2008, Heljo 2008a)
Based on statistics from (SULPU 2008), the national COP-average of installed air heat pumps is 1.8.
5.2 Heat pumps in the Nordic countries
Finland is quite successful in implementing heat pumps on a European level. The amount of heat pumps in Finland is approximately 150 000, whereof 100 000 are air-source heat pumps and 40 000 ground source heat pumps. Ground source heat pumps are nevertheless clearly more influential if we look at the heat production. The amount of heat pumps increased in Finland with 40% in 2007. Yearly annual sales are approaching (and will in 2008 surpass) 50 000 heat pumps. Heat pumps gathered 2.8 TWh of “free” heat in 2007 (see Figure 19). (SULPU 2008)
0
1000
2000
3000
4000
5000
6000
1976
1978
1980
1982
1984
1986
1988
1990
1992
1994
1996
1998
2000
2002
2004
2006
GW
h
Electricity Ground or air source heat
0
1000
2000
3000
4000
5000
6000
1976
1978
1980
1982
1984
1986
1988
1990
1992
1994
1996
1998
2000
2002
2004
2006
GW
h
Electricity Ground or air source heat
Figure 19. Heating produced by heat pumps in Finland 1976–2007. The useful energy (heating) from heat pumps is more than double the electricity used as input. Most energy production is from ground source heat pumps, although air heat pumps are more numerous. (Data from SULPU 2008)

5. Heat pumps
46
There are 40 000 heat pumps in Denmark, whereof 5 000 are ground source heat pumps. Heat pumps in Denmark suffered from a bad reputation after the initial introduction in the early 1970’ies, which thanks to quality assurance programs in the 1980’s has been slowly overturned. (EHPA 2008)
Norway had 55 000 new heat pump installations in 2006 and 70 000 in 2007, over 90% of which were air-air heat pumps. The rate of installations is a bit higher in Norway than in Finland. On the other hand, the installed stock of ground source heat pumps amounts to just 16 500, only one-third of that of Finland. (EHPA 2008)
Sweden is the European leader in heat pumps with 700 000 installations in 2007. Exhaust air/heat recovery heat pumps hold a strong position in new construction of single family houses. Their market share in this segment is exceeding 90%. Recent developments for air-water heat pumps have resulted in a number of new highly efficient models, which have led to an increased interest for this type of heat pumps. Due to improved heat pump technology, air-air heat pumps have become the most obvious choice to improve energy efficiency in direct electric heated houses in Sweden. (EHPA 2008)
Sweden has also large heat pumps, which are used for example for district heat production. The energy production of heat pumps in Sweden is described in Figure 20. Using 7.5 TWh of final energy in the form of electricity a total of 22.5 TWh useful heating energy is made available. A sizeable share though is produced in the district heating sector.
Figure 20. Heat pumps (HP) capture solar energy from air, water and ground. Sweden 2007. (Source: Nowacki 2007)
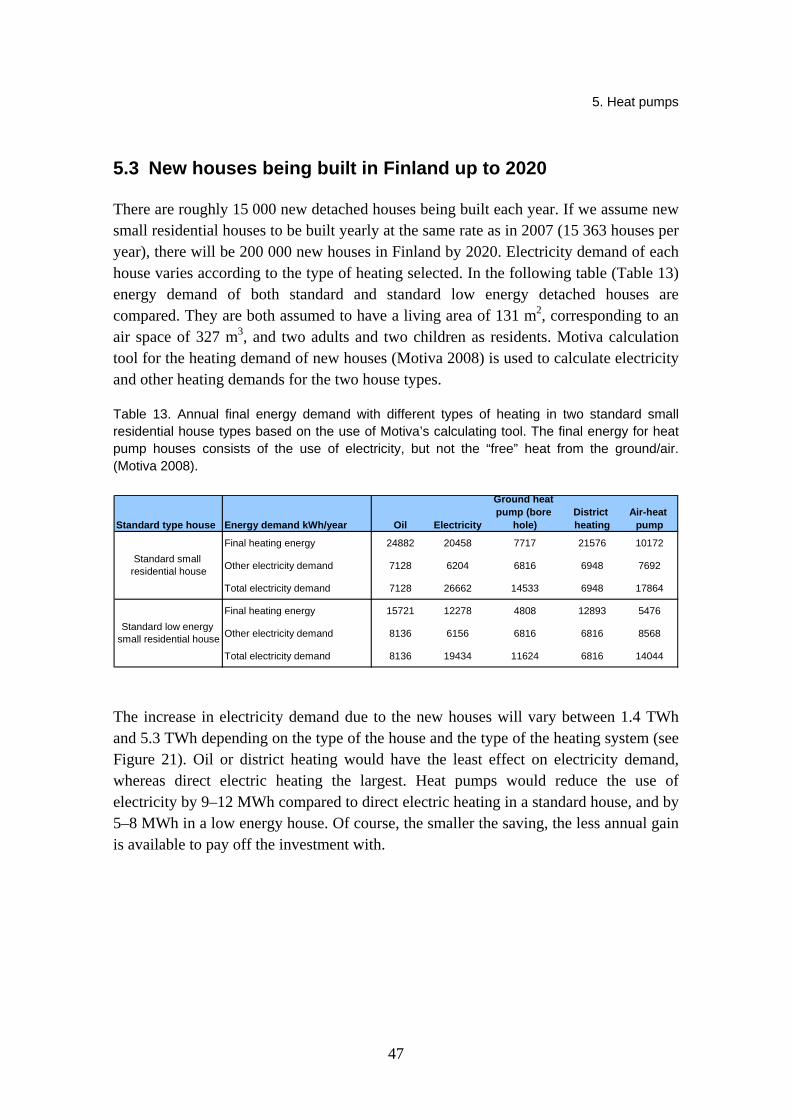
5. Heat pumps
47
5.3 New houses being built in Finland up to 2020
There are roughly 15 000 new detached houses being built each year. If we assume new small residential houses to be built yearly at the same rate as in 2007 (15 363 houses per year), there will be 200 000 new houses in Finland by 2020. Electricity demand of each house varies according to the type of heating selected. In the following table (Table 13) energy demand of both standard and standard low energy detached houses are compared. They are both assumed to have a living area of 131 m2, corresponding to an air space of 327 m3, and two adults and two children as residents. Motiva calculation tool for the heating demand of new houses (Motiva 2008) is used to calculate electricity and other heating demands for the two house types.
Table 13. Annual final energy demand with different types of heating in two standard small residential house types based on the use of Motiva’s calculating tool. The final energy for heat pump houses consists of the use of electricity, but not the “free” heat from the ground/air. (Motiva 2008).
Standard type house Energy demand kWh/year Oil Electricity
Ground heat pump (bore
hole)District heating
Air-heat pump
Final heating energy 24882 20458 7717 21576 10172
Other electricity demand 7128 6204 6816 6948 7692
Total electricity demand 7128 26662 14533 6948 17864
Final heating energy 15721 12278 4808 12893 5476
Other electricity demand 8136 6156 6816 6816 8568
Total electricity demand 8136 19434 11624 6816 14044
Standard small residential house
Standard low energy small residential house
The increase in electricity demand due to the new houses will vary between 1.4 TWh and 5.3 TWh depending on the type of the house and the type of the heating system (see Figure 21). Oil or district heating would have the least effect on electricity demand, whereas direct electric heating the largest. Heat pumps would reduce the use of electricity by 9–12 MWh compared to direct electric heating in a standard house, and by 5–8 MWh in a low energy house. Of course, the smaller the saving, the less annual gain is available to pay off the investment with.

5. Heat pumps
48
0
1000
2000
3000
4000
5000
6000
2008
2009
2010
2011
2012
2013
2014
2015
2016
2017
2018
2019
2020
year
Electricity demand /GWh/a
Oil (SH)
Electric (SH)
Ground heat (pore hole+heat pump) (SH)District (SH)
Air-heat pump (SH)
Oil (LEH)
Electric (LEH)
Ground heat (pore hole+heat pump) (LEH)District (LEH)
Air-heat pump (LEH)
Figure 21. Change of electricity demand in Finland from 2007 to 2020 due to new small residential houses according to different heating types selected. All new houses are expected to be standard (+) or low energy (o) houses. Annual growth rate of 15 363 is assumed (matching 2007). Electricity consumption is based on the calculations done with Motiva calculation tool (Motiva 2008).
5.4 Load profiles for heat pumps
5.4.1 Methods
The hourly heating demand data of the selected single family houses was generated using dynamic simulation program VTT House. This heating data was manually post processed and combined to the heat pump systems in Excel spreadsheet calculation.
The Jyväskylä weather data was selected to be the representative average weather of Finland. The data source was the Finnish meteorological data (Test year 1979) for HVAC-engineering purposes.
VTT House Model is a dynamic simulation tool for building simulations. The House Model combines air infiltration and ventilation, as well as heat and moisture transfer processes. A network assumption is adopted for both air flow and thermal simulation. An iterative method is used for air flow simulations and lumped capacitance method for thermal simulation. VTT House Model includes mass balance, momentum and heat balance equations, which makes it possible to take into consideration the interaction

5. Heat pumps
49
between ventilation and heat transfer processes. The detailed description of the program is in (Tuomaala 2002).
The analysis of the heat pump systems combined with the heating systems of the house did not contain any other auxiliary heating systems (for example fire places) that are typically used in single family houses and can shave the peak demand in extreme weather conditions.
The study was assumed to be a worst case analysis from the electricity peak-demand point of view. Also, no other measures (for example better insulation, new windows etc.) for better energy efficiency were made. The cooling usage of the air-to-air heat pump in the summer was excluded in the study. The household electricity use of the appliances was excluded.
The hourly simulation of heating demand, including DHW, of an old single family house was used. The hourly profile contained the thermal behaviour of the house as a function of the outside temperature. The hourly profile was applied against various heat pump cases. The performance of the heat pumps was modelled in relation to the outside temperature. The calculated cases were as followed:
• Case 1a. oil heated house will be changed to a ground source heat pump house
• Case 1b. oil heated house will install the air-to-air heat pump as an auxiliary heating system parallel to the oil heating system
• Case 1c. oil heated house will be changed to a air-to-water heat pump house, the backup heating is direct electricity
• Case 2a. direct electric heated house will install the air-to-air heat pump as an auxiliary heating system parallel to the direct electric heating system
• Case 2b. direct electric heated house will be changed to a ground source heat pump house
As a reference for cases 2a and 2b, the direct electric heated house was also calculated without heat pumps.
5.4.2 General information of the case single-family house from 1970’s
The building is a ridge roofed single-family house and its insulation is typical of a 1970’s house. The building’s living room is facing north and the kitchen south. The house is inhabited by a four-person family, 2 adults and 2 children. The indoor climate of the simulated single family house was assumed to be good, which equals minimum air change rate 0.5 1/h and indoor temperature 21°C during the heating season.
The total end use energy by heating system type is:
• oil heated house approximately 3 800 litres oil/year • electricity heated house 32.6 MWh/a.

5. Heat pumps
50
The space heating energy demand of the house with a gross area of 163 m2 is 29 MWh/a. The domestic hot water demand with 4-person family is 3.6 MWh/a. The hourly profile of the domestic hot water heating for the ground source heat pump and air-to-water heat pump cases is presented in Figure 22.
0.0200.0400.0600.0800.0
1000.01200.01400.01600.01800.02000.0
1 12 23 34 45 56 67 78 89 100 111 122 133 144 155 166
Hours of the week
DH
W d
eman
d (W
)
0.0200.0400.0600.0800.0
1000.01200.01400.01600.01800.02000.0
1 12 23 34 45 56 67 78 89 100 111 122 133 144 155 166
Hours of the week
DH
W d
eman
d (W
)
Figure 22. The hourly DHW demand profile of the single family house (4 persons). The weekly profile was constant for each week of the year.
The direct electrical heating system had a hot water storage with 3 kW heating resistor. The hot water heating was set on every day at 22:00. The daytime backup usage was not assumed.
5.4.3 Description of heat pump systems used
The properties of the ground source heat pump system
The ground source heat pump was located in the technical room. The heating energy delivery system was radiator heating. The ground source heat pump served both space heating and domestic hot water heating.
The model of the ground source heat pump was linear proportional to the outside temperature (Figure 23).

5. Heat pumps
51
The COP and heating capacity of the ground heat pump, when radiator network's design point is 70 oC in Tout=-25 oC.
0
2
4
6
8
10
-30 -20 -10 0 10 20
Tout
Heating output (kW)COP
Figure 23. The linear model of the ground source heat pump system.
The properties of the air-to-air heat pump system
The air-to-air heat pump was located in the living room, from which its heat was delivered to other spaces of the house by natural buoyancy forces through the open doors. The air-to-air heat pump was not capable to produce DHW.
The capacity model of the air-to-air heat pump was proportional to the outside temperature (Figure 24).

5. Heat pumps
52
The COP and heating capacity of the air-to-air heat pump.
0
1
2
3
4
5
6
-40 -20 0 20 40
Tout (oC)
Heating capacity (kW)COP
Figure 24. The model of the air-to-air heat pump system.
The properties of the air-to-water heat pump system
The air-to-water heat pump was located in the technical room. The heating energy delivery system consisted of radiators. The heat pump can serve both space heating and domestic hot water heating. Direct electric heating was assumed when COP was less than 1.1 during extreme weather conditions in winter.
The model of the air-to-water heat pump was linear according to the outside temperature (Figure 25).

5. Heat pumps
53
0
2
4
6
8
10
12
-30 -25 -20 -15 -10 -5 0 5 10 15 20Outdoor temperature (°C)
CO
P
Heating output (kW) COP
0
2
4
6
8
10
12
-30 -25 -20 -15 -10 -5 0 5 10 15 20Outdoor temperature (°C)
CO
P
Heating output (kW) COP
Figure 25. The COP and heating capacity of the air-to-water heat pump, when radiator network’s design point is 80°C.
5.4.4 Case results – electricity consumptions
The results of the different cases are summarized in Table 14. There are 260 000 oil heated houses at the moment. If we assume that 200 000 oil heated houses in Finland were changed, whereof
• 100 000 to ground source heat pumps, • 50 000 to have air-air heat pumps as supplement, and • 50 000 to air-water heat pumps,
the electricity consumption would increase by 2.2 TWh. The effect of the 200 000 new heat pumps on the Finnish system peak load week is
simulated in Figure 26 The Finnish peak load week from 2006 is used as a basis. A quite cold week is selected from the VTT House Model results (which are in 1979 temperatures from Jyväskylä) to represent the additional heat pump loads, as system peak load and cold weather go hand in hand. The simulation shows that the power system peak increases with 1100 MW due to the new heat pumps.

5. Heat pumps
54
Table 14. Converting old oil heated (Base case 1) or direct electric heating (Base case 2) houses to different types of heat pump houses. GSHP=Ground source heat pump, AAHP= Air-to-air heat pump, AWHP= Air-to-water heat pump.
Case Base case 1 Base case 2 Case 1a Case 1b Case 1c Case 2a Case 2b
Heating type Oil Dir. electr. Oil Dir. electr.
Heat pump - - GSHP AAHP AWHP AAHP GSHP
Electricity (MWh/a) 0,0 33,2 10,7 5,9 16,9 25,4 10,7
Peak (kW) 0,0 14,2 7,3 1,9 12,3 15,1 7,3
Peak hours (h/a) - 2346 1455 3030 1368 1682 1455
16.1.-22.1.2006
0
2000
4000
6000
8000
10000
12000
14000
16000
18000
0:00 12:00 0:00 12:00 0:00 12:00 0:00 12:00 0:00 12:00 0:00 12:00 0:00 12:00
MW
-35,0
-30,0
-25,0
-20,0
-15,0
-10,0
-5,0
0,0
5,0
10,0
Out
side
tem
pera
ture
use
d fo
r the
hea
t pum
ps C
FI 200 000 heat pumps Outside temperature for heat pump load
Figure 26. If 200 000 oil heated houses in Finland are changed to heat pumps, it will have an increasing effect, even as high as 1100 MW, on the system peak load.
We must assume that the majority of air heat pumps installed in Finland are in detached electric heated houses, although detached houses with other fuels, semi-detached houses and service sector buildings have their share of air heat pumps. There are nevertheless a lot of direct electric heating houses in Finland, thus only a minority can be already equipped with air heat pumps. Therefore it is only fair to have a case studying new heat pumps in 200 000 direct electric heated houses, whereof
• 50 000 would be changed to ground source heat pumps and • 150 000 would get air-air-heat pumps as supplement.

5. Heat pumps
55
This case in turn would bring electricity savings of 2.3 TWh. Combining case 1 and case 2 results in a net savings of 0.1 TWh.
The effect that 200 000 new heat pumps in direct electric heating houses have on the Finnish system peak load week is simulated in Figure 27. Again, the Finnish peak load week from 2006 is used as basis, and the same methodology is used for heat pump loads as in case 1. The result: the peak decreases with 400 MW due to new heat pumps in direct electric heated houses. But, combining case 1 and 2 still leaves a net increase of 700 MW for the system peak load.
0
2000
4000
6000
8000
10000
12000
14000
16000
0:00 12:00 0:00 12:00 0:00 12:00 0:00 12:00 0:00 12:00 0:00 12:00 0:00 12:00
MW
0
2000
4000
6000
8000
10000
12000
14000
16000
Case 2: new load Saved electricity As comparison, heat pumps replacing oil heating (Case 1)
0
2000
4000
6000
8000
10000
12000
14000
16000
0:00 12:00 0:00 12:00 0:00 12:00 0:00 12:00 0:00 12:00 0:00 12:00 0:00 12:00
MW
0
2000
4000
6000
8000
10000
12000
14000
16000
Case 2: new load Saved electricity As comparison, heat pumps replacing oil heating (Case 1)
Figure 27. If 200 000 direct electric heated houses in Finland get heat pumps as supplements or as new heating systems, it will decrease the system peak load with 400 MW.

6. Electric vehicles
56
6. Electric vehicles
6.1 Transforming the transport sector
Transportation based on oil faces two major challenges: oil supply has difficulties to keep up with the demand (IEA 2008) and transportation fuel use is a large source of greenhouse gas emissions. In the year 2000 direct emissions from the fuel use were 14.0% of annual greenhouse gas emissions (GHG) globally. Road transport accounted for 75% of the transport sector direct emissions in 2000.
Transforming road transport to rely on electric vehicles (EVs) gives a possibility to deal with both of these challenges. Electricity can be converted from several different energy sources and with EVs it would be easy to release road transport from the grip of oil. If we assume that the electricity is produced in a coal condensing power plant, with a 40% efficiency, the combined efficiency of production, transmission, distribution, and the electric vehicle (0.2 kWh/km), is estimated about to equal that of an internal combustion engine (ICE) using 6 l/100 km. This can be compared to the average test consumption of nearly 8 l/km (losses from well-to-station not included) of cars being sold nowadays, with of course higher consumption rates in city traffic.
Table 15. Comparison of the well-to-wheel efficiency of different cars according to Tesla Motors Inc. The vehicle mileage for Honda Civic VX is (51 miles per gallon (mpg)=4.6 l/100 km) is quite low, achievable at highway driving. Newer models of Honda Civic use (Honda 2008) a lot more gasoline, for example 25 mpg = 9.4 l/100 km for city driving. (Source: Tesla Motors 2008)
Technology Example car Source fuelWell-to-station
efficiency
Vehicle mileage
Vehicle efficiency
Well-to-Wheel efficiency
Natural gas engine Honda CNG Natural gas 86.0 % 35 mpg 0.37 km/MJ 0.318 km/MJ
Hydrogen fuel cell Honda CFX Natural gas 61.0 % 64 m/kg 0.57 km/MJ 0.348 km/MJ
Diesel engine VW Jetta Diesel Crude oil 90.1 % 50 mpg 0.53 km/MJ 0.478 km/MJ
Gasoline engine Honda Civic VX Crude oil 81.7 % 51 mpg 0.63 km/MJ 0.515 km/MJ
Hybrid (Gas/Electric) Toyota Prius Crude oil 81.7 % 55 mpg 0.68 km/MJ 0.556 km/MJ
Electric Tesla Roadster Natural gas 52.5 % 110 Wh/km 2.18 km/MJ 1.145 km/MJ

6. Electric vehicles
57
An electric vehicle using lithium-ion batteries is very efficient in converting electricity from the grid to power in the wheels. A good charger is 95% efficient, a good motor is on average over 90% efficient, and lithium-ion batteries offer around 95% efficient electricity storage. Energy from braking is at least partially recovered by using the motor as a generator. All this put together means that a sedan-sized electric vehicle with reasonable aerodynamics is likely to achieve an average consumption of 0.15–0.25 kWh/km of grid electricity.
6.2 Technology of electric vehicles
Electric vehicles have several sub-categories. Hybrid electric vehicles (HEV) without a possibility to charge the batteries are not usually considered to be electric vehicles although their drive train is partially electrified. If the hybrid vehicle can be charged with an external electricity source, then the vehicle is called plug-in hybrid electric vehicle (PHEV). The battery pack is larger than what would be required in a plain hybrid. Since the vehicle still has an engine and a fuel tank, all-electric range (AER) does not need to be large. Even with relatively small AER the fuel savings are significant especially if there are opportunities to charge the batteries also in other places in addition to home. AER of 32 km with opportunity charging at other places can result in over 70% savings in fuel consumption. (Thornton 2008).
However, not all PHEVs can drive with electricity only in all driving situations as the electric motor might not have the power required. Instead, electricity is used to help the engine to operate as efficiently as possible. This can be the case with parallel hybrids, where both the engine and the motor are connected to the drive train. In a series hybrid, the engine is not connected to the drive train – it produces electricity with a generator to charge the battery or to run the electric motor.
Drivers have different needs for their cars and it is likely that different electric vehicle options will co-exist in the future and new concepts will emerge. The progress of automotive batteries will affect the relative merits of different electric vehicle types. As batteries get cheaper, longer all-electric range in PHEVs and full electric vehicles (FEVs) become more viable. Other battery characteristics like energy density, ratio between power and energy, capability for fast-charging, and cycle life are going to have an influence as well.
For PHEVs the new role of the engine gives interesting options especially in the series hybrid concept. If enough electrical power can be drawn from the battery pack, then the size of the engine can be much smaller as it will need to provide for the average power instead of the peak power. Furthermore, the engine can operate most of the time at the optimal operation point with good efficiency. The new mode of operation can make new types of engines viable and the options do not have to be limited to engines. Probably the most obvious replacement for an engine is a fuel cell, which would greatly benefit from a smaller power requirement and a less variable operation. There are

6. Electric vehicles
58
several fuel cell vehicle (FCV) models in fleet testing but FCVs are expected to enter the market much later than PHEV.
6.3 Charging infrastructure
There are two limits to electric vehicle charging. The first is set by the battery properties, i.e. how much charging power it can withstand without detrimental effects. The second is due to the charging infrastructure. Most household wirings have rather limited amperage and this will limit the charging power even if the batteries could withstand larger currents. In the Nordic countries many parking spaces have electric outlets for the cars to enable pre-warming of the engine before use. These could also be used to charge electric vehicles.
Fast charging a vehicle would require around 100 kW and this is not feasible in residential buildings. Dedicated charging stations, which could first be implemented in current gasoline stations, would be required and they would need to tap into distribution substations. A few thousand outlets in Finland would increase the power production capacity demand with at most a few hundred megawatts, if they are all assumed to be active at the same time.
Charging opportunity at parking areas near workplaces could be beneficial as well. Power outlets in these locations could be useful to people living in apartment houses without a charge possibility and they could enable larger share of electricity use in PHEVs with small batteries. Obviously billing would become an issue. Monetary value of the required annual electricity would not be large, but still large enough to be meaningful. It will be a matter of identifying the car or the user and measuring the total charge. The developments in automatic meter reading (AMR) and two-way communications will no doubt lead to the introduction of workable solutions for this.
6.4 Driving patterns
Vehicle owners will have different driving patterns. Some people will only rarely drive long distances whereas others will do it frequently. The best candidate for a FEV would be a person who drives in the vicinity of 100 kilometres between charge opportunities, does this regularly and does not do long distance trips. High number of cumulative kilometres would bring larger cost savings from fuel. The limit on the range would also limit the cost of the battery pack. Few longer trips per year could be done with a rental car or with a second car. A typical candidate for a PHEV would do shorter daily distances, but have more regular long distance trips. PHEV would be beneficial even if the daily distances are longer than the PHEV range. The last adopters for electric vehicle technology would be people driving only long trips and even those infrequently.

6. Electric vehicles
59
Another aspect in the driving patterns is the timing of the driving and more importantly that of the charge opportunities. Most vehicles are parked for a very large fraction (~ 95%) of the time. However, charging opportunity is not always present. An estimate for the share of vehicles plugged-in at any given time has been made at VTT, see Figure 28. We assumed that there are two possible places where the vehicles might be plugged-in: at work and at home. Most people would be plugging in only at home; some would do it at both locations and only a few at work only. The data used for estimating the leaving and arriving vehicles was derived from the National Travel Survey conducted during 2004–2005 in Finland (WSP LT Consultants Ltd 2006). It gave information on the purpose, timing, and distance of personal travel. The information was processed to give estimates of when cars might arrive at work and at home, and what kind of distances they had travelled before that.
Selections made for modelling the charging of EVs in VTT model were:
20% can charge at work 2% never charge at home Average daily distance driven per vehicle: 52 km Average no of trips per day: 3.0 Average distance driven before plugged in: 39 km.
0 %10 %20 %30 %40 %50 %60 %70 %80 %90 %
100 %
Figure 28. Estimated pattern for the share of electric vehicles plugged-in during typical week.
6.5 Rate of adoption for EV’s
HEVs are already available on the market. Plug-in hybrid cars are not yet commercially available. Full electric vehicle models are already available, but not for the mass market. Electric vehicles with short range and low top speeds can be bought mostly from small

6. Electric vehicles
60
manufacturers. Several large automobile manufacturers have in 2008 announced market introductions of their PHEVs and FEVs to happen in 2–3 years.
Electricity consumption due to electric vehicles will naturally depend on the rate of adoption of different EVs. This is extremely difficult to predict currently, as it is not known whether electric vehicles will truly penetrate the vehicle market. Assuming continuing restrictions on oil supply, pressure to reduce GHG and air pollution emissions from the transport sector, and progress in the battery technology EVs would seem to have a good chance to become a dominant player in the vehicle markets. How fast this could happen will depend on the cost competitiveness of the cars, the performance of the batteries, and even on lithium mining. If the introductory models of the larger manufacturers turn out to be successful, then electric vehicles have taken a big step towards becoming mainstream.
Lithium mining might be the most challenging bottleneck of a technical nature for a rapid commercialization of EVs as it takes years to start new mining operations. It is difficult to foresee the actual level of lithium demand years ahead. In 2004 the share of lithium use for batteries was around 20% of all lithium use, but the ratio would change dramatically with large scale automotive battery manufacturing.
6.6 Influence of EVs on the electricity consumption
How EVs influence the power system is best described using cases. We study three different cases:
1. 1 million EVs in Finland 2. 5 million EVs in the Nordic countries (excluding Iceland) 3. 5 million EVs with smart charging in the Nordic countries.
For peak load comparison we use year 2006 Nordel simultaneous peak load week, 16.–22.1.2006 (Nordel 2006). The peak load of 67 800 MW took place at 20th January, between 8:00 and 9:00 o’clock Scandinavian time.
Slow charging, max 12A @ 220V, is assumed for all EVs and all cases. EVs are assumed to be without heating or air-conditioning. Heating and/or air-conditioning would use approximately an extra 10% according to preliminary calculations. The share of different EVs is assumed to be as shown in Table 16.

6. Electric vehicles
61
Table 16. Estimation of electric vehicles’ specific electricity consumption, average annual mileage and annual electricity consumption. In addition, a very raw estimate of the share of different types of EVs to be found on the roads in 15–25 years.
0,250,17
0,250,17
Electricityconsumption
kWh/km
3,532,38
4,342,97
Annualconsumption
MWh/a
20 %60 %
14 10014 000
Plug-in hybrid vehicles• PHEV 0,25• PHEV 0,17
5 %15 %
17 40017 500
Full electric vehicles• FEV 0,25• FEV 0,17
Share of electricvehicles
Trip km/a on
electricity
0,250,17
0,250,17
Electricityconsumption
kWh/km
3,532,38
4,342,97
Annualconsumption
MWh/a
20 %60 %
14 10014 000
Plug-in hybrid vehicles• PHEV 0,25• PHEV 0,17
5 %15 %
17 40017 500
Full electric vehicles• FEV 0,25• FEV 0,17
Share of electricvehicles
Trip km/a on
electricity
The charging load profiles for workdays, Saturdays and Sundays, and for the different types of EVs are shown in Figure 29. The load profiles are averages taking into account that some cars are already fully loaded while some are not connected to the grid at the time. Charging concentrates to afternoons and evenings when people arrive from work, shopping and leisure. This is due to the assumption that most people will charge only at home.
0
200
400
600
800
1000
1200
1400
0:00 12:00 0:00 12:00 0:00 12:00
MW
EV 0.17 PHEV 0.17 EV 0.25 PHEV 0.25
Figure 29. Daily charging profile for one million electric vehicles, of different types, assuming charging begins as soon as cars are plugged in. 0.17 refers to a consumption of 0.17 kWh/km of EV sedan and 0.25 kWh/km for a SUV type of EV. PHEVs use less electricity as they run partly on gasoline.

6. Electric vehicles
62
6.6.1 Case 1: 1 million EVs in Finland
One million personal vehicles is about a half of the active car fleet in Finland. If they were converted to run mostly on electricity, the electricity consumption in the country would rise by 2.8 TWh, which amounts roughly to 3% of electricity consumption.
Charging is done right away, without any price or demand response. The effect of charging of EVs on the system load can be seen in Figure 30.
If we compare the charging pattern to the Nord Pool spot price, we see that they correlate. The price factor of load (PFp) can be seen as a measurement of how well the load (P) correspondents to higher prices:
price area Helsinki average ˆ a,year energy annual Wa
a,year ofhour each i,priceareaHelsinkipPower,P
8760
1
p
PF pW
pP
P a
iii
=
===∑
= =
If PFp is above 1, then the load has an adverse effect on the system, and is more expensive than the average spot price. Using Helsinki area prices of 2006, charging of EVs gets a value of 1.04–1.05 depending on type of EV. This can be compared to services and offices, which have a value of 1.01, detached houses without electric heating (1.01) and detached houses with accumulated electric heating (0.94).
6.6.2 Case 2: 5 million EVs in the Nordic countries (excluding Iceland)
If half of all personal vehicles in Finland, Sweden, Norway and Denmark were EVs, the annual electricity consumption would rise by 14 TWh, or 15 TWh if the increase in the transmission system losses is also added. For example, it is in comparison just a bit more than the expected annual production, 13 TWh, of the fifth Finnish nuclear reactor. Peak load moves from Friday morning to Thursday evening (17:00–18:00), see Figure 31. The peak load of the system increases with 3 800 MW. The Thursday evening load would have been 4 500 MW lower hadn’t it been for the charging of EVs.

6. Electric vehicles
63
0
2000
4000
6000
8000
10000
12000
14000
16000
18000
0:00 12:00 0:00 12:00 0:00 12:00 0:00 12:00 0:00 12:00 0:00 12:00 0:00 12:00
16.1.-22.1.2006 (Monday - Sunday)
MW
h
FI Electric vehicles
0
2000
4000
6000
8000
10000
12000
14000
16000
18000
0:00 12:00 0:00 12:00 0:00 12:00 0:00 12:00 0:00 12:00 0:00 12:00 0:00 12:00
16.1.-22.1.2006 (Monday - Sunday)
MW
h
FI Electric vehicles
Figure 30. The effect of 1 million EVs on the system peak load in Finland. The time of the peak load moves from morning (8:00–9:00) to evening (17:00–18:00), and rises by 700 MW.
0
10000
20000
30000
40000
50000
60000
70000
80000
0:00 12:00 0:00 12:00 0:00 12:00 0:00 12:00 0:00 12:00 0:00 12:00 0:00 12:00
16.1.-22.1.2006 (Monday - Sunday)
MW
h
FI+SE+DE+NO Electric vehicles
0
10000
20000
30000
40000
50000
60000
70000
80000
0:00 12:00 0:00 12:00 0:00 12:00 0:00 12:00 0:00 12:00 0:00 12:00 0:00 12:00
16.1.-22.1.2006 (Monday - Sunday)
MW
h
FI+SE+DE+NO Electric vehicles
Figure 31. The effect of 5 million electric vehicles on the electricity consumption in the Nordel system. Charging is assumed to happen as soon as vehicles plug-in.
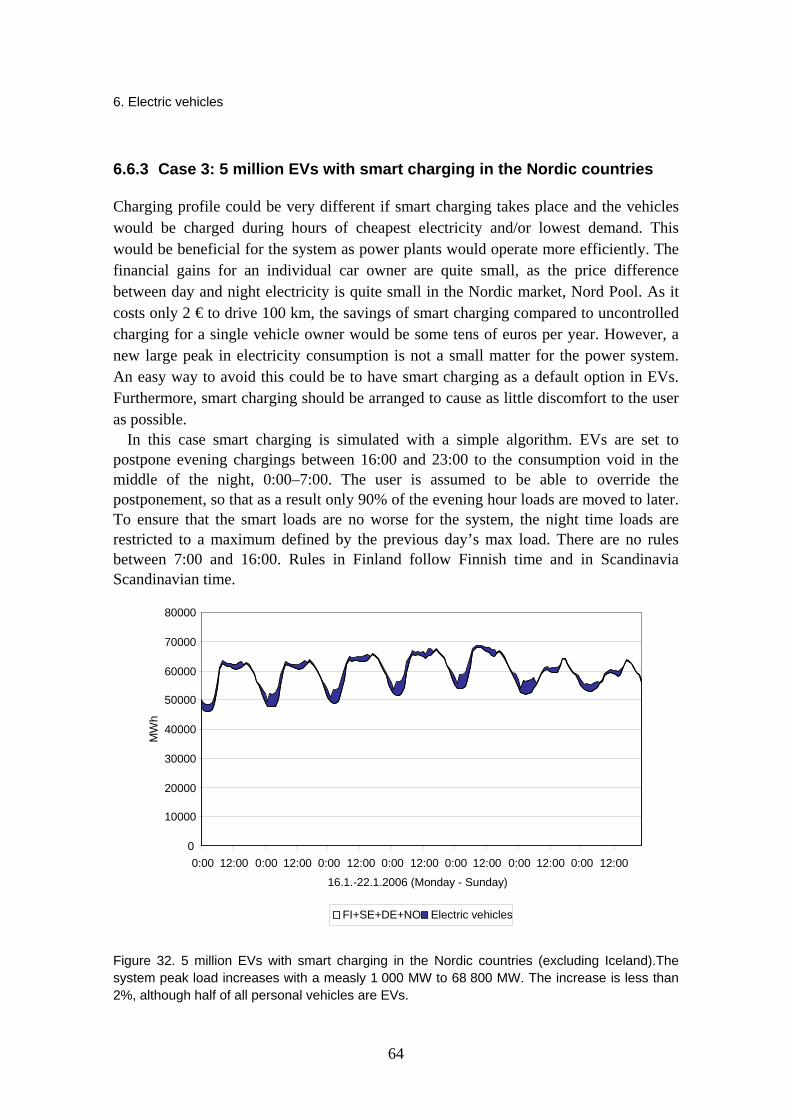
6. Electric vehicles
64
6.6.3 Case 3: 5 million EVs with smart charging in the Nordic countries
Charging profile could be very different if smart charging takes place and the vehicles would be charged during hours of cheapest electricity and/or lowest demand. This would be beneficial for the system as power plants would operate more efficiently. The financial gains for an individual car owner are quite small, as the price difference between day and night electricity is quite small in the Nordic market, Nord Pool. As it costs only 2 € to drive 100 km, the savings of smart charging compared to uncontrolled charging for a single vehicle owner would be some tens of euros per year. However, a new large peak in electricity consumption is not a small matter for the power system. An easy way to avoid this could be to have smart charging as a default option in EVs. Furthermore, smart charging should be arranged to cause as little discomfort to the user as possible.
In this case smart charging is simulated with a simple algorithm. EVs are set to postpone evening chargings between 16:00 and 23:00 to the consumption void in the middle of the night, 0:00–7:00. The user is assumed to be able to override the postponement, so that as a result only 90% of the evening hour loads are moved to later. To ensure that the smart loads are no worse for the system, the night time loads are restricted to a maximum defined by the previous day’s max load. There are no rules between 7:00 and 16:00. Rules in Finland follow Finnish time and in Scandinavia Scandinavian time.
0
10000
20000
30000
40000
50000
60000
70000
80000
0:00 12:00 0:00 12:00 0:00 12:00 0:00 12:00 0:00 12:00 0:00 12:00 0:00 12:00
16.1.-22.1.2006 (Monday - Sunday)
MW
h
FI+SE+DE+NO Electric vehicles
0
10000
20000
30000
40000
50000
60000
70000
80000
0:00 12:00 0:00 12:00 0:00 12:00 0:00 12:00 0:00 12:00 0:00 12:00 0:00 12:00
16.1.-22.1.2006 (Monday - Sunday)
MW
h
FI+SE+DE+NO Electric vehicles
Figure 32. 5 million EVs with smart charging in the Nordic countries (excluding Iceland).The system peak load increases with a measly 1 000 MW to 68 800 MW. The increase is less than 2%, although half of all personal vehicles are EVs.

6. Electric vehicles
65
EVs impact on the power system peak load can be seen in Figure 32. It is very tolerable, considering that smart charging favors both base load power plants as well as variable power production, as explained below.
6.7 Other effects on the power system
Charging behaviour could very well be set to depend on the spot price or some other price indicator. Receiving fresh price signals is no problem with two-way communication expected to be inherent in EVs with smart charging capabilities. If the power system has large amounts of variable production like wind power, then the hours with lowest prices are not necessarily during the night and charging would adjust accordingly within the limits of plug-in periods and user preferences.
EVs could even help to balance the power system. There has to be a balance between production and consumption in the system at all times. If a power plant or a transmission line suddenly trips, or expected production is less than expected, reserve production is needed. EVs offer an alternative. At times when up regulation is needed they could slow down or stop charging. Full benefits are achieved if the vehicles are also capable of discharging, either during disruptions or when power prices are very high. EVs could even provide support for a local or residential micro grid in blackout or in high peak load situations.

7. Aggregate demand scenarios for years 2020 and 2030
66
7. Aggregate demand scenarios for years 2020 and 2030
This Chapter discusses electricity demand scenarios at the Nordic transmission system level and looks at the impact of certain consumption changes on the demand and the demand profile. The method based on hourly consumption indexes described earlier in this report is used.
7.1 Demand forecasts
In 2007, annual electricity consumption in the Nordic electricity market area was 400.6 TWh. This figure includes the power consumption of interruptible electric boilers, which are used for district heating purposes in Sweden and in Norway. These boilers use electricity when electricity prices are low. If price level is high, other fuels are used for heating purposes. When each country’s electricity demand scenarios are summed, a total of 435.3 TWh for year 2020 and 453.8 TWh for year 2030 are obtained (Table 17). The aggregate demand scenario is illustrated in Figure 33. Since the accuracy with which scenarios are published varies substantially, no sectoral decomposition of Nordel-level demand scenarios is presented here.
Table 17. Electricity consumption scenarios for Nordic electricity market area.
TWh 2000 2005 2006 2007 2015 2020 2030
Denmark* 34.9 35.7 36.4 36.4 36.0 37.5 42.5
Finland 79.2 84.5 90.1 90.4 98.1 103.0 108.0
Norway* 123.8 125.9 122.6 127.4 135.5 139.6 143.8
Sweden 146.6 147.3 146.4 146.4 152.1 155.2 159.5
Total 384.5 393.4 395.4 400.6 421.7 435.3 453.8
* Norwegian and Danish electricity consumption scenarios did not extend to year 2030, and for these countries the demand scenarios are extrapolated for year 2030.

7. Aggregate demand scenarios for years 2020 and 2030
67
As can be seen from Figure 33, no dramatic changes in electricity consumption are expected. For years 1997–2007 the electricity consumption in Nordel electricity market area increased from 366.3 TWh to 400.6 TWh, average annual demand increase was 3.4 TWh. For years 2007 to 2030, the estimated annual demand increase is 2.3 TWh/a.
Largest uncertainties which may have an effect on the aggregate consumption are electric vehicles, electric heating and energy-intensive industry. The coming of electric vehicles is mostly a question of the development rate of battery technology and of time. Time is needed to get the mass production rolling in order to have vehicles at competitive prices. Both electric heating and the energy-intensive industry are sensitive to power prices. Prices in Nordic region have been at a lower level than in continental Europe, which has made the region attractive for the industry. The same applies for electric heating, even direct electric heating has been a cost effective choice. As European power markets are integrated, also prices are going to converge. Hence, the Nordic region will loose this advantage for its energy-intensive industry, and direct electric heating will have no picnic either.
0
50
100
150
200
250
300
350
400
450
500
1997 2000 2003 2006 2009 2012 2015 2018 2021 2024 2027 2030
TWh
Finland Sweden Norway Denmark
Figure 33. Electricity consumption scenarios for Nordic countries.
Industry stands for over half of the consumption in Finland, and also Sweden and Norway both have substantial industrial electricity consuming industries. Largest energy and electricity using branches of the industry are pulp and paper as well as primary metals. However, the result of a one month temporary lay-off in the pulp and paper

7. Aggregate demand scenarios for years 2020 and 2030
68
sector in 2005 which can be clearly seen as a deep notch in the consumption line in (Figure 17) is barely noticeable on the Nordic level (Figure 33). Finnish and Swedish pulp and paper industry, as the rest of the European, has had cutbacks in recent years. Overcapacity, together with high wood and electricity prices and a threatening wood shortage due to exorbitant Russian export custom duties have put a heavy burden on the industry resulting in closing down of several mills. Pulp and paper industry is going through a structural change, which may have a decreasing effect on Nordic power consumption.
Industry consumption is on the whole mostly quite invariable hour to hour. Therefore it is of no interest to study the effects of industry consumption changes on the hourly demand profile of the Nordic power system.
The share of direct or accumulating electric heating will diminish, while the share of heat pumps will grow. It is difficult to predict the situation in 2030. Rather than trying to predict the future, we have chosen case studies which show different aspects of possible futures. The case studies are chosen to be large enough for the results to be distinguishable, while still being plausible.
The same principle was chosen for the electric vehicles case. If plug-in hybrid electric vehicles and/or full electric vehicles are successful, they will be successful in hoards, not one at a time.
7.2 Effect of demand changes on market price
The Nordic market price can be estimated once we know the demand, available power plant capacity, fuel prices and electricity market prices of neighbouring areas. It is not so important to get all the inputs right just to assess how changes in demand affects the market price. Keeping all other input parameters constant, the change in demand can be compared to the change in the market price. The base case is calculated with a Nordic demand of 435.3 TWh in year 2020 and of 453.8 TWh in year 2030. Two scenarios are studied.
• Scenario 1: What will happen to the market price if there really are 5 million EVs in the Nordic countries 2020 or 2030, and the demand increases with 15 TWh?
• Scenario 2: What will happen to the market price if the Nordic industry encounters severe set-backs, dropping its consumption with 20 TWh?
We use VTT‘s Electricity Market price Model, VTT EMM, to estimate the market price. All fuel prices, and the price of tCO2 are kept constant. For example the price of coal is 10 €/MWh and EUA is 25 €/t CO2. The capacity development is exogenously set to suit the EU renewables directive, mostly through wind power and Norwegian hydro. Nuclear power plants are upgraded, but there is no sixth or seventh unit in Finland. Capacity development is the same in all scenarios. Export prices of electricity are kept

7. Aggregate demand scenarios for years 2020 and 2030
69
low and import prices high. Of course, if demand is low there is greater opportunity to export more, and if demand is high, there is less opportunity to export. The resulting market prices are shown in Table 18.
Table 18. Market price sensitivity to demand. Increased demand rises market prices, while diminishing demand lower them.
€/MWh 2020 2030
Baseline 43.21 44.64
Scenario 1, +15 TWh 47.62 49.40
Scenario 2, -20 TWh 38.38 40.25
The price increase in scenario 1 is 10–11%, while the price drop in scenario 2 is likewise 10–11%. The export of electricity experiences simultaneously a huge increase in scenario 2. What is interesting is the huge sensitivity that market price shows to demand. A percentage change in demand results in a threefold change in the market price. The shut down of one industrial site helps other sites in the Nordic countries. On the other hand, electric vehicles will have an adverse effect on the competitiveness of the energy-intensive industry.
7.3 Aggregate load case studies
In Chapters 5 and 6, the impacts of heat pumps and electric vehicles on electricity demand and peak load were discussed. In this Chapter, these electricity demand changing trends are aggregated and some further cases are studied.
Each country’s load curve for year 2030 is modelled using index series. Country specific index-series models for year 2006 are presented in Chapter 3. The baseline loads for year 2030 are forecasted by altering modelled load for year 2006 with demand scenarios for year 2030. The cases studied are:
Aggregate case A: Nordic electric load in 2030 with
• 5 million electric vehicles and
• 400 000 heat pumps to compensate other fuels, mainly oil heating (200 000 new ground-source heat pumps, 100 000 new air-source heat pumps and 100 000 new air-water heat pumps)

7. Aggregate demand scenarios for years 2020 and 2030
70
Aggregate case B: Nordic electric load in 2030 with:
• 5 million electric vehicles,
• all the heat pumps from aggregate case A and
• 600 000 heat pumps to compensate direct and storing electric heating (450 000 air-source heat pumps and 150 000 ground-source heat pumps).
Case A can be seen as a worst case scenario with regard to load impact and case B as a more realistic alternative. In case A, heat pumps compensate other fuels, mainly oil heating (half of them for Finnish oil heaters, half for Sweden and Norway). Case B includes those heat pumps which are in case A, but also additional heat pumps that are installed in houses with electric heating. In both cases electric vehicles are smart-charged.
A summary of the cases is given in Table 19.
Table 19. Summary of the case studies.
Estimated energy (TWh)
Estimated change in peak load* in -10 ˚C
(MW)
Estimated change in peak load* in -25 ˚C
(MW) Aggregate scenario for 2020 435.3Aggregate scenario for 2030 453.8
Case A:5 million electric vehicles 14.0 970 970Case A heat pumps total 4.4 1200 3300 - 200 000 ground-source heat pumps 2.2 - 100 000 air-source heat pumps 0.6 - 100 000 air-water heat pumps 1.6Case A total for 2030 472.2 2170 4270
Case B:5 million electric vehicels 14.0 970 970Case A heat pumps 4.4 1200 3300Additional heat pumps for case B -6.9 -1300 -990 - 150 000 groud-source heat pumps -3.3 - 450 000 air-source heat pumps -3.6Case B total for 2030 465.3 870 3280 * peak load at simultaneous system peak load third Wednesday of January 8:00–9:00
The impact of cases A and B on the load of the 3rd week in January are simulated in Figure 34 through 37. The impacts are simulated using different outdoor temperatures, -10°C and -25°C for the heat pump load curves. Both cases show substantial peak load increases at -25°C, whereas peak load increase is quite small for the case B at -10°C. A
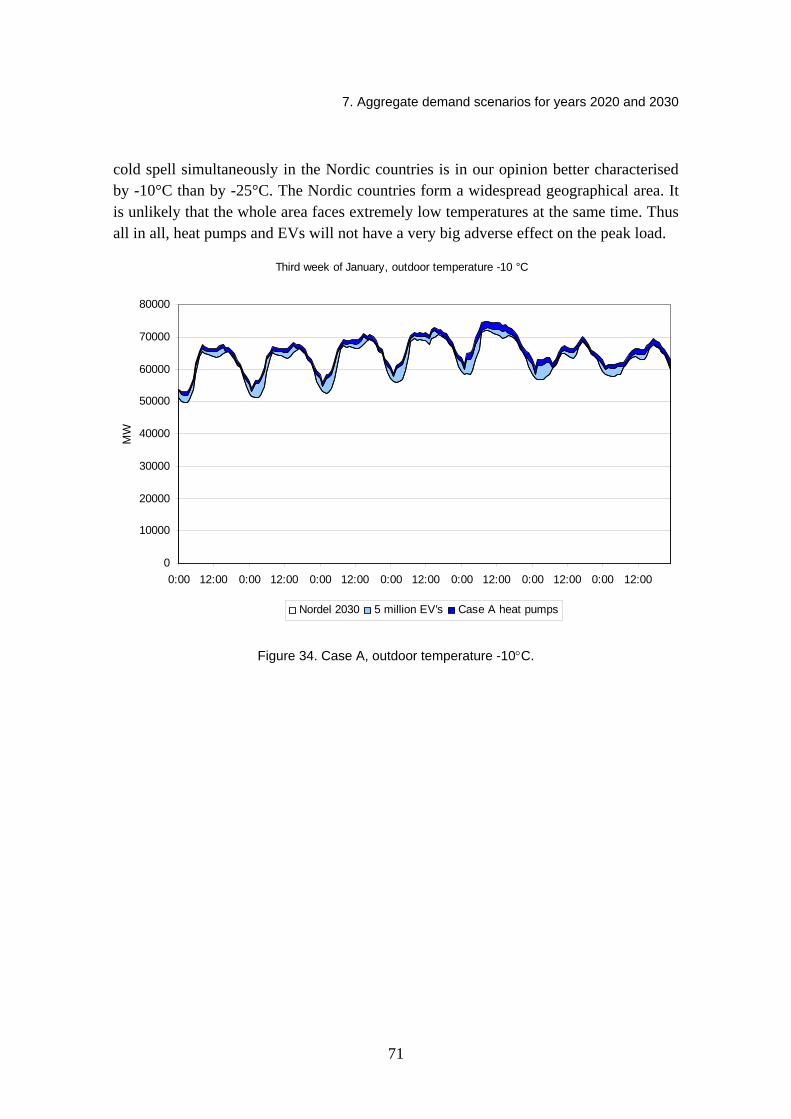
7. Aggregate demand scenarios for years 2020 and 2030
71
cold spell simultaneously in the Nordic countries is in our opinion better characterised by -10°C than by -25°C. The Nordic countries form a widespread geographical area. It is unlikely that the whole area faces extremely low temperatures at the same time. Thus all in all, heat pumps and EVs will not have a very big adverse effect on the peak load.
Third week of January, outdoor temperature -10 °C
0
10000
20000
30000
40000
50000
60000
70000
80000
0:00 12:00 0:00 12:00 0:00 12:00 0:00 12:00 0:00 12:00 0:00 12:00 0:00 12:00
MW
Nordel 2030 5 million EV's Case A heat pumps
Figure 34. Case A, outdoor temperature -10°C.
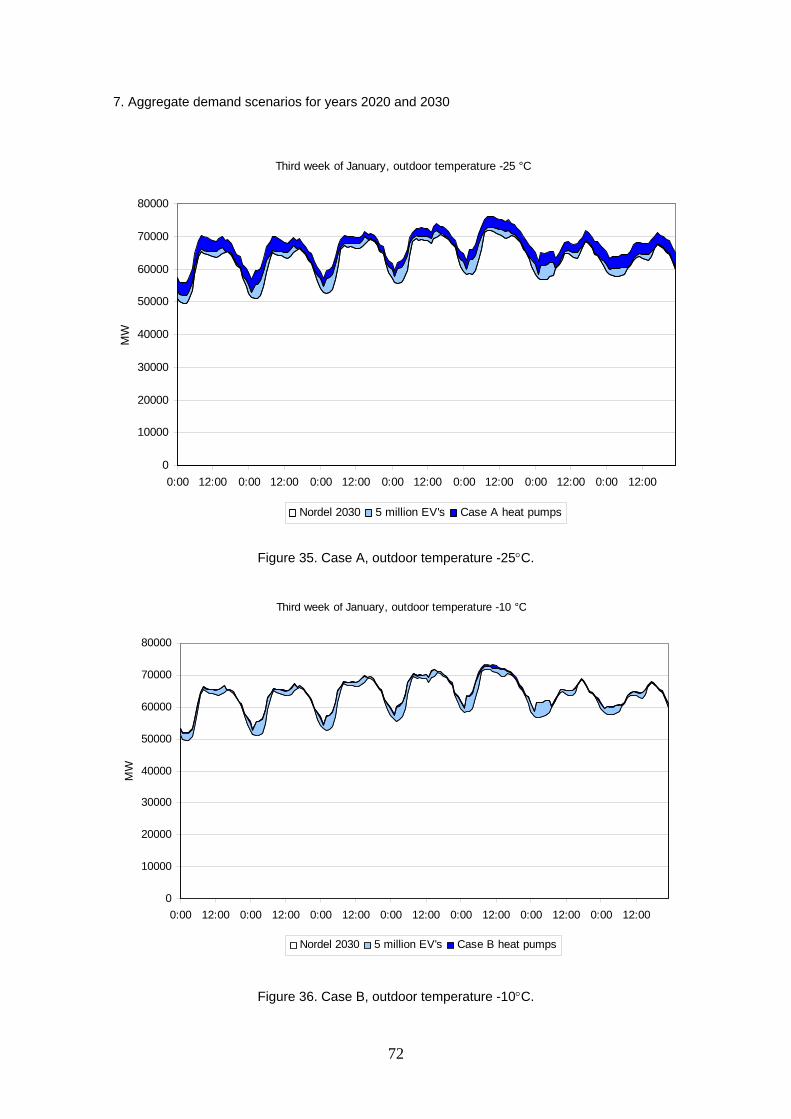
7. Aggregate demand scenarios for years 2020 and 2030
72
Third week of January, outdoor temperature -25 °C
0
10000
20000
30000
40000
50000
60000
70000
80000
0:00 12:00 0:00 12:00 0:00 12:00 0:00 12:00 0:00 12:00 0:00 12:00 0:00 12:00
MW
Nordel 2030 5 million EV's Case A heat pumps
Figure 35. Case A, outdoor temperature -25°C.
Third week of January, outdoor temperature -10 °C
0
10000
20000
30000
40000
50000
60000
70000
80000
0:00 12:00 0:00 12:00 0:00 12:00 0:00 12:00 0:00 12:00 0:00 12:00 0:00 12:00
MW
Nordel 2030 5 million EV's Case B heat pumps
Figure 36. Case B, outdoor temperature -10°C.
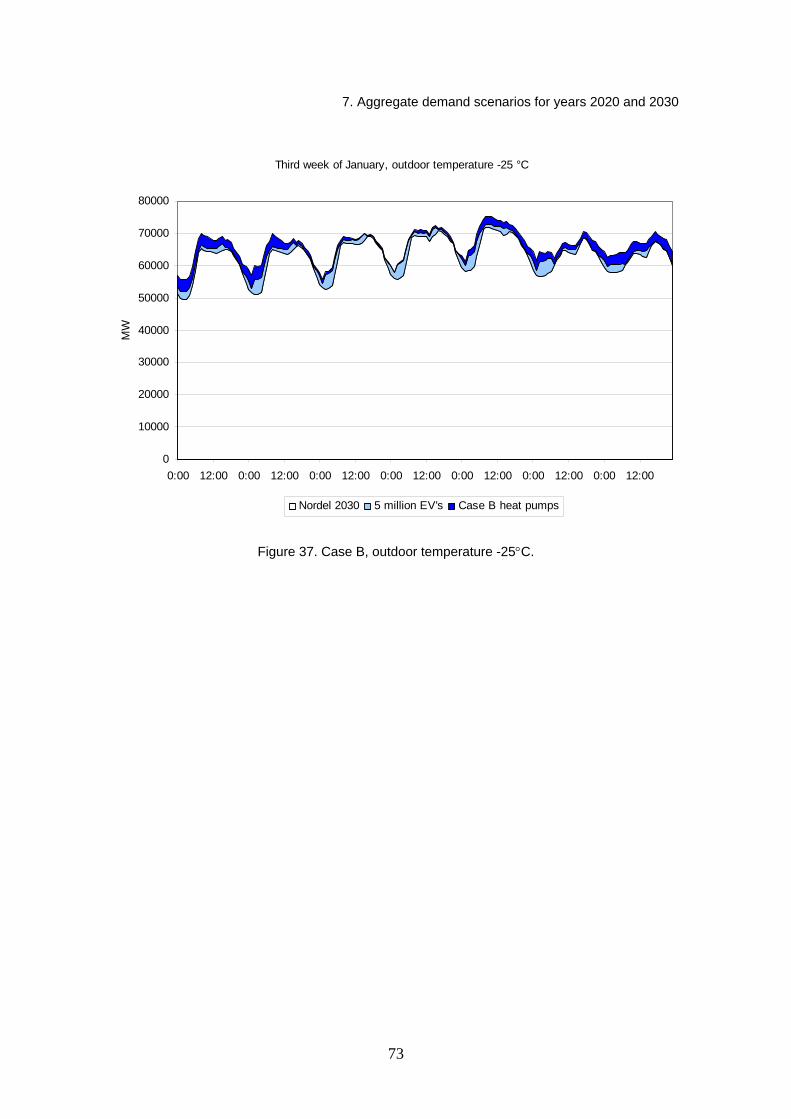
7. Aggregate demand scenarios for years 2020 and 2030
73
Third week of January, outdoor temperature -25 °C
0
10000
20000
30000
40000
50000
60000
70000
80000
0:00 12:00 0:00 12:00 0:00 12:00 0:00 12:00 0:00 12:00 0:00 12:00 0:00 12:00
MW
Nordel 2030 5 million EV's Case B heat pumps
Figure 37. Case B, outdoor temperature -25°C.

8. Summary and conclusions
74
8. Summary and conclusions
Until recent years, the total electricity consumption in the Nordic countries has been steadily increasing. The most important factor affecting total electricity consumption has been the growth of GDP. After the turn of the century this trend has been broken. In 2002 and 2003, the price of electricity in the Nordic electricity market area was very high because of low levels of water in reservoirs. High electricity price decreased electricity consumption mainly in Sweden and in Norway. In 2005, there was a temporary lay-off in the Finnish forest industry, which can be seen as a notch in electricity consumption figures. In the near future, year-to-year increasing electricity demand trend may be broken. European Union strives strongly to improve energy efficiency, both with the 9% target for energy saving between 2008 and 2016 and with the target of improving energy efficiency with 20% by the year 2020, and with several other directives. The measures improving energy efficiency can also have increasing effects on electricity demand due to modal changes or fuel switching. This report analyses the uncertainties in electricity demand.
In this report, the future electricity demand in the Nordic countries was analysed. Firstly, electricity demand trends by sector were described. The authors of this report see industrial electricity demand, electric heating and electric vehicles as the most important individual factors that may affect electricity demand in the future. The impacts of large scale penetration of the latter two are further analysed in Chapters 5 and 6. The electricity intensity of industry in the Nordic countries has already changed, and this trend is likely to continue. Nordic and European pulp and paper industry is going through a structural change, which may lead to decreasing electricity demand in the Nordic countries. Electricity-intensive industry’s electricity consumption is base load, and thus the impacts on hourly loads were not analysed.
In Chapter 3, the Nordic countries’ electricity consumption in 2006 by sector was further analysed. In this Chapter, the method of hourly consumption indexes was described. The method is developed for distribution system modelling, but consumption indexes can also be applied when transmission level system load is forecasted several decades ahead and structural trends are analysed. The hourly consumption indexes

8. Summary and conclusions
75
capture moderately well average hourly load profiles. Since temperature data was not available, temperature dependency was not modelled.
Country-specific official electricity demand scenarios were presented in Chapter 4. All of these scenarios show moderate increases in electricity demand. However, EU202020-targets are not fully applied in these scenarios.
In Chapter 5, the impacts of large scale penetration of heat pumps are analyzed. Oil heating is under attack especially in Finland according to the long-term climate and energy strategy of the Ministry of Employment and the Economy. But if a large chunk of the oil heated detached houses are converted to heat pumps, the electricity consumption would rise with more than 2 TWh. At the same time the peak load will rise with 1100 MW. On the other hand, if a similar chunk of direct electric heated houses get heat pumps, it will more than compensate for the rise in consumption. But not for the rise in peak load as there will still remain a net increase of 700 MW.
The deployment of electric cars and their effect on the electricity power system was studied in Chapter 6. To estimate deployment of a new and developing technology is a challenging task. The changes in regulations, laws, taxes, electricity and fuel prices, not to forget technology backlashes or new technology innovations makes it very difficult to predict any specific numbers. On the other hand the interest to deploy EVs is clearly increasing. The authors estimate that plug-in hybrid electric vehicles will experience the strongest demand up to 2020 of all EVs. Small, 5% or 10%, market shares for EVs will increase electricity demand by a negligible amount, less than 0.5–1% in Finland. If half of all personal vehicles were EVs, a realistic possibility by 2030, the electricity consumption would rise in Finland by 3 TWh and in the Nordic countries by 15 TWh. On the Nordic level 15 TWh is just a bit above the output from one modern 1600 MW nuclear power plant, and no more than 2% of all load. And what more, even a 50% market share of EVs in the Nordic countries will not require any extraordinary changes to the power system if smart distribution network charging is selected as the preferred charging method. Our results show an increase in the peak load of 1000 MW on the Nordic level, much less than the capacity needed for the energy production. Other existing capacity might be used with a higher utilization factor to achieve the lacking energy.
Wider deployment of EVs on the other hand forms a distributed energy storage capacity that can support both local network and the whole power system by smoothing the peak power periods, smoothing variable renewable energy production and producing energy during blackouts. And, although increasing electricity load, EVs give an increased possibility to use renewable energy sources in the transport sector, as well as increasing the security of supply of transport energy. In Finland, gasoline and diesel depend to 100%, and will depend to a great extent, on imported energy, whereas electricity on a Finnish but especially on a Nordic level can be seen as generally domestic.
Finally in Chapter 7 the country specific electricity demand scenarios are aggregated to form a scenario of Nordic electricity demand for years 2020 and 2030. First of all, the influence of change in the demand on the market price is studied using two scenarios. In

8. Summary and conclusions
76
scenario 1 additional 15 TWh of electricity consumption due to EVs raise the market price with over 10%. In scenario 2 a drop of 20 TWh from the load due to industry set-backs lower market prices by over 10%. In a nutshell, the market price’s sensitivity to demand is around 300% in 2020 and 2030.
The impacts of large scale penetration of heat pumps and electric vehicles are studied with two case studies, case A being a worst case scenario with regard to load impact and case B a more realistic alternative. The hourly electricity consumption is modelled with Finnish consumption indexes. Since temperature dependency was not modelled, indexes do not accurately represent peak loads. Therefore the impacts on peak load are studied by summing the electric vehicles’ and heat pumps’ loads on the realized peak load in year 2006. Both cases show a substantial (3000–4000 MW) peak load increase at -25°C, whereas peak load increase is quite small for case B at -10°C. A simultaneous cold spell in the Nordic countries is in our opinion better described by -10°C than by -25°C, thus EVs and heat pumps might not affect the peak capacity requirements in the Nordic countries as adversely as beforehand was anticipated.
Considering all demand issues presented in this report, it is clear that electricity is a high value fuel offering possibilities to overall energy savings, putting pressure on increasing the use of it. The price and competitiveness of electricity will be important factors especially for the Nordic energy and electricity intensive industry.
References
77
References Adato 2008. Kotitalouksien sähkönkäyttö 2006. Tutkimusraportti 2.10.2008. ISBN 978-952-
9696-41-3.
Danish Energy Agency 2008. Energy Statistics 2007. Available: http://www.ens.dk .
DEA 2008. Detailed figures (xls-format) from the Danish Energy Association forecast published in July 2008, Fremskrivning af Danmarks energiforbrug og udledning af drivhusgasser frem til 2025.
http://www.ens.dk/graphics/ENS_Energipolitik/fremskrivninger/Detaljerede-tal_basis_juli2008.xls Visited 30.12.2008.
Elforsk 2006. Elanvändningen i Norden om tio år. Slutrapport. Elforsk rapport 06:05.
Energinet.dk 2008. Elforbrugsfremskrivning 2008. Available: http://www.energinet.dk.
EK 2007. Electricity demand in Finland in 2020 and 2030. The Confederation of Finnish Industries EK and the Finnish Energy Industries. November 2007. Available: http://www.energia.fi.
EHPA 2008. European Heat Pump Statistics, Outlook 2008. European heat pump association EHPA. Viewed 25.11.2008. Available: http://www.ehpa.org/en/baustein/bs82/.
Finnish Oil- and Gas Federation – Öljy- ja kaasualan keskusliitto 2008. Öljy- ja kaasualan vuosikirja 2008. ISSN 1457-3601. In pdf-format at http://www.oil-gas.fi.
Heljo, J. 2008. Lämmitysmarkkinoiden kehitys – millä Suomi lämmittää tulevaisuudessa. Energia-teollisuus ry:n kevätseminaari 9.5.2008.
Heljo, J. & Laine, H. 2005a. Sähkölämmitys ja lämpöpumput sähkönkäyttäjinä ja päästöjen aiheuttajina Suomessa. Tampere University of Technology, Institute of Construction Economics. Report 2005:2. Tampere 2005.
Heljo, J., Nippala, E. & Nuuttila, H. 2005b. Rakennusten energiankulutus ja CO2-ekv päästöt Suomessa. Tampere University of Technology, Institute of Construction Economics. Report 2005:4. Tampere 2005.

References
78
Honda 2008. http://automobiles.honda.com/ Visited 19.12.2008
IEA Energy Technology Perspectives 2008.
KTM 2007. Baseline-esittely 7.11.2007 (Baseline presentation). Mirja Kosonen, Ministry of Trade and Industry, KTM (since 2008 Ministry of Employment and the Economy, TEM). Presentation given at KTM expert seminar 7.11.2008.
Larsson, L., Lindskoug, S. & Lindén, M. 2006. Elförbrukningens karaktär vid kall väderlek. Elforsk rapport 06:62. Elforsk. Oktober 2006.
Motiva 2008. Motiva calculation tool for comparison of heating systems in standardized detached houses. Available: http://lammitysjarjestelmat.hosting.ambientia.fi/tyyppitalovertailu.php
Nowacki, J.-E. 2007. Heat pumps in energy statistics- Suggestions. STEM dnr: 17-07-3784. Available: http://www.swedishenergyagency.se/WEB%5CSTEMFe01e.nsf/V_Media00/C12570D10037720FC125730D003B1C15/$file/How%20to%20include%20heat%20pumps%20and%20solar%20energy%20in%20the%20national%20energy%20statistics%20final%20version.pdf.
NVE 2005. Kraftbalansen i Norge mot 2020. Oppdaterte anslag per juni 2005. Knut Hofstad, Torodd Jensen, Cato Larsen, Seming Skau. Norges vassdrags- og energidirektorat. Available: http://www.nve.no.
Nordel annual statistics 2006 and 2007. Available: http://www.nordel.org.
ODYSSEE 2006. ODYSSEE database. Energy Efficiency Indicators, Data&Indicators. February 2006. Enerdata production, 2006/02.
Seppälä, A. 1996. Load research and load estimation in electricity distribution. VTT, Espoo 1996. VTT Publications 289. 118 p. + app. 19 p. Available: http://www.vtt.fi/inf/pdf/ publications/1996/P289.pdf
Statistics Finland 2008. Energy statistics 2007. Yearbook.
Statistics Norway 2008a. Energy consumption per household, 2006. Published 28 April 2008. Available: http://www.ssb.no/english/subjects/01/03/10/husenergi_en/.
Statistics Norway 2008b. Electricity statistics 2006. Published 28 May 2008. Official Statistics of Norway (NOS C 691). Available: http://www.ssb.no.
Statistics Sweden 2008. SCB Statistiska meddelanden EN11SM0801 – El- gas- och fjärrvärme-försörjningen 2006. Available: http://www.stb.se.
STEM 2007. Långsiktsprognos 2006 – enligt det nationella systemet för klimatrapportering. Statens energimyndighet ER 2007:02, 2007. Available: http://www.swedishenergyagency.se.

References
79
STEM 2008. Energiförsörjningen i Sverige. Kortsiktsprognos. Statens energimyndighet ER 2008:18, August 2008. Available: http://www.swedishenergyagency.se.
SULPU 2008. Suomen lämpöpumppuyhdistys (Finnish heat pump association). http://www.sulpu.fi/ Viewed 16.12.2008.
Suomirakentaa.fi. http://www.suomirakentaa.fi/ Viewed 29.9.2008.
Tekniikka ja Talous 17.1.2008 Available: http://www.tekniikkatalous.fi/metsa/article55073.ece.
Tekniikka ja Talous 17.10.2008 Available: http://www.tekniikkatalous.fi/energia/article148099.ece.
TEM 2008. Pitkän aikavälin ilmasto- ja energiastrategia (Long-term climate and energy strategy). Valtioneuvoston selonteko eduskunnalle 6. päivänä marraskuuta 2008. Ministry of Employment and the Economy. Available: http://www.tem.fi.
Tesla Motors 2008. http://www.teslamotors.com/efficiency/well_to_wheel.php Car performance comparison by Tesla Motors Inc, viewed 29.12.2008.
Thornton 2008. Vehicle Modeling and Simulation. DoE Vehicle Technologies Program, February 28, 2008. <http://www1.eere.energy.gov/vehiclesandfuels/pdfs/merit_review_2008/ vehicles_systems/merit08_thornton.pdf, slide 7.
Tuomaala, P. 2002. Implementation and evaluation of air flow and heat transfer routines for building simulation tools. VTT Publications 471. Espoo. 2002. 45 p. + app. 52 p. Available: http://www.vtt.fi/inf/pdf/publications/2002/P471.pdf.
WSP LT Consultants Ltd (WSP LT-Konsultit Oy). Henkilöliikennetutkimus 2004–2005. Liikenne- ja viestintäministeriö, Tiehallinto ja Ratahallintokeskus. 2006. ISBN 951-803-682-9. Available: http://www.hlt.fi/HTL04_loppuraportti.pdf.


Series title, number and report code of publication
VTT Research Notes 2470VTT-TIED-2470
Author(s) Göran Koreneff, Maija Ruska, Juha Kiviluoma, Jari Shemeikka, Bettina Lemström, Raili Alanen & Tiina Koljonen Title
Future development trends in electricity demand Abstract
The future electricity demand and demand trends in Finland and in the Nordic countries (excluding Iceland) are the main focus of this report. The electricity demand per capita is high on a European and even on a global scale in Finland, Sweden and Norway. One reason is the high share of electric heating combined with a cold climate; another reason is the relatively low price level of electricity which has led to extensive electricity intensive industry. The estimated Nordic business as usual (BAU) demand for year 2020 is 435 TWh and for year 2030 454 TWh. EU’s recent policy decisions regarding increased use of renewables, greenhouse gas emission reductions and improved energy efficiency will have an impact on the electricity system. The basic demand is expected to decrease compared to the BAU scenario. The future trends do not only affect annual consumption, but also the load curves and system peak load behaviours. Using consumer type load models and sectorwise annual energy estimates, we model the Nordic load curves for each country for the years 2020 and 2030.
EU 20-20-20 policies will change how electricity is used. The authors of this report see industrial electricity demand, electric heating and heat pumps, and electric vehicles as the most important individual factors that may affect electricity demand in the future, and even increase it considerably. The impacts of large scale penetration of the latter two are further analysed with special regard to effect on system peak load. The analysis was done using what-if cases.
The future of oil heating is under the spotlight especially in Finland according to the long-term climate and energy strategy of the Ministry of Employment and the Economy. If 200 000 of the oil heated detached houses are converted to heat pumps, then the electricity consumption would rise with more than 2 TWh. At the same time the peak load will rise with 1100 MW. On the other hand, if a similar chunk of direct electric heated houses get heat pumps, it will more than compensate for the rise in consumption. But not for the rise in peak load as there will still remain a net increase of 700 MW.
The deployment of electric vehicles (EV) and their effect on the electricity power system was studied. The results indicate that a small amount of EVs (5% to 10% market share) will increase electricity demand by a negligible amount, less than 0.5–1 % in Finland. If half of all personal vehicles were EVs, a realistic possibility by 2030, the electricity consumption would rise in Finland by 3 TWh and in the Nordic countries by 15 TWh. However, it will not require any extraordinary changes to the system peak load management if smart distribution network charging is selected as the preferred charging method. Our results show an increase in the system peak load of 1000 MW on the Nordic level.
Large scale penetration of both heat pumps and electric vehicles on a Nordic level are studied with two case studies, case A being a worst case scenario with regard to load impact and case B a more realistic alternative. In case B also electric heated houses get heat pumps, not only oil heated houses as in case A. Both cases show a substantial (3.000–4.000 MW) peak load increase at -25°C, whereas peak load increase is quite small for case B at -10°C. A simultaneous cold spell in the Nordic countries is in our opinion better described by -10°C than by -25°C, thus EVs and heat pumps might not affect the peak capacity requirements in the Nordic countries as adversely as beforehand was anticipated.
Considering all demand issues presented in this report, it is clear that electricity is a high value source of energy offering possibilities to overall energy savings and an increased share of renewables. This will further boost the electrification of the society.
ISBN 978-951-38-7273-1 (URL: http://www.vtt.fi/publications/index.jsp)
Series title and ISSN Project number VTT Tiedotteita – Research Notes 1455-0865 (URL: http://www.vtt.fi/publications/index.jsp)
179868
Date Language Pages February 2009 English 79 p.
Name of project Commissioned by Suomalaisen energiateollisuuden kilpailukyky ilmastopolitiikan muuttuessa, SEKKI
Tekes
Keywords Publisher electricity demand, load curves, peak load, electric vehicle, heat pump
VTT Technical Research Centre of Finland P.O. Box 1000, FI-02044 VTT, Finland Phone internat. +358 20 722 4520 Fax +358 20 722 4374

VTT RESEARCH NOTES 2470VTT CREATES BUSINESS FROM TECHNOLOGY�Technology�and�market�foresight�•�Strategic�research�•�Product�and�service�development�•�IPR�and�licensing�•�Assessments,�testing,�inspection,�certification�•�Technology�and�innovation�management�•�Technology�partnership
•�•�•��VTT�RESEA
RC
H�N
OTES�2470��Fu
TuR
E�dEVElO
PmEN
T�TREN
dS�IN
�ElECTR
ICITy�d
EmA
Nd
ISBN 978-951-38-7273-1 (URL: http://www.vtt.fi/publications/index.jsp)ISSN 1455-0873 (URL: http://www.vtt.fi/publications/index.jsp)
Göran Koreneff, Maija Ruska, Juha Kiviluoma, Jari Shemeikka, Bettina Lemström, Raili Alanen & Tiina Koljonen
Future development trends in electricity demand
The future electricity demand and demand trends in Finland and in the Nordic countries are the main focus of this report. The electricity demand per capita is high in Finland, Sweden and Norway.
EU’s recent 20-20-20-10 policy decisions for the year 2020 will have an impact on the electricity system. The future trends do not only affect annual consumption, but also the load curves and system peak load behaviours. Using consumer type load models and sector wise annual energy estimates, we model the Nordic load curves for each country for the years 2020 and 2030.
The authors of this report see industrial electricity demand, electric heating and heat pumps, and electric vehicles as the most important individual factors that may affect electricity demand in the future. The impacts of large scale penetration of the latter two are further analysed using what-if cases with special regard to effect on system peak load. The report studies what would happen if a large number of the oil heated detached houses are converted to heat pumps, a large number of electric heated houses get heat pumps, and half of all personal vehicles were electric vehicles. We study the impacts of the different cases for both Finland and the Nordic countries.