Embed Size (px)
Citation preview

VTT RESEARCH NOTES 2496VTT CREATES BUSINESS FROM TECHNOLOGY�Technology�and�market�foresight�•�Strategic�research�•�Product�and�service�development�•�IPR�and�licensing�•�Assessments,�testing,�inspection,�certification�•�Technology�and�innovation�management�•�Technology�partnership
•�•�•��VTT�RESEA
RC
H�N
OTES�2496��
REd
uC
TION
�AN
d�m
ON
ITOR
INg
�Of�b
IOg
AS�TR
AC
E�CO
mPO
uN
dS
ISBN 978-951-38-7314-1 (URL: http://www.vtt.fi/publications/index.jsp)ISSN 1455-0865 (URL: http://www.vtt.fi/publications/index.jsp)
Mona Arnold
Reduction and monitoring of biogas trace compounds
VTT Tiedotteita – Research Notes
2484 Torsti Loikkanen, Jari Konttinen, Jukka Hyvönen, Laura Ruotsalainen, Kirsi Tuominen, Mika Waris, Veli-Pekka Hyttinen & Olli Ilmarinen. Acquisition, Utilisation and the Impact of Patent and Market Information on Innovation Activities. 2009. 68 s.
2485 Marita Hietikko, Timo Malm & Jarmo Alanen. Koneiden ohjausjärjestelmien toiminnallinen turvallisuus. Ohjeita ja työkaluja standardien mukaisen turvallisuusprosessin luomiseen. 2009. 75 s. + liitt. 14 s.
2486 Helena Järnström, Sirje Vares & Miimu Airaksinen. Semi volatile organic compounds and flame retardants. Occurence in indoor environments and risk assessment for indoor exposure. 2009. 58 p. + app. 8 p.
2487 Tiina Koljonen, Juha Forsström, Veikko Kekkonen, Göran Koreneff, Maija Ruska, Lassi Similä, Katri Pahkala, Laura Solanko & Iikka Korhonen. Suomalaisen energiateollisuuden kilpailukyky ilmastopolitiikan muuttuessa. 2008. 88 s.
2488 Sami Karjalainen. Talotekniikan käytettävyys ja sen kehittäminen. Kohti helppokäyttöisyyttä. 2009. 47 s. + liitt. 3 s.
2490 Tiina Apilo, Henri Hytönen & Katri Valkokari. Arvonluonnin uudet muodot ja verkostot 2009. 94 s.
2491 Kirsi Aaltonen, Mervi Murtonen & Sampo Tukiainen. Three perspectives to global projects. Managing risks in multicultural project networks. 2009. 47 p. + app. 4 p.
2492 Tuomo Tuikka & Minna Isomursu (eds.). Touch the Future with a Smart Touch. 2009. 280 p.
2493 Hannele Holttinen, Peter Meibom, Antje Orths et al. Design and operation of power systems with large amounts of wind power. Final report, IEA WIND Task 25, Phase one 2006–2008. 2009. 200 p. + app. 29 p.
2494 Marjaana Rättö, Minna Vikman & Matti Siika-aho. Yhdyskuntajätteiden hyödyntäminen biojalostamossa. 2009 64 s.
2496 Mona Arnold. Reduction and monitoring of biogas trace compounds. 2009. 74 p. + app. 5 p.
2497 Tuula Hakkarainen, Jukka Hietaniemi, Simo Hostikka, Teemu Karhula, Terhi Kling, Johan Mangs, Esko Mikkola & Tuuli Oksanen. Survivability for ships in case of fire. Final report of SURSHIP-FIRE project. 2009. 120 p. + app. 7 p.


VTT TIEDOTTEITA – RESEARCH NOTES 2496
Reduction and monitoring of biogas trace compounds
Mona Arnold

2
ISBN 978-951-38-7314-1 (URL: http://www.vtt.fi/publications/index.jsp) ISSN 1455-0865 (URL: http://www.vtt.fi/publications/index.jsp)
Copyright © VTT 2009
JULKAISIJA – UTGIVARE – PUBLISHER
VTT, Vuorimiehentie 3, PL 1000, 02044 VTT puh. vaihde 020 722 111, faksi 020 722 4374
VTT, Bergsmansvägen 3, PB 1000, 02044 VTT tel. växel 020 722 111, fax 020 722 4374
VTT Technical Research Centre of Finland, Vuorimiehentie 3, P.O. Box 1000, FI-02044 VTT, Finland phone internat. +358 20 722 111, fax +358 20 722 4374
Technical editing: Mirjami Pullinen Cover picture: Silicon Dioxide Crystal

3
Mona Arnold. Reduction and monitoring of biogas trace compounds. Espoo 2009. VTT Tiedotteita – Research Notes 2496. 74 p. + app. 5 p.
Keywords biogas, landfill gas, siloxanes
Abstract For the versatile use of biogas as fuel, it is necessary to remove harmful impurities that affect the utilization as an energy source. The most significant impurities that require removal are corrosion-causing sulphur compounds and organic silicon compounds, in particular, siloxanes. Siloxanes transform into silicon dioxide on the surfaces of gas engines and turbines and thus damage the equipment.
The objective of this study was to gather know-how on biogas impurities and their concentration levels as well as the solutions for trace compound removal. In addition, further impacts of impurities on biogas usage from the technical and economic standpoints are discussed. In the study, a literature search was conducted on the existing scientific and economic literature (2000 →) as well as the patents concerning biogas purification. The information gathered has been substantiated as far as possible by consulting experts in the field.
The emphasis of this study was the harmful components of biogas electricity production and especially siloxanes. In addition to the occurrence and removal of biogas impurities, current methods of determining siloxane were evaluated. A new concept for on-line determination of siloxanes in the field was developed. Furthermore, the report presents the biogas matrices at six sites in Finland determined with the developed method.

4
Preface
This report is a study on the occurrence, measurement and removal of biogas trace compounds and the costs involved in biogas purification. The first part of the report is a literature review executed mainly in 2007–2008 and the second part concerns the development of siloxane measurement and results from measurement campaigns concerning on biogas matrices at various sites in Finland. An estimate of the cost involved in biogas purification is presented for two existent sites in Finland.
The research behind this study was done by VTT Technical Research Centre of Finland in the research project “ADOPT – Enhancing biogas utilization”. The ADOPT research was carried out 2007–2009 as a joint research project of VTT, Helsinki University and HAMK University of Applied Science. Results from other subtasks of the ADOPT research project are presented in separate reports and conference articles.
VTT’s ADOPT research was financed by Tekes, the Finnish Funding Agency for Technology, YTV Metropolitan Area, Fortum Oyj, Sarlin Oy Ab, Wärtsilä Finland Oy, Espoo Water and Mölnlycke Health Care. Responsible manager of the joint research project was Technology Manager Jukka Lehtomäki. As project manager served Senior Research Scientist Mona Arnold. Research Engineer Tuula Kajolinna and Senior Research Scientist Jaakko Räsänen were responsible for the valuable field work and method development done in this project.
Chairman of the joint project’s advisory board was Kari Lammi (Sarlin Oy). Members of the advisory board were Pia Salokoski (Tekes), Kirsi Karhu and Jukka Salmela (YTV), Timo Ahonen (Fortum Oyj), Jaakko Ruokomäki (Wärtsilä Finland Oy), Petteri Jokinen (Espoon Vesi Oy) Jukka Sillanpää (Mölnlycke Health Care), Juha Karjalainen (Preseco Oy), Jorma Manninen (Ekokem Oy), Jarno Laitinen (Doranova Oy), Pekka Pouttu (Kiertokapula Oy), Ari Leiskallio (Päijät-Hämeen Jätehuolto Oy) and Toni Kinnunen (Ecocat Oy).
The researchers thank the project’s advisory board for its active participation and input to the project.
5
Contents
Abstract ...........................................................................................................................3
Preface ............................................................................................................................4
1. Introduction ................................................................................................................7
2. Biogas Utilization .......................................................................................................9
3. Biogas Trace Compounds .......................................................................................12 3.1 Siloxanes .................................................................................................................................. 12
3.1.1 Health Risks of Siloxanes .......................................................................................... 14 3.1.2 The Presence of Siloxanes in Wastewater and Waste .............................................. 14 3.1.3 The Effect of Siloxane in Gas Engines and Turbines................................................. 15 3.1.4 The Effect of Siloxane in Fuel Cells ........................................................................... 16 3.1.5 Siloxanes’ Effect on the Catalytic Treatment of Process and Flue Gases ................. 17
3.2 Sulphur Compounds................................................................................................................. 17 3.2.1 Landfill Gas................................................................................................................ 18 3.2.2 Gas Produced in Bioreactors ..................................................................................... 18
3.3 Halogens .................................................................................................................................. 19 3.4 Ammonium ............................................................................................................................... 19
4. Measurement Methods ............................................................................................20 4.1 Siloxanes .................................................................................................................................. 20 4.2 Hydrogen Sulphide, Organic Compounds and Ammonium ...................................................... 22
5. Concentration Levels of Trace Compounds in Biogas and Landfill Gas..................23 5.1 Siloxane.................................................................................................................................... 23 5.2 Sulphur and Halogens .............................................................................................................. 25
6. Biogas Purification ...................................................................................................26 6.1 Water Removal......................................................................................................................... 26 6.2 Siloxane Removal from Biogas................................................................................................. 27
6.2.1 Filtration Techniques.................................................................................................. 27 6.2.1.1 Adsorption onto Activated Carbon and Mineral-Based Material............... 27 6.2.1.2 Combination Filters .................................................................................. 30

6
6.2.2 Cooling....................................................................................................................... 32 6.2.3 Scrubber Techniques................................................................................................. 34 6.2.4 Membrane Techniques .............................................................................................. 36 6.2.5 Example Sites and Solutions Available on the Market ............................................... 36
6.3 Removal of Sulphur from Biogas .............................................................................................. 40 6.3.1 Sulphur Removal for Fuel Cells ................................................................................. 42 6.3.2 Expenditure................................................................................................................ 43
7. Development of Field Measurements of Siloxanes .................................................45
8. Measurement Campaigns........................................................................................47 8.1 Sites ......................................................................................................................................... 47 8.2 Measurement Method............................................................................................................... 47 8.3 Measurement Results............................................................................................................... 48 8.4 Comparison to Biogas Specifications for Different Gas-to Electricity Concepts........................ 49 8.5 Solutions for Siloxane Removal................................................................................................ 50 8.6 Factors Affecting Altering Biogas Siloxane Content ................................................................. 51
8.6.1 Waste Disposal Affecting the Siloxane Concentration in Landfill Gas........................ 51 8.6.2 Temperature .............................................................................................................. 52
9. Biogas Purification Cost Estimation.........................................................................53 9.1 Case 1: Landfill Gas Treatment and Utilization (Site 1) ............................................................ 54
9.1.1 Treatment Systems for Desulphurization ................................................................... 55 9.1.1.1 Catalytic Chemical Scrubbing with Chelated Iron .................................... 55 9.1.1.2 Chemical-Biological Removal .................................................................. 56 9.1.1.3 Biological Scrubbing ................................................................................ 56 9.1.1.4 Cost Estimate........................................................................................... 57 9.1.1.5 Costs of Other Sulphur Removal Technologies ....................................... 57
9.1.2 Systems for Removal of Organic Silicon from Landfill Gas........................................ 58 9.1.2.1 Activated Graphite Filtration..................................................................... 58 9.1.2.2 Synthetic Resin Filtration ......................................................................... 59 9.1.2.3 Condensation and Adsorption.................................................................. 59 9.1.2.4 Cost Estimate........................................................................................... 59
9.2 Case 2: WWTP Digester Gas (Site 4) ...................................................................................... 60 9.3 Discussion ................................................................................................................................ 62
10. Summary and Conclusions......................................................................................63
Acknowledgements .......................................................................................................66
References ....................................................................................................................67
Appendix A: Field Measurement

7
1. Introduction
In 2007, the total production of biogas in Finland was 139 million m³. Digester gas (31 million m³) was produced in 15 reactors in municipal wastewater treatment plants (WWTP), in three municipal waste treatment plants, in eight agricultural site an-aerobic plants and in three industrial wastewater anaerobic treatment plants. 87 % of the obtained biogas was used in energy production. Landfill gas was collected from 33 landfills totalling 107 million m³. 63 % of this gas was utilized for the production of 277 GWh of energy. The degree of landfill gas utilization was 53 % (Kuittinen et al. 2008).
In total, 366 GWh of heat and 53 GWh of electricity were produced using biogas. The degree of utilization increased from 62% to 69 % 2006–2007. Production in Finland is still modest compared to Europe’s major producer countries (Germany, the UK and Italy). Finland’s share in European biogas production is less than 1 %. Although both production and primary biogas energy production has steadily been growing, the per capita production is still < 60 % of the EU average (Eurobserver 2008). The use of biogas is increasing noticeably. Figure 1 shows the predicted installed capacity of biogas – to electricity in Europe:
Figure 1. Installed biogas electricity production capacity. Forecast 1998–2010 (Frost & Sullivan 2003).

1. Introduction
8
Table 1. Biogas energy market. The shares of different sectors (Frost & Sullivan, 2003).
2001 (%) 2010 (%) Landfills 61 57 WWTP 25 26 Agriculture 11 12 Industry 3 5
Frost & Sullivan’s market analysis (2003) gives that landfills are still the largest sector in gas production (Table 1). Due to the landfill directive, their share is estimated to decrease in the EU after 2010, while the other sectors will grow. The formation of gas in landfills is gradually decreasing as landfill disposal of biodegradable waste is being limited in the EU.
In 2008 Helmut Kaiser Consulting estimated the world market of biogas and biogas plants to about 2 billion euro in 2006 and expected over 25 billion by 2020. USA and China show a greater growth potential as Germany and Europe. Many plants are low tech and easy to reproduce and design. The key is the knowledge in biotechnology, molecular science and optimization in the future.
Interest in using landfill gases has continuously increased also in the United States. In 2006, it was estimated that in the US there were approximately 290 sites where electricity is produced by gas, 80 sites where gas is used in direct heating and 8 landfills where gas is refined into fuel and led into the natural gas pipeline (McCarron & Pierce, 2006).
For the versatile use of biogas as fuel, it is necessary to remove harmful impurities that affect the utilization as an energy source. The most significant impurities that require removal are corrosion-causing sulphur compounds and organic silicon compounds, in particular, siloxanes. Siloxanes transform into silicon dioxide on the surfaces of gas engines and turbines and thus, damage the equipment. Hydrogen sulphide is generally present in all biogases. Siloxanes and halogens are mostly the problem of landfills and digestion of municipal and industrial waste, including sludge.
The objective of this study was to gather know-how on biogas impurities and the concentration level as well the solutions for trace compound removal. Further impurities’ technical and economical impact on biogas usage is discussed. The emphasis of this study was the harmful components of biogas electricity production and especially siloxanes. In addition to the occurrence and removal of biogas impurities, current methods of determining siloxane and their limitations evaluated.
The first part of the report is a literary study based on the existing scientific and economic literature (2000 →) as well as the patents concerning biogas purification. The information gathered has been substantiated as far as possible by consulting experts in the field. The literature study is followed by the description of a new method for determioning biogas matrices in the field. This method was used to produce the reported results on biogas trace compound levels at different sites in Finland.

9
2. Biogas Utilization
Worldwide, the most common way to utilize biogas is to produce electricity with gas engines (Fig. 2). The sizes of gas engine plants vary from a few hundred kilowatts to several megawatts, whereas gas turbines are mostly used for larger amounts of gas. Microturbines, according to their name, are small, approximately 30–250 kW plants. The number of microturbines that use bio- and landfill gas has increased, also in Finland, during the previous year. Approximately ten engines are currently in use.
Figure 2. Utilization of landfill gas according to Willumsen (2004).
Table 2 below illustrates the general requirements in the quality of biogas in different electricity production methods. The demands of different equipment suppliers vary somewhat, in which case they depend not only on technical factors, but also on the guarantee policy of the supplier in question. Table 3 presents a comparison of the criteria used by four gas engine producers for the quality of gas they set for their own equipment.
Heat
Kiln
Steam turbine
MicroturbineLeachate evaporation Vehicle fuel
Fuel cell Gas turbine
CHP
Gas engine
Upgrading to natural gas

2. Biogas Utilization
10
Table 2. Biogas quality criteria in electricity production (EPRI 2006, Ruokomäki 2009). (NB. Content calculated methane per cubic meter).
Reciprocating engine Turbine Microturbine Fuel cell
(SOFC) Stirling engine
Input pressure, bar 0.2–1.4 14–24 3.5–5 0.14
Sulphur, ppm CH4 545–1 742 < 10 000 25–70 000 < 1 280
Total silicon, ppm CH4 9–44 0.087 < 0.01 < 0.01 0.42 (D4)
Halogens, ppm CH4 60–491 (Cl) 1 500 200 <5*) 232 (as HCl)
*) as ppm in biogas
The figures mentioned in the table are mostly suggestive and vary according to the supplier and the application. For example, in theory the turbine generator designed for landfill gas works on gas, which contains over 10 000 ppm H2S. In practice, the tolerance for the quantity of sulphur can be considerably lower. In the high pressure of the turbine, condensation water forms easily. It can be highly corrosive when gas containing sulphur and / or halogen is used (Heguy & Bogner 2004). Turbines working under high temperature are also more prone to damage caused by siloxanes (Fig. 3). In practice, the electrical output decreases considerably if siloxanes are present in the gas (Nourut 2006).
Stirling engines are small (10–15 kW) devices, of which the experiences in the biogas sector are predominantly experimental.
Figure 3. Silicate layers present in a microturbine (Pierce 2005).

11
Tabl
e 3.
Crit
eria
set
by
gas
engi
ne m
anuf
actu
rers
for t
he q
ualit
y of
gas
use
d in
equ
ipm
ent.
NB
. Con
cent
ratio
ns a
re p
rese
nted
in m
etha
ne p
er c
ubic
met
er
(Env
ironm
enta
l Age
ncy
2002
, Bee
se 2
007)
.
Je
nbac
her
Deu
tz
Cat
erpi
llar
Wau
kesh
a M
an
Hea
ting
Val
ue
max
imal
var
iatio
n:
< 0.
5 %
CH
4 (v/
v) /
30 s
> 14
.4 M
Jm-3
15
.7–2
3.6
MJm
-3
(rec
omm
ende
d)
> 15
.7 M
J m-3
Tot
al su
lphu
r m
g/m
³ CH
4 2
000
(with
cat
alyz
er)
1 15
0 (w
ithou
t cat
alyz
er)
(tota
l sul
phur
as H
2S)
< 2
200
(H2S
< 0
.15
v-%
) <
2 14
0 <
57 m
g H
2S/M
J (to
tal s
ulph
ur a
s H2S
)
< 71
5 m
g/m
³ CH
4 (th
e su
m o
f sul
phur
con
tain
ing
com
poun
ds)
< 30
0 (H
2S <
200
ppm
)
Hal
ogen
s (C
l+Fl
) m
g/m
³ CH
4
with
out c
atal
yzer
:
< 1
00 m
g/m
³ CH
4 w
ith li
mite
d gu
aran
tee:
100
–400
mg/
m³ C
H4
no g
uara
ntee
:
> 4
00 m
g/m
³ CH
4 w
ith c
atal
yzer
: n.d
.
< 10
0
Cl <
713
<
300
(as C
l) <
100
Silic
one
(Si)
mg/
m³ C
H4
10 (w
ithou
t cat
alyz
er)
n.d.
(with
cat
alyz
er)
< 10
< 21
<
50 (t
otal
am
ount
of
silo
xane
s)
< 5
(Si)
Am
mon
ia
mg/
m³ C
H4
< 55
< 10
5
<
50
Part
icle
s
m
g/m
³ CH
4
< 50
(s
ize
< 3
µm)
< 10
(s
ize
< 3-
10 µ
m)
< 30
(<1
µm)
< 0.
3 µm
<
10 (<
5 µ
m)

3. Biogas Trace Compounds
12
3. Biogas Trace Compounds
3.1 Siloxanes
Siloxanes are organic, linear or cyclic silicon compounds (Si) (Fig. 4) Siloxane compounds are used in many industrial processes and consumer products, such as hygiene products, cosmetics and biopharmaceuticals, fuel additives, car waxes, detergents and antifoams (Table 4).
Figure 4. Decamethylcyclopentasiloxane (D5) and hexamethyldisiloxane (L2).
Table 4. The use of siloxanes and silicones.
Sector Products
Medical usage Implants, tracheostomic tubes, coating hypodermic needles and bottle stops, coating peacemakers
Elastomer usage Gels (nappies, barrier / protective creams, gloves
Other chemical products Glues and paints, softeners, paper products, cosmetic products, shoe polish, anti-foams, fire retardants

3. Biogas Trace Compounds
13
Cyclic siloxanes are designated with the letter D, whereas the linear compounds are designated with the letter L or with the M- nomenclature (Wheless & Pierce 2004). The number following the letter refers to the quantity of silicones in molecules. Out of all the hundreds of different siloxanes in use, the most commonly occurring ones in landfill and biogases are L2-L5 and D3-D6. Their characteristics and designations are listed in Table 5. Out of these, D3 among others is difficult to detect and quantify. The compound is unstable and easily condensates to a bigger compound (http://www.appliedfiltertechnology.com).
In addition to those mentioned before, silanols, among others trimethylsilanol, occur in the gas. Silanols are unstable degradation products of silicone that easily condensate into siloxane compounds (Grümping & Hirner 1999).
Table 5. Organic Silicon compounds occurring in biogas.
CAS Compound Abbreviation MM g/mol
Boiling point, C°
Water solubility,
25 °C, mg/l 107-46-0 Hexamethyldisiloxane L2 MM 162 106.9 0.93 541-05-9 Hexamethylcyclotrisiloxane D3 223 135.2 1.56 107-51-7 Octamethyltrisiloxane L3 MDM 237 153 0.034 556-67-2 Octamethylcyclotetrasiloxane D4 297 175.7 0.056 141-62-8 Hexamethyltetrasiloxane L4 MD2M 311 194 0.00674 541-02-6 Decamethylcyclopentasiloxane D5 371 211.2 0.017 141-63-9 Dodecamethylpentasiloxane L5 MD3M 385 232 0.000309 540-97-6 Dodecamethylcyclohexasiloxane D6 444 245.1 0.005 1066-40-6 Trimethylsilanol TMS 90 4.26E+4
Gaseous siloxanes also occur in the semiconductor industry as byproducts of the gaseous silicone reactions. These gaseous siloxanes are detrimental to the production process and thus, they are usually removed by adsorbing them into silica gel, molecular sieves or onto activated aluminium oxide (Higgins 2006, Ikeda & Abe 2001). Volatile siloxanes appear in the industrial processes of plastic and hygiene products. These are not harmful to the environment as such, but may cause technical problems with purification of the emissions. Silicones are also used as anti-foaming agents in digesters, where some of them are broken down into siloxanes (Dewil et al. 2006).
Siloxanes are primarily considered to be biologically stable compounds. However, there is some indication that, for example, D4 can decay in anaerobic conditions. However, the decomposition is very slow. In the study by Grümping et al. (1999), only 3 % of D4 decomposed during an experiment of 100 days. As a decay product dimethylsilanediol, DMSD was formed. However, Accetola et al. (2008) showed recently in their research on biotrickling filters for the treatment of air streams polluted with siloxane a removal of 10–20 % D3. Pseudomonas was identified as the predominant genus in the mixed population.
The use of siloxanes has been continuously increasing worldwide (Wheless & Pierce 2004). In 2001, it was estimated that there were over 14 000 different products on the market containing

3. Biogas Trace Compounds
14
siloxanes (Trimborn et al. 2003). In particular, the production volumes of D4, D5 and L2 (MM) were considerable in Europe. On the other hand, in the Nordic countries the industrial usage of L4 (MD2M), L3 (MDM) and L2 is less common compared to the usage of D4 and D5. There are no public statistics on the usage of D3, D6 and L5. Anyhow, for most products, importers are not obliged to register the full content of chemicals. It is therefore difficult to estimate the true use of siloxanes in the Nordic countries (Nordiska ministerrådet 2005).
3.1.1 Health Risks of Siloxanes
As a consequence of their common usage, the occurrence of siloxanes in the environment is quite usual. However, exposure to siloxanes present in the environment is not considered to be a very great health risk. According to research, the effects that most compounds have on health are minor. On the other hand, research conducted within the last 10 years indicates that certain siloxanes may have a direct or indirect toxic effect on biological processes (Nordiska ministerrådet 2005).
L2 has been found to irritate skin. OSPAR (The Convention for the Protection of the Marine Environment of the North-East Atlantic) classifies Hexamethyldisiloxane (L2) as a dangerous substance. In the EU, D4 has been classified as an R62 substance, meaning that it “may possibly weaken fertility” and as an R53 substance “may cause long-term negative effects in the water environment” (Nordiska ministerrådet 2005). Swedish Chemical Agency has classified D4 a PBT/vPvB1 chemical and should gradually be taken out of use. Also in Denmark, the Association of Danish Cosmetics, Toiletries, Soap and Detergent Industries (SPT) plans to replace D4 with another substance (Miljøstyrelsen 2004).
United States EPA has indicated that D5 can possibly be a carcinogenic substance (US EPA 2003). However, according to the investigation carried out by CES (Centre Européen des Silicones), D5 and D6 are not dangerous to human health (http://silicones-science.com).
3.1.2 The Presence of Siloxanes in Wastewater and Waste
The siloxanes present in wastewater primarily originate from hygiene products, shampoos, and other hair-care products, lotions, etc. In wastewater treatment, siloxanes are adsorbed onto flocks of activated sludge. Siloxanes do not, as such, decompose biologically, but accumulate in the activated sludge. The siloxane concentration of the sludge rises considerably in comparison to the wastewater (Dewil et al. 2006). In the sludge digestion, the siloxanes volatilise and transfer to the gas phase. The heaviest siloxane compounds remain in the sludge and can cause problems in the treatment of emission from sludge incineration. Kazouki et al. 2007 estimated that 20–50 % of D5 in wastewater and activated sludge transfers to biogas and the rest remains in the digestion residue.
1 PBT: persistent, bioaccumulating and toxic, PvBv: very persistent and very bioaccumulating.

3. Biogas Trace Compounds
15
L2 and L3 compounds do not usually appear in digester gas. The difference between landfill and digester gas depends on the water solubility of the compounds. Water soluble siloxanes remain in the water phase, and move together with the purified water back into the water system, whereas insoluble siloxanes adsorb into the activated sludge. The water solubility of L2 is considerably greater than that of D4 or D5, although L3 is as insoluble as D4 (Table 3, Wheless & Pierce 2004).
Landfill siloxanes originate primarily from waste canisters and jars, which contain the remnants of silicon-concentrated products (detergents, cosmetics, etc), and also from sewage sludge disposed of on the landfill. The siloxane concentration is usually higher in active landfills rather than in ones that are closed.
The age of the waste found at a landfill correlates with the generally forming siloxane concentration of the landfill gas. The reason for this is probably that, with time, the siloxanes evaporate from the waste, or that landfilled waste contained fewer silicone and siloxane compounds before than they do now.
According to the literature, the most common siloxanes found in landfills are D3, D4, D5, L2 and L3. D4 is usually the largest component and forms on average 60 % of the total silicon concentration. The second most common is L2, followed by D5 and L3 (Wheless & Pierce 2004).
In addition to siloxanes, considerable concentrations of silanol can be found in landfill gases. Silanols may amount to as much as 50 % of the total gas concentration. As silanols are watersoluble, they appear less in biogas produced in municipal sludge digestion (Urban & Ungern 2005).
3.1.3 The Effect of Siloxane in Gas Engines and Turbines
Organic siloxanes are semi-volatile compounds. The gaseous compounds are not reactive or corrosive as such, but they do turn into hard, abrasive silica in the engine’s combustion chamber. The siloxanes form a lacquer coating on all the engine surfaces in contact with oil and thus, can alter the oil retaining surface finish of cylinder liners.
In the combustion of siloxane, gas microcrystalline silica is formed, which has similar properties to that of glass. This very hard substance abrades the engine surfaces and additionally acts as a thermal insulator on the surfaces. As an electrical insulator, silica impairs measurements in the combustion chamber and represses the function of spark plugs. In addition to engine damage, silica coats the spark plugs, cylinders, cylinder heads, valves and emission catalyst with white deposit, as well as hampers the possible catalytic exhaust gas treatment. The latter is used for removal of nitrogen oxides from the emissions (Hagmann et al. 1999).
Crystalline sand accumulates in motor oil and coats the inner surfaces of the turbine. The problem is accentuated in spark ignition engines designed for biogas usage, which rotate rapidly and work under high temperature. So called dual fuel engines (slower, lower temperature, with diesel oil to aid ignition) are less prone to silica deposits.
Quartz layering can cause the need for maintenance to increase five- or tenfold. The time between full maintenances can shorten from the normal 40 000–20 000 hours to 14 000 hours. In serious cases, the engine requires full maintenance already after 2 000–4 000 hours of use. One extreme example is the Trecatti plant in Great Britain, which was damaged within 200 h of operation. The concentration of the gas in Europe’s biggest landfill exceeded 400 mg/m3 (Dewil et al. 2006).

3. Biogas Trace Compounds
16
Smaller siloxane concentrations form a gold-coloured lacquer surface on the components outside the combustion chamber (Fig. 5). The lacquer is especially obvious on the inner surfaces of the cylinder heads. The layer impairs oil adherence on the surface but does not otherwise cause serious damage.
Figure 5. Gold-coloured siloxane layer on the inner surfaces of a cylinder (Environmental Agency 2002).
According to a German research, in 45 % of biogas-to-energy plants where the gas is generated from municipal waste, damage caused by siloxanes is found (Rossol & Schmelz 2005). The research conducted in 2001 concerned biogas from municipal sludge and landfill gas
In the combustion process of a gas engine, organic silicon compounds form a solid insoluble layer on the inner piston surface. The layering is white or light gray. The layer consists mainly of crystalline silicon dioxide SiO2 and solid metals (Environmental Agency, 2002).
These deposits severely reduce engine life, since the engine needs to be stripped down and the solids manually scraped off the piston, cylinder head and valves. Through the combustion process, some silicon compounds are also partitioned to the engine oil, which needs to be changed more frequently at sites with high siloxane levels in the inlet gas fuel.
Siloxanes do not directly cause problems with gas engine exhaust emissions, although the increased wear may show as an increase in SOX emissions as lubricating oil is burnt and increased CO emissions due to inferior engine operation (Herdin et al. 2000). Siloxanes in the biogas do not cause a significant risk to the environment. Investment in siloxane purification techniques is made purely on economic grounds (Wheless & Pierce 2004).
3.1.4 The Effect of Siloxane in Fuel Cells
Several studies have been conducted on poisoning by siloxanes in the fields of gas turbine, gas engine, gas sensor, etc, however, little is known about the influence of siloxane on SOFC performance. Presence of siloxane can cause deposition-type degradation. Figure 6(a) shows the effect of 10 ppm D5, one major siloxane species in a digester gas, on electrochemical activity of solid oxide fuel cell anodes. Cell voltages decreased gradually with time, poisoning by siloxane for 30 to 50 h resulting in a fatal degradation of cell performance. This degradation is associated with the formation of SiO2 (s) in porous anodes, as shown in Fig. 6b as dark-gray precipitates.

3. Biogas Trace Compounds
17
Figure 6. (a) Cell voltage poisoned by 10 ppm siloxane (D5) and FESEM secondary electron images of the anode after 40-h poisoning by 10 ppm siloxane (D5) (b) top surface of the anode (Haga et al. 2009).
3.1.5 Siloxanes’ Effect on the Catalytic Treatment of Process and Flue Gases
Together with bio- and landfill gas, volatile organosilicon compounds appears in emission from e.g. regranulation of plastics, plastics compounding, coating processes, drum reconditioning, treatment of plastics wastes for utilization, as well as in mechanical-biological waste treatment plants. Siloxanes become problematic if the emission is treated catalytically or utilized in regenerative combustion. Amorphous silicon dioxide precipitates on the surfaces of heat exchangers clogging the honeycombs (Fig. 7). Periodically, the ceramic beds need to be dismantled and cleaned with pressure steam and reassembled, usually manually (Carlowitz et al. 2007).
Figure 7. Silicate layers on a catalytic after-burner (Pierce 2005).
3.2 Sulphur Compounds
Most of the sulphur found in landfill- and biogas is hydrogen sulphide. In addition, varying levels of carbonyl sulphide (COS), mercaptans (thiols) and disulphides occur in the gas. Elevated concentration of hydrogen sulphur causes acidification of oil and reduced oil lubricity. Sulphur deposits in exhaust gas heat exchanger, when temperature is below dew point (Fig. 8).

3. Biogas Trace Compounds
18
Figure 8. Sulphur deposits in gas engine (Duller 2005).
In fuel cells (eg SOFC) sulfur compounds (H2S, COS, CH3SH) cause an initial cell voltage drop followed by a quasi stable cell voltage. In addition, the presence of CH3SH (methyl mercaptane or methanethiol) can lead to an additional gradual decrease in cell voltage (Haga et al. 2008).
3.2.1 Landfill Gas
In landfills, hydrogen sulphide occurs as a result of anaerobic processes of sulphide reducing microbes. Typically, landfill gas contains <100 ppm hydrogen sulphide; however, the concentrations can rise to several thousand ppm in landfills with a high sulphur load.
High concentrations have been measured at landfills where large quantities of plasterboards or sulphide containing sludge, such as wastewater sludge or flue gas desulphurization sludge have been deposited. The sulphur concentration of gas is often also high in landfills, where crushed construction waste is used as covering, which has contained considerable quantities of gypsum fibre panels. Covering landfills with sulphate-bearing soil, such as quarry material, can also increase the sulphur concentration of the forming gas (Hegey & Bogner 2004).
3.2.2 Gas Produced in Bioreactors
Volatile sulphur compounds formed in digester reactors are products of different biological processes. For example, methanethiol and dimethylsulphide (DMS) are formed whens ulphur containing amino acids are degraded (e.g. manure contains amino acids of this type). DMS is then reduced to methane and methanethiol, which further decomposes into methane, carbon dioxide and hydrogen sulphide (Rasi et al. 2007).
Biogas and motor oil often contain small quantities of water. Solved into the water phase sulphur compounds are corrosive and cause damage to the cylinder surfaces and piston rings in the engine. In addition, gas recirculation systems may increase the availability of moisture within the engine system. This also affects oil quality, leading to the need for more frequent oil changes. Most gas engine

3. Biogas Trace Compounds
19
producers set a recommended value for the total sulphur content and not for individual sulphur compounds (Tables 2 and 3).
3.3 Halogens
Halogens are chlorine, bromine and fluoride containing substances (e.g. carbon tetrachloride, chlorobenzene, chloroform and trifluoromethane). The compounds break down in the engine during combustion. In the water phase, the compounds form the corrosive and acidic hydrogen chloride, HCl, hydrogen bromide HBr and hydrogen fluoride HF. Incinerating halogens at a low temperature < 400 °C may also lead to the forming of dioxides (PCDD and PCDF). Halogens also dissolve in motor oil. According to the halogen concentration, more frequent oil change may be necessary. Gas engine producer Cl and F recommended levels are presented in Tables 2 and 3.
Most halogenated volatile compounds are directly released from the waste, and their quantity depends on the internal conditions such as the pressure and the temperature in the landfill. Organic chlorinated compounds originate from consumer products of the chemical industry deposited at landfills. The most commonly occurring fluoric compounds in landfill gas are CFC substances used in refrigerants, insulation foams and propellants. CFC-12 (dichlorodifluoromethane) and CFC-11 (trichlorofluoromethane) are stable compounds and evaporate quite slowly from landfill waste (Environmental Agency 2002).
As a result of the reduced usage of halogen and particularly HCFC substances, the halogen concentration in biogas has decreased considerably in comparison to previous years.
3.4 Ammonium
Ammonium occurs primarily in biogas from thermophilic digestion and/or if the feed contains considerable amounts of nitrogen (eg. protein-containing waste). The engine manufacturer’s recommended levels for ammonium are presented in Table 3. In the combustion process, nitric oxide (NO) is formed from ammonium, which further reacts forming other nitric oxides in the atmosphere. The ammonium concentration in landfill gas is often not more than a few ppm. Also the ammonium concentration in the gas produced in bioreactors is normally quite small. The following factors may cause the ammonium concentration to rise in sludge digestion:
– the pH value of the process is > 8.3 (e.g. using chicken manure as feed raises the pH value)
– periodic pumping into the gas space of the fermenter, or turbulent manure inlet (ammonium is stripped from the sludge into the gas)
– too fast mixing.
An increased pH is more common in high temperature, and high concentrations of ammonium appear mostly in thermophilic processes. Fast mixing or agitation of the sludge contributes to separating the ammonium from the liquid into the gas phase, where the ammonium concentration of the gas rises (Schnell 2003).

4. Measurement Methods
20
4. Measurement Methods
Landfill gas and digester gas are complex gas matrices containing a large number of different trace compounds with a broad range of volatility, concentration and polarity. Furthermore, depending on the detection technique, moisture and the overpowering concentrations of methane and carbon dioxide can complicate the analysis.
4.1 Siloxanes
At present, there are no standard methods for analyzing siloxanes in the gas matrix. Based on the literature search, several different methods are available for analysis (among others Grümping et al. 1998, Huppman et al. 1996, Tuazon et al. 2000, Schweigkofler & Niessner, 1999, Stoddart et al. 1999, Varaprath et al. 2006, Hagmann et al. 1999). Accurate analysis is challenging. The group of organosilicons contains many physically different compounds. The concentration of individual compounds is often small. In addition, particularly D3 and trimethylsilanol are chemically unstable compounds.
Gas phase sampling can be done by collecting the gaseous sample into a metal canister or a gas collection bag, by collecting the substances onto an adsorbent or absorbing it into an organic solvent using the impingers. Table 6 provides a summary of the compatibility of different sampling techniques.
The simplest technique – and the most common in Europe – is to collect the gaseous sample into a bag or metal canister. Glass containers are not recommended (Hagmann et al. 1999). Theoretically, the result is good, although the problem is that particularly the heaviest molecules (D5, D6) can adsorb onto the walls of the canister or bag. Saeed et al. (2002) emphasized, that, in addition to the physical loss, in particular the chemical reactions of the heavy and polar compounds on the walls of the canister or bag can be significant. Additionally, the so-called surface effects can be considerable.
According to Häusler and Schreierin (2005), aluminium-coated sampling bags are not as suitable for siloxane sampling as Tedlar bags. Relative losses are smaller with larger sampling bags (Fig. 9).

4. Measurement Methods
21
Table 6. Sampling techniques of gaseous siloxane.
Method Advantages Disadvantages Material Recovery
Compatibility with sampling other impurities in the gas
Metal canister Quite good
Tedlar bag Good Gas sample taken into canister or gas bag
Simple, fast
Poor representation if the consistency of the gas varies. Less suitable for heavy siloxanes.
Aluminium coated bag
Adsorption effect
Compatible
XAD Imperfect adsorption Varies
Collection onto adsorbent
Relatively simple sample
Possibility of longer sampling time, in which case a more representative sample is obtained
Activated carbon
Depends on the quality of activated carbon
Poor representation if the consistency of the gas varies
Tenax Good Varies
Impinger
Requires an ice bath in the field. More demanding sample train setting
Longer sampling time is suitable for varying gas concentrations
Methanol, n-hexane, dodecane etc.
Usually good, D3 more difficult
Limited suitability (depends on the compound)
0
20
40
60
80
100
1 10 20 30 40
days
% o
f ini
tial c
once
ntra
tion
Tedlar 1 l
Tedlar 5 lAluminium 2,5 l
Aluminium 22,5 l
Figure 9. The preservation of the gas sample’s siloxane concentration in the gas sampling bag according to Häusler and Schreier (2005).
The total concentration of siloxanes absorbed into an organic solvent can be determined with atomic absorption spectrometry (AAS). The determination of total siloxane is also done by means of an atomic emission detector (GC/AED) (Hayes et al. 2003).

4. Measurement Methods
22
Individual siloxane compounds are usually determined in a more general way with a GC/PID, or with a GC-MS or AED. Methanol is often used as a solvent. As siloxane standards are not readily available to laboratories, quantification (mg/m³) is sometimes done as toluene equivalents, which often underestimates the true concentration.
A technique for determining the total silicum concentration has also been developed where the organic siloxane compounds are combusted to silicates in a so-called combustion tube. The silicate is collected in a sodium hydroxide solution and the silicum concentration of the solvent it determined photometrically. The necessary sample quantity is several hundreds of litres, which is why the technique is rarely put into practice (Häusler & Schreier 2005).
In the US, siloxanes are generally determined by absorbing the sample into methanol or by taking a gaseous sample into a metal canister. Gas bags and adsorbents (XAD, activated carbon) are considered unreliable. The determination itself is done by GC/AED or by GC/MS (Hayes et al. 2003).
In Germany, samples for siloxane determination are often taken into gas bags. Additionally, adsorption onto activated carbon or absorption into an organic solvent, e.g. n-decane is used. The concentrations of individual siloxane compounds as well as the total concentrations of siloxanes are determined by MS-GC (Rossol & Schmelz 2005).
In Finland, gas sampling and analysis have not been standardized, but the procedure varies among different measuring laboratories. Organic compounds and halogens are usually determined by collecting the sample onto an adsorbent (Tenax, activated carbon) and by analyzing the sample by gas chromatography-mass spectrometry GC-MS. The quantitative result (mg/m³) is often presented as toluene-equivalents, which does not necessarily correspond to the correct concentrations of the sample.
4.2 Hydrogen Sulphide, Organic Compounds and Ammonium
Hydrogen sulphide is not a very stable compound, thus on-line sampling and determination with a detector calibrated in the field is recommended. High concentrations, which exceed the measuring range of the field analyzer, are determined in the laboratory from bag samples. Hydrogen sulphide poorly adsorbs onto most sorbents. Field analysis is hampered by other (organic) sulphide compounds. On the other hand, in most cases the hydrogen sulphide concentration in biogas is multiple compared to other sulphur compounds, in which case the drawback in practice, has only a limited significance (Environmental Agency 2004).
The sampling of organic sulphur compounds and VOCs in gas is often conducted by collecting the sample onto a Tenax TA-sorbent. The sorbent’s ability to retain water is poor and thus, the water contained in the analysis gas does not disturb the sampling. In Britain, the use of dual-sorbent is recommended. Such as Unicarb which contains activated carbon as well as a porous resin (Environmental Agency 2004). The samples are thermally desorbed and determined by a MS/GC. The concentration of the compounds is usually low in the gas phase, in which case direct headspace (gas phase) determination is more difficult to carry out.
Ammonium is determined by absorbing it into a solvent or on-line with a field detector. Sampling bags are not suitable for the sampling of low concentrations of ammonium.

5. Concentration Levels of Trace Compounds in Biogas and Landfill Gas
23
5. Concentration Levels of Trace Compounds in Biogas and Landfill Gas
5.1 Siloxane
The major part of siloxanes analyzed in bioreactor-produced gas is D4 and D5. These two often make up > 90 % of the total concentration of biogas siloxanes. In comparison to landfill gases, biogas from municipal sludge digestion usually has a higher siloxane concentration. Landfill gas may contain significant quantities of other siloxanes, such as D3 and D6, as well as L2–L5. According to Wheless’ and Pierce’s measurements (2004) the siloxane content in landfill gas in US landfills is averagely slightly above 50 % D4 and D5 (Wheless & Pierce 2004). In addition, the concentration in old and closed landfills is generally smaller than in new ones, where silicon-containing waste is continuously disposed of.
Biogas produced in manure digestion does not contain siloxanes, although the sulphur concentration may be high. Additionally, siloxanes are not found in bioreactor gases, where pure food waste is used as input.
The most comprehensive public information on biogas siloxane content concerns gas produced or formed in the US and German municipal sludge bioreactors and landfills.
According to Häusler and Schreierin (2005), the silicon concentration in German landfill gas usually varies between 1 and 8 mg/m³. The value corresponds to approximately 3 and 25 mg/m³ total siloxane and is based on 340 measurements carried out in 123 landfills. The average siloxane concentration (N=308) in the German wastewater treatment plant was 14.9 mg/m³ (0–317 mg/m³) (Beese 2007). High concentrations were measured in a region where a cosmetics factory using silicon was situated. In a less industrialized region, the silicon concentration was 0.5–4 mg/m³ (the measurement result of 10 different plants) (Rossol & Schmelz 2005). According to Vesteragen and Matthiesen (2004), the most abundant siloxane components were D5 (11–314 mg/m³) and D4 (6–25 mg/m³).
D3 and L2-L4 formed in total < 6 % of the total concentration. The authors mentioned above, however, underlined that the measurement results presented publicly often concern problematic locations, in other words sites where damaged equipment had been identified. When taking into consideration all the landfill and WWTPs, biogas’s general level of siloxane is probably somewhat lower.
The results from the German measurement mentioned above can be considered representative for the situation in other Central European countries (Table 7).

5. Concentration Levels of Trace Compounds in Biogas and Landfill Gas
24
Table 7. Siloxane concentrations in Central-European locations (Dewil et al. 2005, Lunghi et al. 2004).
Target Location Total siloxane concentration (mg/m³)
Municipal sludge digestion Zürich, Switzerland 25.1
Municipal sludge digestion Neuburg, Germany 59.8
Municipal sludge digestion Saint-Truiden, Belgium 20.0
Municipal sludge digestion Minworth, UK → 16
Municipal sludge digestion Trecatti, UK → 400
Landfill Berlin, Germany 36.3
Landfill Augsburg, Germany 4.8
Landfill Vienna, Austria 9.3
Landfill Italy 12
In a US study, the average biogas siloxane concentration in 50 WWTPs was 6.1 ppm (equivalent to approximately 38 mg/m³ total siloxane). The major components were the D4 and D5 (Tower 2003). The concentrations of other siloxanes accounted for an average of 10 % of the total concentration (Table 8).
Table 8. Organic silicon compounds (ppb) identified in the biogas of 50 WWTPs (Tower 2003).
Occurrence, number
Min. Max. Average
Butoxytrimethylsiloxane 1 --- --- 920 Methoxytrimethylsilane 1 --- --- 227 1,1,3,3-Tetramethyldisiloxane 1 --- --- 85 Pentamethyldisiloxane 2 51 100 76 Hexamethyldisiloxane. L2 10 46 2 260 847 Octamethyltrisiloxane. L3 12 32 465 183 Hexamethylcyclotrisiloxane, D3 5 285 8 700 2 155 Octamethylcyclotetrasiloxane, D4 46 33 20 144 2 456 Decamethylcyclopentasiloxane, D5 47 102 18 129 3 422 Dodecamethylcyclohexasiloxane, D6 3 37 765 352 Tetramethylsilane 1 --- --- 170 Trimethylfluorosilane 1 --- --- 610 Trimethylpropoxysilane 1 --- --- 5 200

5. Concentration Levels of Trace Compounds in Biogas and Landfill Gas
25
Only few siloxane measurements have been conducted in Finnish landfills and sludge digesters. These results are slightly lower in comparison to those of Europe and the US. The total concentration of organic silicon has varied between 2–10 mg/m³ (approx. 0.4–2 ppm). 10–15 mg/m³ organic silicon has been measured in the biogases from metropolitan municipal wastewater treatment (Fred 2007).
5.2 Sulphur and Halogens
The sulphur concentration in reactor biogas varies depending on the feed and the process. The typical concentrations in agricultural application (manure digestion) vary between 500 and 3 000 ppm (0.05–0.3 Vol-%) (Jäkel 2007). Depending on the manure and process, the hydrogen sulphide concentration in the gas may reach up to 30 000 ppm (Trogisch 2004), although typical concentrations are on the level of a few hundred ppm. In comparison to manure and kitchen biowaste, the sulphur concentration in biogas produced from municipal sludge is usually smaller, especially when iron salts, such as ferrous sulphate, are used in the water treatment process to remove phosphor. In an anaerobic environment, iron salts precipitate the hydrogen sulphide into solid iron sulphide.
In Finland’s landfills, the sulphur concentration in gas has fluctuated between 20 and 600 ppm. The average hydrogen sulphide concentration in US landfill gas is 35 ppm. The US has, however, measured up to 114 000 ppm concentrations in landfills where gypsum-containing (construction) waste has been used as a daily cover (Carlton et al. 2007). The average sulphur concentration in Great Britain is approximately 110 mg/m³. The second most significant sulphur component was carbon disulphide, CS2, with an average of 35 mg/m³ (Parker et al. 2004).
High halogen concentrations are a problem mainly in (chemical) industrial landfills. In Finland, measured concentrations in municipal landfill gases and municipal sludge digester gases are in general relatively low and do not, as such, cause additional measures concerning gas purification or motor oil selection. In general, halogen-caused damage must be taken into consideration only when the gas is used in fuel cells (Table 2).
Nonetheless, in Great Britain, for example, a third of the landfills’ halogen concentration in the gas is so high that the gas engines require special lubricating oil (the so-called high Total Base Number (TBN)). The concentrations may be on the level of several 100 mg/m³ (Parker et al. 2004). The most abundant component is chloroethene.
Furthermore, in Korea and the USA (Shin et al. 2002), a notable part of the landfills generate gas with such high halogen concentrations, that gas cleaning before using it for electricity production would be justified. In digesters, the halogen concentration in the gas is generally very low.
Ammonium is not considered to be a problem concerning the utilization of landfill gas. The concentration is generally in the range of a few ppm. This concentration goes below the detection level of many ordinary landfill gas analyzers.

6. Biogas Purification
26
6. Biogas Purification
In the 2000-thies alone, tens of patents have been issued concerning removing and determining siloxanes, sulphur or halogens from biogas2. Some of these also deal with other biogas impurities, such as the removal of VOC and/or halogens. The patents concerning the purification techniques are mostly from the United States, Germany, Korea and Japan.
The majority of the purification techniques are based on adsorption. A few patents describe siloxane adsorption into the liquid phase, the membrane separation, as well as the condensation process.
Active carbon methods generally concern also the removal of halogens and sulphur from gas. In addition to the objective of gas cleaning, membrane methods and in particular condensation, has been the removal of carbon dioxide from gas.
In most cases, the gas is used directly without any further purification equipment. However, prior to electricity production, the biogas is always dried.
6.1 Water Removal
Water contributes to corrosion and lowers the efficiency of purification techniques, in particular the efficiency of active carbon adsorption and silica gel treatment. Additionally, owing to ice formation, water is problematic in cryogenic treatment of gas. The main techniques in water removal are cooling, adsorption or absorption (Table 9). In principle, a part of the gas impurities are extracted in water removal. However, in practice the efficiency of de-watering techniques in removing biogas trace compounds has been relatively modest, ammonia being an exemption.
2 Techniques of carbon dioxide separation have not been included (refining into traffic fuel or fuel comparable to natural gas).
6. Biogas Purification
27
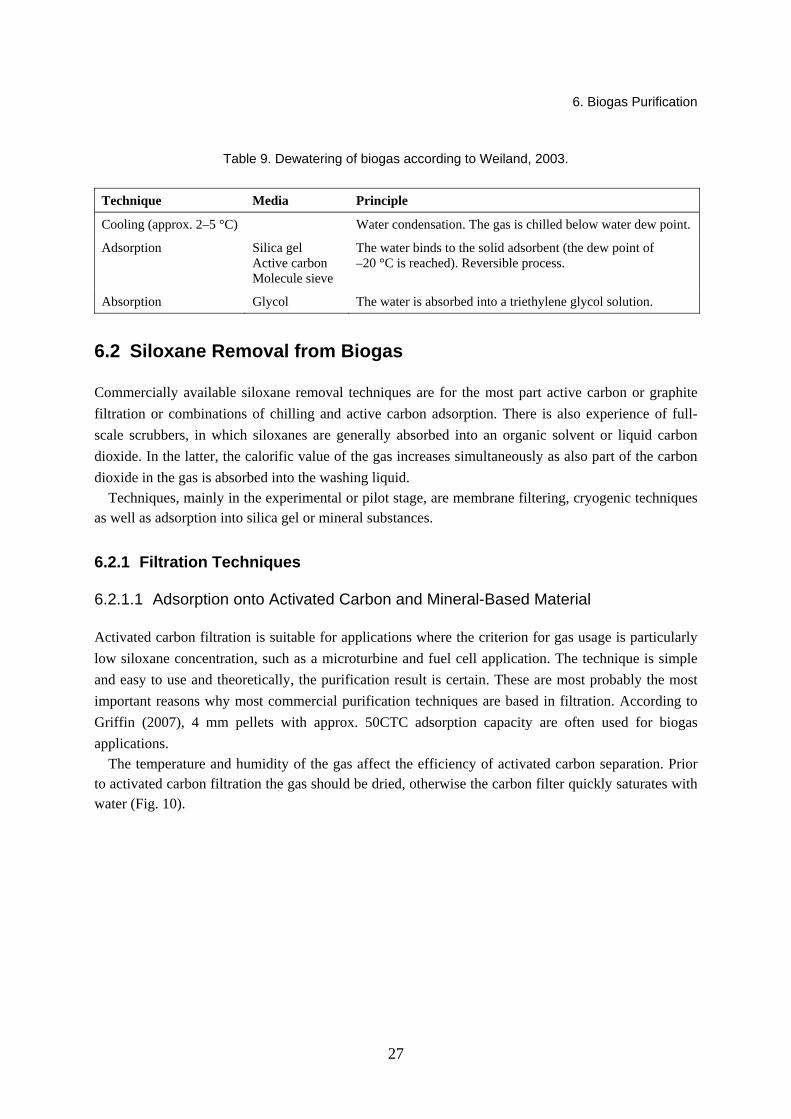
Table 9. Dewatering of biogas according to Weiland, 2003.
Technique Media Principle
Cooling (approx. 2–5 °C) Water condensation. The gas is chilled below water dew point.
Adsorption Silica gel Active carbon Molecule sieve
The water binds to the solid adsorbent (the dew point of –20 °C is reached). Reversible process.
Absorption Glycol The water is absorbed into a triethylene glycol solution.
6.2 Siloxane Removal from Biogas
Commercially available siloxane removal techniques are for the most part active carbon or graphite filtration or combinations of chilling and active carbon adsorption. There is also experience of full-scale scrubbers, in which siloxanes are generally absorbed into an organic solvent or liquid carbon dioxide. In the latter, the calorific value of the gas increases simultaneously as also part of the carbon dioxide in the gas is absorbed into the washing liquid.
Techniques, mainly in the experimental or pilot stage, are membrane filtering, cryogenic techniques as well as adsorption into silica gel or mineral substances.
6.2.1 Filtration Techniques
6.2.1.1 Adsorption onto Activated Carbon and Mineral-Based Material
Activated carbon filtration is suitable for applications where the criterion for gas usage is particularly low siloxane concentration, such as a microturbine and fuel cell application. The technique is simple and easy to use and theoretically, the purification result is certain. These are most probably the most important reasons why most commercial purification techniques are based in filtration. According to Griffin (2007), 4 mm pellets with approx. 50CTC adsorption capacity are often used for biogas applications.
The temperature and humidity of the gas affect the efficiency of activated carbon separation. Prior to activated carbon filtration the gas should be dried, otherwise the carbon filter quickly saturates with water (Fig. 10).

6. Biogas Purification
28
0
20
40
60
80
100
120
10 20 30 40 50 60 70 80 90 100
relative humidity (%)
adso
rptio
n fa
ctor
(%)
Figure 10. The influence of gas humidity on active carbon (redrawn from Herdin et al. 2000).
The adsorption process is non-selective, so not only siloxanes are adsorbed. Also other gas trace compounds adhere onto the activated carbon, and this affects the service life of the filter media. In particular, landfill gas may contain significant amounts of VOC compounds, which, in themselves are not relevant when considering gas utilization, but which may decrease the efficiency of activated carbon. The most harmful are oxygen-containing VOCs such as, acetates, alcohols and ketones. These compounds can dissolve the siloxanes attached to the activated carbon, in which case the siloxanes may volatilise from the adsorptive sites of the activated carbon back into the gas phase. In addition, heavy oxygen-containing molecules can physically take the place of siloxanes in the absorbent material, in which case the siloxane compounds returns to the gas phase (Tower & Wetzel 2006).
The saturated activated carbon must be replaced or regenerated. The operation expenses of the technique are to a large extent determined according to the replacement interval of the activated carbon. In applications where the siloxane concentration is high, it is advisable to pre-treat the gas, e.g. by cooling, prior to leading it into the activated carbon filter. The alternative is to invest in a regenerating system.
One of the first patents concerning the harmful effect of biogas siloxanes was published 1997 by the gas engine producing Jenbacher GmbH. The invention was a regenerating adsorption unit, which was indented to prevent contamination of the gas engine’s exhaust gas catalyst. The selected activated carbon is narrow-pored, steam-treated activated carbon produced from coal, which has a volume of approx. 500 kg/m3. Activated carbon is regenerated with the help of an electric resistor under the temperature of 350–450 °C. The appliance consists of two parallel adsorption units, which enables continual use of the appliance while it is being regenerated. The activated carbon is cleaned with a small quantity of hot, purified biogas. The used gas is directly incinerated, e.g. in a flare (Gruber and Melmer 1997).

6. Biogas Purification
29
Since then, several patents have been published in which the adsorption technique has been further developed. The patents concern the choice and regeneration of adsorption material, minimizing pressure loss by material design, assemblies of different filter material as well as cooling.
The purpose of the patent published by Osaka Gas Ltd in 2005, is to minimize the negative effects of the condensed water in the gas. With the help of an electric heater and a thermostat, the temperature gradient of the gas is kept low enough in the activated carbon filter, and thus, water condensation in the filter is prevented. The patent highlights the necessity for heating when the temperature drops below 10 °C, in which case < 50 % relative humidity is difficult to achieve (Tsujimoto 2005).
Doczyck’s patent (2007) has been developed specifically for gas engines that have a certain (limited) capacity for siloxane containing gas (see Table 3). The apparatus (Fig. 11) consists of a set of filters, part of which are possible to bypass according to the siloxane concentration in the gas. Depending on the siloxane concentration of the raw gas, part of the gas is directed into filters and part into the by-pass line (9). The purified gas stream is combined with the untreated gas stream before it is fed into the engine. Pre-filtration is designed for continuous operation; during the regeneration the gas is directed into the parallel filter for purification.
Figure 11. Activated Carbon Filtration System (Doczyck 2007).
In addition to activated carbon, other mineral-based materials have been used in siloxane filtration. In his invention, Hayward (2004) presented the usage of a bentonite-based filter. These filtration materials are commercially available (e.g. Rockwell Industries’s Bleached Earth and Bentonite).

6. Biogas Purification
30
Canadian Xebec Inc’s method is based on activated alumina, or in other words the use of active clay (Higgins 2006). Both materials are regenerated in-situ by heating, e.g. with a hot nitrogen-air flow. Kim et al. (2006) found in their study that certain natural clay minerals also function well as siloxane adsorption substances. Siloxane adsorption capacities of illite and vermiculite were estimated very high to 1.7 g/g illite, 3.8 g/g vermiculite respectively (Fig 12).
Figure 12. Illite and vermiculite SEM images (http://web.mit.edu).
Silica gel-based adsorption has been developed in, e.g. Germany’s Fraunhofer-Institute. Silica gel was treated with dimethyldichlorosilane or methyltrisilane for increased hydrofobicity and used as sorption material, which selectively retains organic silicon compounds. Thanks to its hydrofobicity, gas humidity does not hamper the adsorption (Urban & Unger 2005). Silica gel has very good retention properties when it comes to siloxanes (e.g. Seo et al. 2007, Ikeda & Abe 2001). At the Calabasas landfill, in California, a filter with silica gel was said to remove siloxanes three times more effectively than activated carbon. However, unlike activated carbon or other sorbents used in biogas purification, silica gel does not remove sulphur compounds (EPRI 2006). In practice, silica gel has, in fact, been used mostly in the treatment of clean-room air.
6.2.1.2 Combination Filters
In combination filters, different impurities in the gas separate in different stages, in which case the life-span of the filtration material is extended and the purification result is surer. The aim of biogas combination filters, in addition to increasing the efficiency of siloxane removal, is to remove the VOCs and the halogens form the gas.
Osaka Gas Ltd.’s (Seki 2005) 2-phase filter invention aims to prolong the activated carbon replacement interval and to ensure the gas engine’s catalytic exhaust gas treatment activity. The first layer of the activated carbon filter is normal activated carbon, and the second layer is an active carbon-based chemical filtration media, which is prepared by heating the activated carbon in phosphoric acid or zinc chloride.
The separation in the first phase is based on physical adsorption, whereas the separation in the second phase is based both physical adsorption and chemisorption. The chemical filter works as a so-called polishing filter that secures the result of the removal process. The assumption is that most of the
6. Biogas Purification
31
impurities are removed in the first stage, and that the load placed on the other – more expensive – filter is as small as possible. Regeneration takes place by heating under vacuum. A similar Japanese patent was issued the same year under the name of Hamaguchi et al. According to the patent authors, treated biogas is suitable for fuel cells (Hamaguchi et al. 2005).
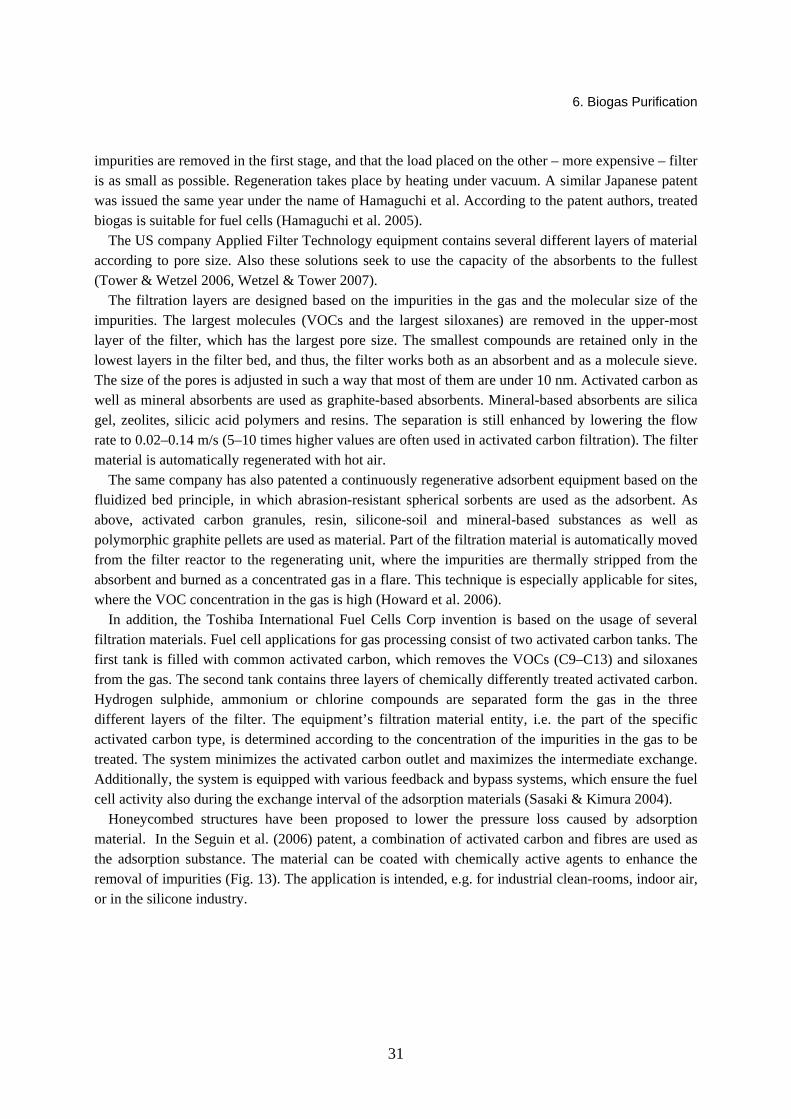
The US company Applied Filter Technology equipment contains several different layers of material according to pore size. Also these solutions seek to use the capacity of the absorbents to the fullest (Tower & Wetzel 2006, Wetzel & Tower 2007).
The filtration layers are designed based on the impurities in the gas and the molecular size of the impurities. The largest molecules (VOCs and the largest siloxanes) are removed in the upper-most layer of the filter, which has the largest pore size. The smallest compounds are retained only in the lowest layers in the filter bed, and thus, the filter works both as an absorbent and as a molecule sieve. The size of the pores is adjusted in such a way that most of them are under 10 nm. Activated carbon as well as mineral absorbents are used as graphite-based absorbents. Mineral-based absorbents are silica gel, zeolites, silicic acid polymers and resins. The separation is still enhanced by lowering the flow rate to 0.02–0.14 m/s (5–10 times higher values are often used in activated carbon filtration). The filter material is automatically regenerated with hot air.
The same company has also patented a continuously regenerative adsorbent equipment based on the fluidized bed principle, in which abrasion-resistant spherical sorbents are used as the adsorbent. As above, activated carbon granules, resin, silicone-soil and mineral-based substances as well as polymorphic graphite pellets are used as material. Part of the filtration material is automatically moved from the filter reactor to the regenerating unit, where the impurities are thermally stripped from the absorbent and burned as a concentrated gas in a flare. This technique is especially applicable for sites, where the VOC concentration in the gas is high (Howard et al. 2006).
In addition, the Toshiba International Fuel Cells Corp invention is based on the usage of several filtration materials. Fuel cell applications for gas processing consist of two activated carbon tanks. The first tank is filled with common activated carbon, which removes the VOCs (C9–C13) and siloxanes from the gas. The second tank contains three layers of chemically differently treated activated carbon. Hydrogen sulphide, ammonium or chlorine compounds are separated form the gas in the three different layers of the filter. The equipment’s filtration material entity, i.e. the part of the specific activated carbon type, is determined according to the concentration of the impurities in the gas to be treated. The system minimizes the activated carbon outlet and maximizes the intermediate exchange. Additionally, the system is equipped with various feedback and bypass systems, which ensure the fuel cell activity also during the exchange interval of the adsorption materials (Sasaki & Kimura 2004).
Honeycombed structures have been proposed to lower the pressure loss caused by adsorption material. In the Seguin et al. (2006) patent, a combination of activated carbon and fibres are used as the adsorption substance. The material can be coated with chemically active agents to enhance the removal of impurities (Fig. 13). The application is intended, e.g. for industrial clean-rooms, indoor air, or in the silicone industry.

6. Biogas Purification
32
Figure 13. Structure of honeycombed filtration material (Seguin et al. 2006).
In Yoshida’s et al. (2004) two-staged filter, the large molecular organic silicon compounds are removed from the lower layer, which consists of a honeycombed molecular sieve. Hydrogen sulphide and other simplified hydrogen compounds are removed in the following, upper layer, which in turn, is a zeolite honeycombe. In both cases, silicate containing minerals are used as filter material. A zeolite layer for carbon dioxide adsorption may still be added to the equipment (Yoshida et al. 2004).
It is possible to further enhance the effectiveness of the adsorption with the so-called PSA technique (Pressure Swing Adsorption), which is normally used in methane enrichment of biogas. Mitaren (2007) described a technique by which siloxanes and a part of the carbon dioxide in the gas are removed according to the used pressure range. The increase in pressure is adjusted to 4–31 bars, according to the desired methane level. A molecular sieve, activated carbon, silica gel or a combination of these is used as the adsorbent. Part of the upgraded biogas is used as fuel in the self-sufficient process. The process is in commercial production and Guild Associates have implemented ca 6 projects in the United States (www.moleculargate.com).
6.2.2 Cooling
When the gas is cooled, the siloxanes are removed from the gas with the condensation water. The efficiency of this technique is determined by the temperature and pressure used and by the type of siloxanes present in the gas. Published literature give quite mixed results on how effective cooling is in removing siloxanes from biogas. A reliable result is reached by combining cooling with activated filtration (e.g. Hamaguchi et al. 2002, Doczyck 2001). In addition to certain siloxanes, a part of the hydrocarbons (olefins) is retained in the condensed water formed in the cooling, which also favourably affects the life-span of activated carbon (Prabucki et al. 2001). After cooling, the gas is usually heated to ~ 10 °C before being directed into the activated carbon.
In the Los Angeles County Sanitation District landfill, 50 % siloxane removal was reached by cooling the gas to 4.5 °C under a pressure of 24 bar. In the Calabasas landfill, the same technique managed to remove an average of 32 % of siloxanes from the gas, before the gas was led into the microturbine. Of the siloxanes present, octamethylcyclotetrasiloxane, D4, was most successfully removed with this technique (EPRI 2006).

6. Biogas Purification
33
Although the cooling experiences at US landfills have been good, less encouraging results have been obtained elsewhere. According to Hagmann et al. (2001), only 26 % degree of separation is obtained at –25 °C; at –70°C the removal ratio was over 99 %.
However, Schweigkofler and Niessner (2001) pointed out that, by cooling the gas to 5 °C, approximately 12 % of siloxanes are removed. Also, the measurement results from Finnish landfills indicate that the degree of separation of siloxanes at 2–4 °C is not significant.
However, in the above mentioned results from Germany and US, the pressure used in cooling has not been mentioned. Cooling conducted under high pressure, is probably a more effective separation technique compared to that in normal pressure.
Figure 14 summarizes the levels of siloxane removal under different temperatures, presented in the literature.
0
20
40
60
80
100
-90 -80 -70 -60 -50 -40 -30 -20 -10 0 10
T,°C
rem
oval
, %
Figure 14. Levels of siloxane removal under different temperatures.
By cooling the gas down to –30 °C up to 90 % of siloxanes are removed from the raw gas. This technique saves on activated carbon consumption, but the electricity consumption in the treatment is high. Prabucki et al. (2001) estimated that deep-cooling is economically profitable only for gas with > 200 mg/m3 siloxane concentration (Table 10).
Table 10. Combination of cooling and activated carbon.
Stage 1 Stage 2
Cooling and reheating
Separation efficiency Adsorption Remaining
siloxane
Application area
Heating to 35–40 °C 0 % activated carbon < 1 mg/m³ < 10 mg/m³ siloxane < 150 m³/h
Cooling to 2°C and heating to 10°C < 25 % activated
carbon < 1 mg/m³ < 30 mg/m³ siloxane > 150 m³/h
Cooling < –30°C and heating 10°C < 90 % activated
carbon < 1 mg/m³ < 200–1 000 mg/m³ siloxane

6. Biogas Purification
34
Condensation is usually carried out as a multiphase process with the aim to remove as much water as possible before cooling below 0 °C. Frozen condensate quickly clogs the pipes in the heat exchangers and causes problems in the equipment.
Markbreiter and Weiss (1997) solved the problem with ice formation by feeding methanol into the gas to prevent ice formation in the equipment. The impurities in the gas dissolve into the formed methanol condensation water solution. The impurities are removed from the solution by adding water to it. The siloxanes, water and methanol are thus partitioned into different phases and the methanol is recycled to the process. In the rather complicated, multi-phased process gas is cooled to –29 °C under elevated pressure.
In the Pioneer Air Systems technique, the temperature of the gas is lowered to 0 °C in a pre-cooler. Most of the water is removed from the gas as condensation in the pre-condenser. The zero-degree gas is then alternately fed into two parallel heat exchangers, in which the temperature of the gas is lowered further to –29 °C and the siloxanes are condensed into the liquid phase, which is then removed from the equipment. At intervals the ice is automatically removed from the heat exchangers with the help of a refrigerant. During the melting, the gas is directed into a parallel cooler (Basseen & Sulaiman 2004).
By freezing the gas to below –85 °C (min 5 bar pressure), carbon dioxide, in addition to siloxanes and other impurities, are also effectively removed from the biogas. In Sweden, SGS Biogas is further developing this methane enriching technique (Benjaminsson 2006).
6.2.3 Scrubber Techniques
In gas scrubbing the siloxanes transfer from the gas into the washing liquid in a spray or packed scrubber. Most organic silicon compounds are poorly soluble in water, in which case organic solvents have been used as scrubbing liquid. However, it is difficult to reach a high degree of separation. With high flow velocity the volatile siloxanes are easily stripped anew from the liquid back into the gas phase. Typically, the degree of siloxane separation stays at approximately 60 % (Hagmann et al. 2001). The technique is well suited for gas pre-treatment, e.g. before drying and activated carbon adsorption.
An attempted solution to enhance the removal has been to add chemicals to the washing liquid, which either react with the siloxanes or bond with siloxanes, in which case the siloxanes become less volatile compounds. Among others, Huppmann et al.(1996) achieved a 97 % reduction for D4 by using a tetradecane solution as a scrubbing liquid. By using different chelates and organic acids, it is also possible to more effectively bind the siloxanes to the liquid (e.g. Ermich & Pruszynska-Zajda 2005).
A few applications have been built in Germany, where the siloxanes are removed by means of fuel oil (among others, Schmidt 1997 and Schulze 2001). For example, in Schulze’s (2001) counterflow washer, the siloxanes are removed from the gas by absorbing them into diesel or heating oil. A mesh configuration in the washing column enhances siloxane absorption into liquid. When the siloxane level in the oil concentration is high enough, part of the oil is replaced and the spent oil is incinerated.
In Inoue et al.’s patent (2006), the siloxanes are absorbed into an ethanol solution. The ethanol is regenerated by distillation. The absorption efficiency is particularly effective in temperatures < 25 °C (Table 11).

6. Biogas Purification
35
Table 11. Ethanol scrubbing efficiency under different temperatures (Inoue et al. 2006).
T Raw gas siloxane concentration, ppb
Purified gas siloxane concentration, ppb
3 °C 5 100 <5
13 °C 5 700 <5
25 °C 6 000 150
Haase Energietechnik has proposed a technique based on water washing to reduce siloxane problems. To achieve sufficient removal, the gas or the washing liquid needs to be cooled before it is fed into the scrubber. The company emphasizes the importance of cooling. The authors even propose cooling the washing liquid or the gas before the washing. Additionally, the authors brought to attention that better separation efficiency is attained by adding small quantities (1 g/l) of humic acids, and the long-chain organic acids, oil and alcohols (Lenschow & Martens 1999).
Schwerdt and Doczyck (2003) broke catalytically down the gaseous siloxanes first into smaller molecules before directing them into the washer. In the technique, the hydrophobic siloxanes turned into water-soluble compounds, which enabled using the water as washing liquid.
Selexol™-polythyleneglycoldimethylether has been used especially in the U.S. in the refining of landfill gas before being fed into the natural gas pipeline. In addition to carbon dioxide, VOC compounds and hydrogen sulphide, the solvent removes the siloxanes relatively efficiently. US landfills are using a dozen Selexol washers (Glus et al. 2001). Figure 15 shows the 2 500 m³/h Mountain Gate landfill in California, which removes hydrogen sulphide, VOCs and siloxanes form the landfill gas before utilization. The gas is used in a 14.5 MW turbine plant. The plant is based on the combined usage of biogas and natural gas, and is equipped with an exhaust gas catalyst. The plant’s catalyst has been in use for 10 years without damage (Pierce & Ramirez 2007, EPRI 2006).
Figure 15. Mountain Gate’s Selexol washers.
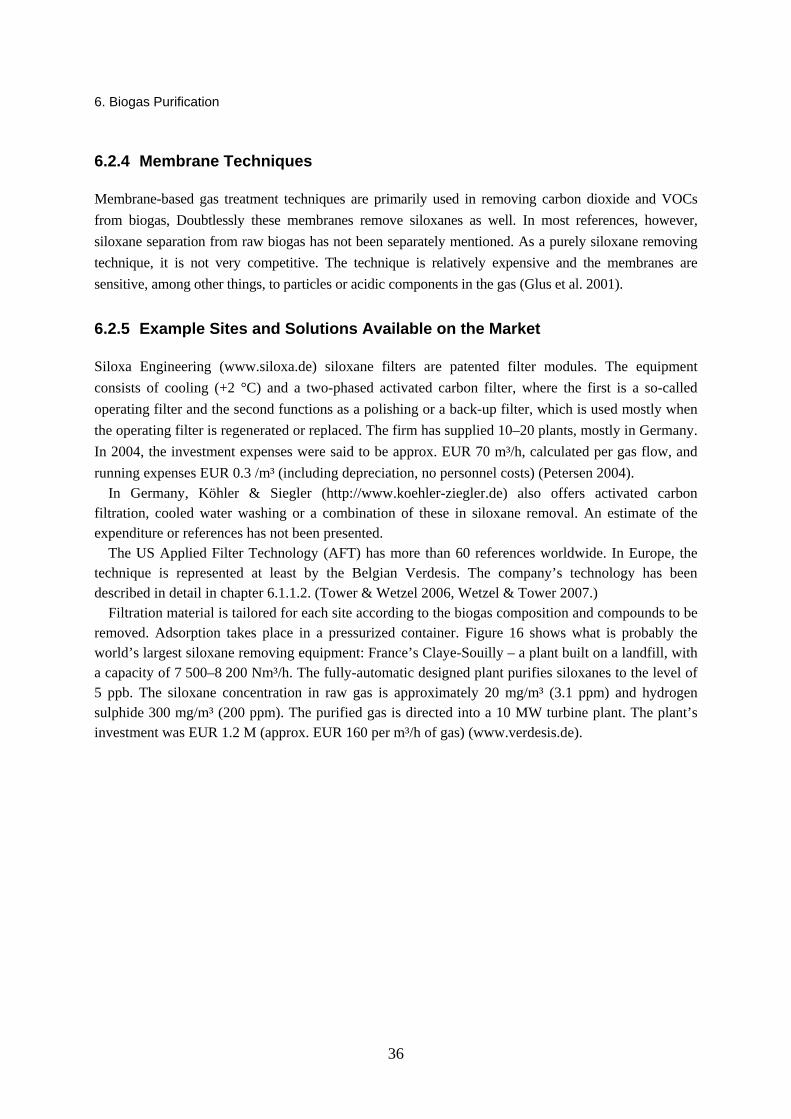
6. Biogas Purification
36
6.2.4 Membrane Techniques
Membrane-based gas treatment techniques are primarily used in removing carbon dioxide and VOCs from biogas, Doubtlessly these membranes remove siloxanes as well. In most references, however, siloxane separation from raw biogas has not been separately mentioned. As a purely siloxane removing technique, it is not very competitive. The technique is relatively expensive and the membranes are sensitive, among other things, to particles or acidic components in the gas (Glus et al. 2001).
6.2.5 Example Sites and Solutions Available on the Market
Siloxa Engineering (www.siloxa.de) siloxane filters are patented filter modules. The equipment consists of cooling (+2 °C) and a two-phased activated carbon filter, where the first is a so-called operating filter and the second functions as a polishing or a back-up filter, which is used mostly when the operating filter is regenerated or replaced. The firm has supplied 10–20 plants, mostly in Germany. In 2004, the investment expenses were said to be approx. EUR 70 m³/h, calculated per gas flow, and running expenses EUR 0.3 /m³ (including depreciation, no personnel costs) (Petersen 2004).
In Germany, Köhler & Siegler (http://www.koehler-ziegler.de) also offers activated carbon filtration, cooled water washing or a combination of these in siloxane removal. An estimate of the expenditure or references has not been presented.
The US Applied Filter Technology (AFT) has more than 60 references worldwide. In Europe, the technique is represented at least by the Belgian Verdesis. The company’s technology has been described in detail in chapter 6.1.1.2. (Tower & Wetzel 2006, Wetzel & Tower 2007.)
Filtration material is tailored for each site according to the biogas composition and compounds to be removed. Adsorption takes place in a pressurized container. Figure 16 shows what is probably the world’s largest siloxane removing equipment: France’s Claye-Souilly – a plant built on a landfill, with a capacity of 7 500–8 200 Nm³/h. The fully-automatic designed plant purifies siloxanes to the level of 5 ppb. The siloxane concentration in raw gas is approximately 20 mg/m³ (3.1 ppm) and hydrogen sulphide 300 mg/m³ (200 ppm). The purified gas is directed into a 10 MW turbine plant. The plant’s investment was EUR 1.2 M (approx. EUR 160 per m³/h of gas) (www.verdesis.de).
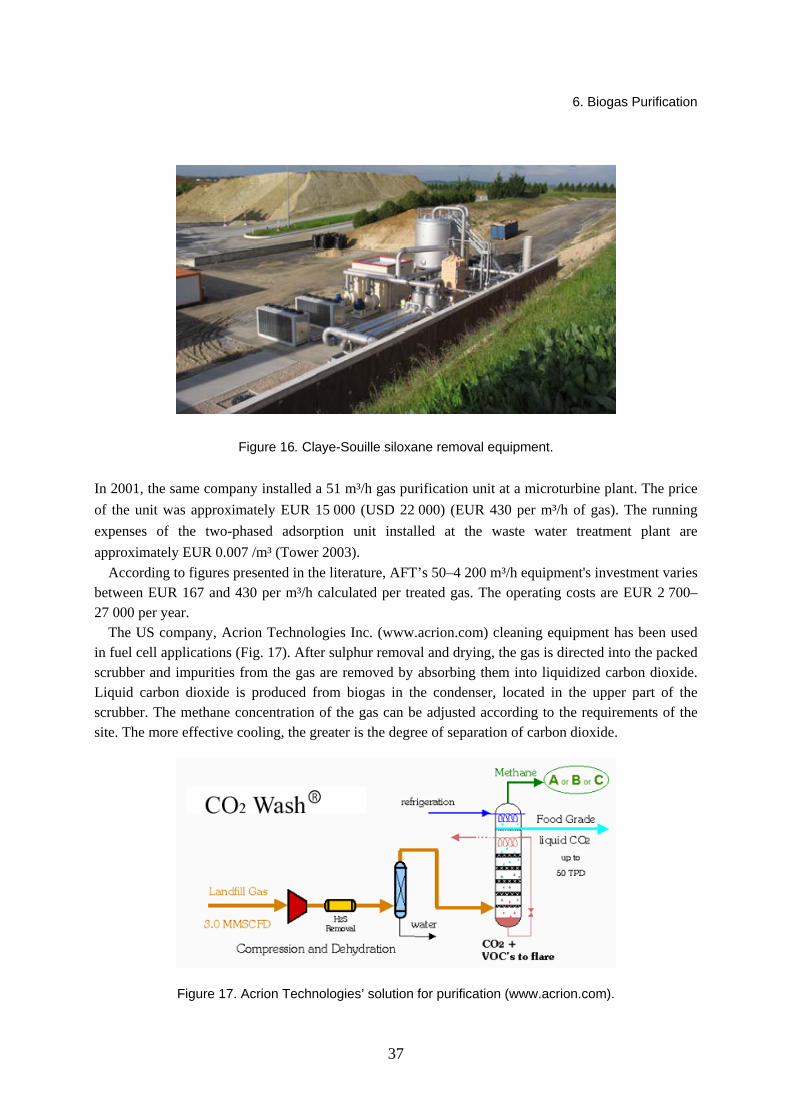
6. Biogas Purification
37
Figure 16. Claye-Souille siloxane removal equipment.
In 2001, the same company installed a 51 m³/h gas purification unit at a microturbine plant. The price of the unit was approximately EUR 15 000 (USD 22 000) (EUR 430 per m³/h of gas). The running expenses of the two-phased adsorption unit installed at the waste water treatment plant are approximately EUR 0.007 /m³ (Tower 2003).
According to figures presented in the literature, AFT’s 50–4 200 m³/h equipment's investment varies between EUR 167 and 430 per m³/h calculated per treated gas. The operating costs are EUR 2 700–27 000 per year.
The US company, Acrion Technologies Inc. (www.acrion.com) cleaning equipment has been used in fuel cell applications (Fig. 17). After sulphur removal and drying, the gas is directed into the packed scrubber and impurities from the gas are removed by absorbing them into liquidized carbon dioxide. Liquid carbon dioxide is produced from biogas in the condenser, located in the upper part of the scrubber. The methane concentration of the gas can be adjusted according to the requirements of the site. The more effective cooling, the greater is the degree of separation of carbon dioxide.
Figure 17. Acrion Technologies’ solution for purification (www.acrion.com).

6. Biogas Purification
38
Figure 18 presents the US Pioneer Air’s (www.pioneerair.com) two-phased purification unit based on cooling and activated carbon filtration. The principles of the technique are further explained in chapter 6.1.2 (Basseen & Sulaiman 2004).
Figure 18. TCR purification process. Frost/defrost action inalternating heat exchangers (www.pioneerair.com).
The siloxane, hydrogen sulphide and halogen removing TCR process has been installed in 10–20 landfills and WWTPs in North America. The company’s first European reference is Amsterdam’s Afval Energie Bedrijf (AEB) plant, which was built in 2006, in Amsterdam’s waste centre. The gas treatment plant, which has a maximum capacity of 1 600 m³/h, includes, in addition to a condensing unit (–25 °C), a NaOH scrubber for removal of sulphur as well as a catalytic activated carbon filter. The plant processes the raw gas produced in the digestion of municipal sludge, with a siloxane concentration of 80 mg/m³ and hydrogen sulphide of 4 000 ppm. After the gas treatment, the gas siloxane concentration is 2 mg/m³ and hydrogen sulphide is 5 ppm. A total of 4 MWe purified gas is used in gas engines. According to AEB, the plant has functioned as expected after solving the problem of ice formation during start up. Investment expenses were EUR 500 000 (Knoppers 2006, Simoës 2007).
In Europe, Pioneer Air is represented by the Dutch company Gastreatment Services BV, which also markets its own cooling-based GTP Filters (www.gastreatmentservices.com). SOXSIA®. The filter material contains e.g., iron oxide which is appropriate for i.a. sulphur removal (Benjaminsson 2006).
Great Britain’s PpTek (http://www.pptek.co.uk/) sells 150–3 000 m³/h filter modules (Fig. 19) containing hydrophobic filter media.. Thanks to its hydrophobicity, gas drying before filtering is not necessary. The larger modules come with an automatic regenerating system, and the smaller ones are regenerated manually. A dozen English landfills and waste water treatment plants as well as a few sites in the US, Holland and Italy, belong to the company’s references.

6. Biogas Purification
39
Figure 19. PpTek company’s BGAK filter (http://www.pptek.co.uk).
A dozen Selexol scrubbers are used at landfills in the USA to remove biogas impurities and partially carbon dioxide. The capacity of these plants is typically 5 000–10 000 m³/h. In 2004, a 3 500 m³/h plant’s total investment was estimated at approximately EUR 700 000, including the packed column, cooling, pumping unit and piping, etc. This technique is used by the company GSF Energy, which specializes in landfill gas technologies (Environmental Agency 2004, Pierce & Ramirez 2007).
In 2003, Rossol et al. presented a cost estimate of gas heating, cooling and activated carbon filtration. By heating the gas to +50 °C, the gas’s relative humidity decreases below 50 %, in which case the risk for water condensation in the activated carbon is reduced. The costs of heating and cooling were estimated for a municipal sludge digester in Essen, where the biogas’s organic silicon concentration was 20 mg/m³ (Table 12).
Table 12. Combining heating or cooling with activated carbon filtration. The capacity of the plant is 750 m³/h.
Investment, € Yearly
expenditure, €
The share of activated carbon in the operating
costs, €
Heating to +50 °C + activated carbon filtration 251 000 46 000 11 000
Cooling +5 °C + activated carbon filtration 276 000 52 000 8 000–9 000
Cooling to –30 °C + activated carbon filtration 435 000 89 000 4 000
Out of the analyzed alternatives, heating before activated carbon filtration was proved to be the most cost-effective alternative, especially in the site in question, where gas engine waste heat was used to

6. Biogas Purification
40
heat the gas. The high investment and running costs (energy and maintenance costs) of deep-cooling made the cooling financially unprofitable.
Ingersoll-Rand markets siloxane removal (activated carbon) filters among all for microturbine applications. According to Hurley (2003) the investment costs for microturbine protection can range from $100 to 200 per kW installed. The the siloxane filter material needs to be changed periodically, and each change-out can be costly. As an example the cost for filter media replacement at e.g. two municipal waste water treatment plants in the US was 1400 € ($900 per change-out approximately every six months) and 5000 € ($1600 per change-out approx. every 80 operational days). Naturally, the siloxane content in the latter case was significantly higher. In 2003 Ingersoll Rand forecasted that through technological development, both investment costs and operating costs will be reduced.
6.3 Removal of Sulphur from Biogas
Concerning biogas utilization, the sulphur concentration of the gas is probably usually the most critical factor and sulphur removal is quite commonly used, i.a. in slurry digesters and in landfills. Biological, physical as well as chemical techniques are on the market. Particularly the chemical sulphur removal techniques were originally developed for sulphur removal in the petrochemical industry. The most common techniques for the removal of sulphur from biogas are listed in Table 13.
Table 13. The most common techniques for removing sulphur.
Technique Principle
Biological oxidation by air feed or in a biofilter
Microbes oxidize sulphur into elemental sulphur, sulphate and sulphite
Chemical flocculation Flocculation by ferrous chloride iron chloride solution, with iron salts or with lime
Adsorption Activated Carbon
Chemical Adsorption Sulphur reacts with KI, Fe(OH)3, (marsh ore or limonite), ferrous oxide or with ZnO
Catalytic scrubber Chelate solution
Biological oxidation is an especially common sulphur removal method in the agricultural sector. For example, 33 % of Germany’s agricultural applications use the air feed system to remove hydrogen sulphide (Jäkel 2007). Simply, a moderate air flow is fed into the reactor’s gas space close to the liquid’s surface where sulphur bacteria turn hydrogen sulphide into yellow elementary sulphur and sulphate:
2 H2S + O2 → 2 S + 2 H2O (1)
2 S + 2 H2O + 3 O2 → 2 H2SO4 (2)
The air flow is adjusted according to the hydrogen sulphide concentration in the gas. The recommended minimum air-flow is 0.5–1.5 greater than the theoretical oxygen need (Jäkel 2007). In practice, the air

6. Biogas Purification
41
quantity is 3–6 vol-% of biogas flow, with which up to 95 % sulphur removal can be obtained. Sulphur concentration is monitored, however, only in a small number of slurry digesters and in practice most of the applications work less effectively. An investigation conducted in 1999 indicated that, despite the air feed, in more than half of the biogas plants the sulphur concentration of the gas going into gas engines exceeded 500 ppm and in 15 % of cases the sulphur concentration was > 2 000 ppm (Weiland 2003).
This sulphur-removing process is difficult to control with large variations in the hydrogen sulphide concentration. If the biogas sulphur concentration is below 200 ppm, air dosing is not considered a reliable sulphur-removing technique (Prechtl et al. 2003). Problems, such as corrosion and inhibition of biological processes, can also be caused by the formation of sulphuric acid. Elemental sulphur and sulphate are to be removed to prevent clogging in the pipes.
A bioscrubber or -filter is based on the same principle as direct air dosing. Here sulphide oxidizing bacteria are immobilised in a separate column on the surface of the packing material. The required air flow is greater in comparison to the direct air feed (8–10 % vs. 2–6 %). The process’pH is very low, 1.5. Nutrients and solid elemental sulphur are added to the filter and precipitated sulphate is periodically removed from the scrubber. In comparison to direct air feed, the process is more effective, but the operating and investment costs are higher. For example, in the agriculture sector, biofilters are installed mostly in large-scale plants (Jäkel 2007).
Activated carbon, among others, is used in biogas fine-purification to ensure the purification result. The sulphur removal capacity of activated carbon is 0.2–0.5 kg of sulphur per kilo of activated carbon. The required amount of carbon is then determined by the gas sulphur content. When the gas to be treated has a high sulphur concentration, the costs of the treatment are quite high, and in practice some sort of pre-treatment like wet scrubber is added to the treatment chain.
The most common techniques for sulphur removal from bioreactor gas are based on adding iron chloride into the bioreactor. For example, in Germany approx. 30 % of the sulphur-removing processes are based on this technique. Iron reacts with sulphur to form solid iron sulphide. The amount of iron salts fed into the reactor is adjusted according to the sulphur concentration in the gas until a certain maximum limit. When the iron concentration in the sludge becomes high, Fe2+ also reacts with the phosphor and / or with the calcium in the sludge, in which case the relative removal of sulphur decreases (Jäkel 2007). The investments for this technique are the continuous iron solution feed system including automation. Investment and running expenses are therefore higher in comparison to those of the air feeding.
Many chemical filters are also based on the reaction between sulphur and iron. A commercial example is the US Sulfatreat®, aluminium silicate impregnated with a mixture of ferrous oxides. A small quantity of metal oxides is added as catalysts to enhance sulphur precipitation (Troung & Abatzoglou 2005). The cost of a 1 200 m³/h plant is approximately EUR 35 000 (USD 41 000 in 2004) (Heguy & Bogner 2004). A cheaper version of Sulfatreat is the “iron sponge”, which consists of chipwood coated with ferrous oxide. In the United States, iron sponges have been used especially in removing sulphur from natural gas.
In comparison to chemical filtration, the investment expenses of activated carbon are normally lower, but the running costs are higher (Ferreira 2004).
The sulphur compounds of the gas can also be absorbed into an alkaline solution in a separate scrubber. NaOH is often used as a scrubber liquid. NaHS is formed as an intermediate product in the

6. Biogas Purification
42
reaction, which in itself can cause odour annoyance in the environment (Jäkel 2007). In the catalytic treatment, sulphur binds to the metal chelates of the scrubber liquid, which is regenerated, and the elemental sulphur is separated from the scrubber liquid. The most common processes (e.g. MiniCat and LoCat in US) are based on the use of iron chelate (Graubard et al. 2007).
6.3.1 Sulphur Removal for Fuel Cells
In order to use biogas in fuel cells H2S has to be removed almost completely. In their PEM fuel cell, Spiegel and Preston (2003a) used activated carbon coated with potassium hydroxide to remove the sulphur. In their filter, operating in ambient temperature and pressure, hydrogen sulphide reacts to form elemental sulphur. The reaction needs 0.1–0.5 % oxygen, and thus, air input is added for the process. The equipment consists of two parallel filters, which ensures continuous operation use during the time that the filtration material is being exchanged. The filtration material is not regenerable. The removal efficiency for hydrogen sulphide is > 99 %, organic sulphur 90 % and halogens 90 %. In 1999 the 110 m³/h (10–135 m³/h) plant cost was reported to be EUR 70 000 (USD 100 000) and the filtration material EUR 5 (Spiegel et al. 1999).
At the other site reported by Spiegel and Preston, landfill gas was used as fuel. The halogen concentration varied between 15–45 ppm and the hydrogen sulphide concentration was on average 280 ppm (50–500 ppm). Owing to the higher load and varying concentration, it was decided to add coondensation after the KOH treatment, where the gas’s dew point was lowered to –45 °C, as well as to add another activated carbon filter for halogen removal. However, the tests indicated that the condensation did not improve the overall efficiency (Spiegel & Preston 2003b).
Li and Gnilka (2003) used a polyamide-polyether membrane to remove the hydrogen sulphide from the gas before directing it to a MCFC fuel cell. The separation efficiency of the hydrogen sulphide selective membrane is illustrated in Table 14. The cost of the unit with a capacity of 100 m³/h was EUR 40 000 and operating expenses EUR 96 per day (including depreciation, energy expenditure and methane loss). The technique was found economically unprofitable.
Table 14. Treatment of biogas with a hydrogen sulphide selective membrane.
Raw gas Permeate To the fuel cell
Quantity of gas m³/h 100 12 86
CH4, % 60.0 25.9 66.2
CO2, % 37.2 72.0 33.2
H2S, % 0.001 0.08 0.0005
H2O, % 2.8 2.0 3.0
In addition to general activated carbon, copper-coated activated carbon has been used in fuel cell implementations to purify PEM fuel cell gas (Schmersahl & Scholz 2005) and zinc oxide in a MCFC application (Thyberg Naumann & Myrkn 1995).
6. Biogas Purification
43
Most of the sulphur-removing techniques remove both hydrogen sulphide and organic sulphur compounds. In addition to these, several ppm carbonyl sulphide (COS) can occur in biogas. The COS-concentration can exceed, e.g. the SOFC or MCFC fuel cell tolerance value for sulphur. Possible COS occurrence in gas should is to be noted, as the compound is not necessarily removed with the same techniques as other sulphur compounds (Ott & Tamm 2003). COS can be removed by zinc oxide pellets (Hofmann et al. 2005).
6.3.2 Expenditure
Table 15 presents a group of sulphur removing techniques according to their removal efficiency (kg S/day) as well as expenses. The expense estimates are mostly from US sources, and possible expenses for landfill disposal of solid sulphur waste are not taken into account.
As a potentially economical sulphur removal technique for landfill gas, it is still worth mentioning a German scrubber application, in which landfill gas sulphur and chlorine compounds are absorbed into leachate. In the anaerobic process, sulphur compounds react with metals present in the leachate and form solid metal sulphides. Recycled glass is used as scrubber packing . The technique also claims to remove siloxanes from the gas, but no purification results for siloxanes are mentioned (Faulstich 2000). In 1999, an experimental plant was built on a German landfill, but the implementation has not yet been taken into full-scale (Angerhöfer & Faulstich 1999, Franke 2007).
The method by Mostbauer et al. (2007) is also based on utilising waste materials, where biogas is filtered through bottom ashes. In addition to the sulphur, bottom ash removes part of the carbon dioxide in the gas. Bottom ash from municipal waste incineration is also used in Novergie’s French patent, to remove sulphur and halogens biogas (Lubetzki et al. 2001).

44
Tabl
e 15
. Sul
phur
-rem
ovin
g te
chni
ques
, app
licat
ions
and
exp
ense
s (E
PR
I 200
6, G
raub
ard
et a
l. 20
07, C
arlto
n et
al.
2007
).
Med
ium
/tech
niqu
e O
bser
vatio
ns
Res
idua
l C
apac
ity
kg S
/day
R
unni
ng
expe
nses
, €/k
g S
ZnO
Fo
r fin
e re
mov
al o
f hyd
roge
n su
lphi
de <
0.1
ppm
v
Zinc
sulp
hide
(lan
dfill
was
te)
< 9
Doe
s not
reac
t with
org
anic
sulp
hur
A
ctiv
ated
Car
bon
For f
ine
rem
oval
of h
ydro
gen
sulp
hide
< 0
,1 p
pmv
<
9 3.
5
Reg
ener
atio
n po
ssib
le
Act
ivat
ed c
arbo
n im
preg
nate
d w
ith su
lphu
r (la
ndfil
l was
te)
Sp
ecifi
c su
lphu
r rem
oval
cap
acity
is lo
w in
co
mpa
rison
to th
e ch
emic
al fi
lter
Add
ed in
to th
e di
gest
er li
quid
pha
se
Ferr
ous s
ulph
ide
rem
ains
in th
e sl
udge
11
2 0.
7 Fe
rrou
s chl
orid
e ad
ditio
n Lo
w in
vest
men
t cos
t
La
rge
dosa
ges m
ay n
egat
ivel
y af
fect
dig
estio
n pr
oces
s
Iron
spon
ge
Pa
rtial
ly re
gene
rabl
e, ri
sk o
f ign
ition
C
hipw
ood
coat
ed w
ith ir
on o
xide
C
hipw
ood
impr
egna
ted
with
ferr
ous s
ulph
ide
(land
fill w
aste
) <1
10
1.7–
4.5
Lo
w in
vest
men
t cos
t
Sulfa
treat
C
hem
ical
min
eral
-bas
ed fi
lter
Iron
pyr
ite
> 25
–135
2.
25–4
.00
W
orks
bes
t with
bio
gas s
atur
ated
with
wat
er
(Lan
dfill
was
te)
<110
3.
5–6.
2
Parti
ally
rege
nera
ble
, sm
all i
nves
tmen
t
Che
mic
al sc
rubb
er
Feed
of s
uita
ble
chem
ical
<2
25
3.3
Sm
all i
nves
tmen
t cos
t U
sed
scru
bbin
g liq
uid
to w
ater
trea
tmen
t pla
nt
(org
anic
sulp
hur a
nd su
lpha
te)
Bio
scru
bber
W
ide
rang
e of
impl
emen
tatio
n U
sed
scru
bbin
g liq
uid
to w
ater
trea
tmen
t pla
nt
(ele
men
tal s
ulph
ur a
nd su
lpha
te)
9–45
0 0.
05*
Cat
alyt
ic sc
rubb
er
Reg
ener
atin
g iro
n ch
elat
e so
lven
t for
the
cont
rol o
f pH
in
KO
H o
r NaO
H
Elem
enta
l sul
phur
(lan
dfill
was
te)
135–
15 0
00
0.3–
1.1
* de
pend
s on
the
cost
of n
utri
ent a
dditi
on
44

7. Development of Field Measurements of Siloxanes
45
7. Development of Field Measurements of Siloxanes
Today, various methods exist for siloxane measurement involving different sampling techniques and detectors. A major drawback of the current sampling and laboratory methods is the time consuming and laborious procedure and risk of sample losses due to incomplete adsorption or absorption. These methods are unsuitable for on-line process control of biogas purification; neither do point measurements give good information about variation in siloxane concentration at the site.
For this problem an on-line measurement method was developed at VTT for the determination of siloxanes in a biogas matrix. The method based on a combination of a gas chromatography and IR technology. With the overall aim to develop a tool for the monitoring the total biogas matrix including CO2 and CH4 (%-level) as well as ammonia and sulphur (ppb-ppm-level), the primary target was organic silicon compounds and here to rise to the challenge of achieving sufficiently low detection limits for biogas on-line quality control (~10 ppb).
For monitoring methane, carbon dioxide and ammonia a FT-IR (GASMET, Temet Instruments Oy, Finland) was used. Trace compounds, siloxanes and VOC, and hydrogen sulphide again were determined with a portable gas chromatograph (Perkin Elmer Photovac Voyager). The GC consisted of a built-in, three-column configuration and a PID (photo ionization detector) detection system. The detection limit in a biogas matrix was 0.01 ppm for siloxanes and VOCs and around 5 ppm for hydrogen sulphide.
The FT-IR spectra and the chromatograms were analysed using the apparatus software and references obtained with test gases produced in the laboratory with dynamic dilution. References included the most prevalent siloxanes, L2-L4 and D3-D5. Gaseous standards of larger siloxanes, D6 → were difficult to produce due to their low volatility. Also Trimethylsilanol (TMS) remained undetected with these methods due to unavailability of a reference standard. European chemical suppliers do not generally provide trimethylsilanol as the compound is very unstable.
The methods was applied at several biogas and landfill gas sites whereas comparison between the direct measurement and conventional analysis was made by sampling on adsorbent tubes (Tenax TA 60/80 mesh), and analysis in the laboratory by thermal desorption and analysis with ATD-GC-MS (Perkin Elmer ATD 400 - HP 5890 - HP 5972).
The comparison of on-line and conventional sampling and identification with MS-GC method showed diverse results for the individual compounds. Typically the results obtained by direct analysis with as chromatography was higher than that obtained by adsorption and MS-GC-analysis. Although the differences varied somewhat in the different measurements some conformity could be noticed.

7. Development of Field Measurements of Siloxanes
46
Cyclic compounds were more comparable whereas the MS-GC results for linear siloxanes, especially L4 was considerable smaller than the corresponding value obtained with direct measurement. Although part of the inconsistence could be due to natural variation in the biogas samples, one can assume that lower results are largely due to loss in sampling.
Furthermore, the stability of siloxane bag samples was investigated for two gas bag materials, nalophan (PET) and Tedlar®. The test included six siloxanes L2–L4 and D3–D5. During two days, the concentration in Tedlar bags declined with 65–95 %, depending on the siloxane in question. Compared to Tedlar, Nalophan’s performance was inferior. The siloxane concentration of bag samples declined to 50–91 % of the initial concentration during the 2 day test. The most stable siloxane sample was D3 followed by L3>D4>L2>L4>D5. Figure 20 shows the results for D5 (lowest stability) and D3 (best stability) samples in 15 l bags, as percentage of the initial concentration.
D3
0 %
20 %
40 %
60 %
80 %
100 %
on-line bag, 1 h 1 2
days
TedlarNalophan
D5
0 %
20 %
40 %
60 %
80 %
100 %
on-line bag, 1 h 1 2
days
TedlarNalophan
Figure 20. Stability of gaseous siloxane bag samples.

8. Measurement Campaigns
47
8. Measurement Campaigns
8.1 Sites
Biogas field measurements were carried out on-site at six sites, three landfill of different size, two of which are active and one closed and three digester plants. Table 16 gives an overview of the sites measured.
Table 16. Biogas measurement sites.
Site Digester feed / disposed waste
Produced gas flow in total,
m³/h
Gas utilization Number of measurement
events 1 Landfill,
metropolitan Municipal solid waste, active landfill
8000 district heating 3
2 Landfill, urban/rural
Municipal solid waste, active landfill
400 microturbine 2
3 Landfill, rural/(urban)
Municipal solid waste, closed 2001
800 microturbine and fuel cell
1
4 Bioreactor Sewage sludge 400 gas engine 1 5 Bioreactor Sewage sludge + municipal
and industrial biowaste 70–30 %
40–100 microturbine 1 week
6 Bioreactor sewage sludge + kitchen waste/industrial sludge 70–30 %
0.1–0.8 (thermo- and mesophilic digestion pilot test)
5 x 4–14 d
8.2 Measurement Method
The measurements were conducted with the method described in Chapter 7 for field determination of the total biogas matrix. The primary interest of the measurements was organic silicon compounds and other trace compounds relevant in respect of utilisation.

8. Measurement Campaigns
48
Methane, carbon dioxide and ammonia were determined with FT-IR. Siloxanes, hydrogen sulphide and VOC were quantified with gas chromatography. The presence of trimethylsiloxane and halogens was determined separately by MS-GC and quantified as equivalents of toluene. In most cases, the measurements took place on-line. Part of the analyses was performed using 12–15 l bag samples (Tedlar) carefully avoiding silicon sealings or valves.
8.3 Measurement Results
The trace compounds identified in the five measurement sites are listed in Table 17. The results are given as average values of different measurement periods. Detailed information of the gas matrices can be found for each site in Appendix A.
Table 17. Biogas trace compounds at sites 1–6.
1 Landfill
2 Landfill
3 Landfill
4 Digester
5 Digester
6 Digester
L2–L4, mg/m³ 2.3 1.6 0.3 1.3 1.35 0.8
D3–D5, mg/m³ 5.5 4.5 1.2 28.3 1.03 4.65
Trimethylsilanol, mg/m³ *) 2 0.60 < 0.01 0.02 n.d. 0.02
Sulphur compounds, mg/m³ 700–900 51–72 29 < 25 30 < 10
Ammonia, ppm 3–4 < 5 < 5 < 5 < 5 < 5
Halogens, mg/m³ *) 2–7 1.00 n.d n.d. n.d. < 0.1
*) quantified as toluene equivalents
The total siloxane concentration ranged between 2-30 mg/m³ or 0.9–11.1 mg/m³ as Si. Cyclic compounds, D3–D5, were generally more dominant. The landfill gas also contained some trimethylsilanol nd linear siloxanes, L2–L4 whereas the composition of biogas derived from sewage sludge (sites 3–5) consisted largely of the less water soluble cyclic compounds, D4 and D5. Elevated siloxane values were measured at sites situated in the metropolitan area (sites 1 and 4) compared to sites distant from industrial areas (site 5 and 6). Landfill gas collected from the closed landfill (site 3) contained comparative low siloxane concentrations.
The sulphur concentration was predominantly hydrogen sulphide. Other reduced sulphur compounds, such as ethyl thiol, dimethyl sulphide and methyl mercaptane, were typically less than 5–10 % of the total sulphur concentration. Only landfill gas at site 1 showed significant sulphur concentrations. Low H2S levels in biogas from sewage sludge digestion are typical where iron salt is used for chemical precipitation in water treatment. In this case iron salt precipitate sulphide as insoluble iron sulphide in the digester.

8. Measurement Campaigns
49
The dominant VOCs components were terpenes, toluene, xylenes and methylated benzene compounds. A varying concentration of ethanol was detected in the bioreactor gas. Generally, these compounds have no significant impact on biogas electricity production. Nevertheless, higher hydrocarbons can cause clogging or corrosion in a fuel cell. The landfill gas contained a larger variety of different VOCs compared to digester gas.
The concentration of halogens was very low at all measured sites. The total concentration remained below 5 ppm, and in most sites < 1 ppm.
The results for siloxanes are somewhat lower than those reported elsewhere in Europe (Chapter 5.1). Measurement results from landfills in Central Europe and the US has generally ranged between 3-40 mg/m³ (as Si) whereas the average value for the three landfills measured in this study was 2.2 mg/m³ (as Si). Likewise in Finland, the dominant components have been D4 and D5, the rest representing less than 10 % of the total concentration. As for sewage sludge digestion the variation is larger, depending on the local (industrial) waste water input. The average concentration of the measured bioreactor gases was approximately 12.5 mg/m³ (total organic silicon). The corresponding German average in biogas from sewage sludge digestion is 15 mg/m³ (Beese 2007).
8.4 Comparison to Biogas Specifications for Different Gas-to Electricity Concepts
Table 18 compares the measured values normalized to methane content of the biogas with the fuel gas inlet specifications for different power generation applications.
Most sites were below the specifications for utilization in gas engines. However, the siloxane concentration in all cases exceeded the recommended limit values for utilization in microturbines. Fuel cells are very sensitive to most trace compounds and biogas applications would generally require efficient gas treatment.
Table 18. Measured biogas trace gas values compared to supply gas specifications from some biogas utilization applications (EPRI, 2006; Wheless & Pierce, 2004).
Tot S ppm/CH4
Organic silicon ppm/CH4
Halogens ppm Cl/CH4
Gas Engine 545–1742 9–44 60–491 Turbine < 10 000 0.087 1 500 Fuel Cell (SOFC) < 1*) below detection limit (~ 10 ppb) < 5*) Microturbine 25–70 000 below detection limit (~ 10 ppb) 200
Site 1 1 400–1 600 1–2 ~ 10 Site 2 84–36 1.7–2.1 ~ 1 Site 3 56.5 3.1 ~ 1 Site 4 25 2.8 ~ 0.08 Site 5 33 0.15 n.d. Site 6 10 0.6 n.d.
*) ppm in biogas

8. Measurement Campaigns
50
8.5 Solutions for Siloxane Removal
At sites 2 and 3, where the landfill gas was utilized in microturbines, an activated carbon filter had been installed to protect the microturbines from silica.
At site 2 a carbon filter of 0.22 m³ filter media was install to treat the gas flow of 85 m³/h. The total application included two alternating operating filters. This allowed for continuous operation; while renewing one filter, the gas flow was directed to the second filter.
Newly installed, the activated carbon filter removed virtually all trace compounds in the gas. However, after only 17 weeks of operation on average only 10 % of D3, D4 and trimethylsilanol was removed. The concentration of the other siloxanes, L2–L4 was actually higher in the purified gas compared to the filter inlet (Figure 21). The removal of hydrogen sulphide and some VOCs was nevertheless still acceptable (50–70 %) (Appendix A).
The reason for the early breakthrough of siloxanes at such a moderate siloxane load, < 3 g/h m³ filter media (5–7.1 mg/m³ and gas flow 85 m³/h) was probably that VOCs and sulphur as well as moisture to some content, supersede siloxane from the adsorption sites of the filter media.
0
1
2
3
4
5
6
7
raw gas outlet, 1 week outlet 17 weeks
mg/
m³
TMS *D5L4D4D3L3L2
Figure 21. Siloxane filtration efficiency of activated carbon after 1 week and 17 weeks of operation.
At site 3, where the gas was utilized for producing electricity for residential use, a similar adsorption unit, but with double capacity (0.4 m³ per filter) was installed. Here the siloxane load on the filter was a 0.4 g/h Compared to site 2 the siloxane load was 8 times lower and also the VOC-content was lower than at site 3. No sign of breakthrough was detected still after 12 weeks of operation. (Appendix A).
The SOFC fuel cell at site 3 was protected by Puracarb® coated carbon pellets (0.4 m³) treating a gas flow of 11 m³/h. The Puracarb media especially targets hydrogen sulphide and VOCs. Purafil treatment is a chemisorptive process that removes contaminants by means of both adsorption and absorption, and chemical reaction. Gases are trapped within the pellet, where oxidation changes the gases into solids, thus eliminating the possibility of desorption. Newly installed, the removal

8. Measurement Campaigns
51
efficiency of the filter was practically complete. Only a small concentration (0.013 mg/m³) of chloroethane was detected.
8.6 Factors Affecting Altering Biogas Siloxane Content
8.6.1 Waste Disposal Affecting the Siloxane Concentration in Landfill Gas
Volatile siloxanes in landfill gas derive from silicon-containing waste. After disposal the siloxanes are slowly voltilized from the waste into the gas phase. The landfill gas concentration will thus depend on both the amount of organic silicon containing waste that has been disposed of at the landfill and the time frame of the disposal.
0
2
4
6
8
10
12
Site 1 active/metropolitan (1984 -
Site 2 activeurban/rural (1950-
Site 3 closed (1966-2001)
mg/
m³
Figure 22. Landfill gas siloxane concentration at three landfills in Finland.
Figure 22 compares the total siloxane concentration in biogas from the three landfill sites: Site one, with the highest siloxane concentration, is a large landfill serving an urban and industrial region. The landfill has been receiving industrial and municipal solid waste including municipal sludge since 1984. Site two though is a smaller landfill with an older history, and site 3, with a very low siloxane concentration, is a closed landfill that has served a basically rural area. The variation in the siloxane concentration can be explained by the factors mentioned above. Firstly, the use of organosilicon has increased with time, meaning that the siloxane content of current waste disposal is also increasing, and the siloxane input to operating landfills is higher compared to closed landfills. Further, the input of siloxane rich waste is probably higher in urban areas compared to rural areas, where the average production and consumption of cosmetics and chemical products is minor. One significant reason for the low siloxane concentration at the closed landfill is probably also that the eventual siloxane input to

8. Measurement Campaigns
52
the landfill was brought to an end in 2001. One can assume that a large part of the siloxanes has already volatilized from the landfill.
8.6.2 Temperature
Figure 23 compares the total siloxane concentration in the generated biogas for the termophilic and mesophilic test runs (site 6). During the thermophilic test runs (55 °C) the average total concentration varied between 6 and 10 mg/m³. Respective results for the mesophilic test runs (34 °C) were 4–9 mg/m³. In the mesophilic runs the major part (77 %) of the siloxanes was D5. During the thermophilic test again D5’s share of total siloxanes was 10–45 % and the dominant component was L3 (36–69 %). Clearly the volatilization of siloxane from the feed is enhanced by increased higher temperature. The changes in the compositions of siloxane components can be due to a change in the siloxane content of the municipal sludge used as feed and also increased volatility of L3 in a higher temperature (Dewil et al. 2005).
Figure 23. Siloxane concentration biogas from termophilic and mesophilic digestion with varying organic loading (kg Volatile Solids / day).
0,0
1,0
2,0
3,0
4,0
5,0
6,0
7,0
8,0
9,0
10,0
load, kg VS/day
tota
ö si
loxa
nes,
mg/
m³
thermophilicmesophilic

9. Biogas Purification Cost Estimation
53
9. Biogas Purification Cost Estimation
Gas treatment and purification have a strong impact on both the economic and energy efficiency of a biogas production facility. The specifications of the produced gas are crucial as, on the one hand, these should fit with the requirements set by the application and, on the other hand, they determine the economic viability and energy efficiency of a facility.
Generally the use of gas in gas engines will not require any further actions. Many biogas users opt for increased maintenance cost and lower energy output rather than bringing upon themselves the capital and operating costs associated with siloxane removal. However, few gas-to-electricity actors have a detailed picture of all the cost s related to siloxanes damages to their own equipment. Furthermore, publically available information on siloxane removing equipment is not explicit. Direct comparison of the costs for different installations is difficult as it is seldom clearly states if the investment includes e.g. moisture removal or pipe work.
In the following the costs of biogas purification have been calculated for two cases, a landfill gas flow of 8000 m³/h (site 1) and a digester gas flow of 400 m³/h (site 4). The gas composition of these sites has been discussed in Chapter 8 and a detailed gas composition is given in Appendix A. In both cases, the costs were estimated using the following parameters:
Write-off period 15 a Interest rate 6 % Operation time 8000 h/a Electricity price 8 c/kWh Labour 35 €/h Landfill gas flow 8000 m³/h Waste disposal fee 70 €/t Waste water free 2,5 €/m3 Shipping costs excluded
The equipment cost was estimated using information on commercially available technology. Mainly technologies with publically available recent full-scale references were taken into account. In case existing facilities of the required capacity were not identified, investment and operational costs from references as similar as possible were used as the basis for extrapolation.

9. Biogas Purification Cost Estimation
54
9.1 Case 1: Landfill Gas Treatment and Utilization (Site 1)
Case 1 concerns the utilization of 8 000 m³/h of landfill gas generated at the operating metropolitan landfill (Figure 24). The landfill gas was planned to be used in a CHP-plant with the fuel power of 45 MW. Both gas turbine and engine technology were considered feasible options and thus respective gas treatment was calculated for both cases. The energy production in the two different options is as follows (Table 19):
Figure 24. Landfill gas wells at a freshly covered landfill area.
Table 19. Production data of the two power plant options, GWh/a. Expected operating time 8 000 h/a.
Production, GWh/a Gas turbine (1 unit) Gas engines (6–11 units, depending on the engine provider)
District heating 160 160
Electricity 92 139
Table 20 gives the concentration of trace compounds in relation to fuel contaminant tolerances set by gas turbine and gas engine manufactures3.
3 Jenbacher, Deutz, Waukesha, Caterpillar

9. Biogas Purification Cost Estimation
55
Table 20. Concentration of trace compounds in relation to fuel contaminant tolerances.
Gas engine Gas turbine Site 1 Landfill gas
S, ppm/CH4 545–1 742 < 10 000 1 000–1 500 Organic silicon, ppm/CH4 9–44 0.087 1–2 Halogens, ppm/CH4 60–491 (Cl) 1 500 ~10
According to table 20, investment in gas turbine technology would require siloxane removal of the landfill gas prior to utilization. In case the choice is power production with gas engines, desulphurization of the landfill gas prior to utilization is beneficial. The halogen concentration is low and does not give reason for further action. The required removal of sulphur and siloxanes is given in Table 21.
Table 21. Required removal of sulphur and siloxanes, landfill gas flow 8 000 m³/h.
Gas turbine Gas engines Required removal, kg/d
Desulphurization 500–700 ppm => 50–100 ppm 121–175 kg/d elemental sulphur
Removal of organic silicon < 0.1 mg/m3 optional 1.1–2.1 kg/d siloxanes
9.1.1 Treatment Systems for Desulphurization
Removal of hydrogen sulphide from the landfill gas is necessary to facilitate its use as fuel in gas engines. Desulphurization also minimizes sulphur dioxide emissions from the power plant. An elevated concentration of hydrogen sulphur causes acidification of oil and reduced oil lubricity. Sulphur deposits in the exhaust gas heat exchanger, when temperature is below dew point.
In practice, the concentration level at which gas specifications are exceeded and sulphur abatement is required will vary by application and vendor. Internal combustion engines for landfill gas–to-electricity projects can tolerate levels as high as 1000 ppm (total sulphur in gas) (Heguy & Bogner 2007). Although the sulphur limit for gas turbine systems is generally higher, it can also be restricted by the gas compressor upstream of the turbine, which – depending on the material – may tolerate only 75–100 ppm H2S. This is because a highly corrosive condensate can form during the high compression required for turbines.
Among the variety of commercial technologies for sulphur removal, technologies with suitable sulphur removal capacity were chosen for cost estimation. Generally, for larger volume biogas sources, the regenerative processes should be considered. The chosen technologies were thus scrubber regenerative processes, catalytic scrubbing and biological desulphurization processes.
9.1.1.1 Catalytic Chemical Scrubbing with Chelated Iron
One process for H2S removal applied especially for large volume biogas streams employs chelated iron solution to capture and oxidize the H2S to elemental sulphur in the liquid phase. The solid sulphur

9. Biogas Purification Cost Estimation
56
separated from the liquid is, typically, landfilled. This technology operates at ambient temperatures, requiring no heating or cooling of the media. More than 99 % removal rates have been reported. The catalyst solution is non-toxic. One of the main representatives of this technology is GTP-Merichem, whose ”Mini-Cat” or ”Lo-cat” processes have more than 80 desulphurization references in the US and 20 in Europe (http://www.gtp-merichem.com).
According to GTP–Merichem, the investment cost in 2007 was approximately USD 500 000 and operational cost USD 0.45–0.88 / kg S respectively (Graubard et al. 2007). However, this supplier’s cost estimate differs significantly from e.g. a desulphurization plant installed at New Jersey landfill 2005-2006. The gas purification plant was planned for a gas flow of 3 700 m³/h and 11 000 ppm H2S. Construction costs rose to USD 3.2 million (USD 1.2 M for the plant and permits, and 1.9 M for installation). The operation costs were USD 1.2 /kg S. The need to create new infrastructure – sewers, electrical, etc. was the reason for increased capital costs compared to a typical unit. Also the operating costs were higher than expected owing to last-minute design changes (Carlton et al. 2007).
9.1.1.2 Chemical-Biological Removal
The Paques process is a combination of a chemical scrubber (NaOH) and a biological filter. This technology is promoted as being especially feasible for large gas flow. In this process, the gas stream containing H2S contacts an aqueous soda solution containing thiobacillus bacteria in an absorber. The soda absorbs the H2S and is transferred to an aerated tank where the bacteria biologically convert H2S to elemental sulphur.
According to Paques treated outlet gas can readily meet < 100 ppm H2S specification or go as low as 5 ppm. The application range is from approximately 45 kg per day to 20 tons of sulphur per day. Although the biological sulphur slurry produced is usually landfilled, the slurry can also be utilized for agricultural purposes.
9.1.1.3 Biological Scrubbing
Biological scrubbing is a commonly applied biogas purification systems in anaerobic digestion plants. The gas passes though a plastic packing installed in a reaction tower and providing growth area for the bacteria. A limited quantity of air is added to the biogas, for the bacteria to oxidize the H2S into elemental sulphur and – depending on the environmental conditions – further into sulphuric acid. Oxygen is added to the gas as compressed air. An automatic control system adjusts the air flow according to the actual requirement, which depend upon the sulphur content and volume of the gas flow to be treated. The nutrient solution is sprayed onto the top of the packing. It is usually automatically replaced as required. Used scrubbing liquid is led to the sewage or cleaned at site. According to the Austrian company Envitec, which has provided desulphurization systems for landfill gas flows up to 10 000 m³/h, nutrients and trace elements can derive from natural sources (e.g. landfill leachate) and need not to be added artificially. The process pH is ca 1.5.

9. Biogas Purification Cost Estimation
57
9.1.1.4 Cost Estimate
An overview of the costs of the technologies described above is given in Table 22. For catalytic and chemical-biological scrubbing, the cost estimates include the cost of disposal of solid waste approximately EUR 70 /t. The sulphur cake generated is approximately 60 % water, whereas the produced waste amount is 100-150 t/a (corresponding to 41–58 t/a elemental sulphur removed). The waste produced is non-hazardous and can be utilized as fertilisers. Table 22 compares the costs for these regenerative processes for a 150 kg/day sulphur removal rate from 600 ppm H2S-laden gas. According to calculations biological scrubbing was the most economical, both in regards to investment and operation costs. Note that a small part of the CO2 is also removed in the gas scrubbing processes, thus increasing the energy content of the gas.
Table 22. Cost estimates of selected desulphurization technologies (compiled from Urban et al. 2009, Lindqvist 2008, Graubard et al. 2007, Pulsa 2008, Carlton et al. 2007).
Investment Total cost/yearSpecific capital
cost Operation and
service Total € € cent/Nm³ cent/Nm³ cent/Nm³
Catalytic scrubbing based on figures on MiniCat
900 000 139 000 0.15 0.06 0.21
Bio-chemical scrubbing based on figures on Paques
900 000 128 000 0.14 0.02 0.17
Biological scrubbing based on figures on Envitec
500 000 73 000 0.08 0.03 0.11
The fact that almost all references cited concern cases with a considerable higher sulphur concentration (> 1000 ppm) increases the uncertainty of the cost estimation. Also the operational costs of biological scrubbing (e.g. waste water expenses) include some uncertainty.
As shown in Table 20, the sulphur concentration is on the limit of what is recommended eg by the gas engine manufacturer Deutz. The use of a high alkaline reserve (TBN) oil developed for the lubrication of engines working with fuel containing corrosive components and paying attention to avoid condensation upstream, means the engine might in this case be sufficient for keeping the operation and maintenance cost at a reasonable level without desulphurization.
9.1.1.5 Costs of Other Sulphur Removal Technologies
Activated carbon is one of the most established and proven technologies for landfill gas trace component removal. Activated carbon filtration is more feasible for fine purification of landfill gas and is rather costly to apply for H2S bulk removal. For smaller installations (–1000 m³/h ca), the cost of biogas treatment using activated carbon with no pre-treatment has been evaluated as 0.14–0.5 cents/m³ (Griffin 2007).

9. Biogas Purification Cost Estimation
58
Caustic scrubbing is also a well-known gas scrubbing process. Hydrogen sulphur reacts with NaOH forming insoluble sulphur salts. The scrubbing liquid is not regenerative, whereas the chemical consumption of the process is rather high and creates a considerable amount of solid waste or sludge to be disposed of. Caustic scrubbers are generally considered feasible primary for smaller applications.
Chemical filtration utilizing so-called iron sponges are popular especially in the US for hydrogen sulphide removal. The iron sponge consists of wood shavings coated with iron oxide which reacts with H2S to form solid ferric sulphide. A GTP-Merichem agent has calculated that a properly functioning filter requires about 5 kg of spent media per kg H2S removed and a media cost of USD 7.7 /kg H2S removed (Graubard et al. 2007). For a process treating 8000 m³/h landfill gas only the media cost including disposal expenses (EUR 70 /t) would rise to 0.5 cent/Nm³. This is significantly higher than the total cost of systems given in Table 22.
9.1.2 Systems for Removal of Organic Silicon from Landfill Gas
Gas turbine applications call for siloxane concentrations below approximately 0.03 ppmv. A tenfold of applications for siloxane removal from biogas have been developed during the last ten years on commercial scale. The majority of these are based on adsorption onto activated carbon or graphite. As a rule, the performance of activated carbon or other filter media is affected by gas temperature and moisture and the presence of VOCs in the gas. Also to be noted is that other trace components present in the gas (VOCs and H2S) also adsorb onto the adsorption media, thus competing for the adsorption sites. Consequently, the breakthrough point for siloxanes can occur earlier than what was originally expected. In many carbon adsorption processes, the VOC content of the landfill gas is the overriding factor that determines the equipment design and operating costs.
On a life-cycle basis, the cost of the activated carbon replacement dominates the cost of siloxane removal. For example Verdesis has calculated that a landfill gas flow with a comparable level of microcomponents would require approximately 550 t/a activated carbon to reduce the organosilicons to the required level in the treated landfill gas (Tower & Wetzel 2006). For large gas flows with significant H2S concentration carbon adsorption as such is most probably not economical.
As for in the case of sulphur removal, only regenerative processes were considered. The cost estimation was done for designed activated graphite filtration, ion exchange filtration and combined condensation and adsorption.
9.1.2.1 Activated Graphite Filtration
The regenerative SWOPTM Process developed by Applied Filter Technology (AFT) in the US is based on regenerative adsorption. The purification unit contains several filter material layers with different adsorption qualities for removal of a maximal amount of chemically different micro-components. The process utilizes some of the purified landfill gas (around 0.5 % to 1.5 %) for continuous self-regeneration and destruction of captured siloxanes and VOCs (Tower & Wetzel 2006). The filter is regenerated on site. Worldwide, AFT has more than 60 references, several of which are in the range of 5 000–10 000 m³/h

9. Biogas Purification Cost Estimation
59
9.1.2.2 Synthetic Resin Filtration
The British PpTek process BioGas Ak is a regenerative adsorption system that will chemically remove siloxanes from the biogas. According to PpTek, the media absorbs 10 times the amount of siloxanes of carbon or graphite. Systems are automatically regenerated. The filter media repels water whereas the adsorption process of contaminants is not negatively affected by the humidity of the gas. PPTek has 10–20 references of siloxane removal from biogas and landfill gas in Europe, mainly in England, Belgium and Holland (www.PpTek.co.uk).
9.1.2.3 Condensation and Adsorption
The concept of the Dutch Gas Treatment Service, GtS involves chilling the gas to approx. –25ºC for moisture removal and condensation of a large part of the contaminants. The contaminants dissolve in the condensed moisture, which is separated and drained. The gas is reheated and – optionally – a catalytic adsorption unit will remove the remaining siloxanes. According to GtS, removing all contaminants including 2–4 % water will increase the caloric value of the gas by a few per cent. Since condensation will no longer appear downstream the system, piping does not require insulation. GtS has a couple of full scale references in Holland, Belgium and Singapore (http://www.gastreatmentservices.com).
9.1.2.4 Cost Estimate
Table 22 summarizes the costs of the siloxane removal procedures described above. The cost estimates are based on information from technology providers 2005–2008 and their reference sites. There are few references of siloxane removal with the capacity of 8 000 m³/h, so part of the cost estimates are based on extrapolation from smaller existing plants.
Table 22. Cost estimates of selected siloxane removal technologies (compiled from Cowin 2008, de Pater 2008, Tower & Wetzel 2006, Pulsa 2008, Griffin 2007).
Investment Total
cost/year Specific capital costOperation and
service Total
€ € cent/m³ cent/m³ cent/m³ Graphite filter combination (based on figures from Verdesis and AFT) 1 200 000 227 000 0.19 0.16*) 0.35 Resin adsorption (based on figures from PpTek) 420 000*) 75 000 0.067 0.033 0.10 Chilling and adsorption (based on figures from GtS) 1 000 000 330 000 0.16 0.35 0.50
*) Includes the cost effect of lower power production due to the fact that 1 % of the incoming gas is utilized for filter regeneration.
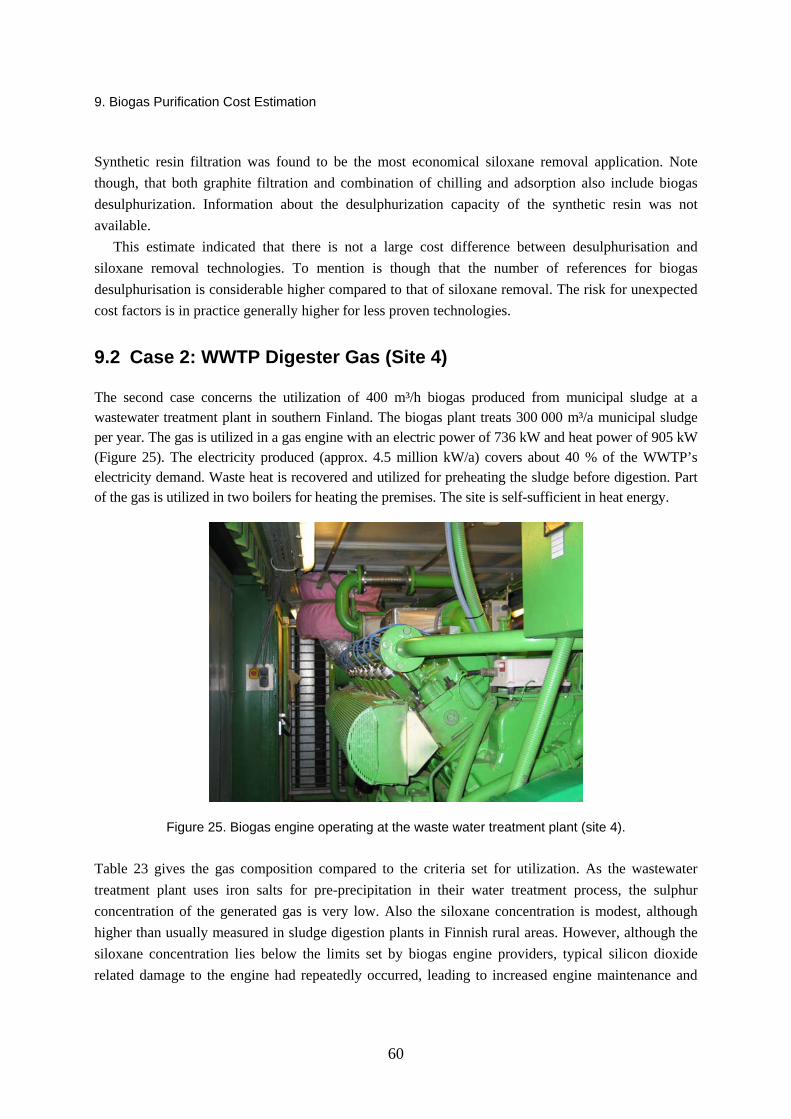
9. Biogas Purification Cost Estimation
60
Synthetic resin filtration was found to be the most economical siloxane removal application. Note though, that both graphite filtration and combination of chilling and adsorption also include biogas desulphurization. Information about the desulphurization capacity of the synthetic resin was not available.
This estimate indicated that there is not a large cost difference between desulphurisation and siloxane removal technologies. To mention is though that the number of references for biogas desulphurisation is considerable higher compared to that of siloxane removal. The risk for unexpected cost factors is in practice generally higher for less proven technologies.
9.2 Case 2: WWTP Digester Gas (Site 4)
The second case concerns the utilization of 400 m³/h biogas produced from municipal sludge at a wastewater treatment plant in southern Finland. The biogas plant treats 300 000 m³/a municipal sludge per year. The gas is utilized in a gas engine with an electric power of 736 kW and heat power of 905 kW (Figure 25). The electricity produced (approx. 4.5 million kW/a) covers about 40 % of the WWTP’s electricity demand. Waste heat is recovered and utilized for preheating the sludge before digestion. Part of the gas is utilized in two boilers for heating the premises. The site is self-sufficient in heat energy.
Figure 25. Biogas engine operating at the waste water treatment plant (site 4).
Table 23 gives the gas composition compared to the criteria set for utilization. As the wastewater treatment plant uses iron salts for pre-precipitation in their water treatment process, the sulphur concentration of the generated gas is very low. Also the siloxane concentration is modest, although higher than usually measured in sludge digestion plants in Finnish rural areas. However, although the siloxane concentration lies below the limits set by biogas engine providers, typical silicon dioxide related damage to the engine had repeatedly occurred, leading to increased engine maintenance and
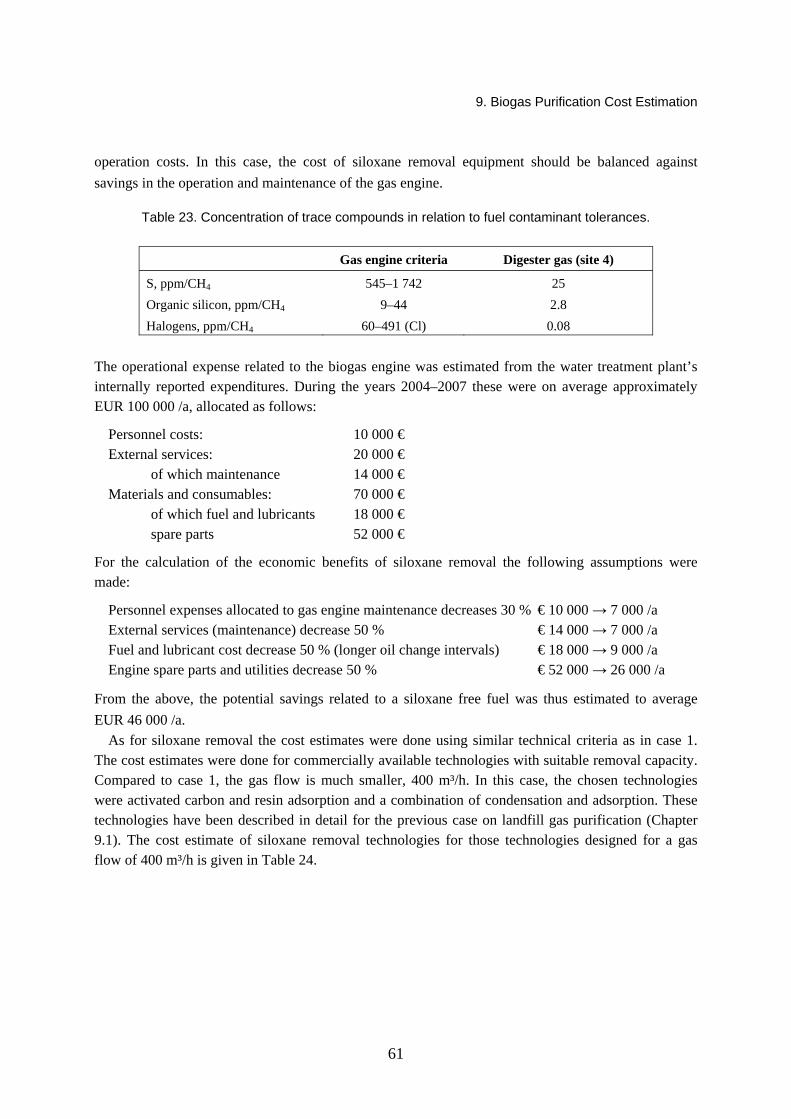
9. Biogas Purification Cost Estimation
61
operation costs. In this case, the cost of siloxane removal equipment should be balanced against savings in the operation and maintenance of the gas engine.
Table 23. Concentration of trace compounds in relation to fuel contaminant tolerances.
Gas engine criteria Digester gas (site 4)
S, ppm/CH4 545–1 742 25 Organic silicon, ppm/CH4 9–44 2.8 Halogens, ppm/CH4 60–491 (Cl) 0.08
The operational expense related to the biogas engine was estimated from the water treatment plant’s internally reported expenditures. During the years 2004–2007 these were on average approximately EUR 100 000 /a, allocated as follows:
Personnel costs: 10 000 € External services: 20 000 €
of which maintenance 14 000 € Materials and consumables: 70 000 €
of which fuel and lubricants 18 000 € spare parts 52 000 €
For the calculation of the economic benefits of siloxane removal the following assumptions were made:
Personnel expenses allocated to gas engine maintenance decreases 30 % € 10 000 → 7 000 /a External services (maintenance) decrease 50 % € 14 000 → 7 000 /a Fuel and lubricant cost decrease 50 % (longer oil change intervals) € 18 000 → 9 000 /a Engine spare parts and utilities decrease 50 % € 52 000 → 26 000 /a
From the above, the potential savings related to a siloxane free fuel was thus estimated to average EUR 46 000 /a.
As for siloxane removal the cost estimates were done using similar technical criteria as in case 1. The cost estimates were done for commercially available technologies with suitable removal capacity. Compared to case 1, the gas flow is much smaller, 400 m³/h. In this case, the chosen technologies were activated carbon and resin adsorption and a combination of condensation and adsorption. These technologies have been described in detail for the previous case on landfill gas purification (Chapter 9.1). The cost estimate of siloxane removal technologies for those technologies designed for a gas flow of 400 m³/h is given in Table 24.

9. Biogas Purification Cost Estimation
62
Table 24. Cost estimates of selected siloxane removal technologies (compiled from Griffin 2007, Lunghi et al. 2004, Beese 2007, Pulsa 2008, Cowin 2008, Petersen 2004).
Investment Total cost /
year Specific capital
cost Operation and
service Total
€ €/a cent/m³ cent/m³ cent/m³ Activated carbon (estimated from figures on Siloxa) 50 000 16 000 0.16 0.33 0.5 Resin adsorption (based on figures from PpTek) 125 000*) 24 500 0.26 0.40 0.7 Condensation and adsorption (based on figures from GtS 250 000 75 000 0.80 1.61 2.5
*) Includes the cost effect of lower power production owing to the fact that 1% of the incoming gas is utilized for filter regeneration.
In this case, the most economical siloxane removal technology was activated carbon filtration. The yearly cost of both activated carbon and synthetic resin filtration undercuts the estimated benefits of siloxane removal with respect to engine maintenance expenses. Calculated in relation to the annual energy production, the average maintenance cost without siloxane purification is 0.022 €/kWh. After installing activated carbon filtration, the cost is estimated to drop to 0.013 €/kWh (gas treatment: 0.0036 €/kWh and maintenance 0.0098 €/kWh). This estimation is comparable to a Canadian report on biogas treatment in WWTPs. Here the engine maintenance costs halved after the installation of gas filtration to 0.0112 €/kWh. The cost of siloxane removal was 0.00285 €/kWh (Slezak 2002).
9.3 Discussion
The largest uncertainties of the cost estimates relate to the construction costs. Capital cost is very site-specific and can very significantly from project to project. Existing infrastructure (sewers etc.) particularly affect the total investment. Unplanned infrastructural and legal factors easily increase the original estimated investment cost significantly (e.g. Carlton et al. 2007).
The accuracy of the operational cost estimate again is affected by the small number of existing similar cases and available figures on these. For these Finnish cases, both the concentration of siloxane and of sulphur in the gas to be treated was low compared to most existing reference sites. Higher trace compound concentration generally correlate with higher operation cost.
The H2S concentration of the treated gas can be automatically monitored. However, continuous field-monitoring of siloxanes is still only under development. Frequent sampling of treated gas for control of siloxane breakthrough, etc. can be a significant operational cost.

10. Summary and Conclusions
63
10. Summary and Conclusions
The number of applications for utilizing biogas for power production has grown significantly in recent years. An important factor relating to the economical profitability of biogas to electricity is to ensure good technical functionality. Sulphur compounds and halogens cause corrosion problems, which to a large extent can be solved by using corrosion-resistant materials in the equipment. Volatile silicon compounds, on the other hand, form when combusted producing difficult and abrasive layers in the equipment, which are hard to remove and damage the equipment. Organic silicon compounds and halogens occur in municipal bioreactor and landfill biogas, when the problematic trace compound in biogas from agricultural slurry is usually hydrogen sulphide.
Silica problems occurring particularly in microturbines and catalytic emission treatment have made siloxanes in biogas an important issue. In these sites, such as in fuel cells, the removal of siloxanes from biogas is mostly a necessity. Siloxane removal from biogas used in gas turbines and gas engines can be considered necessary, depending on the siloxane concentration.
Siloxanes are not, in themselves, according to today’s knowledge, very dangerous or harmful to the environment, and they do not significantly increase plant emissions. The decision to install a purification technique is made on an economic basis. The costs of biogas purification are balanced against the expenses related to engine maintenance and repair. In the case where emissions are treated catalytically, biogas purification before combustion is more strongly justified.
The increasing use of siloxanes in consumer products and plastics and industrial applications indicates that the siloxane problems in waste-derived biogas will not decline in the future. The increased biogas production and multitudinous beneficial use create a necessity for many different-sized purification solutions ranging from large gas turbine to small-scale fuel cell applications.
Sensitive electricity production techniques, such as fuel cells, require a multi-staged purification process when using gas with considerable sulphur, as well as siloxane concentration (Fig. 26). The most efficient – and economical – solution is obtained by tailoring the purification techniques according to the compounds being removed.

10. Summary and Conclusions
64
SOURCE
drying filtration Sulphurremoval
Traceremoval
H2S
siloxanes, H2S, VOC, NH3, ClparticlesH2O
UTILISATION
Boiler
Electricity (engine)
Electricity (fuel cells, turbines, microturbine, (engine)
SOURCE
drying filtration Sulphurremoval
Traceremoval
H2S
siloxanes, H2S, VOC, NH3, ClparticlesH2O
UTILISATION
Boiler
Electricity (engine)
Electricity (fuel cells, turbines, microturbine, (engine)
Figure 26. Biogas purification and refining for power production.
The majority of siloxane removal techniques applied in practical cases is based on adsorption, which is sometimes combined with cooling in cases where the siloxane concentration is high in the gas that is being treated. More than a dozen applications have been developed for commercial sales. Most of these are based on customized adsorption. Among others, activated carbon, graphite and aluminium oxide are used as filtration material. Reported investment expenses run approximately between EUR 100–400 m³/h calculated per treated gas flow. Most filters are marketed with a regeneration technology as an option. The higher investments cost for a regenerative system is justified for large gas flows or gases with a high siloxane concentration.
Gas scrubbing has also been applied in full scale, but the removal efficiency is lower compared to filtering. Thus, wet scrubbing is suitable for applications where complete removal of siloxane compounds is not demanded (e.g. gas engine applications).
New adsorption materials, molecular sieves and the utilization of waste material such as ashes for siloxane adsorption and absorption are promising new techniques. In particular, those techniques that simultaneously remove both hydrogen sulphide as well as, according to necessity, halogens, are cost-effective.
The determination of biogas trace compounds has usually been performed as sporadic individual point measurement, the uncertainty of which is rather large. Determining eventual concentration fluctuation with point measurements is also difficult. The overall siloxane concentration in digester and landfill gas is often low and lies in the range of 0.1–5 ppm, which sets high requirements on the analysis performance.
Landfill gas and digester gas are complex gas matrices containing a large number of different trace compounds with a broad range of volatility, concentration and polarity. Furthermore, depending on the detection technique, moisture and the overpowering concentrations of methane and carbon dioxide can complicate the analysis. Today, various methods exist for siloxane measurement involving different sampling techniques and detectors. The most widely used methods in the analysis of biogas trace compounds are the enrichment on solid sorbents, or absorbing the gas sample in an organic liquid, and consequent analysis with MS-GC or FID-GC. Analyses are sometimes also done on gaseous samples, taken in bags or metal canisters. Here, material losses can occur arising from adsorption to the canister

10. Summary and Conclusions
65
wall or bag material. A major drawback of the laboratory analyses mentioned above is the time-consuming and laborious procedure and risk of sample losses owing to incomplete adsorption or absorption.
The research presented also demonstrates the development of on-line field measurements for the measurement of siloxanes in biogas and landfill gas. The method developed simultaneously also provides information on other gas matrix components impeding the energy utilization of biogas as well as the main gas components, methane and carbon dioxide. The method is based on a combination of gas chromatography and FT-IR analysis. As the method allows for the determination of ammonia and selected VOCs, the method also has potential for on-line process control and troubleshooting of digestion processes.
The method was used for determining the biogas matrices at six sites in Finland. The total siloxane concentration of the measured landfill gas and biogas cases ranged between 2–30 mg/m³ or 0.9–11.1 mg/m³ as Si. The sulphur concentration was between 20–700 mg/m³. Generally, the concentration level of siloxanes and halogens was lower compared to the values reported in the literature from Central Europe and the US. However, it should be noted that the values reported in the literature are somewhat higher than the actual average level. This is because so-called problematic sites with elevated concentrations are probably more frequently documented than sites not facing trouble from biogas trace compounds.
If the biogas undergoes purification in order to adapt to the power generation application, the process will lead to high costs. Therefore, biogas treatment has to be a cost-competitive process in order to avoid jeopardizing the biogas-to-energy advantages. This was exemplified in two Finnish cases, for which a cost estimation of desulphurization and siloxane removal was performed. These cases were a large landfill gas flow and a medium-size digester biogas flow. Both for sulphur and siloxane removal, three different commercial technologies were examined.
The specific cost for a desulphurization plant treating 8 000 m³/h of landfill gas was EUR 0.001–0.002/Nm³ gas treated. The cost of siloxane removal was estimated between EUR 0.001–0.005 /Nm³. The specific cost of siloxane removal from 400 m³/h biogas was estimated at EUR 0.005–0.025 cents/m³.
The largest uncertainties of the estimates relate to the construction costs. Capital cost is very site-specific and can very significantly from project to project. Existing infrastructure (sewers etc.) particularly significantly affect the total investment. The accuracy of the operational cost estimate again is affected by the small number of existing similar cases and available figures on these. For the Finnish cases, both the concentration of siloxane and of sulphur in the gas to be treated were lower compared to most existing reference sites.
The H2S concentration of the purified gas can be automatically monitored. However, continuous field-monitoring of siloxanes is still only under development. Frequent sampling of treated gas for control of siloxane breakthrough, etc. can be a significant operational cost.

Acknowledgements
66
Acknowledgements
The author gratefully acknowledges her skilful colleagues Tuula Kajolinna and Jaakko Räsänen for the method development and field measurements and Jari Kiuru for the MS/GC -analyses. The author also thanks Kirsi Lähde and Maritta Kymäläinen at HAMK University of Applied Sciences for good cooperation and enabling measurements in pilot-scale bioreactors.
YTV, Espoo Water, Päijät-Hämeen Jätehuolto Oy, Sarlin Oy, Wärtsilä Finland Oy, Preseco Oy and Mölnlycke Healthcare are acknowledged for providing possibilities for field measurements, and by that enabling deeper understanding in gas trace compound occurrence and measurements. Finally, TEKES the Finnish Funding Agency for Technology and Innovation is acknowledged for providing the major finances for the project.

67
References Accettola, F., Guebitz, G. & Schoeftner, R. 2008. Siloxane removal from biogas by biofiltration:
biodegradation studies. Clean Techn Environ Policy Vol. 10, pp. 211–218.
Angerhöfer, R. & Faulstich, M. 1999. Elimination of Pollutants from Landfill Gas and Leachate by Bulks of Used Glass. Proceedings of 7th International Waste Management and Landfill Symposium, Sardinia 99. Cagliari, Italy, 4–8 October 1999. P. 175.
Basseen, S. & Sulaiman, R. 2004. Siloxane removal system. Pat. US 6712885 B1.
Beese, J. 2007 Betriebsoptimierung der motorischen Gasverwertung durch den Einsatz von Gasreinigungsanlagen; Siloxa Engineering AG. Presentation at Deponiegas 2007 FH Trier Saksa 10.–11.1.2007.
Benjaminsson, J. 2006. Nya renings- och uppgraderingstekniker för biogas. Examensarbete. Department of Mechanical Engineering Institute of Technology. Linköping University. 69 p.
Carlowitz, O., Ruskamp, B., Neese, O. & Kriebisch, F. 2007. Method for the treatment of exhaust gases containing organosilicon components or accompanying substances, and apparatus therefore. Patent application 2007/0128092 A1.
Carlton, J., Williams J. & Graubard D. 2007. Turning Sour Landfill Gas into Sweet Electricity. Presentation at SWANA 30th Annual LFG Symposium 2007.
Cowin, B. 2008. PpTek. E-mail August 2008
de Pater, J. 2008. GtS. Personal communication.
Dewil, R., Appels, L. & Baeyens, J. 2005. Energy use of biogas hampered by the presence of siloxanes. Energy Conversion and Management, Vol. 47, pp. 1711–1722.
Doczyck, W. 2007. Process and apparatus for biogas purification. Pat. EP1561506 B1.
Doczyck, W. 2001.Vorrichtung zum Abscheiden von Siloxanen aus Biogasen. Pat. DE 29824595 U1.
Duller, W. 2005. Requirements and Experience in the Use of Biogas and District Heating Supply JenbacherAustrian Energy Days in Czech RepublicCHP and Biogas Utilization in Gas Engines. http://www.energyagency.at/publ/pdf/cz_energietage_jenbacher_e.pdf.
Environmental Agency. 2002. Guidance on gas treatment technologies for landfill gas engines. Environmental Agency, Bristol. 91 p.
Environmental Agency. 2004. Guidance for monitoring trace components in landfill gas. Environment Agency, Bristol. 44 p.
EPRI. 2006. Assessment of Fuel Gas Cleanup Systems for Waste Gas Fueled Power Generation. Electric Power Research Institute 1012763 Technical Update, December 2006. 117 p.

68
Ermich, S. & Pruszynskaja-Zajda, E. 2005. Desulfurization of gases for gaseous fuels treatment or odour control. Pat. WO2005053820 A1.
Eurobserver. 2008. Le Baromètre biogaz. Le Baromètre Européen 2007 des Energies Renouvables. www.energies-renouvelables.org.
Faulstich, M. 2000. Naß-Reinigung von Biogas. Pat DE19920258 A1.
Ferreira, P. 2004. The usage of biogas in fuel cell systems. Presentation at the 2nd Business Interest Group-Meeting & Expert-Workshop “State-of-the-art Utilization of Biogas in Fuel Cells”. 17 September 2004, Hamburg. http://www.eva.ac.at/projekte/biogas_fuelcell.htm.
Franke, M. 2007. ATZ Entwicklungszentrum. E-mail 21.9.2007.
Fred, T. 2007. Personal Communication. Helsinki Water.
Frost & Sullivan. 2003. European Biogas Power Plant Markets. http://www.frost.com.
Glus, P., Liang K., Li, R. & Pope, R. 2001. Recent Advances in the Removal of Volatile Methylsiloxanes from Biogas at Sewage Treatment Plants and Landfills Paper presented at the Annual Air and Waste Management (AWMA), 2001, Orlando, Florida.
Graubard, G., Bogner, J. & Rouleau, W. 2007. Cost-effective tools for removing H2S from landfill gas. Proceedings of 11th International Waste Management and Landfill Symposium, 1–6.10.2007. Cagliari, Italy.
Griffin, P. 2007. Biogas treatment. Presentation at Cranfield University 18th September 2007.
Gruber, F. & Melmer, E. 1997. Engine arrangement. Gas engine system with fuel purification system allowing use of exhaust gas catalyst. Jenbacher AG. Pat. EP 818617 B1.
Grümping, R. & Hirner, A. 1999. HPLC/ICP-OES determination of water-soluble silicone (PDMS) degradation products in leachates. Fresenius J. Anal Chem., Vol. 363, pp. 347–352.
Grümping, R., Mikolajczak, D. & Hirner, A. 1998. Determination of trimethylsilanol in the environment by LT-GC/ICP-OES and GC-MS. Fresenius' journal of analytical chemistry., Vol. 361. pp. 133–139.
Grümping, R, Michalke, K., Hirner A. & Hensel R. 1999. Microbial Degradation of Octamethyl-cyclotetrasiloxane. Appl. Env. Microbiol., Vol. 65, pp. 2276–2278.
Haga, K. Adachib, S., Shiratoria, Y., Itoha, K. & Sasakia, K. 2008. Poisoning of SOFC anodes by various fuel impurities Solid State Ionics. Vol. 179, pp. 1427–1431.
Hagmann, M., Hesse, E., Hentschel, P. & Bauer, T. 2001. Purification of biogas-removal of volatile silicones. In: Proceedings Sardinia 2001, 8th Int. Waste Management and Landfill Symposium, Vol. II, 2001, pp. 641–4.
69
Hagmann, M., Heimbrand, E. & Hentschel, P. 1999. Determination of siloxanes in biogas from landfills and sewage treatment plants In: Proceedings Sardinia 99, 7th Int. Waste Management and Landfill Symposium, Cagliari, Italy, 4–8 October 1999.
Hamaguchi, K., Nagafuji, M., Yamada, M. & Shimizu, A. 2005. Method and apparatus for refining siloxane compound-containing gas by activated adsorbents and power generation facility using digestion gas. Pat. JP 2005111377.
Hamaguchi, K., Nagafuji, M., Shimizu, A. & Shimizu, H. 2002. Method and apparatus for refining digestion gas from wastewater sludge by removing polysiloxane compound. Pat. JP 2002069468.
Hayes, H., Graening, G., Saeed, S. & Kao, S. 2003. A summary of available analytical methods for the determination of siloxanes in biogas. Presentation at SWANA LFG symposium 2003. Tampa, Florida.
Hayward, J. 2004. Fuel cleaning for gas fired engines. Pat. GB2396315A.
Heguy D. & Bogner J. 2004. Cost-Effective Hydrogen Sulfide Treatment Strategies for Commercial Landfill Gas Recovery: Role of Increasing C&D (Construction and Demolition) Waste. MSW Management March/April, http://waste.environmental-expert.com.
Herdin, G., Gruber, F., Kuffmeier, R. & Brandt, A. 2000. Solutions for siloxane problems in gas engines utilizing landfill and sewage gas. ICE (American Society of Mechanical Engineers) 34. Alternative Fuels, Dimethyl Ether and Natural Gas Engines, Vol. 3, pp. 101–110.
Higgins, S. 2006. Siloxane removal process. Pat. US2006225571.
Hofmann, F., Plättner, A., Lulies, S. & Scholwin, F. 2005. Evaluierung der Möglichkeiten zur Einspeisung von Biogas in das Erdgasnetz. Endberich. Institut für Energetik und Umwelt GmbH. 291 p.
Howard, L., Tower, P. & Wetzel, J. 2006. Regenerable purification system for removal of siloxanes and volatile organic carbons. Pat. US 20060144224.
Huppmann, R., Lohoff, H. & Schröder, H. 1996. Cyclic siloxanes in the biological waste water treatment process—determination, quantification and possibilities of elimination, Fr. J. Anal.Chem., Vol. 354, pp. 66–71.
Hurley, C. 2003. Biogas-fuelled microturbines A positive outlook for growth in the US. http://www.cospp.com/display_article/272891/122/ONART/Display/none/1/Biogas-fuelled-microturbines/. A positive outlook for growth in the US.
Häusler, T. & Schreier, W. 2005. Analyse siliziumorganischer Verbindungen im Deponiegas sowie CO-Messungen zur Brandfrüherkennung. Verlag Abfall aktuell – Band 16 – Stillegung und Nachsorge von Deponien, pp. 241–249.
Ikeda, T. & Abe, T. 2001. Method of removing siloxanes from silicon compound gases and pparatus therefore, and siloxane content analyzing method and analyzing apparatus. Pat. US 6 196 050.

70
Inoue, U., Shimada, S. & Fujikawa, S. 2006. System and method for removal of polysiloxane compound in digestion gas from waste treatment. Pat. JP 2006036858.
Jäkel, K. 2007. Der Schwefel muss raus. dlz agrarmagazin 2/2007 s. 90–96.
Kim, J., Choi, H. & Yoo, I. 2006. Adsorption of the Siloxane Contained in Landfill Gas using Clay Mineral. J. Korean Ind. Eng. Chem., Vol. 17, No. 5, s. 465–470.
Knoppers, R. 2006. Amsterdam zet gas uit rioolslib om in stroom. Technisch Weekblad December 2006.
Kuittinen, V., Huttunen, M. & Leinonen, S. 2008. Finnish biogas register. Data on year 2007 (in Finnish). University of Joensuu, Reports of Karelian Institute N:o 4/2008. 77 s.
Lenschow, G. & Martens, J. 1999. Abreicherung von Siliziumverbindungen aus Brenngasen Haase Energietech GmbH Pat. EP955352 A1.
Lindqvist, A. 2008. Studie av deponigasanläggning – kvalitetshöjande åtgärder samt alternativa användningsområden. Luleå tekniska universitet. Examensarbete. 84 p.
Lubetzki, J., Troesch, O. & de Freitas, J. 2001. Produit a base de machefers d’incineration de dechets menagers et son utilization en decharge et pour l’epuration du biogaz. Novergie. Pat. EP1409165.
Lunghi, P., Bove, R. & Desideri, U. 2004. Life-cycle-assessment of fuel cells based landfill-gas energy conversion technologies. J. Power Sources, Vol. 131, pp. 120–126.
Kazuyuki, O., Masaki, T., Tadao, M., Hiroshi, K., Nobuo, T. & Akira, K. 2007. Behavior of Siloxanes in a Municipal Sewage-Treatment Plant Journal of Japan Sewage Works Association, Vol.44, no 531, pp. 125–138.
Li, H.-Q. & Gnilka, D. 2003. Gasqualitätsverbesserung in Bezug auf Verstromung. VDI-Berichte Nr. 1751, Düsseldorf 2003, pp. 121–138.
Markbreiter, S. & Weiss, I. 1997. Cryogenic treatment of landfill gas to remove troublesome compounds. Pat. US 5596884.
McCarron, G. & Pierce, J. 2006. Pipeline quality gas and LFG-utilization alternative soon ready to come in from the cold. Presentation at the Landfill Methane Outreach Program LMOP 9th Annual Conference and Project Expo January 18–19, 2006 Baltimore, Maryland. www.epa.gov.
Mostbauer, P., Lenz, S. & Lechner, P. 2007. Upgrading of Lean Landfill Gas Using MSWI Bottom Ash. Proceedings of the 11th International Waste Management and Landfill Symposium, Cagliari, Italy, 1–6 October 2007. 10 p.
Nordiska ministerrådet. 2005. Siloxanes in the Nordic Environment. TemaNord 2005:593. 93 p.

71
Nourut, M. 2006. Operational costs and other considerations of Landfill Gas cleaning. Presentation at the 9th Landfill Methane Outreach Program Conference Baltimore, Maryland on January 17–19 2006. http://www.epa.gov/lmop/.
Ott, M. & Tamm, D. 2003. Anforderungen beim Einsatz von Biogas in Brennstoffzellen. Presentation at Gülzower FachgesprächWorkshop “Aufbereitung von Biogas” 17–18. Juni 2003, FAL Braunschweig, pp. 60–70.
Parker, T., Hillier, J., Keller, S. & O’Leary. M. 2004. Quantification of trace components in landfill gas. Environmental Agency R&D Technical Report P1-491/TR. Environmental Agency Bristol.
Petersen, G. 2004. Spilvandsteknisk Tidsskrift. nr. 5, pp.12–14.
Pierce, J. 2005. Siloxane quantification , removal and impact on landfill gas utilization facilities. Presentation at 8th Annual LMOP Conference January 10–11, 2005. Baltimore, Maryland.
Pierce, J. & Ramirez, A. 2007. Mountaingate Medium-BTU Gas Plant Over Twenty Years of Successful Operation, Presentation at SWANA's Annual Landfill Gas Symposium, March 4–8, 2007.
Prabucki, M., Doczyck, W. & Asmus, D. 2001. Removal of organic silicon compounds from landfill and sewer gas. In Proceedings Sardinia 2001 8th International Waste Management and Landfill Symposium, Cagliari, Italy, Vol. II, pp. 631–639.
Prechtl, S., Schneider, R., Anzer, T. & Faulstich, M. 2003. Mikrobiologische Entschwefelung von Biogas. Presentation at Gülzower FachgesprächWorkshop “Aufbereitung von Biogas”, 17–18 Juni 2003, FAL Braunschweig, pp. 169–183.
Pulsa, M. 2008. Injection of biogas into the natural gas grid. Master's thesis. Lappeenranta University of Technology. In Finnish. 145 p.
Rasi S., Veijanen A. & Rintala J. 2007. Trace compounds of biogas from different biogas production plants. Energy, Vol. 32, pp. 1375–1380.
Rossol, D. & Schmelz, K. 2005. Siloxane im Faulgas GWF, Wasser/Abwasser, Vol. 146(1), pp. 55–61.
Rossol, D., Schmelz, K. & Hohmann, R. 2003. Siloxane im Faulgas. KA: Abwasser/Abfall, Vol. 50(8), pp. 1043–1051.
Ruokomäki, J. 2009. Biogas criteria for SOFC. E-mail 12.6.2009. Product Centre Ecotech. Wärtsilä Finland Oy.
Saeed, S., Kao, S. & Graening, G. 2002. Comparison of Impinger and Canister Methods for the Determination of Siloxanes in Air, Presentation at AWMA Symposium on Air Quality Measurement Methods and Technology, San Francisco, CA , November 13–15, 2002.
Sasaki, T. & Kimura, M. 2004. Fuel cell power plant and its operation method. Toshiba International Fuel Cells Corp. Pat. JP 2004095370.

72
Schmersahl, R. & Scholz, V. 2005. Testing a PEM Fuel Cell System with Biogas Fuel. Agricultural Engineering International: the CIGR E-journal. Vol. VII. Manuscript EE 05 002. September, 2005.
Schmidt, C. 1997. Wirtschaftliche Optimierung einer Deponiegasverwertungsanlage Trierer Berichte zur Abfallwirtschaft , Band 11 (Neue Aspekte bei der Deponiegasnutzung), pp. 109-126
Schnell, H. 2003. Störstoffe im Biogas. Presentation at Gülzower Fachgespräch Workshop “Aufbereitung von Biogas”, 17–18. Juni 2003, FAL Braunschweig.
Schulze Oswald KG. 2001. Verfahren und Gaswaschanlage zur Reinigung von Biogas im Hinblick auf verbrennungsschädliche (Spuren-) Bestandteile. Pat. DE10008247 A1.
Schweigkofler, M. & Niessner, R. 2001. Removal of siloxanes in biogases, J. Hazard. Mater., B83, pp. 183–196.
Schweigkofler, M. & Niessner, R. 1999. Determination of Siloxanes and VOC in Landfill Gas and Sewage Gas by Canister Sampling and GC-MS/AES Analysis. Env. Sci. Technol., Vol. 33, pp. 3680–3685.
Schwerdt, P. & Doczyck, W. 2003. Process and device for purifying fermentation gases. Pat. EP1316350 A1.
Seguin, K., Carter, S., Dallas, A., Ding, L., Hoang, B. & Joriman, J. 2006. Adsorption element and methods. Pat. US7022158.
Seki, K. 2005. Device and method for adsorption and storage of biogas containing polysiloxane. Osaka Gas Co. Ltd. Pat. JP 2005061597.
Seo, D., Yun, S., Kim, M., Oh, I., Song, S. & Chun, S. 2007. Experimental study on the removal of siloxane from landfill gas by adsorption. Proceedings of the 11th International Waste Management and Landfill Symposium, Cagliari, Italy, 1–6 October 2007. 10 p.
Shin H., Park J., Park, K. & Song, H. 2002. Removal characteristics of trace compounds of landfill gas by activated carbon adsorption. Environmental Pollution, Vol. 119 (2), pp. 227–236.
Simoës, P. Innovation manager. Afval Energie Bedrijf Gemeente Amsterdam. E-mail 10.12.2007.
Slezak, L., Schettler, J., Rabitory, J., Lockwood, S. and Stoops, D. 2002. Conquering siloxane in digester gas fuelled engine driven cogeneration systems WEFTEC 02, Conference Proceedings, Annual Technical Exhibition & Conference, 75th, Chicago, IL, United States, Sept. 28–Oct. 2, 2002.
Spiegel, R. & Preston, J. 2003a. Technical assessment of fuel cell operation on anaerobic digester gas at the Yonkers, NY, wastewater treatment plant. Waste Management, Vol. 23, pp. 709–717.
Spiegel, R. & Preston, J. 2003b. Technical assessment of fuel cell operation on landfill gas at the Groton, CT, landfill. Energy, Vol. 28, pp. 397–209.

73
Spiegel, S. Thorneloe, J., Trocciola, C. & Preston, J. 1999. Fuel cell operation on anaerobic digester gas: conceptual design and assessment. Waste Management, Vol. 19, no 6, 1999, pp. 389–399.
Stoddart, J., Zhu, M., Staines, J., Rothery, E. & Lewicki, R. 1999. Experience with halogenated hydrocarbons removal from landfill gas. In: Proceedings Sardinia 1999 7th International Waste Management and Landfill Symposium, Vol. II. Pp. 489–498.
Troung, L. & Abatzoglou, N. 2005. A H2S reactive adsorption process for the purification of biogas prior to its use as a bioenergy vector. Biomass and Bioenergy, Vol. 29, pp. 142–151.
Tower, P. & Wetzel, J. 2006. Removing siloxanes from a gas stream using a mineral based adsorption media. Pat. US20060000352 A1.
Tower, P. 2003. New technology for removal of siloxanes in digester gas results in lower maintenance costs and air quality benefits in power generation equipment. Presentation at WEFTEC 03 78th Annual Technical Exhibition and Conference, October 11–15, 2003.
Trimborn, M., Nellessen, U. & Roth, M. 2003. Untersuchung des Asubreitungsverhaltens von Silicium-verbindungen am Beispiel der Kläranlage Zülpich-Bessenich (Erft River Association) KA: Abwasser, Abfall, Vol. 50(7), pp. 908–913.
Trogisch, S., Hoffmann, J. & Bertrand, L. 2005. Operation of molten carbonate fuel cells with different biogas sources: A challenging approach for field trials. Journal of Power Sources, Vol. 145, pp. 632–638.
Tsujimoto, S. 2005. Apparatus with activated carbon for treatment of biogas from fermentation of wastewater sludge. Osaka Gas Ltd. Pat. JP 2005139259.
Tuazon, E., Aschmann, S. & Atkinson, R. 2000. Atmospheric degradation of volatile methyl-silicon compounds. Environmental Science & Technology, Vol. 34, pp. 1970–1976.
Thyberg Naumann, S. & Myrkn, C. 1995. Fuel processing of biogas for small fuel cell power plants. Journal of Power Sources, Vol. 56, pp. 45–49.
Urban, W., Girod, K. & Lohmann, H. 2009. Technologien und Kosten der Biogasaufbereitung und Einspeisung in das Erdgasnetz. Ergebnisse der Markterhebung 2007-2008. Fraunhofer Umsicht Publikation. 123 p.
Urban, W. & Ungern, C. 2005. Sorptionseinheit zur Entfernung organischer Silizium verbindungen sowie Verwendung von hydrophobierten Kieselgel als selektives Sorbens. Pat. WO2005EP11361A DE.
US EPA. 2003. Siloxane D5 in Dry-cleaning Applications. http://www.epa.gov/dfe/pubs /garment/d5fs.pdf.
Varaprath, S., Stutts, D. & Kozerski, G. 2006. A Primer on the Analytical Aspects of Silicones at Trace Levels-Challenges and Artifacts – A Review. Silicon Chemistry, Vol. 3, Nr.1–2 / September 2006.

74
Vesterager, N. & Matthiesen, D. 2004. Advanced prediction, monitoring and controlling of anaerobic digestion processes behaviour towards Biogas usage in Fuel Cells. WP 8 2nd Progress and Assessment Report. http://www.energyagency.at/publ/pdf/amonco_d19.pdf.
Weiland, P. 2003. Notwendigkeit der Biogasaufbereitung, Ansprüche einzelner Nutzungsrouten und Stand der Technik. Presentaion at Gülzower Fachgespräch Workshop “Aufbereitung von Biogas” 17–18 Juni 2003, FAL Braunschweig, pp. 7–23.
Wetzel, J. & Tower, P. 2007. Removing siloxanes from a gas using a segmented filtration system customized to the gas composition. Applied Filter Technology Inc. Pat. US7264648 B1.
Wheless, E. & Pierce, J. 2004. Siloxanes in Landfill and Digester Gas Update. Presentation at SWANA’s 27th Annual Landfill Gas Symposium, March 2004, San Antonio, Texas.
Willumsen, H. 2004. Landfill gas recovery plants. Waste management world, Vol. 5, pp. 125–133.
Yoshida, S., Yasutake, A., Okuno, S., Honda, Y., Kudo, H., Mizutani, H. & Izumi, O. 2004. Gas Purification Apparatus. Mitsubishi Heavy Industries, Ltd., Japan; Institute of Research and Innovation. Pat. JP2004337745 A.

Appendix A: Field Measurement
A1
Appendix A: Field Measurement
Site 1. Landfill Gas Matrix, average results of two campaigns.
From landfill After drying
CH4 vol-% 52 50 CO2 vol-% 41 41 H2O vol-% 3.3 0.9 NH4 ppm 3.5 < 1 Organic silicon, mg/m³:
L2* – – L3 0.3 0.3 L4 2.6 2.3 D3 2.1 1.7 D4 2.6 3.0 D5 1.8 1.8 TMS** 1.8 1
Sulphur compounds mg/m³: H2S 820 710 DMS 2.8 2.8 buthanethiol 1.5 1.5 ethyl thiol 2.8 2.8 thiourea 0.3 0.3
VOC (main components), mg/m³: ethyl benzene 21 19 nonane 14 13 a-pinene 50.5 13 Σ-xylenes 11 18 limonene 126 119 etanol 31 28 toluene 19 18 octane 0.1 0.1
Σ halogens**, mg/m³ main: trichlorofluoromethane, 1,2-dichloroethene
2–7 2–7
* quantification inscure due to high hydrogen sulphide content. ** quantified as toluene eqv.

Appendix A: Field Measurement
A2
Site 2. Landfill Gas Matrix.
From landfill –
To microturbine, actived carbon
filtrated, 17 weeks in use
To microturbine, activated carbon
filtrated, new filter media
CH4 vol-% 36.5 36.2 37 CO2 vol-% 32.7 32.4 H2O vol-% 0.51 0.47 0.06 O2 vol % 1 1 1 Organic silicon, mg/m³:
L2 0.2. 0.2. 0.01
L3 0.05 0.08 < 0.01
L4 1.3 2.1 < 0.01
D3 2.3 0.9 < 0.01
D4 0.9 1 < 0.01
D5 1.3 1.4 < 0.01
TMS* 0.7 0.6 n.d Sulphur compounds mg/m³:
H2S 67 21 < 5 DMS 0.8 0.8 < 0.01 ethyl thiol 4.1 3.9 < 0.01
VOC (main components), mg/m³: ethyl benzene 25 28 < 0.01 nonane 9.4 9.9 < 0.01 a-pinene 6.2 14 < 0.01 Σ-xylenes 33 40 < 0.01 limonene 2.4 3.4 < 0.01 toluene 4.9 7.2 < 0.01
Σ halogens*, mg/m³ main: trichlorofluoromethane, tetrachloroethene
0.7 0.25 n.d.
* quantified as toluene eqv.
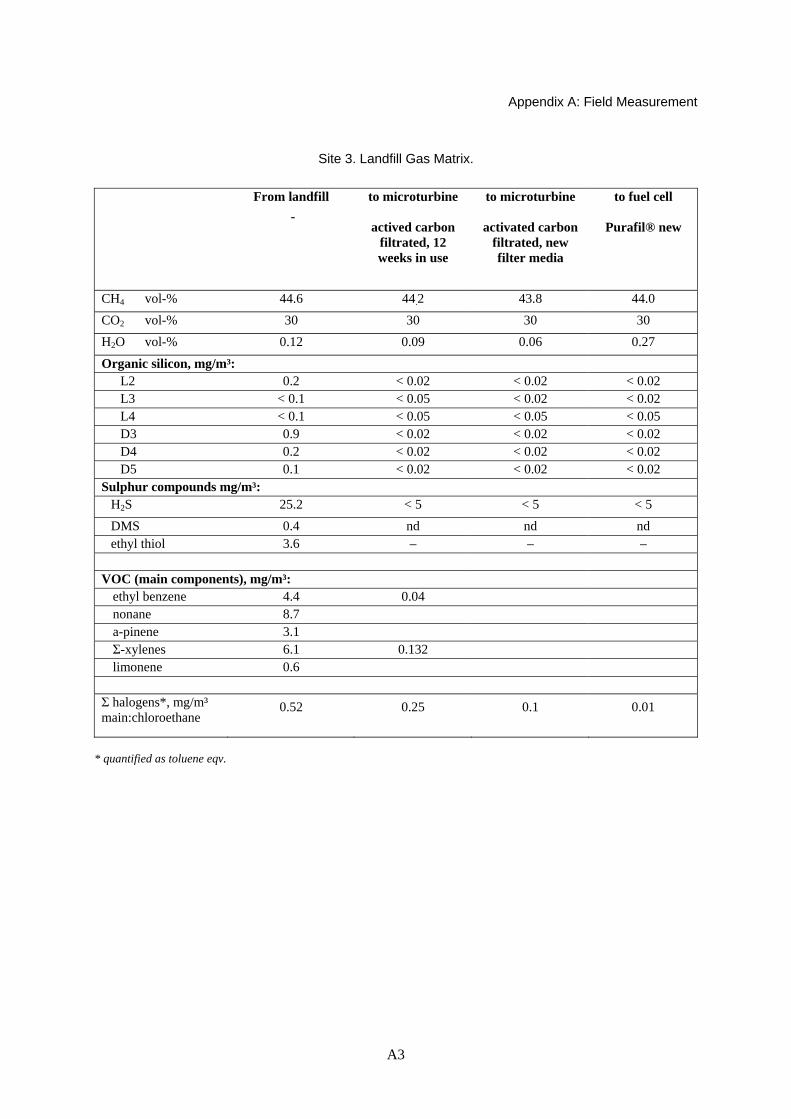
Appendix A: Field Measurement
A3
Site 3. Landfill Gas Matrix.
From landfill -
to microturbine
actived carbon filtrated, 12 weeks in use
to microturbine
activated carbon filtrated, new filter media
to fuel cell
Purafil® new
CH4 vol-% 44.6 44.2 43.8 44.0 CO2 vol-% 30 30 30 30 H2O vol-% 0.12 0.09 0.06 0.27 Organic silicon, mg/m³:
L2 0.2 < 0.02 < 0.02 < 0.02 L3 < 0.1 < 0.05 < 0.02 < 0.02 L4 < 0.1 < 0.05 < 0.05 < 0.05 D3 0.9 < 0.02 < 0.02 < 0.02 D4 0.2 < 0.02 < 0.02 < 0.02 D5 0.1 < 0.02 < 0.02 < 0.02
Sulphur compounds mg/m³: H2S 25.2 < 5 < 5 < 5 DMS 0.4 nd nd nd ethyl thiol 3.6 – – –
VOC (main components), mg/m³:
ethyl benzene 4.4 0.04 nonane 8.7 a-pinene 3.1 Σ-xylenes 6.1 0.132 limonene 0.6
Σ halogens*, mg/m³ main:chloroethane
0.52 0.25 0.1 0.01
* quantified as toluene eqv.

Appendix A: Field Measurement
A4
Site 4. WWTP Biogas Matrix, average of two campaigns.
CH4 vol-% 65 CO2 vol-% 33.5 H2O vol-% 2 O2 vol % – Organic silicon, mg/m³:
L2 0.03 L3 0.03 L4 0.12 D3 0.15 D4 1.6 D5 27 TMS 0.03
Sulphur compounds mg/m³: H2S < 14 DMS 0.1 dipentyl disulphide* 0.1
VOC (main components), mg/m³: ethyl benzene 28 nonane 3.1 a-pinene 14 Σ-xylenes 1.3 limonene 5.23 toluene 4.6
Σ halogens*, mg/m³ main: tetrachloroethene
0.09
* quantified as toluene eqv.

Appendix A: Field Measurement
A5
Site 4. WWTP Biogas Matrix average of one week monitoring.
CH4 vol-% 65 CO2 vol-% 29 H2O vol-% 0.5 O2 vol % – Organic silicon, mg/m³:
L2 0.04 L3 <0.01 L4 1.29 D3 0.03 D4 0.1 D5 0.9 TMS* 0.6
Sulphur compounds mg/m³: H2S 30 DMS 0.1 ethyl thiol 0.3
VOC (main components), mg/m³: ethyl benzene 1.7 nonane 1.1 octane 1.3 Σ-xylenes 1.4 limonene 62 toluene 8
Σ halogens*, mg/m³ main: tetrachloroethene, dichloromethane
0.7
* quantified as toluene eqv.


Series title, number and report code of publication
VTT Research Notes 2496 VTT-TIED-2496
Author(s) Mona Arnold Title Reduction and monitoring of biogas trace compounds Abstract For the versatile use of biogas as fuel, it is necessary to remove harmful impurities that affect the utilization as an energy source. The most significant impurities that require removal are corrosion-causing sulphur compounds and organic silicon compounds, in particular, siloxanes. Siloxanes transform into silicon dioxide on the surfaces of gas engines and turbines and thus damage the equipment.
The objective of this study was to gather know-how on biogas impurities and their concentration levels as well as the solutions for trace compound removal. In addition, further impacts of impurities on biogas usage from the technical and economic standpoints are discussed. In the study, a literature search was conducted on the existing scientific and economic literature (2000 →) as well as the patents concerning biogas purification. The information gathered has been substantiated as far as possible by consulting experts in the field.
The emphasis of this study was the harmful components of biogas electricity production and especially siloxanes. In addition to the occurrence and removal of biogas impurities, current methods of determining siloxane were evaluated. A new concept for on-line determination of siloxanes in the field was developed. Furthermore, the report presents the biogas matrices at six sites in Finland determined with the developed method.
ISBN 978-951-38-7314-1 (URL: http://www.vtt.fi/publications/index.jsp)
Series title and ISSN Project number VTT Tiedotteita – Research Notes 2496 1455-0865 (URL: http://www.vtt.fi/publications/index.jsp)
30875
Date Language Pages August 2009 English 74 p. + app. 5 p.
Name of project Commissioned by ADOPT Biokaasun laadun hallinta Tekes, Sarlin Oy, Mölnlycke Oy, YTV, Fortum Oyj,
Wärtsilä Finland Oy, Espoon Vesi
Keywords Publisher biogas, landfill gas, siloxanes VTT Technical Research Centre of Finland
P.O. Box 1000, FI-02044 VTT, Finland Phone internat. +358 20 722 4520 Fax +358 20 722 4374

VTT RESEARCH NOTES 2496VTT CREATES BUSINESS FROM TECHNOLOGY�Technology�and�market�foresight�•�Strategic�research�•�Product�and�service�development�•�IPR�and�licensing�•�Assessments,�testing,�inspection,�certification�•�Technology�and�innovation�management�•�Technology�partnership
•�•�•��VTT�RESEA
RC
H�N
OTES�2496��
REd
uC
TION
�AN
d�m
ON
ITOR
INg
�Of�b
IOg
AS�TR
AC
E�CO
mPO
uN
dS
ISBN 978-951-38-7314-1 (URL: http://www.vtt.fi/publications/index.jsp)ISSN 1455-0865 (URL: http://www.vtt.fi/publications/index.jsp)
Mona Arnold
Reduction and monitoring of biogas trace compounds
VTT Tiedotteita – Research Notes
2484 Torsti Loikkanen, Jari Konttinen, Jukka Hyvönen, Laura Ruotsalainen, Kirsi Tuominen, Mika Waris, Veli-Pekka Hyttinen & Olli Ilmarinen. Acquisition, Utilisation and the Impact of Patent and Market Information on Innovation Activities. 2009. 68 s.
2485 Marita Hietikko, Timo Malm & Jarmo Alanen. Koneiden ohjausjärjestelmien toiminnallinen turvallisuus. Ohjeita ja työkaluja standardien mukaisen turvallisuusprosessin luomiseen. 2009. 75 s. + liitt. 14 s.
2486 Helena Järnström, Sirje Vares & Miimu Airaksinen. Semi volatile organic compounds and flame retardants. Occurence in indoor environments and risk assessment for indoor exposure. 2009. 58 p. + app. 8 p.
2487 Tiina Koljonen, Juha Forsström, Veikko Kekkonen, Göran Koreneff, Maija Ruska, Lassi Similä, Katri Pahkala, Laura Solanko & Iikka Korhonen. Suomalaisen energiateollisuuden kilpailukyky ilmastopolitiikan muuttuessa. 2008. 88 s.
2488 Sami Karjalainen. Talotekniikan käytettävyys ja sen kehittäminen. Kohti helppokäyttöisyyttä. 2009. 47 s. + liitt. 3 s.
2490 Tiina Apilo, Henri Hytönen & Katri Valkokari. Arvonluonnin uudet muodot ja verkostot 2009. 94 s.
2491 Kirsi Aaltonen, Mervi Murtonen & Sampo Tukiainen. Three perspectives to global projects. Managing risks in multicultural project networks. 2009. 47 p. + app. 4 p.
2492 Tuomo Tuikka & Minna Isomursu (eds.). Touch the Future with a Smart Touch. 2009. 280 p.
2493 Hannele Holttinen, Peter Meibom, Antje Orths et al. Design and operation of power systems with large amounts of wind power. Final report, IEA WIND Task 25, Phase one 2006–2008. 2009. 200 p. + app. 29 p.
2494 Marjaana Rättö, Minna Vikman & Matti Siika-aho. Yhdyskuntajätteiden hyödyntäminen biojalostamossa. 2009 64 s.
2496 Mona Arnold. Reduction and monitoring of biogas trace compounds. 2009. 74 p. + app. 5 p.
2497 Tuula Hakkarainen, Jukka Hietaniemi, Simo Hostikka, Teemu Karhula, Terhi Kling, Johan Mangs, Esko Mikkola & Tuuli Oksanen. Survivability for ships in case of fire. Final report of SURSHIP-FIRE project. 2009. 120 p. + app. 7 p.