Embed Size (px)
Citation preview

1
__________________________________________________________________________________
Vol. 9, No. 2 Summer 2012 AASA Journal of Scholarship and Practice
Research and Evidence-based Practice That Advance the Profession of Education Administration
Summer 2012 / Volume 9, No. 2
Table of Contents
Board of Editors. . . . . . . . . . . . . . . . . . . . . . . . . . . . . . . . . . . . . . . . . . . . . . . . . . . . . . . . . . . . . . . . . . 2
Editorial
By the Numbers . . . . . . . . . . . . . . . . . . . . . . . . . . . . . . . . . . . . . . . . . . . . . . . . . . . . . . . . . . . . . . . . . . 3
Christopher H. Tienken, EdD
Research Articles
The Response to Intervention Framework and Nurturing Potential: Promising Practices. . . . . . . . . . . 7
Robin J. Carey, PhD
The Influence of Teachers’ Preexisting Notions about Students on Scholastic
Achievement Change . . . . . . . . . . . . . . . . . . . . . . . . . . . . . . . . . . . . . . . . . . . . . . . . . . . . . . . . . . . . . . 18
Concetta Pirrone, PhD
Book Reviews
College and Career Ready in the 21st Century: Making High School Matter by James R. Stone, III
and Morgan V. Lewis . . . . . . . . . . . . . . . . . . . . . . . . . . . . . . . . . . . . . . . . . . . . . . . . . . . . . . . . . . . . . . 29
Reviewed by Michael Ian Cohen, EdD
The Flat World and Education: How America’s Commitment to Equity Will Determine
Our Future by Linda Darling-Hammond. . . . . . . . . . . . . . . . . . . . . . . . . . . . . . . . . . . . . . . . . . . . . . . . 33
Reviewed by Art Stellar, PhD
Mission and Scope, Copyright, Privacy, Ethics, Upcoming Themes,
Author Guidelines & Publication Timeline . . . . . . . . . . . . . . . . . . . . . . . . . . . . . . . . . . . . . . . . . . . 37
AASA Resources . . . . . . . . . . . . . . . . . . . . . . . . . . . . . . . . . . . . . . . . . . . . . . . . . . . . . . . . . . . . . . . . . 41

2
__________________________________________________________________________________
Vol. 9, No. 2 Summer 2012 AASA Journal of Scholarship and Practice
Board of Editors
AASA Journal of Scholarship and Practice
2011-2013
Editor Christopher H. Tienken, Seton Hall University
Associate Editors
Barbara Dean, American Association of School Administrators
Charles Achilles, Seton Hall University
Christopher A. Sbaratta, New York University
Albert T. Azinger, Illinois State University
Sidney Brown, Auburn University, Montgomery Brad Colwell, Bowling Green University
Theodore B. Creighton, Virginia Polytechnic Institute and State University
Betty Cox, University of Tennessee, Martin
Gene Davis, Idaho State University, Emeritus
John Decman, University of Houston, Clear Lake
David Dunaway, University of North Carolina, Charlotte
Daniel Gutmore, Seton Hall University
Gregory Hauser, Roosevelt University, Chicago
Jane Irons, Lamar University
Thomas Jandris, Concordia University, Chicago
Zach Kelehear, University of South Carolina
Judith A. Kerrins, California State University, Chico
Theodore J. Kowalski, University of Dayton
Nelson Maylone, Eastern Michigan University
Robert S. McCord, University of Nevada, Las Vegas
Sue Mutchler, Texas Women's University
Margaret Orr, Bank Street College
David J. Parks, Virginia Polytechnic Institute and State University
George E. Pawlas, University of Central Florida
Jerry Robicheau, University of Minnesota, Mankato
Paul M. Terry, University of South Florida
Thomas C. Valesky, Florida Gulf Coast University
Published by the
American Association of School Administrators
1615 Duke Street
Alexandria, VA 22314
Available at www.aasa.org/jsp.aspx
ISSN 1931-6569

3
__________________________________________________________________________________
Vol. 9, No. 2 Summer 2012 AASA Journal of Scholarship and Practice
EDITORIAL
Christopher H. Tienken, Editor
AASA Journal of Scholarship and Practice
By The Numbers
Many educators probably spend a fair amount of time reading. There are a seemingly endless number
of memos from state education bureaucrats, the daily inflow of work related emails, and the host of
armchair edu-journals. I have been trying to enlarge my literature choices during the past few years
and the summer months always seem like a good time to add another selection to an already
overcrowded night stand.
Several years ago I started reading Foreign Policy, Foreign Affairs, anything from the Center
for Economic and Policy Research, Nouriel Roubini’s Econmonitor blog, Harvard Business Review,
Entrepreneur magazine, and Harpers magazine. The foreign policy and economics literature is
especially helpful to understand the macro-economic environment and how that environment is pushing
market/corporate reforms into education. With all due respect to those that think education
achievement on international or national assessments has a direct impact on the largest economies in
the world , they really need to read more about industrial policy. That is what makes economies move,
not your students’ state or international test scores.
The Harvard Business Review and Entrepreneur magazine drive home the point that a one-size
fits all, static national curriculum enforced with a national test is not going to engender innovation,
creativity, socially conscious problem solving, resilience, persistence, motivation, empathy, and drive
to succeed. Harpers magazine covers a wide range of topics from the economy to the arts, but it is the
Harpers Index that I like most. The monthly feature presents interesting data-bytes that always make
me think. So to pay homage to one of my favorite reads I put together an index of not-so-random
statistics to perhaps jumpstart some more summer reading.
Stats
1. United States ranking on the World Economic Forum’s Global Competitiveness Index (GCI) of
142 countries during the last 17 years (World Economic Forum, 1995-2012):
o 2011-12 5
o 2010-11 4
o 2009-10 2
o 2008-09 1
o 2007-08 1
o 2006-07 6
o 2005-06 1
o 2004-05 2
o 2003-04 2
o 2002-03 2
o 2001-02 1
o 2000-01 2
o 1999-00 2
o 1998-99 2
o 1997-98 3
o 1996-97 3
o 1995-96 4
o Average rank: 2.4 out of 142

4
__________________________________________________________________________________
Vol. 9, No. 2 Summer 2012 AASA Journal of Scholarship and Practice
2. US rank of researchers per 1,000 employed: 4th
behind Sweden, Japan, and Singapore (Atkinson &
Andes, 2009). China ranked 19th
behind countries such as Poland and Ireland.
3. US rank of the world’s share of scientific and technical publications: 2nd
behind Sweden. China
ranked 21st
(Atkinson & Andes, 2009). .
4. US 2011 Gross Domestic Product (GDP) Purchasing Power Parity (PPP) ranking: 1st
o China: 2nd
o India: 3rd
o Japan: 4th
o Germany: 5th
o Russia: 6th
o Brazil: 7th
Central Intelligence Agency (CIA, 2012)
5. US per capita (per person) GDP rank: 12th
, $48,100
China: 120th
8,400 (CIA, 2012)
6. US GPD per working age adult ages 25-64 rank: 1st, $89,422 (Atkinson & Andes, 2009)
7. Number one reason given for nationalizing and centralizing the curriculum and assessment of US
public schools via the unproven Common Core State Standards and national testing: Global
competiveness. Really?
8. Poverty line threshold for a family of three in the continental United States and District of
Columbia: $19, 090 (USDHHS, 2012)
9. Poverty line threshold for a family of four in the continental United States and District of
Columbia: $23,050 (USDHHS, 2012)
10. Percentage of American children under age six living at or below the poverty level: 25.8 (USCB,
2012)
11. Percentage of American children under age 18, in a single parent household headed by a female
living at or below the poverty level: 45.6 (USCB, 2012)
12. Percentage of Americans ages 18-24, with no high school diploma, living in poverty: 35.3 (USCB,
2012)
13. US average life expectancy international ranking: 50th
/ 221 countries at 78.49 years. Monaco: 1st,
89.68 years, and Italy: 10th
, 81.86 years (CIA, 2012)
14. US spending on Health Care: 2nd
/ 189 countries. Monaco: 145th
, Italy: 135th
(CIA, 2012)

5
__________________________________________________________________________________
Vol. 9, No. 2 Summer 2012 AASA Journal of Scholarship and Practice
15. US death rate ranking: 143rd
/230 countries with 8.38 people per 1,000. Cuba 116th
/230 with 7.52
people per 1,000 (CIA, 2012)
16. US infant mortality international ranking: 48th
/222 countries with 5.98 infants per 1,000. Cuba 39th
/ 222 countries with 4.83 infants per 1,000 (CIA, 2012)
17. US ranking of education spending: 44 / 163, 5.5% of GDP. Finland: 33
rd. Cuba: 2
nd. Countries that
spend a similar percentage of GDP (5.6%-5-3%) on education: France, Ethiopia, Great Britain,
Vietnam, Ghana, South Africa, Mongolia, Saudi Arabia (CIA, 2012)
18. US ranking on the GINI Coefficient: (Distribution of income / gap in income between the richest
and poorest citizens. Lower ranking means a more equitable distribution of income a smaller gap
between the richest and poorest citizens).
o Sweden: 1
o Finland: 11
o USA: 94
o Countries comparable to USA: Cameroon, Iran, Bulgaria, Jamaica, Uruguay, Guyana, and
Cambodia (CIA, 2012)
19. US unemployment rate rank: 103 /200: Closer to #1 is desirable (CIA, 2012)
20. US oil production rank: 3rd
behind Saudi Arabia and Russia (CIA, 2012)
21. US worldwide oil exports rank: 11th(CIA, 2012)
22. US domestic natural gas production international rank: 1st (CIA, 2012)
23. US worldwide exports rank: 2nd
behind China. Overall imports: 1st, China is 2nd(CIA, 2012)
24. US illicit drug import/consumption: Number one consumer of cocaine, heroin, and marijuana
(CIA, 2012)

6
__________________________________________________________________________________
Vol. 9, No. 2 Summer 2012 AASA Journal of Scholarship and Practice
References
Atkinson, R. D., & Andes, S. M. (2009). The Atlantic century: Benchmarking EU and U.S.
competitiveness. The Information Technology and Innovation Foundation. Retrieved from
www.itif.org.
Central Intelligence Agency. (2012). CIA World Factbook. Author. Retrieved from
https://www.cia.gov/library/publications/the-world-factbook/index.html
United States Census Bureau. (2012). Current population Survey. Author. Retrieved from
http://www.census.gov/hhes/www/cpstables/032010/rdcall/2_001.htm
United States Department of Health and Human Services. (2012). 2012 HHS poverty guidelines.
Author. Retrieved from http://aspe.hhs.gov/poverty/12poverty.shtml/
World Economic Forum. (1995-2012). Global Competitiveness Report. Retrieved from
www3.weforum.org.

7
__________________________________________________________________________________
Vol. 9, No. 2 Summer 2012 AASA Journal of Scholarship and Practice
Research Article_________________________________________________________________
The Response to Intervention Framework and Nurturing Potential:
Promising Practices
Robin J. Carey, PhD
Director, Educational Programming and Services
Douglas County School District
Castle Rock, CO
Abstract The author’s purpose for this article is to examine the use of the Response to Intervention (RtI)
framework to meet the needs of a continuum of learners, from those who most struggle to those in
need of advanced educational opportunities. Through classroom observations, teacher interviews, and
dialogue with the site-based Problem-Solving Team, principal, and a focus group, the author examined
one school’s utilization of the model. With support of school administrators as a critical component,
the RtI framework proved to be an effective means for addressing the needs and nurturing the potential
of all learners, and for identifying and supporting gifted learners. The findings from this study have
important implications with regard to school administrators’ support of instructional practices in
general, as well as specifically for gifted programming practices.
Key Words
Response to Intervention, administration, potential, advanced learners, collaborative practice

8
__________________________________________________________________________________
Vol. 9, No. 2 Summer 2012 AASA Journal of Scholarship and Practice
Introduction
As district personnel zero in on helping
students who struggle to attain proficiency
while also dealing with deep budget cuts,
programming for our nation’s brightest students
has been diminishing (Beisser, 2008).
Beisser noted, “According to responses
from multiple teachers, coordinators of gifted
and talented programs, administrators, and
parents…gifted students are overlooked and
underserved” (p. 3).
Historically, ethnic minority and low
socioeconomic status (SES) students have been
over-represented in special education (Burns,
Jacob, & Wagner, 2008; Fletcher, Coulter,
Reschly, & Vaughn, 2004). Conversely, it is
well documented that gifted programs
traditionally reflect an underrepresentation of
students from ethnic minority and low
socioeconomic (SES) backgrounds (Delcourt,
Cornell, & Goldberg, 2007; Passow & Frasier,
1996).
The Individuals with Disabilities
Education Act (IDEA, 2004) and No Child Left
Behind (NCLB, 2001) both encourage the use
of a Response to Intervention (RtI) framework
to ensure positive outcomes for all students.
The legislation moves away from an
arbitrary number used to determine placement
in a program toward a process by which the
classroom teacher, in collaboration with school
administrators, support staff, and other school
personnel, provides effective, evidence-based
instruction and interventions based on the
demonstrated needs and strengths of the
learner.
Gifted Programming The history of programs for gifted learners
stretches back to the turn of the century
concurrent with the onset of compulsory
education laws creating an influx of students
into public schools (Donovan & Cross, 2002).
According to the National Association of
Gifted Children (NAGC) website, “In the late
1800s, Dr. William T. Harris, Superintendent
of Schools in St. Louis, discussed a plan for the
acceleration of gifted students so they would
have more challenging work and not fall under
the spell of laziness” (NAGC, 2008).
It is noted that by 1920, “approximately
two-thirds of all large cities had created some
type of program for gifted students” (Colangelo
& Davis, 2003, p. 6).
There has been a tendency to alternate
between advocacy for excellence or for equity.
Colangelo and Davis (2003) described a “love-
hate” relationship with giftedness and talent,
pointing out that we admire exceptional talent
and drive in individuals, while at the same time
maintaining a long-standing commitment to
egalitarianism in our educational systems.
There has been resentment on the part
of some who view gifted education as elitist
and giving to the “haves” (p. 3). In an article
examining the Assumptions Underlying the
Identification of Gifted and Talented Students,
Brown et al. (2005) asserted, “Procedures for
identifying gifted and talented students are
probably the most discussed and written about
topic in our field.” They further indicated, “For
the better part of the previous century, test
scores dominated the identification process” (p.
68).
Response to Intervention and Gifted
Learners A shift in thinking is required to address the
over-reliance on IQ and aptitude scores when
identifying high potential learners. Ford, author
of Equity and Excellence: Culturally Diverse
Students in Gifted Education (in Colangelo &

9
__________________________________________________________________________________
Vol. 9, No. 2 Summer 2012 AASA Journal of Scholarship and Practice
Davis, 2003), wrote about this shift in practice.
The following table (Table 1) is adapted from
her recommendations for embracing a more
contemporary and broad view of gifted learners
(p. 513):
Table 1
A Shift in Thinking
Traditional Beliefs and Practices
Contemporary Beliefs and Practices
Identification is a yes or no answer
based on an achievement or
intelligence score
Identification focuses on a profile of
student strengths and needs
Measurement = a single test
Measurement = assessing in multiple
ways with multiple sources
Ability is rewarded and must be
demonstrated
Effort, achievement and potential are
recognized
Genetics determine giftedness
Environment and genetics play a role
in the characteristics of gifted
learners
Students are in a gifted program
Students receive gifted services
Gifted education is a place
Gifted education is not a place
A question of excellence versus
equity
Excellence and equity are not
mutually exclusive
Gifted education is a privilege
Gifted education is a need
[Ford in Colangelo and Davis, Handbook of Gifted Education (3rd
ed.) 2003]
If one uses the contemporary beliefs as
a guide, programming for high potential
learners must be transformed. A single test
score does not give the practitioner information

10
__________________________________________________________________________________
Vol. 9, No. 2 Summer 2012 AASA Journal of Scholarship and Practice
regarding learner strengths, interests, areas of
passion, or areas of relative weakness. The
body of evidence gathered in a process
consistent with contemporary beliefs provides a
“road map” to help teachers understand what
high-potential learners need and how to meet
those needs.
The hallmark of RtI according to
Kratochwill, Volpiansky, Clements, and Ball
(2007) is the “combination of systematic
progress monitoring and movement across tiers
of intervention for making decisions…” (p.
619).
The profile of the learner’s strengths
used within the RtI framework guides decisions
regarding appropriate curriculum, instruction,
assessment, enrichment, extension, depth, and
complexity targeted to develop individual
student potential.
With this approach, students identified
as gifted are provided with programming and
services to meet their identified strengths and
needs; they are not identified for a “program.”
Gone are the days when the “gifted kids” leave
the “regular” classroom at 10:20 a.m. on
Tuesday to play chess or create a diorama in
the “gifted” resource room.
The contemporary gifted education
philosophy provides programming to address
the academic and social emotional needs of the
learner, not as a reward or privilege of the
“label.” Further, programming is an extension
of content and standards to ensure
commensurate growth for the learner, as
opposed to separate enrichment projects added
on to the “regular” curriculum.
So, how can the Response to
Intervention framework support the needs of all
learners? How can the framework be used to
support the needs of gifted learners? How can
the approach be used to identify and support
the needs of ethnic minority and low SES
learners for inclusion in gifted programming? I
examined these questions through a selective
case study comprised of teachers and leaders at
a public elementary school in a suburban
district in Colorado.
Case Study The linkage of general and special education
efforts, particularly with respect to the
disproportional over identification of ethnic
minority students for special education and
under identification of ethnic minority students
for gifted programming, was a focus of this
study. This was a single revelatory case
wherein “lessons learned” were sought from
the study site.
Researcher bias was controlled through
careful application of case study procedures.
The research design incorporated multiple
forms of data and a clearly delineated process
for identifying and examining the emergent
patterns and themes regarding the
implementation of the RtI framework.
Phases of the Study This study was conducted in three phases
(Table 2), taking full advantage of the agility in
allowing initial data gathering to inform next
steps.

11
__________________________________________________________________________________
Vol. 9, No. 2 Summer 2012 AASA Journal of Scholarship and Practice
Table 2
Phases of the Study
Source Phase I Phase II Phase III
Observations • Classrooms
• Problem-Solving
Team
Document Teacher and
PST practices
Interviews • Teachers
• Principal
• Problem-Solving
Team
Contextualize observed
practices and document
emergent themes
• Focus Group
Solidify overall
impressions and
themes garnered
in phases I and II
Sample School and Participants Five schools were identified as possible study
sites in order to ensure a sufficient number of
volunteers at a single site for participation in
the teacher observations and interviews. My
day-to-day work with building administrators
and teachers in several areas of educational
programming informed the identification of
potential study sites.
The five schools were identified and
ranked based on strong leadership commitment
to a school-wide RtI process and specific
programming for gifted learners. One school at
a time was approached until a site with the
sufficient number of participants was
identified.
The principal, teacher subjects, and
Problem-Solving Team members at the first
site were invited to participate in the case study
after an introductory e-mail communication and
follow-up informational meeting for potential
participants.
In the informational meeting, I outlined
the process for observations, interviews, and
the anticipated commitment on the part of the
participants. At the close of the meeting, the
principal, eight problem-solving team
members, and five individual teachers
expressed excitement for the study and
volunteered to participate.
Methodology The case study methodology involved:
classroom observations of five
licensed teachers,
interviews with five licensed
teachers and the school
principal,
observation and dialogue with
the eight member site-based

12
__________________________________________________________________________________
Vol. 9, No. 2 Summer 2012 AASA Journal of Scholarship and Practice
Problem-Solving Team (PST),
and
a focus group comprised of the
site principal, teachers and
problem-solving team members
to provide additional detail and
context to the findings.
Each of the five teachers was observed
once for 30 to 45 minutes, noting the cultural
forces introduced by Ritchhart (2002). These
include time, opportunities, routines and
structures, language, modeling, interactions and
relationships, physical environment, and
expectations. Two 50-minute observations of
the site’s Problem-Solving Team meetings
were conducted, noting the physical
environment, interactions and relationships,
process, and language/expectations. I
conducted interviews with the five teacher
participants, the principal, problem-solving
team, and a focus group. The questions utilized
(Table 3) were purposeful in exploring the
research questions regarding the use of the RtI
framework with all learners. Clarifying and
probing questions stemming from the
observation of the classrooms and problem-
solving team were included in the interview
sessions.

13
__________________________________________________________________________________
Vol. 9, No. 2 Summer 2012 AASA Journal of Scholarship and Practice
Table 3:
Questions asked of participants
Target Questions
Teachers Tell me about your background knowledge of RtI (when/how you first
became aware of the framework; over time, how implementation of the
process has taken shape in your classroom, etc.).
Describe how you determine what your students know and are able to do.
What do you identify as the most important aspect in identifying a
student for gifted programming?
What do you identify as the greatest challenges in meeting the needs of
the advanced learners in your classroom?
Talk about how you differentiate instruction for the advanced learners in
your classroom.
Additional follow up questions.
Principal Talk about parent satisfaction and involvement at your site.
What are you looking for as you observe in classrooms?
When initially implementing the RtI framework, how did you “sell” the
staff as to its merits?
How has the PST process changed conversations among staff at your
site?
How does the PST process differ for high ability learners versus
struggling learners?
Describe the greatest challenges in using this process to identify the
needs of advanced learners?
What do you identify as the greatest promise in using PST data to serve
the needs of advanced learners?
What is your greatest celebration as the leader of this school?
PST How has the PST process changed conversations among staff at your
site?
How does the PST process differ for high ability learners versus
struggling learners?
Describe the greatest challenges in using this process to identify the
needs of advanced learners?
What do you identify as the greatest promise in using PST data to serve
the needs of advanced learners?
Focus Group Talk about how the RtI framework has changed conversations about
students at this school.
Describe how the staff at this school approaches meeting the needs of all
learners.
How has the environment established by leadership guided the staff in
moving through the challenges of using this process to meet the needs of
high potential learners
Talk about how the collaborative nature of this staff allows for the
process to be strength-based and appropriate for meeting the needs of
high potential learners.
What additional thoughts and ideas do you want to be sure I capture?

14
__________________________________________________________________________________
Vol. 9, No. 2 Summer 2012 AASA Journal of Scholarship and Practice
Data Analysis Procedures The main units of analysis in this study were
observation and interview data. Forms used
during classroom and problem-solving team
observations and excerpts from recorded
interviews of the teachers, principal, and a
focus group documented best practices in
implementing and using the RtI framework
(Coleman & Hughes, 2009; Colorado
Department of Education, 2008).
The data gathered were analyzed to
determine global patterns and themes. Matrices
capturing the emergent patterns and elements
were designed to aggregate and analyze the
collective data. Patterns in the use of common
terminology, classroom practices, instructional
strategies, and data to inform instruction were
captured via observation and interview data
matrices. Common terms were highlighted and
elements of contrast or uniqueness were noted
for further exploration.
Findings While the findings of a single case study aren’t
generalizable, using the RtI framework to
address the potential of all learners holds great
promise. Several key factors emerged:
leadership support,
knowledge of the RtI
framework,
relationships and collaboration,
and
family and community
partnerships.
The principal, problem-solving team
(PST) members, teachers, and focus group
participants provided insights into the school’s
effective use of the RtI framework. Their
depiction of the day-to-day realities in meeting
the needs of all learners provided rich details as
to why this site has been so successful in
implementing and using the framework to
support the needs of a full continuum of
students.
Leadership It was clear in the case of this successful school
that an administrator’s philosophy promoting
collaborative problem solving is essential to the
RtI framework. Staff members were
empowered to share in decisions that affected
their ability to serve the learners effectively
throughout the school. Further evidence of the
importance of administrators for effective
implementation was a focus on structure and
process. The school’s meeting schedule was
adjusted to provide time for teams to meet
weekly and for the PST to meet three or four
times per month.
With support from the principal and the
leadership team, classroom teachers held high
expectations for all learners, from those who
struggled to those who were most advanced.
Rather than cutting programming and services
for gifted learners, the principal put the
personnel, structures, and support in place to
enhance them.
Clearly, the environment established by
the building administrator guided the staff in
moving through the challenges of using this
process to meet the needs of high potential
learners. In the words of the principal, “It (RtI)
has really become that whole team approach to
talking about what kids need. It’s not based on
any type of a label or any type of identification.
RtI is everybody.”
Knowledge of RtI Framework Using a convergence of data to inform next
steps for student success was a required
practice established by the principal at the onset
of the RtI implementation process. The team’s
ability to articulate how they use and interpret
data was a clear indicator of their deep

15
__________________________________________________________________________________
Vol. 9, No. 2 Summer 2012 AASA Journal of Scholarship and Practice
knowledge of the RtI process, specifically with
respect to progress monitoring. In terms of
student engagement, staff used multiple data
points, including knowing the strengths of the
learner and adjusting instruction accordingly,
as the means for tapping into potential.
While many examples were shared, this
statement was representative of the collective
responses of the participants, “We look at the
individual child. We look at the students and
their strengths, their needs–whatever that is –
and we address those specific needs.” The
framework provided the PST with the structure
for a data-driven, collaborative problem-
solving process to discuss students’ needs.
Relationships and Collaboration Problem-solving team participants talked at
length about the importance of relationships
and collaboration. The principal and members
of the leadership team felt the RtI process was
predicated on effective collaboration among all
staff.
Examples provided by respondents
included an overall openness in sharing of
strategies with grade level and PST members,
willingness to seek out expertise and
suggestions from the various specialists in the
building, collaborative problem solving, and
idea sharing at the PST meetings. The principal
not only supported this process by providing
dedicated time for collaborative dialog, but
held the staff to high expectations regarding
outcomes of the PST process.
The message from building leaders was
clear: we discuss all students whose needs
aren’t being met. While the process did not
hinge upon staff members “liking” one another,
it was strengthened by a mutual respect for the
expertise each member brought to the table, as
well as a shared interest in ensuring the best
possible outcomes for all learners.
Family and Community Partnerships During the interview with the principal, the
importance of a strong relationship with
families and the community was emphasized;
family and community involvement was cited
as a core value. He spoke at length about the
partnerships teachers build with families and
the good will established by those relationships.
The partnership begins at the time of
enrollment, forging a positive relationship from
the onset. When parents express concerns about
their child’s progress, they learn about the RtI
process, appropriate interventions, and
programming opportunities provided based on
their child’s needs. The PST facilitator reported
that parents were partners from the beginning
of the process and were valued members of the
collaborative team.
Recommendations What do the results of this study mean for
school administrators? How can we broaden
our thinking to expand the way we use the RtI
framework in our schools? The ultimate goal is
to provide administrators, leadership teams, and
school personnel the tools to more effectively
meet the needs of all learners, including
students who demonstrate high potential. Test
scores alone do not provide the data necessary
to inform teachers of needed changes in
instructional practices.
In this case study I explored one
school’s processes in embedding the RtI
framework school wide. The lessons learned
may help school administrators consider ways
to improve practices at schools with the
essential RtI components in place.

16
__________________________________________________________________________________
Vol. 9, No. 2 Summer 2012 AASA Journal of Scholarship and Practice
Effective implementation at the study
site was directly attributed to strong
administrator support, a committed staff, and
an understanding of the components of the RtI
process. To ensure success within the RtI
approach, it seems that unflagging commitment
to ensuring growth for all students is non-
negotiable.
The connection of professional
development to fidelity of implementation,
effective instruction and intervention, and
ultimately positive student outcomes are
important components, and are highlighted
throughout the literature (Kratochwill,
Volpiansky, Clements & Ball, 2007; Danielson,
Doolittle, & Bradley, 2007; Shinn, 2007).
Ongoing, targeted professional
development is required to ensure effective use
of the framework as a potential-based model:
recognizing potential in
ethnically diverse and lower
SES students;
gaining knowledge of
appropriate instructional
strategies for use with high
potential learners; and
building a body of data to
inform programming for high
potential learners.
When school administrators provide
professional development for teachers and
support staff in these areas, unless the
structures for collaboration are embedded in the
school’s schedule, curriculum, instruction, and
assessment, the practices will not prove to be
sustainable (Kratochwill et al., 2007).
A shift in thinking is needed for school
administrators, teachers, parents, and the
community to nurture the potential of all
learners by incorporating the RtI framework
more broadly and giving all students what they
need, when they need it. In most schools and
districts RtI is, in practice, a deficit-based
model used as a means for identifying students
with a specific learning disability. At the study
site the framework was not only used to
identify and respond to the needs of struggling
learners, but also to support teachers in
providing high-potential learners with depth
and complexity, monitoring the progress of the
learner’s response to more challenging work,
and using multiple data points to inform next
steps.
This process, supported through the
tangible actions of school administrators,
moves practitioners from a static identification
process with an associated label or
classification to a “potential-based model” that
seeks and nurtures the potential in all learners.
Programming is not predicated through
identification for a specific program; rather, it
is provided based on the student’s strengths and
needs. Certainly, the findings of this study
alone, while promising, do not provide
definitive conclusions regarding the utility of
RtI framework in supporting a full continuum
of learners; however, they provide a template
from which to start.
Author Biography
Robin Carey received her doctoral degree in educational administration from the University of
Denver and a master’s degree in gifted education from the University of Northern Colorado. She is the
director of educational programming and services in the Douglas County School District in Castle
Rock, Colorado. E-mail: [email protected]

17
__________________________________________________________________________________
Vol. 9, No. 2 Summer 2012 AASA Journal of Scholarship and Practice
References
Burns, M. K., Jacob, S., & Wagner, A. R. (2008). Ethical and legal issues associated with using
response-to-intervention to assess learning disabilities. Journal of School Psychology, 46(3),
263-279.
Colangelo, N. & Davis, G. A. (2003). Handbook of gifted education (3rd
ed.). Boston: Allyn and
Bacon.
Coleman, M. R, & Hughes, C. E. (2009). Meeting the needs of gifted students within an RtI
framework. Gifted Child Today, 32(3), 14-17.
Colorado Department of Education. (2008). Response to intervention (RtI): A practitioner's guide to
implementation. Denver, CO: Colorado Department of Education.
Danielson, L., Doolittle, J., & Bradley, R. (2007). Professional development, capacity building, and
research needs: Critical issues for response to intervention implementation. School Psychology
Review, 36(4), 632-637.
Delcourt, M.A., Cornell, D.G., Goldberg, M.D. (2007). Cognitive and affective learning outcomes of
gifted elementary students. The Gifted Child Quarterly, 51(4), 359-381.
Donovan, M.S., & Cross, C.T. (Eds.). (2002). Minority students in special and gifted education.
Washington, DC: National Academy Press.
Fletcher, J. M., Coulter, W. A., Reschly, D. J., & Vaughn, S. (2004). Alternative approaches to the
definition and identification of learning disabilities: Some questions and answers. Annals of
Dyslexia, 54(2), 304-331.
Kratochwill, T. R., Volpiansky, P., Clements, M., & Ball, C. (2007). Professional development in
implementing and sustaining multitier prevention models: Implications for response to
intervention. School Psychology Review, 36(4), 618-631.
National Association of Gifted Children. (2008). Student identification standards introduction.
Retrieved from http://www.nagc.org/ index.aspx?id=574
Passow, A., & Frasier, M. (1996). Toward improving identification of talent potential among minority
and disadvantaged students. Roeper Review, 18(3), 198.
Ritchhart, R. (2002). Intellectual character: What it is, why it matters, and how to get it. San
Francisco: Jossey-Bass.
Shinn, M. R. (2007). Identifying students at risk, monitoring performance and determining eligibility
within response to intervention: Research on educational need and benefit from academic
intervention. School Psychology Review, 36(4), 601-617.

18
__________________________________________________________________________________
Vol. 9, No. 2 Summer 2012 AASA Journal of Scholarship and Practice
Research Article_________________________________________________________________
The Influence of Teachers’ Preexisting Notions about Students on
Scholastic Achievement
Concetta Pirrone, PhD
Department of Educational Processes
University of Catania
Catania, IT
Abstract This paper examines teachers' preexisting notion of the “weak” academic student, and the
characteristics implicit in that stereotype. Extant literature demonstrates how the teacher’s
dichotomous conceptions of “strong” and “weak” academic students are predictive of scholastic
success. The goal of this study was to demonstrate how teachers' implicit assumptions of students'
scholastic failure become transformed into concrete attributions when the teachers are asked to explain
students in a failure situation. Invited to complete a questionnaire assessing the potential causes of their
students’ scholastic failures were 370 teachers. Results show how teachers’ conceptions of students as
either “strong” or “weak” academically creates a “cognitive brake” on student scholastic achievement.
Key Words
teacher expectations, student achievement, student learning

19
__________________________________________________________________________________
Vol. 9, No. 2 Summer 2012 AASA Journal of Scholarship and Practice
Learning disabilities represent a category of
various learning challenges that students can
face during their school years (Landi, 1998).
The term learning disability suggests cognitive
problems that can potentially delay the
acquisition of skills and knowledge (Vio &
Tressoldi, 2007).
Together with socio-pathological
problems (i.e., social factors impacting
learning), learning disabilities are among the
chief factors implicated in scholastic struggle
and failure. Cornoldi (2007) emphasized how
academic failure can be tied to factors that
contribute to the development of students’
negative self-image and a critical attitude
towards school.
In this study I considered another factor,
sometimes related to learning disabilities that
can influence scholastic achievement: The
conceptions that teachers have about their
students’ academic strengths and weaknesses
and how those conceptions can influence
student achievement. When a teacher views a
student as a weak academic student, that view
can influence the student’s achievement in that
teacher’s class and sometimes beyond.
Literature In a study about teachers' perceptions of
students’ excuses for academic difficulties (i.e.,
Tollefson, et al., 1991), 97 teachers described
situations in which their students experienced
academic difficulties. The students of the
teachers provided reasons to explain their
difficulties and the teachers indicated whether
they believed the reasons students gave and
what they thought were the real reasons for the
students’ difficulties.
The teachers also explained how they
reacted and behaved toward the students. A
qualitative analysis of the teachers’ reports
indicated that students were most likely to
attribute their academic difficulties to external,
uncontrollable factors, whereas teachers tended
to believe that the ”real” reasons for students’
difficulties were internal and controllable by
the student. That is, the students described an
external locus of control whereas the teachers
described the issue as being one related to
internal locus of control.
Matteucci and Gosling (2004) studied
French and Italian teachers and examined the
influence of teachers’ causal attribution of
failure on the their judgments of responsibility
compared to teachers who believed that failure
was due to a lack of innate skills on the part of
the student.
The results suggested that when
teachers attributed failure to the lack of student
“effort” they demonstrated a less positive view
of the student than when they attributed failure
due to the lack of innate skills or external
factors outside the control of the student. The
teachers continued to view the students in these
ways throughout the school year regardless of
changes in the students’ academic achievement.
In a subsequent study, Matteucci et al.
(2008), asked the teachers to rate unknown
pupils, based on their grades and their answers
given to a questionnaire regarding locus of
control (i.e., internal (in terms of effort) and
external).
Findings showed that students who gave
“internal” answers in terms of effort had better
grades, including the basis for a more
optimistic future, and were rated higher by the
teachers in the study. Teachers viewed students
more favourably if the teachers believed the
student responses indicate that the students
were motivated to succeed.

20
__________________________________________________________________________________
Vol. 9, No. 2 Summer 2012 AASA Journal of Scholarship and Practice
Methodology My goal for this study was to test the theory
that teachers who have implicit notions about
why students fail transform them into explicit
and concrete notions when they are asked to
provide a “personalized picture” of specific
students in a scholastic failure situation.
Sample The sample consisted of 370 teachers; 200 from
elementary school and 170 from primary
school. The majority of the teachers, 87.3%
were women and 12.7% were men with an
average age of the total sample of 43.66 (SD 8.
76).
The teachers who collaborated at the
research teach in schools located Sicily,
province of Catania, Italy, on the east coast of
the island, near Mount Etna. The average years
of teaching experience for the sample was
16.00 years ago (SD 9, 14). Elementary school
teachers taught for an average of 14.50 years,
whereas primary school teachers had an
average of 19.59 (SD 9, 56) years of
experience.
Data Collection I asked the participants to complete two
questionnaires. Prior to completing the
questionnaires, participants attended a research
presentation to learn more information about
the purpose of the study and to receive answers
to questions about the study.
I used two questionnaires that Rousvoal
(1987) used in a study similar to mine (i.e., the
relationship between teachers’ representation of
the “bad” student and scholastic integration and
performance.). The survey items pertained to
various causes of scholastic failure (e.g.,
psychological disturbances, programs unfit for
the student, teaching methodology, etc.). The
reliability estimates from Rousvoals’
instrument were within acceptable limits. I
conducted a factor analysis to test the reliability
of my results.
The first questionnaire asked teachers to
think about the concept of scholastic failure in
general terms (“general failure”). The second
questionnaire contained the same items, but
asked teachers to specifically think about three
recent students who failed their courses or
failed the most recent marking period (“specific
failure”).
Both instruments contained 17 items
and used a Likert-type response style, ranging
from a value of zero (no influence on failure) to
a value of four (determining influence on
failure). I asked the participants to provide only
one score for each item on the first
questionnaire because they were to think about
failure in general terms. Then I asked the
participants to provide a response for each of
their three specific students on every question
on the second questionnaire; three responses
per question
Data Analysis and Results Preliminary factor analyses of the
questionnaire on general failure
I performed a factor analysis to determine the
internal validity of the questionnaires. For the
first instrument (“general” failure), the analysis
of the main components, with Varimax
rotation, identified five factors that explained
14.99%, 13.18%, 12.94%, 12.45 %, and 9.57%
of the total variance (63.13%) respectively (See
Table 1).
Factor 1: The highest contributions were
found to be related to variables:
(a) deprived cultural environment (.80),
(b) negative family atmosphere (.76),

21
__________________________________________________________________________________
Vol. 9, No. 2 Summer 2012 AASA Journal of Scholarship and Practice
(c) psycho-affective disorders (.71),
(d) behaviors disturbances (.59) and to a
lesser extent,
(e) immaturity (.42).
The first factor portrays a student whose
failure is originated from social cultural and
affective factors. In this way, the student’s
difficulties are thought to be related to the
family environment, which apart from creating
a socio/cultural deficit, generates affective
immaturity and behavior disturbances. This
first factor was labeled “affective/familiar
deficit” (.78).
Factor 2: The highest contributions were
relative to the variables:
(a) father’s profession (.91),
(b) mother’s profession (.90), and
(c) material condition of life (socio-
economic status) (.62).
This second factor depicts a student
whose failure is related by the home
environment as defined by the parents’
profession together with low socio-economic
status. This second factor was labeled
“socio/economic deficit” (.79).
Factor 3: The highest contributions were
relative to variables:
(a) lack of will (.85),
(b) lack of interest in school (.77), and
(c) intellectual deficiencies (.51).
This third factor is represented by
internal factors related to the student’s
perceived lack of motivation, disinterest in
scholastic life, unwillingness to study, and
cognitive limitations. This third factor was
labeled “motivational deficit” (.76).
Factor 4: The highest contributions were
relative to variables:
(a) psychomotor delay (.81),
(b) physiological deficit (.80),
(c) language delay (.56), and
(d) cognitive impairments (.42).
This fourth factor refers to a student
whose failure is due to some biological or
genetic deficit, manifested by motor and
language problems. This fourth factor was
labeled “bio/psychological deficit” (.73).
Factor 5: The highest contributions
were relative to:
(a) poorly adapted curricular programs
or tracks (.73),
(b) structure of the school (.68), and
(c) teaching method (.54).
This fifth factor illustrates a student
whose scholastic failure is related to the
academic institution (e.g., poorly-adapted
curriculum and/or programs, teaching
methodology unsuited for certain students).
This fifth factor was labeled “scholastic
institution deficit” (.43).

22
__________________________________________________________________________________
Vol. 9, No. 2 Summer 2012 AASA Journal of Scholarship and Practice
Table 1
Five Factors Solution: Matrix of the Factorial Saturations after Varimax Rotation
Explained Variance of the rotated components (absolute and percentage value)
1 2 3 4 5
14.99 13.18 12.94 12.45 9.57
2.54 2.24 2.20 2.11 1.62
Deprived cultural
environment
.80 .18 -.00 .06 .04
Negative family
atmosphere
.76 .16 .08 .17 .08
Psycho- affective
disorders
.71 .05 .31 .18 .03
Behaviours
disturbances
.59 -.03 .46 .20 .03
Father’s profession .05 .91 .02 -.01 .00
Mother’s profession .07 .90 .04 .05 .06
Socio-economic
status
.29 .62 -.01 .11 .02
Lack of will .13 .03 .85 .03 .16
Lack of interest in
school
.16 -.02 .77 .21 .16
Intellectual
deficiencies
.23 .15 .51 .42 -.03
Psychomotor delay .11 -.04 .18 .81 -.02
Physiological deficit .13 .11 .00 .80 .14
Language delay .21 .06 .30 .56 .18
Inappropriate
curriculum programs
.03 .05 .15 .06 .73
School structure .03 .07 -.21 .35 .68
Teaching method .04 -.05 .18 -.04 .54
Affective immaturity .42 .29 .19 .05 .43
In a second factor analyses, the same
factors were identified, but ordered differently
based on teachers’ responses about reasons for
failure of specific students. The analysis
explained 68.53% of the total variance (See
Table 2).
Factor 1: The strongest contributions
were:
(a) psycho-affective disorders (.80),
(b) behavior disturbances (.74),
(c) affective immaturity (.71), and
(d) negative family atmosphere.

23
__________________________________________________________________________________
Vol. 9, No. 2 Summer 2012 AASA Journal of Scholarship and Practice
I called this factor “affective/familiar
deficit” (.79).
Factor 2: The strongest contributions
were:
(a) cognitive impairments (.69) and
language delay (.72),
(b) psychomotor delay (.79), and
(c) physiological deficit (.66).
This second factor (similarly to the
fourth factor for general failure) was called
bio/psychological deficit” (.81).
Factor 3: The strongest contributions
were:
(a) father’s profession (.84),
(b) mother’s profession (.79),
(c) socio-economic status (.68), and
(d) deprived cultural environment (.50).
I called this factor “socio/economic
deficit” (.76).
Factor 4: The strongest contributions
were:
(a) poorly adapted curricular programs
(.80),
(b) structure of the school (.78), and
(c) teaching method (.65).
This forth factor was called “scholastic
institution deficit” (.76).
Factor 5: The strongest contributions
were:
(a) lack of will (.99), and
(b) lack of interest in school (.90).
This fifth factor was called “motiva-
tional deficit” (.85).

24
__________________________________________________________________________________
Vol. 9, No. 2 Summer 2012 AASA Journal of Scholarship and Practice
Table 2
Five Factors (F) Solution - Matrix of the Factorial Saturations after Varimax Rotation
Explained Variance of the rotated components (absolute and percentage value)
F1 F2 F3 F4 F5
15.62 14.74 13.70 13.22 11.25
2.65 2.50 2.33 2.24 1.91
Psycho- affective
disorders
.80 .26 .08 .04 .07
Behaviours
disturbances
.74 .26 .06 .12 .26
Affective
immaturity
.71 .11 .16 .20 .05
Negative family
atmosphere
.61 -.01 .31 .21 .23
Psychomotor delay .18 .79 .00 .33 -.02
Language delay .06 .72 .19 .29 .18
Intellectual
deficiencies
.24 .69 .09 -.02 .15
Physiological deficit .17 .66 .16 .43 -.08
Father’s profession .06 .00 .84 .03 .04
Mother’s profession .06 .14 .79 .08 .00
Socio-economic
status
.29 .13 .68 .10 -.03
Deprived cultural
environment
.43 .12 .50 .19 .21
Inappropriate
ministerial programs
.22 .12 .08 .80 .14
School structure .17 .22 .11 .77 -.09
Teaching method .06 .36 .10 .65 .18
Lack of will .19 .06 .03 -.00 .99
Lack of interest in
school
.19 .10 .03 .14 .88
The analyses confirmed the reliability of
the questionnaire, and the two factorial
analyses indicated the presence of five factors
for each questionnaire that the teachers used as
reasons to explain scholastic failure.
Secondary Analysis The first goal of the secondary analyses was to
verify if the independent variables (i.e. school
degree, years of teaching and type of school
where the teachers worked) had an influence

25
__________________________________________________________________________________
Vol. 9, No. 2 Summer 2012 AASA Journal of Scholarship and Practice
over the scores obtained on the 17-item
surveyed.
The findings indicated:
(a) Teachers with a university degree
gave more importance to the “student’s
lack of interest in school” as a factor for
school failure compared to teachers
with only a high school diploma (high-
school diploma: M 3.19, SD .19;
university degree: M 3.36, SD .77; t .-
2.87; p<.05); and
(b) Teachers with a university degree
gave more importance to the “student’s
lack of will” as a factor for school
failure compared to teachers with a high
school diploma (high-school diploma:
M 2.93, SD .92; university degree M
3.13, SD .83, t -2.14, p<.05).
The teachers with high school diploma
gave more importance to the “student’s
language delay” as a factor for school failure
compared to teachers with a university degree
(high school diploma: M 1.87, SD 1.31;
university degree: M 1.57, SD 1.23, t 2.19,
p<.005). Similarly, teachers with a high school
diploma gave more importance to the
“student’s intellectual deficiencies” as a factor
for school failure compared to teachers with a
university degree (high school diploma: m 2.60,
SD 1.04; university degree: M 2.34, SD 1.08, t -
1.88, p<.05).
I used an ANOVA to determine the
influence that “number of years teaching” had
on the respondents’ answers to the survey. This
analysis revealed that teachers with 30 or more
years experience attributed failure more to the
“student’s affective immaturity” (F= 2.88,
p<.05) whereas, those who have taught for 10
years or less give more value to the “student’s
negative family atmosphere” (F= 2.68, p<.05)
and to the “mother’s profession” (F= 2.90,
p<.05) in terms of factors that contribute to
student failure.
Furthermore, the results suggest
teachers’ attributions of the various causes of
failure change when asked to explain the
factors of failure for students they know
personally compared to when teachers describe
failing students in general. Teachers attribute
failure to factors controlled by the student (i.e.,
laziness) when asked to explain general factors
that lead to failure. However, they attribute
factors that are more outside the control of the
student (i.e. poverty, cognitive disability, lack
of resources) when asked to explain cause of
failure for specific students.
It is as if the teachers are less involved
in the judgment process about failure when
they are asked to describe the general factors
that contribute to failure. They revert to
established descriptions of student laziness,
lack of motivation, or lack of drive to improve
one’s own situation.
The personalization of failure to specific
students causes teachers to be more careful in
giving an explanation for failure. The teacher
finds himself in an uncomfortable situation
because he must now think about specific
students—his students. There is a change in the
teacher’s psychological perspective. When he
must consider specific students, the teacher
feels more compelled to be able to justify his
evaluation that he makes of his students’
performances, assuming in a way some part of
the responsibility for that evaluation.
However, the teacher’s attribution of the
students’ failures seems to become fixed. That
is, once the teacher attributes specific factors of
failure to specific students, the teacher

26
__________________________________________________________________________________
Vol. 9, No. 2 Summer 2012 AASA Journal of Scholarship and Practice
continues to view the student through the lens
of those specific factors. This finding helps to
explain why teachers continue to view and
describe some students as “weak students.”
Limitations This study has some limitations that need to be
considered in any attempt to generalize the
findings and therefore further investigation is
needed. First and foremost the sample should
be expanded to a wider range of subjects:
Sicily is the poorest province of Italy. It has the
highest level of poverty and unemployment. It
has a distinctive and peculiar culture, different
from the north of the country.
Therefore the sample is not
representative of the country. A further
limitation of this study is of a methodological
nature, regarding the limits of the survey
instrument and quantitative methods in general.
A qualitative method could better describe the
various differences among unsuccessful
students and paint a more personalized picture
of failure.
A qualitative approach could better
describe why a specific group of teachers
choose the “motivational deficit” to describe
student failure while another group chooses the
socio/economic deficit. Qualitative methods
could provide information about what teachers
draw upon to formulate their own opinion?
This type of investigation, to carry out using
qualitative methods, could represent a further
area of inquiry useful in making this process
clearer leading to the formulation of the
different characteristics involved.
Conclusions First, the results of this study demonstrate that
the teachers’ degree status influences the
beliefs communicated by teachers in this
sample. In fact, teachers with a university
degree who work in middle schools hold the
belief that general scholastic failure is based on
internal factors related to the student, such as
student lack of will and loss of interest in
school. Teachers with a high school diploma
attribute general reasons for failure to
uncontrollable internal student factors, such as
cognitive disabilities or other issues outside the
control of the student that influence learning.
This result is in line with past literature
(e.g., Tetlock; 1980, Beckers, 1995; Kaszap,
1996) in that the most qualified teachers have a
tendency to consider the student as being in
control of his or her learning. On the other
hand, with lesser levels of preparation, teachers
might err on the side of attributing failure to
uncontrollable factors due to issues related to
their own professional status and sense of
pedagogical mastery (e.g., uncertainties about
making a scholastic impact with struggling
students).
Results from previous studies (i.e.,
Bouchama, 2002) suggest that the teacher’s
experience in terms of years of teaching has no
influence over the kind of attribution the
teacher assumes for the failure of students. The
results contradict previous finding because they
suggest that teachers who have taught for only
a few years attribute student failure to both
internal and external causes, whereas those who
have taught for many years attribute failure to
factors controllable by the student such as
motivation.
The results also suggest that the label of
“weak student,” once attributed, becomes
difficult to disassociate from the pupil. Medin
and Ortony (1989) explain that this is due to
psychological essentialism.
This confirms that the teachers do not
tend to make decisions about the factors for

27
__________________________________________________________________________________
Vol. 9, No. 2 Summer 2012 AASA Journal of Scholarship and Practice
student failure based on data or information
from the outside world. They rely more on an
initial personal evaluation of a student. This
reflects the principle of cognitive economy:
individuals tend to not abandon their starting
hypothesis after having formulated an opinion
(Nisbett & Ross, 1989). Teachers tend to not
update the information coming daily about the
student. In many cases they continue to
perpetuate the stereotypes of failing students.
Author Biography
Concetta Pirrone is a researcher in general psychology in the Department of Educational
Processes at the University of Catania, Sicily, Italy where she teaches several courses in the area of
psychology. E-mail: [email protected]

28
__________________________________________________________________________________
Vol. 9, No. 2 Summer 2012 AASA Journal of Scholarship and Practice
References
Beckers, J. (1995). Les futurs enseignants se sentent-ils une responsabilité vis-à-vis de l’échec
scolaire? Éducation et recherche. Théorie et pratique, 17(3), 334-349.
Cornoldi, C. (2007). Difficoltà e disturbi dell’apprendimento [Difficulties and learning disabilities].
Bologna: Il Mulino.
Kaszap, M. (1996). Perception des exigences de la réussite scolaire au Cégep. Domaine cognitif,
affectif, créatif, gestion, communication. Une comparaison professeurs élèves. Une adéquation
possible avec les résultats scolaire. Rapport de recherche présenté au Programme d’aide à la
recherche et à l’apprentissage. Quebec : Ministère de l’Education.
Landi, L. (1998). La scuola senza pareti. Come cambia la didattica nell’era telematica, in Atti del
convegno [The school without walls. How to change the teaching in electronic age.
Proceedings of the conference]. NIR-IT ’98 (CNR, Milan 13-14-15 January 1998), CD-ROM
n.10 di PC Interactive, Milan, e Quipo Web, 1998 (1), 14-20.
Matteucci, M. C., Tomasetto, C., Selleri, P., Carugati F. (2008). Teacher judgments and pupils’ causal
explanations: Social valorization of effort-based explanations in school context, European
Journal of Psychology of Education, 23(4), 421-432.
Matteucci, M.C., & Gosling, P. (2004). Italian and French teachers faced with pupil’s academic
failure: The norm of effort. European Journal of Psychology of Education, 19(2), 147–166.
Medin, D. L., & Ortony, A. (1989). Psychological essentialism. In S. Vosniadou and A. Ortony (Eds.),
Similarity and analogical reasoning (pp. 179-195). New York: Cambridge University.
Nisbett, R., & Ross L. (1980). Human inference: Strategies and shortcomings of social judgment,
Englewood Cliffs, N.J.: Prentice-Hall.
Rousvoal, J. (1987). Les représentations de l’enfant au cours préparatoire. Leurs rapports avec la r
éussite ou l’échec scolaire. Revue Française de Pédagogie, 79, 15-34.
Tetlock, P. E. (1980). Explaining teacher explanation of pupils. A self presentation interpretation,
Social Psychology Quarterly, 43(3), 283-290.
Tollefson, N., Hsia, S., & Townsend, J. (1991). Teachers' perceptions of students' excuses for
academic difficulties. Psychology in the Schools, 28 (2) 146-155.
Vio C., & Tressoldi P. E. (2007). Commento alle proposte di legge a favore delle “difficoltà specifiche
di apprendimento” [Comments on the proposed legislation in favor of “specific learning
difficulties”] Psicologia dell’Educazione, 1(2), 195-210.

29
__________________________________________________________________________________
Vol. 9, No. 2 Summer 2012 AASA Journal of Scholarship and Practice
Book Review________________________________________________________________________
College and Career Ready in the 21st Century: Making High School Matter
by James R. Stone, III and Morgan V. Lewis
Reviewed by:
Michael Ian Cohen, EdD
Supervisor of Language Arts, K-12
Tenafly Public Schools
Tenafly, NJ
“Even your grandfather was better than a
carpenter,” Willy Loman lashes out at his son,
Biff, near the end of the first act of Arthur
Miller’s Death of a Salesman (p. 44). Through
the character of Willy and his tragic fall, Miller
illustrates the American obsession with
prestigious careers and a condescending
attitude toward manual work.
As I read College and Career Ready in
the 21st Century: Making High School Matter,
by James R. Stone, III and Morgan V. Lewis, I
thought about the wisdom of Miller’s 1949
classic and how it applies to contemporary
education. There is tremendous danger in
recognizing only one pathway to a life of
satisfaction, purpose, and productivity.
Indeed, Stone and Lewis, two nationally
regarded experts in career and technical
education (CTE), argue convincingly that the
“college-for-all mantra” (p. 30) and persistent
calls for more rigorous academic standards in
high school ignore the needs of more than half
of our country’s secondary-level students.
“The real challenge facing high school
education,” the authors argue, “is not to
increase the rigor of what is taught but to
provide a more appropriate curriculum for
those who find the typical academic class
boring and frustrating” (p. 6).
Simply mandating more discipline-
centered course work and standardizing the
pathway through high school will only raise the
likelihood that our disengaged students will
drop out. It is worth noting here that almost
100 years ago, The Cardinal Principles of
Secondary Education (US Department of
Interior, 1918) recognized the same needs: a
more diversified curriculum and opportunities
for students to explore vocations.
Because higher academic standards and
the testing and accountability regimes of the
last three decades have not solved our dropout
problem or raised our students’ math and
reading scores significantly, Stone and Lewis
offer CTE as a promising way to engage many
students and prepare them for employment and
post-secondary education. The authors refer to
several quantitative studies to demonstrate that,
for students who are not engaged by traditional
academic coursework, taking CTE courses—
especially with a specific concentration or
focus—has been associated with a higher
likelihood of graduating from high school.
Furthermore, in several recent studies
using regression models, CTE coursework has
been shown to lead to higher wages in the
world beyond school.

30
__________________________________________________________________________________
Vol. 9, No. 2 Summer 2012 AASA Journal of Scholarship and Practice
Stone and Lewis are careful to note that
the quality of the CTE matters, and they focus
much of their book on explaining what
effective CTE looks like. For readers who are
school administrators or CTE teachers, this is
perhaps the most helpful part of the book.
Two important themes emerge clearly
from descriptions of experimental studies: CTE
teachers and academic teachers need time and
systems to collaborate with each other, and
CTE should not be considered a substitute for
academics—rather, it should “maximize the
academics” (p. 107).
Curricular integration, then, is the key
to academically-enhanced CTE. After all, the
landmark Eight-Year Study, (Aikin, 1942)
launched by progressive educators in the 1930s,
had already demonstrated the success of
experimental pedagogical approaches that
made high school course work more relevant
and meaningful for a diverse array of students.
When curriculum is truly integrated,
CTE offers opportunities to teach subjects like
math, reading, and science in relevant and
engaging contexts. Stone and Lewis report on
several experimental studies and provide
anecdotal accounts that demonstrate the
efficacy of such instruction.
The studies and anecdotes began with
professional development and/or collaborative
design of lesson plans. In each example, the
CTE teachers worked with academic teachers
to identify the academic concepts inherent in
their curricula and then learned how to teach
those concepts within the context of
occupational studies. Research-based reading
strategies such as Forget’s MAX teaching were
used to enhance students’ reading
comprehension of dense passages from
occupational texts like the National Electrical
Code.
A carpentry class was enhanced by the
addition of sophisticated mathematical
concepts that appear on the ACT. CTE
teachers in an agriculture program worked with
chemistry teachers to approach the topic of pH
and created an opportunity to teach the concept
of ions and how logarithms might be applied.
Crucially, in the authors’ examples, the CTE
teachers are the ones teaching the academics;
they learn how to do so after working closely
with their academic colleagues.
Furthermore, the benefits are
bidirectional: CTE teachers raise the rigor of
their programs by teaching academics in
occupational contexts that match students’
interests, and academic teachers who work with
their CTE colleagues find new, relevant ways
to teach core concepts in their own traditional
courses.
Although the possibilities of CTE are
inspiring, Stone and Lewis point out that
American public education is grossly under-
developed in its career counseling and fails to
capitalize on more than 100 years of
psychology scholarship, which substantiates the
importance of career exploration during the
adolescent years. In addition to more intensive
career guidance, adequate funding is needed to
support the kinds of reforms that the authors
advocate.
Stone and Lewis review a list of
impressive policy initiatives such as the
School-to-Work Opportunities Act of 1994, but
they show that the funding has never been
enough to support lasting change. On a more
local level, the authors claim that the current
structure of school schedules and financing
must be modified in order to create
opportunities for the professional collaboration
that is the sine qua non of academically-
enhanced CTE.
31
__________________________________________________________________________________
Vol. 9, No. 2 Summer 2012 AASA Journal of Scholarship and Practice
Rich with data, Stone and Lewis’s text
is a bit dense and somewhat meandering in its
middle chapters, but their descriptions of
sophisticated experimental studies are framed
by an argument that is bold and engaging
overall—especially for educators who want to
make high school more meaningful for the
average student.
To the radical critics—the likes of
Apple or Giroux—who would say that CTE is a
form of tracking and only perpetuates class
inequalities, the authors have an
unapologetically pragmatic and compelling
response: “This is a more just track than the
one imposed by the default dropout track” (p.
165).
Reviewer biography
Michael Cohen is supervisor of the language arts program, grades K-12, for the Tenafly Public
Schools in Tenafly, NJ. E-mail: [email protected]
Written by James R. Stone, III and Morgan V. Lewis, College and Career Ready in the 21st Century:
Making High School Matter is published by Teachers College Press, NY, NY; 224 pages, softcover,
$31.95

32
__________________________________________________________________________________
Vol. 9, No. 2 Summer 2012 AASA Journal of Scholarship and Practice
References
Aikin, W. M. (1942). The story of the eight-year study. New York: Harper.
Miller, A. (1998). Death of a salesman. New York, NY: Penguin Books.
Department of the Interior. Bureau of Education. Bulletin, 1918, No. 35. Cardinal Principles of
Secondary Education. A Report of the Commission on the Reorganization of Secondary
Education, appointed by the National Education Association. United States, Government
Printing Office, Washington, 1928. Retrieved from http://tmh.floonet.net/articles/cardprin.html

33
__________________________________________________________________________________
Vol. 9, No. 2 Summer 2012 AASA Journal of Scholarship and Practice
Book Review_______________________________________________________________________
The Flat World and Education: How America’s Commitment to Equity
Will Determine Our Future by Linda Darling-Hammond
Reviewed by:
Art Stellar, PhD
Hingham, MA
Linda Darling-Hammond’s opinions are
valued by some in the education policy-making
community. She is one of the most influential
spokespeople for more progressive education
policy over the last decade. She lead President
Obama’s education transition team; her ideas at
the time about how to move past the policies of
No Child Left Behind could have helped to
transform public education had only the
administration listened. Her credentials include
research and service on high profile task forces.
She maintains connections with schools and
states related to educational practices and
policies addressing quality with equity.
This book opens on a familiar approach
that the United States is falling behind other
developed countries when it comes to
educational achievements. At a time when “At
least 70% of US jobs now require specialized
knowledge and skills, as compared to only 5%
at the dawn of the last century, when our
current system of schooling was established.”
(p.2)
Furthermore, “… the new mission of
schools is to prepare students to work at jobs
that do not yet exist, creating ideas and
solutions for products and problems that have
not yet been identified, using technologies that
have not yet been invented.” (p. 2)
In the United States “… our college
participation rates have slipped from 1st in the
world to 16th
and only about one-third of our
young people receive a college degree.” (p. 3)
“At a time when high school dropouts are
unlikely to be able to secure any job at all, our
high school graduation rates—stuck at about
70%—have dropped from first in the world to
the bottom half of individualized nations.” (p.
3)
There are others who would contest
these figures as well as other statistics,
particularly the rankings of the US compared to
other countries. For example, the percentage of
young people who receive a college degree has
never been much over “one-third” depending
upon age definitions and whether associate
degrees from two year colleges are included.
Likewise, international rankings are
fraught with inherent problems and perceptions
which are not resolved within this book.
Americans are obsessed with rankings and
“being #1”, thus educational policy advocates
utilize the numbers to draw attention to
whatever they are promoting. A more universal

34
__________________________________________________________________________________
Vol. 9, No. 2 Summer 2012 AASA Journal of Scholarship and Practice
point is that many countries are making more
educational gains at a faster pace than the US,
regardless of rankings.
Meanwhile, globalization of economies,
as explained by Tom Friedman in his book The
World is Flat. is changing everything and
quickly. Technology has reduced many barriers
to education and the marketplace. Knowledge
is no longer confined to privileged countries or
people. Populations everywhere are taking
advantage of new educational opportunities.
Darling-Hammond is no fan of
standardized tests. Yet, ironically, like other
researchers, she uses test data to make her case.
“The results [on international tests of skills and
knowledge] have been that the United States is
standing still while more focused nations move
rapidly ahead.” (p.9)
United States 15 year olds ranked 21st in
science and 25th
in mathematics on the 2009
Programme of International Student
Assessment (PISA) out of the 30 member
countries in the Organization for Economic
Cooperation and Development (OECD). When
ten other countries from Eastern Europe and
Asia are included, the US drops to 29th
and 35th
in science and math. It would have been
prudent to point out the relative small
populations of some of these countries and the
minor differences between some of these
rankings, although that would have reduced the
attention-getting nature of the falling rankings
of the US.
While the US has had “Stagnating
Educational Attainment” (p. 14) overall the
inequality between Asian and White students
and African American and Hispanic students in
the US is equal to the distance between the US
and the highest scoring countries. Not as much
notice is given to such academic gaps in other
countries.
Educational policy when supported by
funding can matter, while changing directions
hinders progress. “Such U-turns in education
policy and practice are not unusual in US
education. Local, state and, sometimes, federal
policies frequently force schools to change
course based on political considerations rather
than strong research about effective practices.”
(p. 14)
For example, the various improvements
spurred by the Great Society’s War on Poverty
in the 1960’s reduced funding inequalities so
that “by the mid-1979’s, urban schools spent as
much as suburban schools, and paid their
teachers as well; perennial teacher shortages
had nearly ended; and gaps in educational
attainment had closed substantially.” (p.18)
However, “By the end of the 1980’s, the
achievement gap had begun to grow again.” (p.
20) “The investments in the education of
students of color that characterized the school
desegregation and finance reforms of the
1960’s and 1970’s have never been fully re-
established in the years since. Ironically, had
the rate of progress achieved in the 1970’s and
early 1980’s been continues, the achievement
gap would have fully closed by the beginning
of the 21st century.” (p. 20)
A main point is “… whether
investments in better teaching, curriculum, and
schooling will follow the press for new
standards or whether standards build upon a
foundation of continued inequality in education
will simply certify student failure with greater
certainty and reduce access to future education
and employment.” (p.98)

35
__________________________________________________________________________________
Vol. 9, No. 2 Summer 2012 AASA Journal of Scholarship and Practice
The Texas “Miracle” (increased student
test scores during the tenure of Governor Bush
and Houston superintendent Rod Paige and
others who later become President, Secretary of
Education and various domestic advisors) is
seen as a mirage as the system was gamed.
“While elementary scores were boosted by
holding low-achieving students out of the high-
stakes tests, high school scores were boosted by
the loss of low-achieving students for school
entirely.” (p. 84)
Another few pages devoted to
“Massachusetts: The Untold Story” implies
that dropout rates increase and more ninth
graders fail to become tenth graders in “high
schools receiving state awards for gains in 10th
grade pass rates on the MCAS…” (p. 94) There
have been documented cases of cheating in all
states, thus there may have been particular
reasons for selecting these two states to
highlight since they both have been touted as
making educational gains in states led by
Republican governors.
There is a reference that “Teachers
often attribute test score gains to test
preparation rather than improved learning” (p.
72) and those scores can be raised without
improving learning. What is left unaddressed is
what is “improved learning” and how is it
determined to be “improved.” The offered
answer is that the path to better learning is
“investing” more funds. Yet, the critics can
draw upon data to demonstrate that more funds
have gone into education without a
corresponding rise in test scores. Thus, it is not
more money per se that would help, but
targeted investing directed at some of the
suggestions in this book.
The need for a long term view is
conveyed with “Steady Work: How Countries
Build Strong Teaching and Learning Systems.”
The countries reviewed are all high achieving
on educational tests: Finland, South Korea and
Singapore. All have leaped forward over the
last 10 years with deliberate plans highlighting
adequate and equitable funding, elimination of
tracking, higher order skills, strong teacher
preparation and ongoing professional learning
programs. Of course, every country has a
unique culture and demography, and unique
policies and educational practices.
The tendency is to cherry-pick one’s
favorite existing traits as the cause for
improvement. Most countries outside the US
have a national educational system so anything
that emanates from that characteristic could be
cited as the reason for progress.
Darling-Hammond, like most educators,
seems enamored with more funding, less
tracking, curriculum standards, etc. Yet, the
socioeconomic status of the individual families
may be more responsible for educational
outcomes than governmental spending. The
elimination of tracking is still being
implemented in these three countries (Finland,
South Korea and Singapore) and may or may
not have contributed to increased test scores.
Teaching for mastery by all students may be
more responsible.
Using examples from across the US,
similar themes are presented along with
alternatives to standardized tests or
accountability based on professional judgment.
Consequently, this book will appeal to many
educators who are exasperated with this
county’s current system. They can pull
information to support their frustrations.
The criticism comes easily to a
researcher especially using international
comparisons. There are many stimulating ideas
in this piece, although there is no coherent

36
__________________________________________________________________________________
Vol. 9, No. 2 Summer 2012 AASA Journal of Scholarship and Practice
vision for a future educational system nor is
there a blueprint for action. The author does
acknowledge that romantic notions are not
enough and that new designs need time, space
and funding to prove they are worthy of going
to scale. This latter point of establishing pilots
may be this book’s most enduring contribution,
as the United States continues to struggle with
drawing a coherent map for sustainable
educational improvement.
Reviewer biography
Art Stellar has been a superintendent for 25 years. He has received AASA’s “Leadership for
Learning” and “Dr. Effie Jones Humanitarian” awards. He was elected president of the Association for
Supervision and Curriculum Development, the North American Chapter of the World Council for
Curriculum and Instruction and the Horace Mann League. He is presently consulting, writing and
exploring career options. E-mail: [email protected]
The Flat World and Education: How America’s Commitment to Equity Will Determine Our Future is
written by Linda Darling-Hammond and published by Teachers College Press, NY, NY; 408 pages,
softcover, $23.95.

37
__________________________________________________________________________________
Vol. 9, No. 2 Summer 2012 AASA Journal of Scholarship and Practice
Mission and Scope, Copyright, Privacy, Ethics, Upcoming Themes, Author Guidelines &
Publication Timeline
The AASA Journal of Scholarship and Practice is a refereed, blind-reviewed, quarterly journal with a
focus on research and evidence-based practice that advance the profession of education administration.
Mission and Scope The mission of the Journal is to provide peer-reviewed, user-friendly, and methodologically sound
research that practicing school and district administrations can use to take action and that higher
education faculty can use to prepare future school and district administrators. The Journal publishes
accepted manuscripts in the following categories: (1) Evidence-based Practice, (2) Original Research,
(3) Research-informed Commentary, and (4) Book Reviews.
The scope for submissions focus on the intersection of five factors of school and district
administration: (a) administrators, (b) teachers, (c) students, (d) subject matter, and (e) settings. The
Journal encourages submissions that focus on the intersection of factors a-e. The Journal discourages
submissions that focus only on personal reflections and opinions.
Copyright Articles published by the American Association of School Administrators (AASA) in the AASA
Journal of Scholarship and Practice fall under the Creative Commons Attribution-Non-Commercial-
NoDerivs 3.0 license policy (http://creativecommons.org/licenses/by-nc-nd/3.0/). Please refer to the
policy for rules about republishing, distribution, etc. In most cases our readers can copy, post, and
distribute articles that appear in the AASA Journal of Scholarship and Practice, but the works must be
attributed to the author(s) and the AASA Journal of Scholarship and Practice. Works can only be
distributed for non-commercial/non-monetary purposes. Alteration to the appearance or content of any
articles used is not allowed. Readers who are unsure whether their intended uses might violate the
policy should get permission from the author or the editor of the AASA Journal of Scholarship and
Practice.
Authors please note: By submitting a manuscript the author/s acknowledge that the submitted
manuscript is not under review by any other publisher or society, and the manuscript represents
original work completed by the authors and not previously published as per professional ethics based
on APA guidelines, most recent edition. By submitting a manuscript, authors agree to transfer without
charge the following rights to AASA, its publications, and especially the AASA Journal of Scholarship
and Practice upon acceptance of the manuscript. The AASA Journal of Scholarship and Practice is
indexed by several services and is also a member of the Directory of Open Access Journals. This
means there is worldwide access to all content. Authors must agree to first worldwide serial
publication rights and the right for the AASA Journal of Scholarship and Practice and AASA to grant
permissions for use of works as the editors judge appropriate for the redistribution, repackaging, and/or
marketing of all works and any metadata associated with the works in professional indexing and
reference services. Any revenues received by AASA and the AASA Journal of Scholarship and
Practice from redistribution are used to support the continued marketing, publication, and distribution
of articles.

38
__________________________________________________________________________________
Vol. 9, No. 2 Summer 2012 AASA Journal of Scholarship and Practice
Privacy The names and e-mail addresses entered in this journal site will be used exclusively for the stated
purposes of this journal and will not be made available for any other purpose or to any other party.
Please note that the journal is available, via the Internet at no cost, to audiences around the world.
Authors’ names and e-mail addresses are posted for each article. Authors who agree to have their
manuscripts published in the AASA Journal of Scholarship and Practice agree to have their names and
e-mail addresses posted on their articles for public viewing.
Ethics The AASA Journal of Scholarship and Practice uses a double-blind peer-review process to maintain
scientific integrity of its published materials. Peer-reviewed articles are one hallmark of the scientific
method and the AASA Journal of Scholarship and Practice believes in the importance of maintaining
the integrity of the scientific process in order to bring high quality literature to the education leadership
community. We expect our authors to follow the same ethical guidelines. We refer readers to the latest
edition of the APA Style Guide to review the ethical expectations for publication in a scholarly journal.
Upcoming Themes and Topics of Interest
Below are themes and areas of interest for the 2010-2012 publication cycles.
1. Governance, Funding, and Control of Public Education
2. Federal Education Policy and the Future of Public Education
3. Federal, State, and Local Governmental Relationships
4. Teacher Quality (e.g., hiring, assessment, evaluation, development, and compensation of
teachers)
5. School Administrator Quality (e.g., hiring, preparation, assessment, evaluation, development,
and compensation of principals and other school administrators)
6. Data and Information Systems (for both summative and formative evaluative purposes)
7. Charter Schools and Other Alternatives to Public Schools
8. Turning Around Low-Performing Schools and Districts
9. Large scale assessment policy and programs
10. Curriculum and instruction
11. School reform policies
12. Financial Issues
Submissions
Length of manuscripts should be as follows: Research and evidence-based practice articles between
1,800 and 3,800 words; commentaries between 1,600 and 3,800 words; book and media reviews
between 400 and 800 words. Articles, commentaries, book and media reviews, citations and references
are to follow the Publication Manual of the American Psychological Association, latest edition.
Permission to use previously copyrighted materials is the responsibility of the author, not the AASA
Journal of Scholarship and Practice.
Potential contributors should include in a cover sheet that contains (a) the title of the article, (b)
contributor’s name, (c) terminal degree, (d) academic rank, (e) department and affiliation (for inclusion
on the title page and in the author note), (f) address, (g) telephone and fax numbers, and (h) e-mail
address. Authors must also provide a 120-word abstract that conforms to APA style and a 40-word
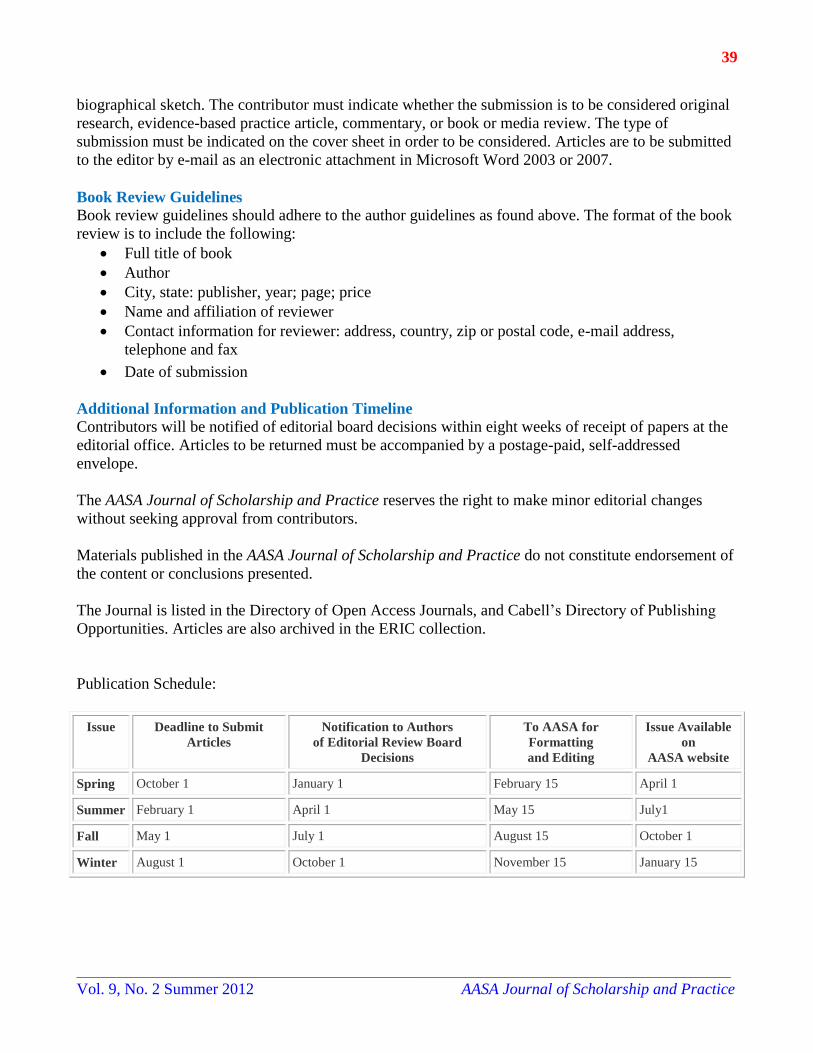
39
__________________________________________________________________________________
Vol. 9, No. 2 Summer 2012 AASA Journal of Scholarship and Practice
biographical sketch. The contributor must indicate whether the submission is to be considered original
research, evidence-based practice article, commentary, or book or media review. The type of
submission must be indicated on the cover sheet in order to be considered. Articles are to be submitted
to the editor by e-mail as an electronic attachment in Microsoft Word 2003 or 2007.
Book Review Guidelines
Book review guidelines should adhere to the author guidelines as found above. The format of the book
review is to include the following:
Full title of book
Author
City, state: publisher, year; page; price
Name and affiliation of reviewer
Contact information for reviewer: address, country, zip or postal code, e-mail address,
telephone and fax
Date of submission
Additional Information and Publication Timeline
Contributors will be notified of editorial board decisions within eight weeks of receipt of papers at the
editorial office. Articles to be returned must be accompanied by a postage-paid, self-addressed
envelope.
The AASA Journal of Scholarship and Practice reserves the right to make minor editorial changes
without seeking approval from contributors.
Materials published in the AASA Journal of Scholarship and Practice do not constitute endorsement of
the content or conclusions presented.
The Journal is listed in the Directory of Open Access Journals, and Cabell’s Directory of Publishing
Opportunities. Articles are also archived in the ERIC collection.
Publication Schedule:
Issue Deadline to Submit
Articles
Notification to Authors
of Editorial Review Board
Decisions
To AASA for
Formatting
and Editing
Issue Available
on
AASA website
Spring October 1 January 1 February 15 April 1
Summer February 1 April 1 May 15 July1
Fall May 1 July 1 August 15 October 1
Winter August 1 October 1 November 15 January 15

40
__________________________________________________________________________________
Vol. 9, No. 2 Summer 2012 AASA Journal of Scholarship and Practice
Submit articles to the editor electronically:
Christopher H. Tienken, EdD, Editor
AASA Journal of Scholarship and Practice
To contact the editor by postal mail:
Dr. Christopher Tienken
Assistant Professor
College of Education and Human Services
Department of Education Leadership, Management, and Policy
Seton Hall University
Jubilee Hall Room 405
400 South Orange Avenue
South Orange, NJ 07079
41
__________________________________________________________________________________
Vol. 9, No. 2 Summer 2012 AASA Journal of Scholarship and Practice
AASA Resources
The American School Superintendent: 2010 Decennial Study was released December 8,
2010 by the American Association of School Administrators. The work is one in a series of
similar studies conducted every 10 years since 1923 and provides a national perspective
about the roles and responsibilities of contemporary district superintendents. “A must-read
study for every superintendent and aspiring system leader ...” — Dan Domenech, AASA
executive director. See www.rowmaneducation.com/Catalog/MultiAASA.shtml
A School District Budget Toolkit. In an AASA survey, members asked for budget help in
these tough economic times. A School District Budget Toolkit provides examples of best
practices in reducing expenditures, ideas for creating a transparent budget process, wisdom
on budget presentation, and suggestions for garnering and maintaining public support for
the district's budget. It contains real-life examples of how districts large and small have
managed to navigate rough financial waters and offers encouragement to anyone currently
stuck in the rapids. See www.aasa.org/BudgetToolkit-2010.aspx. [Note: This toolkit is
available to AASA members only.]
Learn about AASA’s books program where new titles and special discounts are available
to AASA members. The AASA publications catalog may be downloaded at
www.aasa.org/books.aspx.
Join AASA and discover a number of resources reserved exclusively for members. Visit
www.aasa.org/Join.aspx. Questions? Contact C.J. Reid at [email protected].
Upcoming AASA Webinars and Events
Visit www.aasa.org/conferences.aspx for information.
AASA Legislative Advocacy Conference, Hyatt Regency Washington on Capitol Hill,
Washington, D.C., July 17-19, 2012
AASA and ACSA Women in School Leadership Forum, Hyatt Regency Newport Beach,
Newport Beach, Calif., Sept. 27-28, 2012
AASA’s 2013 National Conference on Education, Los Angeles, Calif., Feb. 21-23, 2013 and AASA’s 2014 National Conference on Education, Nashville, Tenn., Feb. 20-22, 2014


![AASA, Feb. 22 2013 [3]](https://img.dokumen.tips/doc/110x75/61da034707d2a503330ec69e/aasa-feb-22-2013-3.jpg)


