Embed Size (px)
Citation preview

Report of Findings
Looking Back, Looking Forward: How the Economic Downturn Continues to
Impact School Districts
March 2009
Robert S. McCord, University of Nevada, Las Vegas, Chair Noelle M. Ellerson, American Association of School Administrators
Research Team
K. Forbis Jordan (Ret.), Arizona State University Teresa Jordan, University of Nevada, Las Vegas Richard Lemons, University of Connecticut T. C. Mattocks, Bridgewater State College
Margaret Orr, Bank Street College
Daniel A. Domenech, AASA Executive Director
©American Association of School Administrators

1
Table of Contents Abstract…………………………………………………………………………………………………………………………………......2 Report of Findings
Introduction…………………………………………………………………………………………………………………………6
Methodology……………………………………………………………………………………………………………………….7 Findings
PART I: Snapshot of the Current Economic Situation………………………………………………..8
PART II: Feeling the Impact…………………………………………………………………………………….11
PART III: Using Funds from the American Recovery and Reinvestment Act of 2009…13
PART IV: The Economic Downturn and School Employment…………………………………..14
PART V: Impact on School Community, Families and Learning……………………………….16
PART VI: Demographics………………………………………………………………………………………….17
Part VII: Policy Threats and Implications…………………………………………………………………19
References
References……………………………………………………………………………………………..………………………….21
Appendix A: Survey Questions………………………………………………………………………………..………….22
Appendix B: Survey Response Data…………………………………………………………………………………....27
2
Abstract This study is the fourth in a series of studies conducted by the American Association of School Administrators on the impact of the economic downturn on schools. AASA launched the series in fall 2008 in response to state budget shortfalls, federal buy‐outs and interventions, and a series of additional events characterizing a slowing, stagnant economy. As the economic situation worsened, AASA continued to monitor its impact on schools through a series of surveys of school administrators nationwide. The previous studies in the AASA Economic Impact Study series include (see the full studies at www.aasa.org/policy/econstudies ):
• “AASA Impact of the Economic Downturn on School Jobs Snapshot Survey” (released Jan. 16, 2009)
• “AASA Opportunity for Federal Education Funding Survey” (released Dec. 15, 2008) • “AASA Study of the Impact of the Economic Downturn on Schools” (released Nov. 12, 2008)
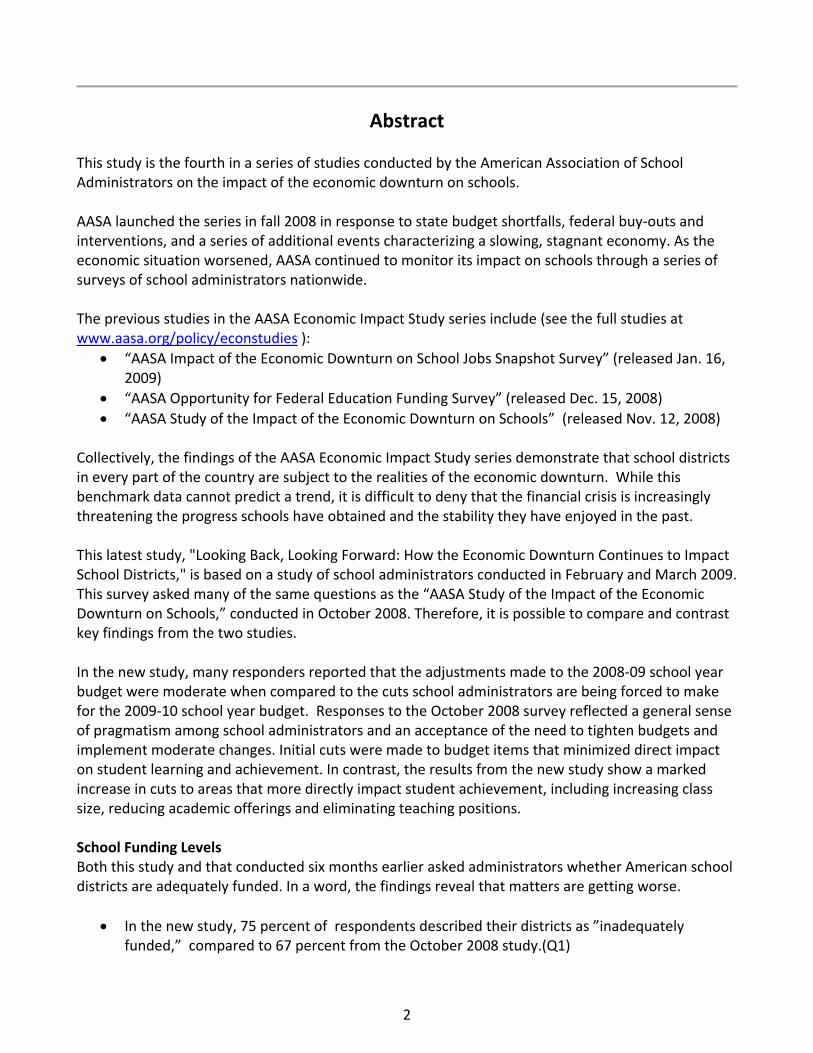
Collectively, the findings of the AASA Economic Impact Study series demonstrate that school districts in every part of the country are subject to the realities of the economic downturn. While this benchmark data cannot predict a trend, it is difficult to deny that the financial crisis is increasingly threatening the progress schools have obtained and the stability they have enjoyed in the past. This latest study, "Looking Back, Looking Forward: How the Economic Downturn Continues to Impact School Districts," is based on a study of school administrators conducted in February and March 2009. This survey asked many of the same questions as the “AASA Study of the Impact of the Economic Downturn on Schools,” conducted in October 2008. Therefore, it is possible to compare and contrast key findings from the two studies. In the new study, many responders reported that the adjustments made to the 2008‐09 school year budget were moderate when compared to the cuts school administrators are being forced to make for the 2009‐10 school year budget. Responses to the October 2008 survey reflected a general sense of pragmatism among school administrators and an acceptance of the need to tighten budgets and implement moderate changes. Initial cuts were made to budget items that minimized direct impact on student learning and achievement. In contrast, the results from the new study show a marked increase in cuts to areas that more directly impact student achievement, including increasing class size, reducing academic offerings and eliminating teaching positions. School Funding Levels Both this study and that conducted six months earlier asked administrators whether American school districts are adequately funded. In a word, the findings reveal that matters are getting worse.
• In the new study, 75 percent of respondents described their districts as ”inadequately funded,” compared to 67 percent from the October 2008 study.(Q1)

3
The day‐to‐day cash management and fund capital development of a school district are challenging in the best of times. In the October 2008 study, school administrators reported that they expected to face challenges raising funds and selling bonds. The new study indicates that districts’ fiscal problems have intensified after only six months:
• Twenty‐one percent of respondents indicated they were facing short‐term borrowing to meet payroll and accounts payable. While it is not unusual for districts to maintain a line a credit for managing cash, this is clearly a significant percentage.
• Only two percent of respondents reported facing non‐performance on bond repayment schedules and only one percent were threatened with insolvency.
Use of Stimulus Funds The new study was completed just after the American Recovery and Reinvestment Act of 2009 became law. As such, AASA was able to ask school administrators to indicate and rank eligible projects for the stimulus funding they would be receiving. Illustrating that school administrators recognize the importance of targeted, short‐term investments with the greatest chance of long‐term impact, survey responders seemed to focus their priorities on staff and resource development. When asked which projects their districts would address with stimulus funding: (Q9)
• The top five uses labeled “high priority” were classroom technology (57 percent), school modernization/repair (54 percent), safety/security measures (40 percent), connectivity (39 percent) and professional development (37 percent).
• The top five uses labeled “priority” were classroom equipment/supplies (48 percent), software (48 percent), supportive technology for students with needs (48 percent), professional development (47 percent) and textbooks (44 percent).
• The top five uses labeled “low priority” were health equipment (67 percent), start a new career/technical program (66 percent), art education equipment/supplies (65 percent), physical education equipment/supplies (64 percent) and music education equipment/supplies (57 percent).
Education represents a large share of states’ general fund budgets. With state deficits expected to total more than $350 billion over the next two years, it will be very difficult for states to avoid damaging cuts to education, cuts that will likely deepen as the recession continues. While the $100 billion included for education in the American Recovery and Reinvestment Act will help states backfill some of their budget cuts, it is unlikely that it will be enough to allow states and schools to completely reverse the cuts. (Center on Budget and Policy Priorities) While some of the stimulus funds could help school districts acquire new programs, services and equipment, many of the purchases may simply represent the return of resources and capacities the schools had cut in the early stages of the recession and precipitous reductions in local and state funding to school districts.
4
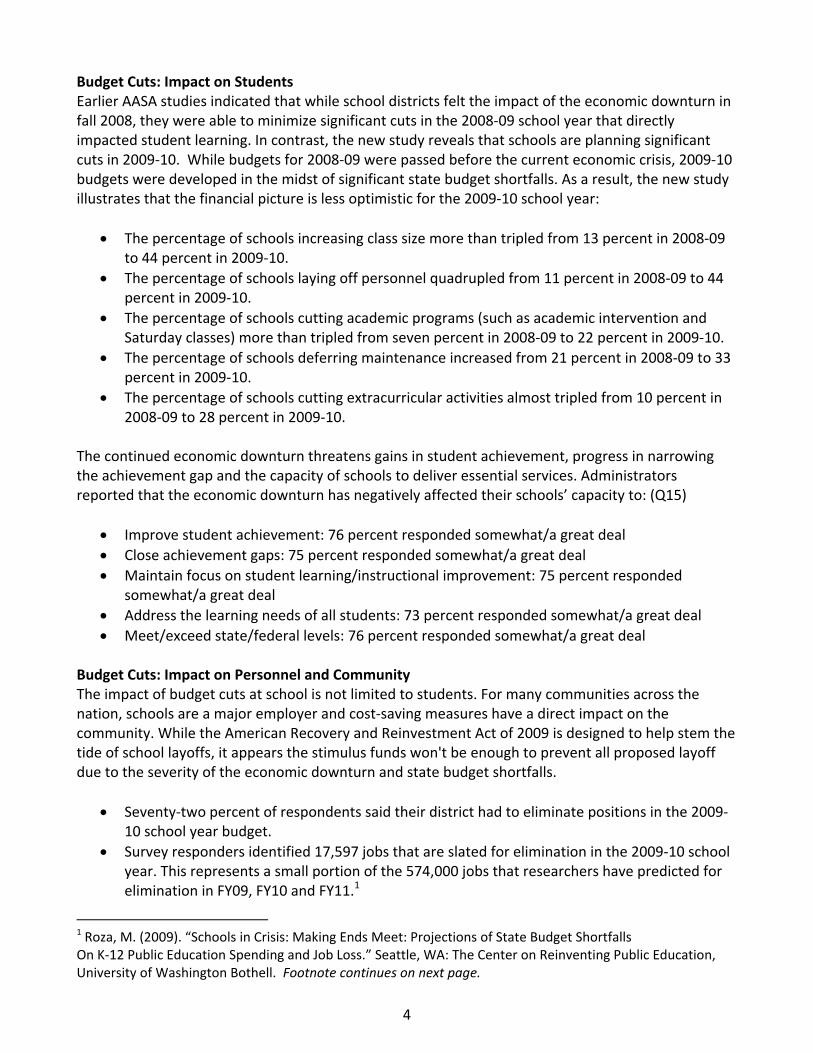
Budget Cuts: Impact on Students Earlier AASA studies indicated that while school districts felt the impact of the economic downturn in fall 2008, they were able to minimize significant cuts in the 2008‐09 school year that directly impacted student learning. In contrast, the new study reveals that schools are planning significant cuts in 2009‐10. While budgets for 2008‐09 were passed before the current economic crisis, 2009‐10 budgets were developed in the midst of significant state budget shortfalls. As a result, the new study illustrates that the financial picture is less optimistic for the 2009‐10 school year:
• The percentage of schools increasing class size more than tripled from 13 percent in 2008‐09 to 44 percent in 2009‐10.
• The percentage of schools laying off personnel quadrupled from 11 percent in 2008‐09 to 44 percent in 2009‐10.
• The percentage of schools cutting academic programs (such as academic intervention and Saturday classes) more than tripled from seven percent in 2008‐09 to 22 percent in 2009‐10.
• The percentage of schools deferring maintenance increased from 21 percent in 2008‐09 to 33 percent in 2009‐10.
• The percentage of schools cutting extracurricular activities almost tripled from 10 percent in 2008‐09 to 28 percent in 2009‐10.
The continued economic downturn threatens gains in student achievement, progress in narrowing the achievement gap and the capacity of schools to deliver essential services. Administrators reported that the economic downturn has negatively affected their schools’ capacity to: (Q15)
• Improve student achievement: 76 percent responded somewhat/a great deal • Close achievement gaps: 75 percent responded somewhat/a great deal • Maintain focus on student learning/instructional improvement: 75 percent responded
somewhat/a great deal • Address the learning needs of all students: 73 percent responded somewhat/a great deal • Meet/exceed state/federal levels: 76 percent responded somewhat/a great deal
Budget Cuts: Impact on Personnel and Community The impact of budget cuts at school is not limited to students. For many communities across the nation, schools are a major employer and cost‐saving measures have a direct impact on the community. While the American Recovery and Reinvestment Act of 2009 is designed to help stem the tide of school layoffs, it appears the stimulus funds won't be enough to prevent all proposed layoff due to the severity of the economic downturn and state budget shortfalls.
• Seventy‐two percent of respondents said their district had to eliminate positions in the 2009‐10 school year budget.
• Survey responders identified 17,597 jobs that are slated for elimination in the 2009‐10 school year. This represents a small portion of the 574,000 jobs that researchers have predicted for elimination in FY09, FY10 and FY11.1
1 Roza, M. (2009). “Schools in Crisis: Making Ends Meet: Projections of State Budget Shortfalls On K‐12 Public Education Spending and Job Loss.” Seattle, WA: The Center on Reinventing Public Education, University of Washington Bothell. Footnote continues on next page.

5
Administrators reported that the economic downturn has directly impacted schools’ capacity to:
• Maintain employment levels (support staff): 83 percent responded somewhat/a great deal • Provide professional development for administrators: 79 percent responded somewhat/a
great deal • Maintain employment levels (teachers): 77 percent responded somewhat/a great deal • Maintain employment levels (administrative): 75 percent responded somewhat/a great deal • Provide professional development for teachers: 75 percent responded somewhat/a great deal • Recruit/retain qualified staff: 66 percent responded somewhat/a great deal
Overall, the new study reveals the impact of the economic downturn on schools has worsened over the past six months. Schools across the nation are planning significant cuts in their 2009‐10 school year budgets, including cuts to areas that directly impact student achievement. When considered in total, the economic downturn has exacted a heavy toll on communities, families, and learning. At the time of print, the stimulus dollars had yet to reach the state and local level, meaning that the impact of the federal stimulus funds on education remains to be seen. As schools begin receiving the funds, federal, state and local leaders must work to maximize both the flow and flexibility of funds to schools in order to help protect students and schools from program and staffing cuts and ensure schools have the resources they need to increase student achievement, close the achievement gap and fuel economic recovery and growth.
Survey respondents identified 17,597 jobs slated for elimination in the 2009‐10 school year. To scale this survey response to a national level over the duration of the stimulus funds, we refer to research from the Center on Reinventing Public Education (footnote) Roza writes, “…School districts may need to eliminate just over 9 percent of total jobs in K‐12 education. In raw numbers, the implication is that 574,277 jobs would be eliminated during the three school years.” Breaking the job cuts down to annual levels, Roza estimates 133,467 jobs would be eliminated in FY09, with an additional 191,630 in FY10 and 249,180 in FY11. These numbers illustrate the magnitude of the impact the economic downturn is having on both public education spending and the corresponding job loss.
6
Report of Findings Introduction The report of findings for this study take on greater meaning when viewed in the context of the studies that have preceded it. When it became apparent in 2008 that an economic downturn was upon us, the leadership of AASA determined that creating benchmarks documenting the impact of that downturn on schools was essential to influencing the national policy agenda. In October 2008, AASA undertook a nationwide study (McCord, Ellerson 2008) of school administrators to determine what impact the change in economic conditions had upon the decisions school leaders faced. Some 836 administrators responded to the “AASA Study of the Impact of the Economic Downturn on Schools” found that belt‐tightening measures were underway in districts nationwide in response to shrinking budgets. It also suggested the economic downturn could threaten gains in student achievement and progress in narrowing the achievement gap, which schools have fought so hard to attain, as well as the capacity of schools to deliver essential services. To give the data additional dimension, AASA commissioned two additional studies of members. In December 2008, nearly 800 administrators provided information regarding their preparedness to identify important projects that could be considered under the yet‐to‐be enacted stimulus package. The “AASA Opportunity for Federal Education Funding Survey” found America’s public schools had a list of ready‐to‐go construction and renovation projects that, with an infusion of federal economic stimulus funds, would work to both stimulate a stagnating economy and improve the educational environment for children. Responders identified $6.52 billion in ready‐to‐go new construction projects and $4.49 billion in ready‐to‐go renovation and repair projects for public schools. A study of more than 250 administrators conducted in January 2009 was designed to provide more detail on potential school‐related job losses produced by the economic turndown. The “AASA Impact of the Economic Downturn on School Jobs Snapshot Survey” found that public school districts across the nation planned to eliminate jobs in the 2009‐10 school year in response to the economic downturn, including classroom instructors in all subject areas. Seventy‐two percent of school leaders surveyed said their districts planned to eliminate jobs in the 2009‐10 school year, suggesting that schools and students faced the stark reality of fewer academic instructors, support staff and student services staff in the 2009‐10 school year. The study reported herein documents the changes in districts’ economic situation since AASA conducted the first Economic Impact Survey in October 2008, while adding aspects related to the anticipated impact of the American Recovery and Reinvestment Act of 2009 signed into law by President Obama in February 2009. It is important to understand that the October 2008 “AASA Study of the Impact of the Economic Downturn on Schools” looked at the 2008‐09 school year, while the current study asked administrators to report on how their planning for the 2008‐09 and 2009‐10 school years have been impacted.

7
Documenting the impact of the economic downturn on American schools is essential to informing the policy agenda undertaken by AASA and its members. The findings are presented in seven major sections: Part I: Snapshot of the Current Economic Situation Part II: Feeling the Impact Part III: Using Funds from the American Recovery and Reinvestment Act of 2009 Part IV: The Economic Downturn and School Employment Part V: Impact on School Community, Families and Learning Part VI: Demographics Part VII: Policy Threats, Implications and Conclusion
Methodology As part of a series of studies examining the impact of the economic downturn on America’s schools, AASA launched “Looking Back, Looking Forward: How the Economic Downturn Continues to Impact School Districts” at AASA’s National Conference on Education, Feb. 19‐21, 2009. The online survey (Appendix A) was distributed to school administrators via an e‐mail invitation and a link on the AASA homepage. While the sample was not random or scientific, school administrators receiving and completing the survey represented all regions of the country and districts and communities of all types and sizes. A total of 859 school administrators from 48 different states completed the survey over a three‐week period in February and March 2009. Part VI of this report provides additional details on the demographics of the respondents.

8
Part I: Snapshot of the Current Economic Situation Both this study and the “AASA Study of the Impact of the Economic Downturn on Schools” conducted six months earlier asked administrators whether American school districts are adequately funded. Table 1, below, provides an overview snapshot of the economic situation in America’s public schools, and compares the responses from both studies. In the new study, 75 percent of survey responders described their schools’ economic situation as “inadequately funded,” up from 67 percent in October 2008. (Q1) See Table 1. Table 1 – District Economic Situation
Total Inadequately
Funded Adequately Funded
Surplus
Count Count Percent Count Percent Count Percent 2008 835 560 67.1% 254 30.4% 21 2.5%
2009 856 644 75.2% 199 23.2% 13 1.5% Sixty‐three percent of the 2009 respondents describe their districts as financially independent. This is a 10 percent drop from the fall 2008 levels, and it suggests and interesting implication. It appears that while more districts are reporting their funding to be inadequate, a full 10 percent more of the respondents come from fiscally dependent districts. One can reasonably assume that the competing interests facing fiscally dependent districts have been intensified by the economic downturn. (Q2) When responses to the adequacy of funding were disaggregated by rural, suburban and urban designation of district, no district type was found to be exempt from the worsening conditions. Table 2, below, compares the economic situation by community type and against the 2008 study results. The percentage of rural schools describing their economic situation as “inadequately funded” grew from 69.5 percent in 2008 to 77.5 percent in 2009. Similarly, both suburban and urban school districts reported an increase, from 59.9 percent to 67.2 percent and from 74.4 percent to 87.7 percent, respectively. See Table 2. Table 2 – District Economic Situation, by District Type
Total Inadequately Funded Adequately Funded Surplus 2008 2009
Count Percent Across All
Count Percent Count Percent Count Percent
Rural 482 521
58.1% 61.6%
335 404
69.5% 77.5%
137 109
28.4% 20.9%
10 8
2.1% 1.5%
Suburban 262 268
31.6% 31.6%
157 180
59.9% 67.2%
95 84
36.3% 31.3%
10 4
3.8% 1.5%
Urban 86 57
10.4% 6.7%
64 50
74.4% 87.7%
22 6
25.6% 10.5%
0 1
0.0% 1.8%

9
When the question of adequacy was observed from the standpoint of district size distribution, all districts were impacted with worsening conditions and some suggestion exists that the intermediate‐size districts have recently begun to feel a greater impact. See Table 3.
• The percentage of schools describing their economic situation as “inadequately funded” increased for schools of all sizes. The one exception, school districts with an enrollment of 50,000 – 99,999 students, showed a very slight decrease in the percentage of schools describing their economic situation as inadequate, falling from 90.9 percent to 90.0percent—a change of less than one percent.
Table 3 – District Economic Situation, by Student Enrollment
Total Inadequately Funded Adequately Funded Surplus
2008 2009
Count Percent Across All
Count Percent Count Percent Count Percent
1 – 999 211 277
25.6% 32.9%
146 206
69.2% 74.5%
62 69
29.4% 24.9%
3 2
1.4% 0.7%
1,000 ‐ 2,999 286 267
34.7% 31.6%
183 200
64.0% 74.9%
93 62
32.5% 23.2%
10 5
3.5% 1.8%
3,000 ‐ 4,999 111 115
13.5% 13.6%
65 82
58.6% 71.1%
41 31
36.9% 27.0%
5 2
4.5% 1.7%
5,000 ‐ 9,999 110 100
13.3% 11.8%
73 74
66.4% 74.0%
36 22
32.7% 22.0%
1 4
0.9% 4%
10,000 ‐ 24,999 63 58
7.6% 6.9%
47 47
74.6% 81.0%
15 11
23.8% 19.0
1 0
1.6% 0.0%
25,000 ‐ 49,999 27 16
3.3% 1.9%
23 13
85.2% 81.3%
4 3
14.8% 18.8%
0 0
0.0% 0.0%
50,000 ‐ 99,999 11 10
1.3% 1.2%
10 9
90.9% 90.0%
1 1
9.1% 10.0%
0 0
0.0% 0.0%
100,000 or More
5 2
0.6% 0.2%
4 2
80.0% 100.%
0 0
0.0% 0.0%
1 0
20.0% 0.0%
The impact of the economic downturn is apparent at the national, state and local levels. In an effort to examine the economic impact at a regional level, Table 4, on the next page, reports how schools in various regions of the country describe their economic situation. While all of the regions reported an increase in the percentage of schools describing their economic situation as inadequately funded, the greatest increase was in Regions 6 and 7, on the East Coast. See Table 4.
• Region 2 (Southwest) reported only a one percent increase in the number of schools districts describing their economic situation as ”inadequately funded,” growing from 76.2 percent in 2008 to 77.2 percent in 2009.
• Regions 6 and 7 (East Coast and Mid‐Atlantic) reported the greatest increase. Region 6 grew more than 12 percent, from 52.6 percent in 2008 to 64.9 percent in 2009. Region 7 grew more than 30 percent, from 38.5 percent in 2008 to 69.3 percent in 2009.

10
Table 4 – District Economic Situation, by Region
2008 2009
Total Inadequate Adequate Surplus
Count Percent Count Percent Count Percent Count Percent
Region 1
92 11.1% 76 82.6% 13 14.1% 3 3.3%
91 10.8% 78 85.7% 13 14.3% 0 0.0% Region
2 84 10.1% 64 76.2% 17 20.2% 3 3.6%
123 14.6% 95 77.2% 26 21.1% 2 1.6% Region
3 205 24.7% 154 75.1% 47 22.9% 4 2.0%
207 24.6% 165 79.7% 38 18.4% 4 1.9% Region
4 154 18.5% 100 64.9% 52 33.8% 2 1.3%
121 14.4% 82 67.8% 38 31.4% 1 0.8% Region
5 97 11.7% 73 75.3% 23 23.7% 1 1.0%
58 6.9% 47 81.0% 10 17.2% 1 1.7% Region
6 95 11.4% 50 52.6% 41 43.2% 4 4.2%
77 9.2% 50 64.9% 26 33.8% 1 1.3% Region
7 104 12.5% 40 38.5% 60 57.7% 4 3.8%
163 19.4% 113 69.3% 46 28.2% 4 2.5% Table 4a – AASA Regional State Roster
Region 1 Region 2 Region 3 Region 4 Region 5 Region 6 Region 7
AK AR IA IL AL DE ME AZ CO MI IN FL MD MA CA KS MN KY GA NJ NH HI NM NE MO LA PA NY ID OK ND OH MS WV RI MT TX SD NC VT NV UT WI SC CT OR TN WA VA WY
The day‐to‐day cash management and fund capital development of a school district are challenging in the best of times. In the October 2008 study, school administrators reported that they expected to face challenges raising funds and selling bonds. The new study indicates that districts’ fiscal problems have intensified after only six months:
• Twenty‐one percent of respondents indicated they were facing short‐term borrowing to meet payroll and accounts payable. While it is not unusual for districts to maintain a line a credit for managing cash, this is clearly a significant percentage.
• Only two percent of respondents reported facing non‐performance on bond repayment schedules and one percent were threatened with insolvency.

11
Part II: Feeling the Impact While we have documented that the impact of the economic downturn is worsening, defining how that impact is felt is an important element of this and previous related studies conducted by AASA. All data in this section was collected in the 2009 study. While the October 2008 study collected similar data, the 2009 study instrument collected the 2008‐09 and 2009‐10 school year information at the same time in an effort to make the information as current as possible. Responders were asked to indicate if they had considered and implemented, considered and delayed implementation, considered and rejected, or never considered each option. Buildings and Facilities Related Items: Earlier AASA studies indicated that building and facility related expenses were a primary target of school budget cuts. The new study indicates that districts may have tightened as much as they can: (Q6)
• The percentage of schools deferring maintenance increased from 21 percent in 2008‐09 to 33 percent in 2009‐10.
• The percentage of schools adjusting thermostats for less heating and cooling in buildings decreased from 46 percent in 2008‐09 to 25 percent in 2009‐10.
• The percentage of schools closing/consolidating schools rose from five percent in 2008‐09 to eight percent in 2009‐10.
• The percentage of schools delaying a capital debt (bond) program increased from eight percent in 2008‐09 to 11 percent in 2009‐10.
• The percentage of schools reducing custodial services rose from 16 percent in 2008‐09 to 22 percent in 2009‐10.
• The percentage of schools outsourcing custodial/maintenance work dropped from six percent in 2008‐09 to four percent in 2009‐10.
Curriculum Related Actions: Earlier AASA studies indicated that while school districts felt the impact of the economic downturn in fall 2008, they were able to minimize cuts that directly impacted student learning. Looking forward to the 2009‐10 school year, the outlook is not as optimistic: (Q7)
• The percentage of schools increasing class size more than tripled from 13 percent in 2008‐09 to 44 percent in 2009‐10.
• The percentage of schools eliminating/delaying instructional improvement strategies nearly tripled from 11 percent in 2008‐09 to 32 percent in 2009‐10.
• The percentage of schools cutting non‐academic programs (such as after school and Saturday enrichment programs) tripled from nine percent in 2008‐09 to 27 percent in 2009‐10.
• The percentage of schools cutting academic programs (such as academic intervention and Saturday classes) more than tripled from seven percent in 2008‐09 to 22 percent in 2009‐10.
• The percentage of schools strengthening identification/screening of non‐resident students fell from 17 percent in 2008‐09 to 14 percent on 2009‐10.
• The percentage of schools having to reduce elective courses not required for graduation almost quadrupled, from seven percent in 2008‐09 to 27 percent in 2009‐10.
• The percentage of schools deferring textbook purchases more than doubled, from 16 percent in 2008‐09 to 34 percent in 2009‐10.

12
• The percentage of schools reducing high‐cost course offerings (e.g., occupational education classes) more than tripled, from five percent in 2008‐09 to 17 percent in 2009‐10.
• The percentage of schools reducing instructional materials almost doubled, from 19 percent in 2008‐09 to 37 percent in 2009‐10.
• The percentage of schools eliminating field trips grew from 19 percent in 2008‐09 to 24 percent in 2009‐10.
Operations Related Actions: Operations‐related actions were one of the first places school administrators looked to save money as the economy began to stumble. As a result, the expansion of cuts to operations‐related actions is not as large as other areas, such as buildings/facilities and curriculum related actions: (Q8)
• The percentage of schools reducing operations to a four‐day work week (during the summer) fell from 14 percent in 2008‐09 to nine percent in 2009‐10.
• The percentage of schools reducing operations to a four‐day week during the school year fell from three percent in 2008‐09 to two percent in 2009‐10.
• The percentage of schools cutting bus transportation routes and availability rose from 14 percent on 2008‐09 to 23 percent in 2009‐10.
• The percentage of schools finding new transportation efficiencies (tiered pick‐ups) rose from 18 percent in 2008‐09 to 23 percent in 2009‐10.
• The percentage of schools cutting extracurricular activities almost tripled from 10 percent in 2008‐09 to 28 percent in 2009‐10.
• The percentage of schools deferring technology purchases doubled from 16 percent in 2008‐09 to 32 percent in 2009‐10.
• The percentage of schools reducing consumable supplies grew from 25 percent in 2008‐09 to 42 percent in 2009‐10.
• The percentage of schools eliminating non‐essential travel grew from 34 percent in 2008‐09 to 42 percent in 2009‐10.
• The percentage of schools joining bulk purchasing groups or co‐ops fell from 52 percent in 2008‐09 to 24 percent in 2009‐10.
• The percentage of schools reducing collaborative planning time within the school day rose from six percent in 2008‐09 to 13 percent in 2009‐10.

13
Part III: Using Funds from the American Recovery and Reinvestment Act of 2009 The American Recovery and Reinvestment Act of 2009 includes roughly $100 billion for America’s public schools. Money will flow to the schools through a number of separately designated programs. Respondents were asked to indicate their priority for the use of the stimulus funds in their districts. Illustrating that school administrators recognize the importance of targeted, short‐term investments with the greatest chance of long‐term impact, survey responders seemed to focus their priorities on staff and resource development. When asked which projects their districts would address with stimulus funding:
• The top five uses labeled “high priority” were classroom technology (57 percent), school modernization/repair (54 percent), safety/security measures (40 percent), connectivity (39 percent) and professional development (37 percent).
• The top five uses labeled “priority” were classroom equipment/supplies (48 percent), software (48 percent), supportive technology for students with needs (48 percent), professional development (47 percent) and textbooks (44 percent).
• The top five uses labeled “low priority” were health equipment (67 percent), start a new career/technical program (66 percent), art education equipment/supplies (65 percent), physical education equipment/supplies (64 percent) and music education equipment/supplies (57 percent).
While some of the stimulus funds may help school districts acquire new programs, services and equipment, it must be noted that many of the purchases may simply represent the return of resources and capacities the schools had cut in the early stages of the recession. The stimulus funds are a welcome resource for public schools and hold a promise of reinvesting in schools and the communities in which they serve an important economic role. It should be noted, however, that the actual allocation may well exceed the sum net gain at the local level, given ongoing state and local education funding setbacks.

14
Part IV: The Economic Downturn and School Employment The implications on school employment produced by the economic downturn promise to have a long‐lasting impact on American school districts. All data in this section was collected in the 2009 study. While the October 2008 study collected similar data, the 2009 study instrument collected the 2008‐09 and 2009‐10 school year information at the same time in an effort to make the information as current as possible. Responders were asked to indicate if they had considered and implemented, considered and delayed implementation, considered and rejected, or never considered each option. Personnel‐Related Actions: Earlier AASA studies indicated that while school districts felt the impact of the economic downturn in fall 2008, they were able to minimize cuts that directly impacted student learning, including the elimination of academic instruction positions. The economic picture for the 2009‐10 school year is less optimistic: (Q5)
• The percentage of schools implementing a personnel furlough more than tripled from five percent in the 2008‐09 school year to 17 percent in 2009‐10.
• The percentage of schools laying off personnel quadrupled from 11 percent in 2008‐09 to 44 percent in 2009‐10.
• The percentage of schools freezing outside professional service contracts tripled from 10 percent in 2008‐09 to 30 percent in 2009‐10.
• The percentage of schools reducing non‐teaching professional support personnel tripled from 15 percent in 2008‐09 to 45 percent in 2009‐10.
• The percentage of schools reducing outside staff development consultants more than doubled from 19 percent in 2008‐09 to 39 percent in 2009‐10.
• The percentage of schools reducing staff‐level hiring more than doubled from 22 percent in 2008‐09 to 49 percent in 2009‐10.
• Survey responders identified 17,597 jobs that are slated for elimination in the 2009‐10 school year.1 (Q11, Q12) Some 49.5 percent of the job eliminations would be through direct staff cuts; 17.8 percent could come from attrition, 8.9 percent would come from declining enrollment, and 23.8 percent would come for ”other” reasons. (Q13).
AASA examined how deep the job cuts are for public schools in both this survey (Q13, Q14) and in the “AASA Impact of the Economic Downturn on School Jobs” (January 2009). When asked to identify the number of expected job cuts, how the cuts are being made, and the types of jobs being cut for the 2009‐10 school year, the “AASA Impact of the Economic Downturn on School Jobs” found:
• Collectively, teaching positions represented 38 percent of the jobs to be cut. Seventeen percent of the positions to be eliminated were teaching positions in the areas of mathematics, science, social studies and English. An additional 21 percent of the positions slated to be cut were teaching positions in foreign language, special education, art, music and physical education positions.

15
• Student services staff positions (librarians, nurses, maintenance, cafeteria and transportation) represented 17 percent of expected cuts. Responders reported that 33 percent of the positions to be eliminated were support staff (teacher aides/assistants, secretaries and central office/administrative positions). More than 60 percent (61 percent) of the positions slated to be cut were direct staff cuts. Attrition accounted for 25 percent of the projected job cuts.
The new study paints a similar picture. When asked to identify the number of expected cuts, how the cuts are being made, and the types of jobs being cut for the 2009‐10 school year, the newest study results are as follows:
• Collectively, teaching positions represented 37.8 percent of the jobs to be cut. Results indicated that 18.8 percent of the positions to be eliminated were teaching positions in the areas of mathematics, science, social studies and English. An additional 18.9 percent of the positions slated to be cut were teaching positions in foreign language, special education, art, music and physical education positions.
• Student services staff positions (librarians, nurses, maintenance, cafeteria and transportation) represented 20.2 percent of expected cuts. Responders reported that 37.5 percent of the positions to be eliminated were support staff (teacher aides/assistants, secretaries, and central office positions). Almost 50 percent (49.5 percent) of the cuts would be direct staff cuts. Attrition accounts for 17.8 percent of the projected job cuts.
School districts of all sizes and types (rural, suburban and urban) were subject to the projected job cuts as a result of the economic downturn, as evidenced in both this study and the January 2009 study. Sobering in this data was the fact that the cuts were not limited to support staff but included in significant numbers core teaching staff, including those in high‐need areas (math, science and special education) that represent hard‐to‐replace positions with significant district investment in their professional development. The uncertainty of the timing of an economic recovery is compounded by the fact that the vast majority of states require school districts to provide employees with timely notification of the termination of their employment.
• In the new study, 90 percent of respondents work in a state with a timeline for notifying staff of termination of employment. (Q3)
Assuming the employees subject to termination under the reduced fiscal capacity of the district are place‐bound, districts buy precious little time to retrieve their workforce should the economy return to a more stable status; otherwise, districts are facing not only the loss of valued employees in teaching disciplines difficult to replace but also lose their investment in professional development.

16
Part V: Impact on School Community, Families and Learning The impact of budget cuts at school is not limited to students. For many communities across the nation, schools are a major employer and a reliable source of revenue. Cost‐saving measures have a direct impact on the community, as well. When schools curtail spending through measures such as reducing payroll, conserving energy use, reducing fuel consumption, deferring maintenance and delaying purchases, the local community is the first to share the effects. When administrators were asked how their districts’ current economic situation has affected schools’ ability to address certain indicators, the results were as follows (responders were asked to rate the indicators as “not at all,” “somewhat,” or “a great deal”): (Q15)
• Maintain employment levels (support staff): 83 percent responded somewhat/a great deal • Provide professional development to administrators: 79 percent responded somewhat/a great
deal • Maintain employment levels (teachers): 77 percent responded somewhat/a great deal • Maintain employment levels (administrative): 75 percent responded somewhat/a great deal • Provide professional development to teachers: 75 percent responded somewhat/a great deal • Recruit/retain qualified staff: 66 percent responded somewhat/a great deal
The continued economic downturn increasingly threatens gains in student achievement, progress in narrowing the achievement gap and the capacity of schools to deliver essential services. Administrators reported that the economic downturn has negatively affected their schools’ capacity to:
• Improve student achievement: 76 percent responded somewhat/a great deal • Close achievement gaps: 75 percent responded somewhat/a great deal • Maintain focus on student learning/instructional improvement: 75 percent responded
somewhat/a great deal • Address the learning needs of all students: 73 percent responded somewhat/a great deal • Meet or exceed state and federal performance assessment levels: 76 percent responded
somewhat/a great deal When considered in total, the economic downturn has exacted a heavy toll on communities, families, and learning. Recouping that loss may mean both replacing tangible items—a relatively easy task—and rebuilding capacity, a task that is difficult at best.

17
Part VI: Demographics This study represented both an opportunity to look at the future impact of the economic downturn in schools and an opportunity to benchmark against responses to earlier AASA studies. The distribution group for this survey included the sample groups completing earlier AASA surveys as well as additional AASA members who had not completed one of the surveys in the AASA Economic Impact series. Beyond repeating questions included in earlier Economic Impact Studies, reaching out to some of the same AASA members helped to establish benchmarks and trends in the data. (Q21)
• Thirty‐one percent of responders completing this survey took the “AASA Impact of Economic Downturn on Schools” survey in October 2008.
• Twenty‐four percent of responders completing this survey took the “AASA Opportunity for Federal Education Funding” survey in November 2008.
• Slightly more than 25 percent (25.4 percent) of responders completing this survey contributed to the School Renovation/Construction Database in December 2008. This database is a collection of ready‐to‐go school renovation, repair and construction projects. School administrators shared this information with both AASA and their congressional delegation in order to leverage stimulus dollar discussions on Capitol Hill.
• Just over 26 percent (26.2 percent) of responders completing this survey took the “AASA Impact of Economic Downturn on School Jobs Snapshot Survey” in January 2009.
A total of 859 school administrators from 48 different states completed the survey over a three‐week period in February and March 2009. (Q20) See Table 5. Table 5: Distribution of Respondents by State
2008 / 2009
AL 20 7 HI 0 0 MA 12 13 NM 5 5 SD 9 23
AK 8 8 ID 7 11 MI 33 26 NY 48 82 TN 8 2
AZ 18 14 IL 57 49 MN 47 59 NC 7 7 TX 30 19
AR 5 6 IN 19 15 MS 3 5 ND 10 15 UT 2 6
CA 18 7 IA 38 28 MO 48 38 OH 24 16 VT 5 7
CO 9 57 KS 15 11 MT 11 14 OK 18 19 VA 29 17
CT 15 41 KY 6 3 NE 17 20 OR 8 12 WA 13 15
DE 1 0 LA 3 1 NV 6 4 PA 49 43 WV 1 6
FL 5 3 ME 13 7 NH 6 8 RI 5 5 WI 51 36
GA 19 13 MD 5 2 NJ 39 26 SC 3 3 WY 3 6

18
Table 6 (below) breaks down the responders by student enrollment and community type. Roughly two‐thirds of respondents work in school districts with enrollments of less than 3,000 students. (Q18) Almost two‐thirds (61.6 percent) of respondents described their school district as rural. (Q19) See Table 6. Table 6: Distribution of Respondents by District Enrollment and Community Type
ENROLLMENT 2008 2009
1 ‐ 999 25.60% 32.9% 1,000 ‐ 2,999 34.70% 31.6% 3,000 ‐ 4,999 13.50% 13.6% 5,000 ‐ 9,999 13.50% 11.8%
10,000 ‐ 24,000 7.70% 6.9% 25,000 ‐ 49,999 3.30% 1.9% 50,000 ‐ 99,999 1.30% 1.2%
100,000 OR MORE 0.60% 0.2% COMMUNITY
Rural 58.00% 61.6% Suburban 31.60% 31.6% Urban 10.40% 6.7%

19
Part VII: Policy Threats, Implications and Conclusion
Over the six months that AASA has studied the impact of the economic downturn on schools, a number of policy threats and implications have become apparent. While the institution of public schooling has demonstrated a capacity to sustain many threats, the scope and number of challenges presented by recent developments are unprecedented and threaten to overwhelm even the resilient public school system. Several of those challenges are detailed below: • AASA members continue to address the economic downturn with a sense of pragmatism. The
persistence of the downturn has shifted the response from tightening budgets and implementing moderate changes to implementing increasingly significant changes, including a marked increase in cuts to areas that more directly impact student achievement.
• Education represents a large share of states’ general fund budgets. With state deficits expected to total more than $350 billion over the next two years, it will be very difficult for states to avoid damaging cuts to education, cuts that will likely deepen as the recession continues. While the $100 billion included for education in the American Recovery and Reinvestment Act will help states backfill some of their budget cuts, it is unlikely that it will be enough to allow states and schools to completely reinstate the resources and capacities they cut in the early stages of the recession. (Center on Budget and Policy Priorities)
• The increasing budget cuts threaten the capacity of schools to deliver essential services and threaten the gains schools have made in student achievement and narrowing the achievement gap. Schools and students face the stark reality of fewer academic instructors, support staff and student services staff when they return to school for the 2009‐10 school year.
• AASA and school administrators recognize and appreciate the sizable one‐time investment in public education that the American Recovery and Reinvestment Act of 2009 represents. As schools begin receiving the funds, it is hoped that federal, state and local leaders will work to maximize both the flow and flexibility of funds to schools.
• As of mid‐March 2009, the national economic downturn had given no indication of reversing itself. That being said, education leaders and policymakers at the state and local levels are well aware of the common lag that exists between a rebound at the federal level and a rebound at the state and local levels. Put more succinctly, state and local leaders recognize that their local situation may continue to worsen, even after the federal economy begins to improve. This awareness will continue to factor into their budget and policy decisions.
• One of the engines to economic recovery is schooling. A strong system of schools fuels the workforce development and economic diversity essential to a recovering economy. Reducing investment in schools when capacity is needed to sustain recovery only prolongs the economic downturn. Therefore, it is critical that Congress and the U.S. Department of Education work to ensure schools have the resources they need to fuel economic recovery and growth.

20
• Disruption of schools by an economic downturn serves to further disable families facing the same economic challenges. Families in distress rely on schools to add stability to their plight at home, whether they are dealing with loss of work, foreclosures or escalating prices. Schools offer the haven needed to help families to return some normalcy to their children’s lives.
Several of the conclusions from the “AASA Study of the Impact of the Economic Downturn on Schools,” conducted in October 2008, still hold true, and are included below: • State and national accountability efforts are interrupted by the economic downturn. The effort to
increase student achievement and reduce the achievement gap between subgroups is clearly facing a threat.
• A new round of costly school finance litigation could occur during economic downturns as the quality, equity, and adequacy of educational services are called into question.
• Particularly in fiscally dependent school districts (that depend on a city or county government for financial support), competing municipal and city entities vie for shrinking revenues and produce interagency competition that can further disrupt the provision of public financing for schools.
• The loss of a qualified workforce can have a critical impact on school district operations. The reduction of valued school personnel represents both a loss of the significant investment made in their development and a very real fiscal and non‐fiscal loss to the immediate community.
• As budget reductions occur in schools, there is an inclination to label all costs not directly associated with instruction as being non‐essential to the quality of schooling. When cuts occur in areas such as deferred maintenance, student health and safety, and extracurricular activities, schools are materially diminished.
• The superintendency is recognized as one of the most challenging positions in the public sector. The pipeline of willing and qualified individuals to fill future vacancies continues to narrow for a variety of reasons, including—but not limited to—the prospect of working on a chronically underfunded mission.

21
References:
Center on Budget Policy and Priorities (http://www.cbpp.org/)
Ellerson, N. (2008). “AASA Impact of the Economic Downturn on School Jobs Snapshot Survey.” Arlington, VA: American Association of School Administrators.
http://www.aasa.org/files/PDFs/Policy/AASA%20Job%20Cuts%20Survey%20FINAL.pdf
Ellerson, N. (2008). “AASA Opportunity for Federal Education Funding Survey.” Arlington, VA: American Association of School Administrators. http://www.aasa.org/files/PDFs/Publications/FINALResults121008Memo.pdf
McCord, R.S., Ellerson, N. et al (2008). “AASA Study of the Impact of the Economic Downturn
on Schools.” Arlington, VA: American Association of School Administrators. http://www.aasa.org/files/PDFs/Publications/AASAEconomicImpactSurvey2008.pdf
Roza, M. (2009). “Schools in Crisis: Making Ends Meet: Projections of State Budget Shortfalls
On K‐12 Public Education Spending and Job Loss.” Seattle, WA: The Center on Reinventing Public Education, University of Washington Bothell.
Legislation: American Recovery and Reinvestment Act of 2009. http://frwebgate.access.gpo.gov/cgi‐bin/getdoc.cgi?dbname=111_cong_bills&docid=f:h1enr.pdf

22
Appendix A: Survey Questionnaire
PART I: Snapshot of Current Economic Situation
1. How would you describe your district's current economic situation?
Inadequately funded Adequately funded
Surplus
2. Is your district financially dependent or independent? Fiscally dependent (fiscal operation subject to approval by other local
government ) Fiscally independent (fiscal operation not subject to approval by other local
government)
3. Does your state/district have a timeline for notifying staff of termination of employment?
If so, what is the timeline? 4. Is your school district facing:
Potential non‐performance on bond repayment schedules? Short term borrowing to meet payroll and/or accounts payable?
Declaration of insolvency? PART II: Feeling the Impact: Which of the following actions has your district considered in the proposed budget for the 2009‐10 school year as a result of the economic downturn?
5. PERSONNEL RELATED
Implemented for 2008‐09 School Year
Considered, Implemented 2009‐10 School
Year
Considered, Delayed
Implementation Considered, Rejected
Never Considered
Furloughing of personnel Laying‐off personnel Freezing outside professional service contracts Reducing non‐teaching professional support personnel Reducing outside staff development consultants Reducing staff‐level hiring
6. BUILDINGS AND FACILITIES RELATED
Deferring maintenance Altering thermostats for less heating and cooling in buildings Closing/consolidating schools

23
Delaying a capital debt (bond) program Outsourcing custodial/maintenance work Reducing custodial services
7. CURRICULUM RELATED Increasing class size Eliminating/delaying instructional improvement initiatives Cutting nonacademic programs (such as after‐school and Saturday enrichment programs) Cutting academic programs (such as academic interventions and Saturday classes) Strengthening identification/screening of non‐resident students Reducing elective courses not required for graduation Deferring textbook purchases Reducing high‐cost course offerings (e.g., occupational education classes) Reducing instructional materials Eliminating field trips
8. OPERATIONS RELATED Reducing operations to four‐day work week (during summer) Reducing operations to four‐day school week (during school year) Cutting bus transportation routes and availability Finding new transportation efficiencies (i.e., tiered pickups) Reducing extracurricular activities Deferring technology purchases Reducing consumable supplies Eliminating non‐essential travel Joining bulk purchasing groups or co‐ops Reducing collaborative planning time w/in school day

24
PART III: Using Funds from the American Recovery and Reinvestment Act of 2009: Funds from the American Recovery and Reinvestment Act of 2009 include roughly $100 billion for America's public schools. Money will be flowing to schools through multiple 'pots' of money. The list below represents a variety of allowable uses under the various 'pots' of funding. Please indicate which of the projects your district would address: (mark all that apply)
9. FACILITIES
High Priority Priority
Low Priority
School modernization and repair Grounds renovation and repair/site improvement Safety and security measures Other
INSTRUCTIONAL MATERIALS
Art education equipment/supplies Classroom equipment/supplies Classroom technology Health equipment (AEDs, beds, wheelchairs) Music education equipment/instruments Physical education equipment Textbooks Career/technical instructional materials Career/technical equipment Start a new career/technical program
PROFESSIONAL DEVELOPMENT Professional development
TECHNOLOGY Connectivity (fiber optics, routers, modems, T1 lines, wireless) Machines (computers, printers, faxes, copiers, etc.) Software Supportive technology devices (for students with needs) Other
PART IV: The Economic Downturn and School Employment 10. Has your district had to eliminate positions for the 2009‐10 school year in
your proposed budget? 11. How many staffing positions—administrative, teaching and support—do
you currently have in your district? (enter whole number, without commas) 12. How many positions would be eliminated? (enter whole number, without
commas) 13. How many positions are being cut due to: (enter whole number, without
commas) Declining enrollment?
Attrition? Staffing cuts?

25
Other? 14. What types of positions are being eliminated?
Core subject classroom teachers Art/music/phys ed teachers Foreign language teachers Special education teachers Teacher aides/assistants
School secretaries School librarians
School nurses Maintenance/cafeteria/transportation staff
Central office/administration Other
PART V: Impact on School Community, Families and Learning: To what extent has your district’s current economic situation affected your schools’ capacity to:
15. Not at All Somewhat A Great Deal
Maintain employment levels (administrative workforce)? Maintain employment levels (teacher workforce)? Maintain employment levels (support staff workforce)? Provide professional development for administrators? Provide professional development for teachers> Recruit/retain qualified staff? Improve student achievement? Close achievement gaps? Maintain focus on student learning/instructional improvement? Address the learning needs of all students, including disabled? Meet or exceed state and federal performance assessment levels? PART VI: Demographics
16. What is your current position? Superintendent
Associate/deputy superintendentAssistant superintendent
Director Principal
Other (please specify)17. If you are a superintendent, how many years have you been a superintendent? 18. How many students were enrolled in your district as of July 2008?

26
1 ‐ 9991000 ‐ 29993000 ‐ 49995000 ‐ 9999
10000 ‐ 2499925000 ‐ 4999950000 ‐ 99999
100000 or more19. My school district is best described as:
RuralSuburban
Urban20. In which state is your school district located? 21. Have you taken any of the AASA surveys related to the economic downturn over the past six months?

27
Appendix B: Survey Response Data 1. How would you describe your district's current economic situation?
Inadequately Funded 644 75%
Adequately Funded 199 23%
Surplus 13 2%
Total 856 100%
2. Is your district fiscally dependent or independent?
Fiscally Dependent (fiscal operation subject to approval by other local government) 320 37%
Fiscally Independent (fiscal operation not subject to approval by other local government) 534 63%
Total 854 100%
3. Does your state/district have a timeline for notifying staff of termination of employment?
Yes 758 90%
No 86 10%
Total 844 100%
4. Is your school district facing:
Potential non-performance on bond repayment schedules? 17
Short-term borrowing to meet payroll and/or accounts payable? 183
Declaration of insolvency? 8
5. Which of the following personnel-related actions have your district considered in the proposed budget for the 2009-10 school year as a result of the economic downturn?
Top number is the count of respondents selecting the option. Bottom % is percent of the total respondents selecting the option.
Implemented for 2008-09 School
Year
Considered, Implemented
2009-10 School Year
Considered, Delayed
Implementation
Considered, Rejected
Never Considered
Furloughing of personnel 35 124 111 71 402
5% 17% 15% 10% 54%
Laying-off personnel 89 364 191 55 129
11% 44% 23% 7% 16%
Freezing outside professional 80 234 230 48 197

28
service contracts 10% 30% 29% 6% 25%
Reducing non-teaching professional support personnel
128 381 211 39 80
15% 45% 25% 5% 10%
Reducing outside staff development consultants
153 324 170 29 146
19% 39% 21% 4% 18%
Reducing staff-level hiring 186 415 147 20 73
22% 49% 17% 2% 9%
6. Which of the following buildings and facilities related actions have your district considered in the proposed budget for the 2009-10 school year as a result of the economic downturn?
Top number is the count of respondents selecting the option. Bottom % is percent of the total respondents selecting the option.
Implemented for 2008-09 School
Year
Considered, Implemented
2009-10 School Year
Considered, Delayed
Implementation
Considered, Rejected
Never Considered
Deferring maintenance 177 276 157 83 133
21% 33% 19% 10% 16%
Altering thermostats for less heating and cooling in buildings
376 208 106 33 102
46% 25% 13% 4% 12%
Closing/consolidating schools 41 63 91 65 533
5% 8% 11% 8% 67%
Delaying a capital debt (bond) program 67 91 90 55 490
8% 11% 11% 7% 62%
Outsourcing custodial/maintenance work 46 33 77 104 534
6% 4% 10% 13% 67%
Reducing custodial services 128 178 149 78 288
16% 22% 18% 10% 35%
7. Which of the following curriculum-related actions have your district considered in the proposed budget for the 2009-10 school year as a result of the economic downturn?
Top number is the count of respondents selecting the option. Bottom % is percent of the total respondents selecting the option.
Implemented, 2008-09 School
Year
Considered, Implemented
2009-10 School Year
Considered, Delayed
Implementation
Considered, Rejected
Never Considered
Increasing class size 112 367 179 51 121
13% 44% 22% 6% 15%
Eliminating/delaying instructional improvement initiatives
93 258 212 80 174
11% 32% 26% 10% 21%
Cutting nonacademic programs (such as after-school and Saturday enrichment programs)
75 217 198 85 232
9% 27% 25% 11% 29%
Cutting academic programs (such as academic interventions and Saturday classes)
54 177 193 94 282
7% 22% 24% 12% 35%
Strengthening identification/screening of non-resident students
137 115 79 31 440
17% 14% 10% 4% 55%
Reducing elective courses not required for 58 218 164 63 310

29
graduation 7% 27% 20% 8% 38%
Deferring textbook purchases 132 275 158 54 197
16% 34% 19% 7% 24%
Reducing high cost course offerings (e.g., occupational education classes)
43 133 181 81 364
5% 17% 23% 10% 45%
Reducing instructional materials 152 300 161 41 162
19% 37% 20% 5% 20%
Eliminating field trips 151 195 251 74 139
19% 24% 31% 9% 17%
8. Which of the following operations-related actions have your district considered in the proposed budget for the 2009-10 school year as a result of the economic downturn?
Top number is the count of respondents selecting the option. Bottom % is percent of the total respondents selecting the option.
Implemented, 2008-09 School
Year
Considered, Implemented 2009-
10 School Year
Considered, Delayed
Implementation
Considered, Rejected
Never Considered
Reducing operations to four-day work week (during summer)
117 76 132 89 398
14% 9% 16% 11% 49%
Reducing operations to four-day school week (during school year)
22 18 87 152 528
3% 2% 11% 19% 65%
Cutting bus transportation routes and availability
111 188 157 93 269
14% 23% 19% 11% 33%
Finding new transportation efficiencies (i.e., tiered pick-ups)
146 186 149 45 289
18% 23% 18% 6% 35%
Reducing extra-curricular activities 79 228 210 97 202
10% 28% 26% 12% 25%
Deferring technology purchases 130 266 208 69 153
16% 32% 25% 8% 19%
Reducing consumable supplies 211 348 148 31 91
25% 42% 18% 4% 11%
Eliminating non-essential travel 279 348 123 16 64
34% 42% 15% 2% 8%
Joining bulk purchasing groups or co-ops 425 193 77 24 98
52% 24% 9% 3% 12%
Reducing collaborative planning time w/in school day
47 103 118 81 448
6% 13% 15% 10% 56%

30
9. Funds from the American Recovery and Reinvestment Act of 2009 include roughly $100 billion for America's public schools. Money will be flowing to schools through multiple 'pots' of money. The list below represents a variety of allowable uses under the various 'pots' of funding. Please indicate which of the projects your district would address: (mark all that apply)
Top number is the count of respondents selecting the option. Bottom % is percent of the total respondents selecting the option.
High Priority Priority Low Priority
School modernization and repair 445 249 134
54% 30% 16%
Grounds renovation and repair/site improvement
220 270 327
27% 33% 40%
Safety and security measures 328 316 181
40% 38% 22%
Art education equipment/supplies 53 231 520
7% 29% 65%
Classroom equipment/supplies 195 399 233
24% 48% 28%
Classroom technology 481 293 63
57% 35% 8%
Health equipment (AEDs, beds, wheelchairs) 49 222 538
6% 27% 67%
Music education equipment/instruments 55 296 464
7% 36% 57%
Physical education equipment 36 254 521
4% 31% 64%
Textbooks 278 363 175
34% 44% 21%
Career/Technical Instructional Materials 128 328 345
16% 41% 43%
Career/Technical Equipment 152 305 348
19% 38% 43%
Start Up New Career/Technical Program 110 163 535
14% 20% 66%
Professional Development 306 389 126
37% 47% 15%
Connectivity (Fiber optics, routers, modems, T1 lines, wireless)
322 314 182
39% 38% 22%
Machines (computers, printers, faxes, copiers, etc)
256 353 214
31% 43% 26%
Software 251 385 170
31% 48% 21%
Supportive technology devices (for students with needs)
216 393 208
26% 48% 25%
31
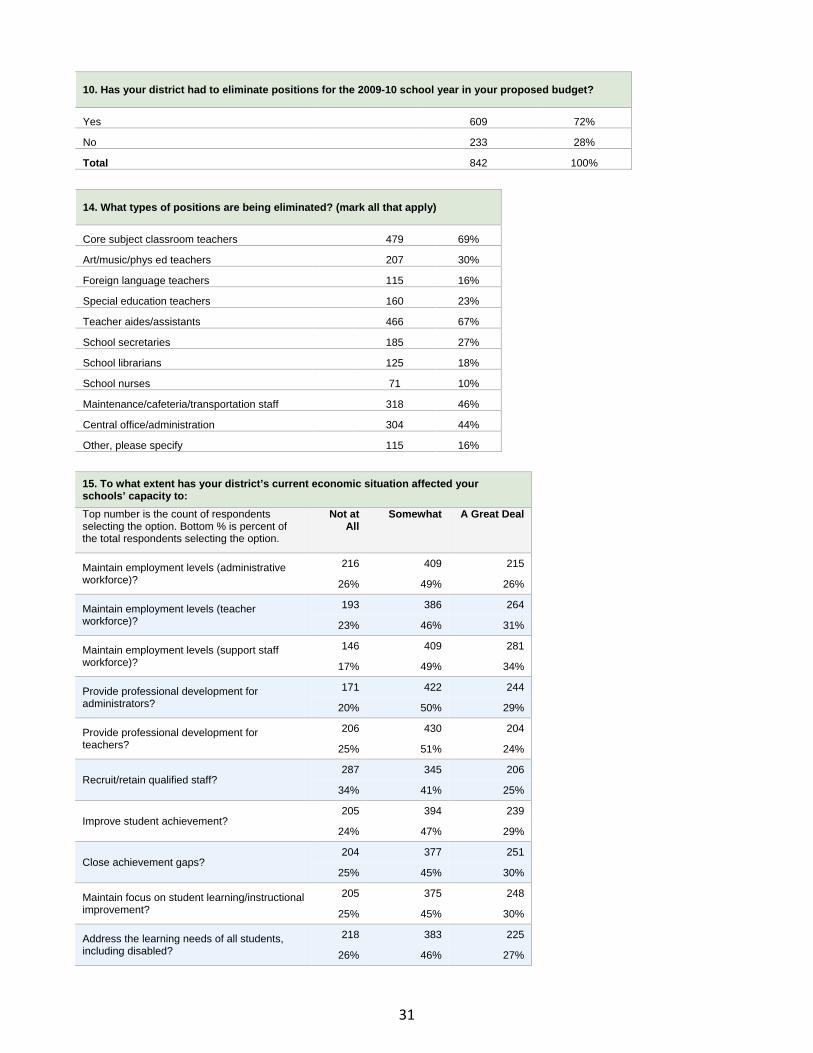
10. Has your district had to eliminate positions for the 2009-10 school year in your proposed budget?
Yes 609 72%
No 233 28%
Total 842 100%
14. What types of positions are being eliminated? (mark all that apply)
Core subject classroom teachers 479 69%
Art/music/phys ed teachers 207 30%
Foreign language teachers 115 16%
Special education teachers 160 23%
Teacher aides/assistants 466 67%
School secretaries 185 27%
School librarians 125 18%
School nurses 71 10%
Maintenance/cafeteria/transportation staff 318 46%
Central office/administration 304 44%
Other, please specify 115 16%
15. To what extent has your district’s current economic situation affected your schools’ capacity to: Top number is the count of respondents selecting the option. Bottom % is percent of the total respondents selecting the option.
Not at All
Somewhat A Great Deal
Maintain employment levels (administrative workforce)?
216 409 215
26% 49% 26%
Maintain employment levels (teacher workforce)?
193 386 264
23% 46% 31%
Maintain employment levels (support staff workforce)?
146 409 281
17% 49% 34%
Provide professional development for administrators?
171 422 244
20% 50% 29%
Provide professional development for teachers?
206 430 204
25% 51% 24%
Recruit/retain qualified staff? 287 345 206
34% 41% 25%
Improve student achievement? 205 394 239
24% 47% 29%
Close achievement gaps? 204 377 251
25% 45% 30%
Maintain focus on student learning/instructional improvement?
205 375 248
25% 45% 30%
Address the learning needs of all students, including disabled?
218 383 225
26% 46% 27%

32
Meet or exceed state and federal performance assessment levels?
186 381 256
23% 46% 31%
16. What is your current position?
Superintendent 796 94%
Associate/deputy superintendent 8 1%
Assistant superintendent 10 1%
Director 20 2%
Principal 1 0%
Other 13 2%
Total 848 100%
17. If you are a superintendent, how many years have you been a superintendent?
Less than 1 year 43 5%
1-5 years 262 32%
6-10 years 218 27%
11-15 years 123 15%
More than 15 years 162 20%
Total 808 100%
18. How many students were enrolled in your district as of July 2008?
1 - 999 278 33%
1,000 - 2,999 267 32%
3,000 - 4,999 115 14%
5,000 - 9,999 100 12%
10,000 - 24,999 58 7%
25,000 - 49,999 16 2%
50,000 - 99,999 10 1%
100,000 or more 2 0%
Total 846 100%
19. My school district is best described as
Rural 522 62%
Suburban 268 32%
Urban 57 7%
Total 847 100%

33
20. What state is your school district located in?
AL 7 1% LA 1 0% OH 16 2%
AK 8 1% ME 7 1% OK 19 2%
AZ 14 2% MD 2 0% OR 12 1%
AR 6 1% MA 13 2% PA 43 5%
CA 7 1% MI 26 3% RI 5 1%
CO 57 7% MN 59 7% SC 3 0%
CT 41 5% MS 5 1% SD 23 3%
DE 0 0% MO 38 5% TN 2 0%
FL 3 0% MT 14 2% TX 19 2%
GA 13 2% NE 20 2% UT 6 1%
HI 0 0% NV 4 0% VT 7 1%
ID 11 1% NH 8 1% VA 17 2%
IL 49 6% NJ 26 3% WA 15 2%
IN 16 2% NM 5 1% WV 6 1%
IA 28 3% NY 83 10% WI 36 4%
KS 11 1% NC 7 1% WY 6 1%
KY 3 0% ND 15 2% Total 842 100%
21. Have you taken any of AASA's surveys examining the impact of the economic downturn on schools in the last five months? (mark all that apply)
Impact of Economic Downturn on Schools (October 2008) 266 31%
Opportunity for Federal Funding Survey (November 2008) 206 24%
School Renovation/Construction Database (December 2008) 218 25%
Impact of Economic Downturn on School Jobs Survey (January 2009) 225 26%

34
The American Association of School Administrators, founded in 1865, is the professional organization for more than 13,000 educational leaders across the United States. AASA’s mission is to support and develop effective school system leaders who are dedicated to the highest quality public education for all children.
801 N. Quincy Street
Suite 700 Arlington, VA 22203
703‐528‐0700 www.aasa.org