Embed Size (px)
Citation preview

i
SYARAHAN PERDANA 2011
GETTING TO KNOW OUR BUILDINGS BETTER: Ventilation, Thermal Comfort, Air Freshness, Indoor Air Quality (IAQ),
Sick Building Syndrome (SBS)

ii
iii
SYARAHAN PERDANA 2011
GETTING TO KNOW OUR BUILDINGS BETTER: Ventilation, Thermal Comfort, Air Freshness, Indoor Air Quality (IAQ),
Sick Building Syndrome (SBS)
Professor Ir. Mohammad Zainal bin Md Yusof Centre for Energy and Industrial Environment Studies (CEIES)
Faculty of Mechanical and Manufacturing Engineering Universiti Tun Hussein Onn Malaysia
Parit Raja, Batu Pahat Johor Darul Takzim
2011

iv
© Penerbit UTHM First Edition 2011 All Rights reserved. No part of this publication may be reproduced, stored in a retrieval system, or transmitted, electronic, mechanical photocopying, recording or otherwise, without the prior permission in writing of the Publisher, nor be otherwise circulated in any form of binding or cover other than that in which it published and without a similar condition being imposed on the subsequent purchaser. Perpustakaan Negara Malaysia Cataloguing—in—Publication Data Mohammad Zainal Md. Yusof Getting to know our buildings better: ventilation, thermal comfort,
air freshness, indoor air quality (IAQ), sick building syndrome (SBS) / Prof. Ir. Mohammad Zainal bin Md Yusof. (Syarahan perdana 2011) Bibliography: p. ISBN 978-967-5457-88-3 1. Construction industry—Environmental aspect. 2. Buildings—Quality control—Standards. 4. Speeches, addresses, etc. I. Title. II. Series. 690
Terbitan : Pejabat Penerbit Universiti Tun Hussein Onn Malaysia 86400 Parit Raja, Batu Pahat Johor Darul Ta’zim Tel : 07-453 7454 / 7051 Faks : 07-453 6145 Laman Web : http://penerbit.uthm.edu.my/ E-mel : [email protected]

v
Acknowledgements
In the name of Allah, the Merciful, the Compassionate. My sincere gratitude to these individuals for making this book a reality. I would like to thank those for their support: all fellow colleagues especially members of the Indoor
Environment Research Group (IERG), Assoc. Prof. Adnan Husain, Dr. Mutalib Leman, Pn. Azian Hariri and Mr. Azizi for their unfailing support; fellow students (graduates and
undergraduate), results of whose works have been presented in this book; and the Universiti Tun Hussein Onn Malaysia for providing the opportunity for me to write and publish something that is dear and close to my heart and mind. Members of my family, especially so my dear wife Sa’adiah binti Mohammed (Noni), many thanks for your doa
and patience. And last, but not least, to my beloved parents, thanks for your love and kindness and all my teachers who have taught me the meaning of life.

vi

vii
Table of Content
Title
INTRODUCTION
1.0 COMMON TERMINOLOGY
1.1 Ventilation
1.2 Thermal Comfort
1.3 Indoor Air Quality (IAQ)
1.3.1 Ventilation Rate
1.4 Freshness and Odours
1.5 Building Related Illness (BRI) and Sick Building Syndrome (SBS)
STANDARDS AND REGULATIONS RELATING TO INDOOR ENVIRONMENT QUALITY (IEQ)
2.1 Thermal Comfort-ASHREA Standard 55-2004
2.1.1 The Heat Exchange Method
2.2 Indoor Air Quality (IAQ)-ASHREA Standard 62.1-2007
2.2.1 Ventilation Rate Procedure
2.2.2 Indoor Air Quality Procedure
2.3 Indoor Contaminants and Their Sources
METHODOLOGY FOR IAQ RESEARCH
3.1 Thermal Comfort Measurements
3.2 Measurement of Indoor Contaminants
3.3 Air Change Rate Measurement
3.4 Subjective Assessment-Questionnaires
Page
1
1
1
2
3
3
5
7
9
9
9
10
11
11
11
15
15
15
19
19

viii
INDOOR AND INDUSTRIAL ENVIRONMENTAL RESEARCH AT
UTHM
4.1 Thermal Comfort and IAQ of Factory Environment in Malaysia
4.2 Effects of Outdoor Air Pollution (Haze) on Indoor Air Quality
4.3 The Effectiveness of Under Floor Air Distribution (UFAD) System in Indoor Environmental Control
4.4 Thermal Comfort, Freshness and Indoor Air Quality (IAQ) in Offices
4.5 Studies of Thermal Comfort, IAQ and SBS in Governmental Office 4.6 Environmental Quality Index (EQI) For Engineering Laboratory 4.7 Indoor Environmental Quality and Human Productivity and Health CONCLUSION
REFERENCES
APPENDIX
BIODATA
23
23
24
24
26
28
30
32
35
37
41
43
ix
PREFACE In the name of Allah, the Merciful, the Compassionate. Peace and blessing be upon Prophet Muhammad, his family and companions. From the Glorious Qur’an “It is He, Who sends down rain from the sky, from it ye drink, and out of it (grows) the vegetation on which ye feed your beasts to pasture. With it He produces for you corns, olives, date-palms, grapes and all kinds of fruit: Verily this is a Sign for those who reflect. He has subject to you; the night and the day; and the sun and the moon; and the stars are in subjection by His command: Verily in these are Signs for men who are wise. And whatsoever He has created for you in the earth which He has multiplied in varying colours (and qualities): Verily in this is a Sign for men who celebrate the praises of Allah (in gratitude). And He it is WHO has made the sea subject, that ye may eat thereof flesh that is fresh and tender, and that ye may extract there from ornaments to wear; and thou seest ships therein that plough the waves, that ye may seek (thus) of the bounty of God and that ye may be grateful. And He has set up on the earth, mountains standing firm, lest it should shake with you; and rivers and roads; that ye may guide themselves. SadakalLah-al-Azim. (Translation A.Yusuf Ali); Chapter XVI : The Bee; Verse 10-15) Knowing our buildings better - Why? We spend more than 80 percent of our daily lives indoors be it at work place, schools, place of leisure and homes. However, very little do we know or understand the environment in which we are in. For example, many could not appreciate why a fire-door has to be kept close all the time or the need for an exhaust fan or vent in a particular location of a building. The management of indoor environment can be very complex and not more than being able to open windows and having an heating, ventilating and air conditioning (HVAC) system installed. Managing the indoor environment so that occupants feel comfortable and healthy is therefore very important. One intriguing fact is the way in which we; the occupants, take it for granted the indoor environment in which we are in, completely contrary to the way in which we manage our brand new cars or others valuables. For example, why we seldom ask the sale personnel the smell/odour that is to be gassed out by the new carpets and furniture when purchasing them? It is simply that we have not been educated to explain what we expect and want of the indoor environment? The human body reacts and responds to different environmental stresses. A building that is not healthy; it’s the occupant’s health that going to counts. It is the objective of this book to introduce the elements of healthy indoor environment, to give insights to human needs during interactions with and reaction to the indoor environment and how to manage the indoor environment. It is just an introductory reading to the subject of the indoor environment and I hope you enjoy reading it. Mohammad Zainal Bin Md Yusof UTHM, Johor November 2011

x

xi
ABSTRACT
Common terminologies related to the lecture were reviewed to give a basic understanding on the subject matters and to gain benefit from the discourse. Standards pertaining to Comfort, Ventilation and IAQ practices and methodology on carrying out indoor environmental quality (IEQ) study were reviewed. Some important research findings on thermal comfort, ventilation, IAQ and SBS in buildings, at UTHM were presented. Study on thermal comfort perception of Malaysian subjects revealed that the neutral temperature was 25.6 0C which is 3.1 0C higher than that recommended by the ASHREA Standard 55-1995. Studies on the SBS in offices of selected Governmental and Institutional Buildings revealed that all the said buildings suffer from the symptoms, the extent of which dependent on the HVAC system and its maintenance proper. A method for the classification of engineering laboratories hygiene and safety was proposed by means of an index i.e. environmental quality index, EQI, the usage of which could be extended to other premises if not of the same nature. The resources and R & D potentials of the Industrial Environment Laboratory, Centre for Energy and Industrial Environment (CEIES), at UTHM were presented.
KEY WORDS
Air change rate, comfort, freshness, indoor air/environmental quality, environmental quality index (EIQ), SBS,

xii

1
CHAPTER 1
INTRODUCTION
Presently, people are spending a greater portion of their lives (about 90%) inside buildings. Therefore one of the primary objectives of the HVAC designer is to maintain a clean, healthy indoor environment for these occupants and this is the primary purpose of an HVAC system in a building. Since ventilation and indoor air quality (IAQ) are inexorably linked, they will be treated together in this discussion. The physiological reactions to indoor contaminants, coupled with the psycho-social stresses of the modern office environment and the wide range of human susceptibility to indoor contaminants, have led to acute building sickness such as sick building syndrome (SBS), building-related illness (BRI), and multiple chemical sensitivity (MCS).
The extent of IAQ problems is just beginning to surface. It has been estimated that up to 30% of the buildings today suffer from Sick Building Syndrome (SBS). This condition is defined as when more than 20% of the surveyed occupants experience symptoms indicative of an IAQ problem (headaches, fatigue, nausea, eye irritation, and throat irritation) and these symptoms are alleviated by leaving the building.
IAQ is relatively a new issue in the workplace and frequent media coverage of the issues have alerted HVAC System designers, building operators/owners and facilities managers to a potential crisis. Many of these concerns over the air we breathe can be directly linked to the building mechanical system. Often, when the HVAC System is malfunctioning or simply is not well maintained, indoor air problems result.
WHO has estimated that as many as one-third of the world’s buildings can be considered “sick”. According to the U.S. Environmental Protection Agency (EPA) and WHO, 60 percent of American buildings have serious (20 percent) and somewhat serious (40 percent) IAQ problems (Ed Bas 2004).
1.0: COMMOM TERMINOLOGY
To begin with it will be very useful to review basic understanding on the subject matters so as to gain benefit from the discourse. Common terminology associated with the area of discussion will be reviewed briefly.
1.1. Ventilation
Ventilation is providing adequate clean outdoor air into a building for the purpose of maintaining occupants’ comfort, health and keeping indoor contaminants at acceptable levels. Good ventilation provides outside air, removes or dilutes stale contaminated air and controls the air temperature and movement, and also the building pressurization within the space. Outside air can be filtered to remove dirt, dust and other unwanted impurities and this ‘fresh’ air is used to replace stale air. There are three major types of indoor pollutants which are gaseous emissions, particulate emissions and odours.

2
1.2 Thermal Comfort
One of the functions of the HVAC system is to maintain comfort condition inside a building throughout the year. Thermal comfort is defined as that condition of the mind which expresses satisfaction with the thermal environment (ASHREA, 2004a) Worry, ill health or distractions produce a sense of discomfort and some stress. Slight stress also tends to reduce the acceptability or tolerance to other things. Thermal comfort is therefore very much a subjective experience embracing all the senses of human being. The ASHREA Standard 55-2004 specifies temperature ranges that are linked to humidity that are perceived as “comfortable” are 22.8 to 26.1 0C (73 to 79 0F) in summer and 20.0 to 23.6 0C (68 to 74.5 0F) in winter, and humidity limits based on consideration of dry skin, eye irritation, respiratory health, microbial growth, and other moisture-related phenomena. These comfort conditions are represented into the comfort zone chart as shown in Figure 1.1
Figure 1.1: ASHREA Comfort Chart
Thermal comfort can be controlled via the heating, ventilating and air conditioning (HVAC) system. Heating can be provided by means of convection, conduction, radiation and air conditioning systems. Humidity can be controlled by providing humidification/dehumidification systems via an air conditioning system or locally. In addition, a person can adjust one’s clothing and metabolism/types of activities.

3
1.3 Indoor Air Quality (IAQ)
What are IAQ and acceptable IAQ? Indoor air quality refers to the condition of the air inside buildings, including the extent of pollutant caused by smoking, dust mites, mold spores, and radon and other gases, including chemicals off-gassed from construction materials, furnishings, finishes, and equipment (EPA 1995).
Acceptable IAQ, as defined by the American Society of Heating, Refrigerating, and Air-Conditioning Engineers Inc. (ASHREA) Standard 62.1-2007, as “air in which there are no known contaminants at harmful concentrations as determined by cognizant authorities and with which a substantial majority (80% or more) of the people exposed do not express dissatisfaction” (ASHREA 2004b).
In order to achieve acceptable indoor air quality, the Standard recommends two procedures: the Ventilation Rate Procedure-specifying the quality and quantity of ventilation air for a space and the Indoor Air Quality Procedure-requiring the control of all known contaminants to some specified acceptable levels within a space. However, between the two procedures, the Ventilation Rate Procedure is the most widely used.
1.3.1 Ventilation Rate Procedure
How do the ventilation/fresh/outdoor air brought into a building? Fresh or outdoor air is brought into the building mainly by the HVAC system via the outdoor air intake and mixed with returned or recirculated air, blow across the cooling coil and then distributed accordingly into spaces of a building by means of ducting (see Figure 1.2). The quantity of fresh air required is determined by either procedure described earlier.

4
Figure 1.2: Schematic Layout of a HVAC System
There has been opposing forces as to the amount of fresh air requirement for maintaining of health and safety indoor. However, these opposing forces have compromised on a nominal minimum of 20 cfm per person of outside air as providing adequate IAQ at a reasonable energy cost. Some applications, such as conference rooms where smokers are present, hospitals, factories and school locker rooms may require even higher rates of outside air flow. ASHRAE Standard 62-1989 is currently the document referenced by building codes in regard to IAQ solutions.
In residential buildings the current recommendation is a minimum of about half an air-change per hour (1/2 AC/hr). For example, a 2000 square foot house with eight foot ceilings holds (2000x8=) 16,000 cubic feet of air. Using this rule of thumb, about half this volume or 8000 cubic feet of outside air should enter or brought into the house each hour. While this may sound like a lot, most old homes and many newer homes have two to four times that air flow passing through them. This flow of outside air is called infiltration, and comes primarily from two sources i.e. the wind and stack effects.
Wind causes a pressure on the upwind side of the house and a vacuum or suction on the leeward side. This pressure forces outside air in around doors, windows, electrical outlets and utility penetrations. While it is hard to believe, the cracks and gaps in a typical home add up to the equivalent of a 2x2 ft window being left open year-round.

5
The second source of infiltration is called stack effect. In winter, the buoyancy of the heated air causes it to rise through the attic (just like smoke in a smoke stack). The leaving air is replaced with cold outside air entering the basement or through the floor. In summer the process is reversed, with cool inside air escaping under doors and hot outside air entering around ceiling lights and through bathroom vent fans.
While infiltration is an adequate source of outside air for most residences, commercial buildings must resort to forced ventilation. Not only are there more people in these structures, there is also proportionately less outside wall area through which infiltration can occur. Stack effect can also be a major problem in high rise buildings, but not because of the energy cost. Vertical shafts such as elevators, pipe chases, and air ducts can cause pressure differences great enough to cause doors to whistle or even force them open (or make them impossible to open!). These vertical shafts are of special concern to fire safety designers, since they allow the uncontrolled movement of smoke and toxic fumes in a fire situation.
1.4 Freshness and Odours
Quoting Sir Leonard Hill (in Bedford 1974), “For air to feel fresh it must have such cooling and evaporative power as suffices to keep the head pleasantly cool and the skin free from sensible perspiration.”
The word “freshness” is very subjective and has a wide range of meaning which can connotes cleanliness, ventilated, salubrious, and cool and invigorating. In environmental design, it is the ventilated and salubrious characteristics of the air which are being sought for. The word “airy” can mean well ventilated or draughty but with narrower span of meaning. The antonyms could be stale i.e. no longer fresh and musty, or stuffy i.e. muggy, close, poorly ventilated. An environment which is warm to cool and airy is fresh whereas warm to hot and airless is stuffy (D. J. Croome et al. 1988).
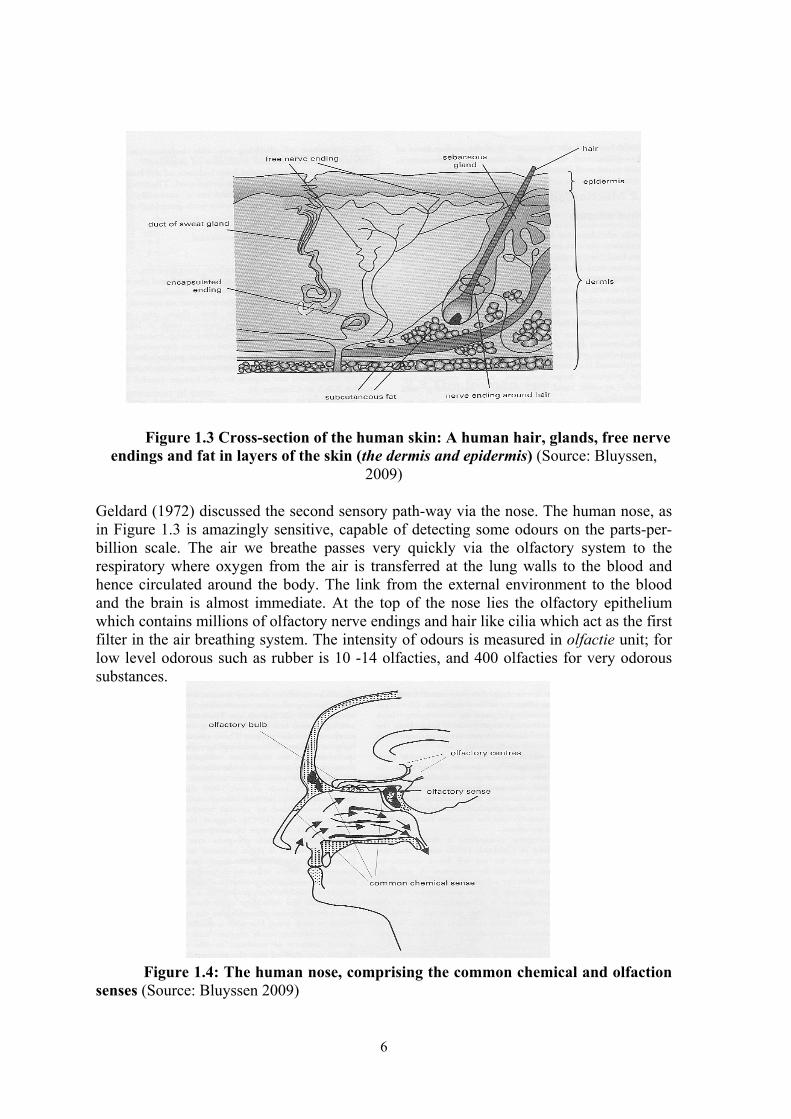
The impression and sensation of freshness is stimulated along two sensory pathways namely the skin (Figure 1.3) and the nose. The free or encapsulated nerve endings unevenly spread over the skin are very sensitive to temperature changes; variations of less than 0.010C/s can be perceived. Air stream stimulus can cause three physical mechanisms such as a heat exchange if temperature gradient between the air and the skin exist or a kinetic pressure on the skin or a mass transfer if the vapour pressure of air stream is different from that at the skin’s surface. All these effects contribute to the impression of freshness, the level of which depends on the sensitivity of the nerve receptors and their body location.
6
Figure 1.3 Cross-section of the human skin: A human hair, glands, free nerve endings and fat in layers of the skin (the dermis and epidermis) (Source: Bluyssen,
2009)
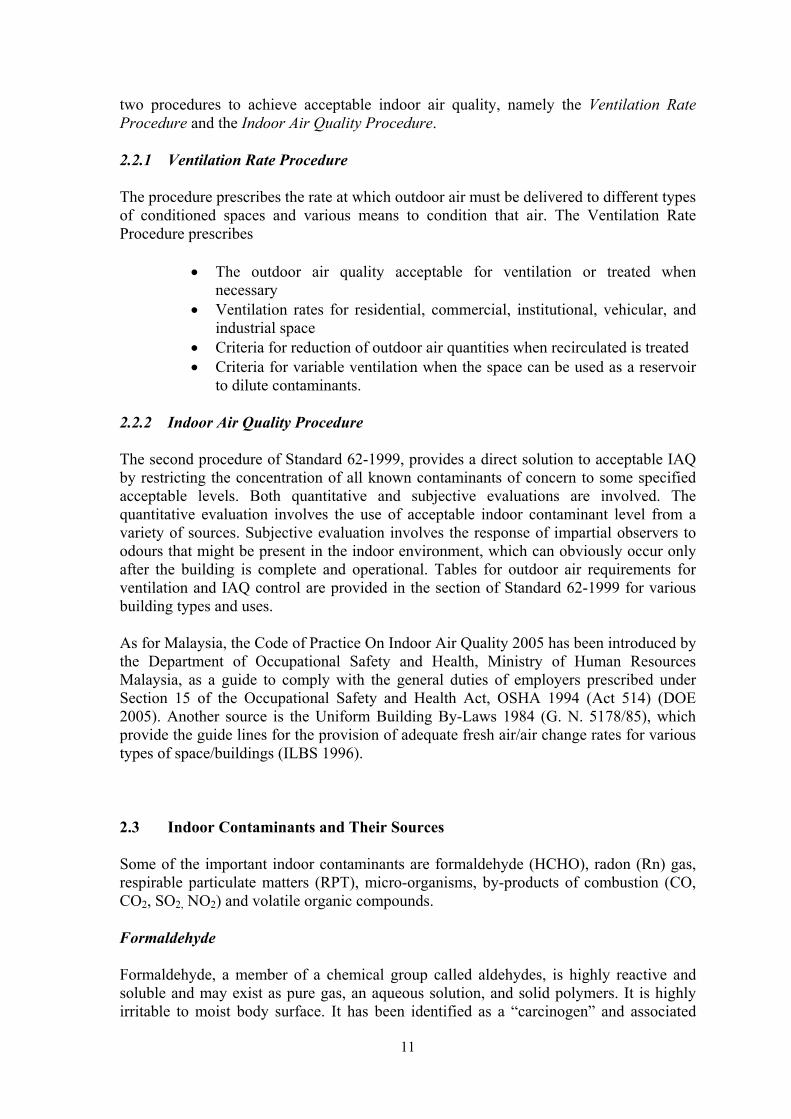
Geldard (1972) discussed the second sensory path-way via the nose. The human nose, as in Figure 1.3 is amazingly sensitive, capable of detecting some odours on the parts-per-billion scale. The air we breathe passes very quickly via the olfactory system to the respiratory where oxygen from the air is transferred at the lung walls to the blood and hence circulated around the body. The link from the external environment to the blood and the brain is almost immediate. At the top of the nose lies the olfactory epithelium which contains millions of olfactory nerve endings and hair like cilia which act as the first filter in the air breathing system. The intensity of odours is measured in olfactie unit; for low level odorous such as rubber is 10 -14 olfacties, and 400 olfacties for very odorous substances.
Figure 1.4: The human nose, comprising the common chemical and olfaction senses (Source: Bluyssen 2009)

7
Fanger et al. (1988), uses subjective evaluations of air quality defined in olf and decipol units. One olf represents the source strength or power of the air pollution (bio effluents) relative to a standard person; the olf is comparable to lumens of light or watts of noise. The level of air pollutant perceived by a person is quantified in decipols, analogous to lux or decibels. One decipol is the pollution caused by one person ventilated by 10 litres/s of unpolluted air.
It is recognised in practice that body odour is one of the major pollutants in such spaces of lecture halls, classrooms, theatres and meeting rooms where smoking is prohibited. Researchers are experimenting with injecting odours into building air supplies. In one particularly interesting Japanese study, three different scents were used throughout the day. In the morning, a fresh forest odour welcomed the workers upon arrival. A second scent was used right after lunch to combat the sleepiness that accompanies a full belly. Finally, a third odour was injected in the late afternoon to encourage the workers to keep pushing until quitting time.
1.5 Buildings Related Illness (BRI) and Sick Building Syndrome (SBS)
As early as the 1940s, poor indoor quality was causing building related illness (BRI) that doctors did not understand. These illnesses, among others, were known such as total allergy, chemical hypersensitivity, and environmental illness but today it is most commonly called as multiple chemical sensitivity (MCS). MCS is an illness in which an individual reports sensitivity when exposed to numerous chemicals and other irritants at very low levels of concentration. Exposure can affect one or more of the body’s organ systems (EPA 2003).
The extent of IAQ problems is just beginning to surface. It has been estimated that up to 30% of the buildings today suffer from Sick Building Syndrome (SBS). This condition is defined as when more than 20% of the surveyed occupants experience symptoms indicative of an IAQ problem (headaches, fatigue, nausea, eye irritation, and throat irritation) and these symptoms are alleviated by leaving the building. This situation has created jobs not only for clinicians who sample these contaminants and for technicians who clean ductwork and maintain control devices, but also for lawyers who view this general malaise of medical conditions and the deep pockets of the owners as easy fodder.

8

9
CHAPTER 2
STANDARDS AND REGULATIONS RELATING TO INDOOR ENVIRONMENT QUALITY (IEQ)
2.1 Thermal Comfort
The ASHREA Standard 55-2004 gives the conditions for an acceptable thermal environment. In most studies of comfort, involve the use of the ASHREA thermal sensation scale. This scale relates words describing thermal sensations felt by a participant to a corresponding number. The scale range from -3 (cold) to +3 (hot) ; -3 (cold), -2 (cool), -1 (slightly cool), 0 (neutral), +1 (slightly warm), +2 (warm), +3 (hot). These comfort conditions are represented into the comfort zone chart as shown in Figure 1.1 previously.
2.1.1 The Heat-Exchange Method
It is important to analyse the heat balance of the human body in order to evaluate the general thermal state of a body, both in terms of comfort and heat or cold stress: a positive thermal storage indicates that the environment is too warm and vice versa. To maintain comfort, the mean skin temperature must be within certain limits and evaporative heat loss must be low. The heat-exchange approach is the basis for current thermal comfort criteria and led to several indices. Data from laboratory studies focused on the heat exchange between the human body and the thermal environment and the physiological conditions that are required for human comfort give rise to the many indices for thermal comfort, some of which are:
Operative Temperature (to): the uniform temperature of a black environment in which a person exchanges the same amount of heat via radiation and convection as in the real non-uniform environment. In most cases, if the different between the mean radiant temperature (tmrt) and the air temperature (ta) is small (< 4oC), the operative temperature is calculated as the mean of the air temperature and the mean radiant temperature.
Effective Temperature (ET): the operative temperature with a relative humidity of 50 per cent, which causes the same heat loss in the actual situation.
Predicted mean vote (PMV): an index that predicts the thermal sensation of a person for a certain combination of environmental parameters and a known clothing resistance (clo) and metabolism (M). One clo is defined as the thermal insulation required to keep a seated person comfortable, at temperature 21oC (ISO, 2005).The PMV index predicts the mean value of a large group of people an a seven-point scale (+3: hot; +2: warm; +1: slightly warm; 0: neutral; -1: slightly cool; -2: cool; -3: cold).
Although the PMV is deducted for stationary conditions, it can also be applied in situation of small fluctuation of more than one variable, if the mean of these variables during one hour before is applied. PMV values should only be used for values between -2 and +2, and only if the six main parameters lie in the describe ranges:

10
M = metabolism:46-232 W/m2; Id = thermal resistance of clothing: 0- 0.310 m2oC/W; Ta = air temperature: 10 – 30oC; Tmrt = mean radiant temperature: 10 – 40oC; Va = air velocity: 0 – 1 m/s; Pa = partial water vapour pressure: 0 – 270 Pa.
The metabolism can be estimated with ISO 8996 (ISO, 2004) and the thermal clothing insulation with ISO/ DIS 9920 (ISO, 2006a), taking into account the type of activity and the season. For varying metabolic rates, the time-weighted average for the previous one hour period should be used and for seated person, the insulation of the chair must be taken into account. The environmental parameters can be measured as of ISO 7726 (ISO, 1998).
When the PMV value has been determined, the predicted percentage of dissatisfied (PPD) can be calculated using the equation:
PPD = 100 – 95 e (-0.3353 * PMV4 – 0.2179 PMV2)
Or from the Figure 2.1.
Figure 2.1: Predicted percentage of dissatisfied (PPD) as a function of predicated mean vote (PMV)
2.2 Indoor Air Quality (IAQ)
The ASHREA Standard 62.1-2007, Ventilation for acceptable indoor air quality, has been accepted and used by researchers and designers world wide. The standard describes
11
two procedures to achieve acceptable indoor air quality, namely the Ventilation Rate Procedure and the Indoor Air Quality Procedure.
2.2.1 Ventilation Rate Procedure
The procedure prescribes the rate at which outdoor air must be delivered to different types of conditioned spaces and various means to condition that air. The Ventilation Rate Procedure prescribes
The outdoor air quality acceptable for ventilation or treated when necessary
Ventilation rates for residential, commercial, institutional, vehicular, and industrial space
Criteria for reduction of outdoor air quantities when recirculated is treated Criteria for variable ventilation when the space can be used as a reservoir
to dilute contaminants.
2.2.2 Indoor Air Quality Procedure
The second procedure of Standard 62-1999, provides a direct solution to acceptable IAQ by restricting the concentration of all known contaminants of concern to some specified acceptable levels. Both quantitative and subjective evaluations are involved. The quantitative evaluation involves the use of acceptable indoor contaminant level from a variety of sources. Subjective evaluation involves the response of impartial observers to odours that might be present in the indoor environment, which can obviously occur only after the building is complete and operational. Tables for outdoor air requirements for ventilation and IAQ control are provided in the section of Standard 62-1999 for various building types and uses.
As for Malaysia, the Code of Practice On Indoor Air Quality 2005 has been introduced by the Department of Occupational Safety and Health, Ministry of Human Resources Malaysia, as a guide to comply with the general duties of employers prescribed under Section 15 of the Occupational Safety and Health Act, OSHA 1994 (Act 514) (DOE 2005). Another source is the Uniform Building By-Laws 1984 (G. N. 5178/85), which provide the guide lines for the provision of adequate fresh air/air change rates for various types of space/buildings (ILBS 1996).
2.3 Indoor Contaminants and Their Sources
Some of the important indoor contaminants are formaldehyde (HCHO), radon (Rn) gas, respirable particulate matters (RPT), micro-organisms, by-products of combustion (CO, CO2, SO2, NO2) and volatile organic compounds.
Formaldehyde
Formaldehyde, a member of a chemical group called aldehydes, is highly reactive and soluble and may exist as pure gas, an aqueous solution, and solid polymers. It is highly irritable to moist body surface. It has been identified as a “carcinogen” and associated

12
with nasal cancer. The major sources of formaldehyde are urea-formaldehyde-foam insulation (UFFI), particleboards, some paper products, fertilizers, chemicals, glass and packaging materials.
Radon
Radon, a decay product of radium-226 is a colourless, odourless and radioactive gas and chemically inert. It main source is the soil. It enters the building through open sumps, crawl spaces, hollow concrete block walls, and cracked concrete slabs. For multi-storey buildings, the main source of radon is the construction materials. The main health hazard due to exposure to Radon is the increased possibility of cancer of the internal organs such as lung cancer.
Small particulates
Small particulates, such as asbestos used for insulation and fireproofing, has become a significant IAQ problem. Asbestos contaminant occurs when the fibres become friable and released into the air. Asbestos is considered to be carcinogen and has been linked to stomach and lung cancer. Other insulation materials such as fibre glass and rockwool are considered to be much less carcinogen than asbestos.
Micro-organisms
Micro-organisms indoors are of great concern to us, because they can cause many illnesses. Some micro-organisms can cause allergic reactions, irritation and weaken immunity which can make our body more susceptible to other diseases. High humidity and condensation increase the number of airborne fungal spores and bacterial growth. Most bacteria are 0.5 – 5 μm in size, while fungal spores can range from 2.0 - 150 μm. Asthma, rhinitis and other allergic symptoms in humans are caused by inhaling fungal spores. The mycotoxins produced by fungi may be poisonous, carcinogenic or immunosuppressive, but not all fungi produce mycotoxins.
Bacteria
Bacteria play an important role in our environment and health. Bacteria found in indoor environment can be basically divided into (a) environmental and (b) human-related. Some of environmental bacteria include Bacillus, Methyl bacterium and Pseudomonas. Human related bacteria include Streptococcus, Staphylococcus and some Micrococcus. Most bacteria grow in water or in substrate with high water content. They also grow on human skin and may be shed into air. While most bacteria are not pathogenic, some bacteria are opportunistic pathogens.
The by-products of combustion are carbon monoxide (CO), sulphur dioxide (SO2), nitrogen dioxide (NO2), carbon dioxide (CO2) and ETS. Stoves (wood and gas), fireplaces, inverted space heaters, tobacco smoke etc. are the major sources of combustion products indoors while vehicle exhaust and fossil-fuel-burning plants are among the major outside sources.

13
Carbon Monoxide
CO is a colourless, tasteless and odourless. If combined with haemoglobin of the blood to form carboxyhemoglobin (COHb) which interferes with the ability of to carry oxygen to the body tissues. High level exposure to CO2 may result in dizziness, headaches, nausea, vomiting, coma, and even death.
Sulphur dioxide
SO2 is produced during the combustion of sulphur containing materials. A colourless gas, highly water soluble, and absorbed easily by the mucous membranes of the respiratory system. When inhaled it dissolves to form sulphuric acid, sulphurous acid and bisulphate ions. Exposure to SO2 primarily affects the respiratory system, but a concentration of about 5 ppm starts affecting healthy human beings.Nitrogen dioxide
NO2 is a dark brown gas whose property is causing severe irritation to the eyes and other membranes of the body, and damage to the lung.
Carbon dioxide
CO2 can be produced by combustion of hydrocarbons and human being indoors, is relatively non-toxic can be consider as an excellent surrogate for odour and indirect measure of the adequacy of mixing outside air and recirculated air of the HVAC system. Based on the ASHREA Standard 62.1- 2004, the recommended CO2 level should not exceed 1000 ppm, corresponding to ventilation airflow requirement of 15 cfm per person. The trends today indicate that concentration of respirable suspended particles (RSP), VOCs, formaldehyde, and nicotine generally tend to correlate with varying CO2 concentrations. Thus using CO2 as surrogate may be beneficial in maintaining adequate IAQ if one does not place too much dependency on this one method alone. Its main source is breathing, and is usually only a problem in areas with high concentrations of people (classrooms, auditoriums, sports arenas). Its presence can be detected and used to indicate the need for more fresh air. Too much CO2 (over 800 parts-per-million or PPM) causes people to become lethargic.
Volatile organic compounds (VOCs)
VOCs are present in almost materials and products such as construction materials, furnishings, fuels, consumer products and pesticides (chlordane, heptachlor, malathion, diazinon, etc.). VOCs are lipid soluble compounds and easily absorbed through the lungs. There are two major types of VOCs: (a) petroleum-based solvents (products such as paints, stains, adhesive and caulks) and (b) chlorine–based solvents (products such as water repellents, epoxy paints, paint remover and dry cleaning compounds).
Environmental tobacco smoke (ETS)
Environmental Tobacco Smoke (ETS) is the most visible indoor source of combustion by-products. Combustion by-products of tobacco include CO2, particulates, nitrogen oxides, aromatic hydrocarbons, acrolein, aldehydes, nicotine, nitro-samines, hydrogen cyanide and ketones.

14
Odours
Odours are a unique class of indoor contaminants as their detection and measurement are based on our olfactory system rather than using some type of instrument employing physical or chemical principles. Indoor generated odour problems include body or tobacco smoke odours or odours from the out-gassing of building materials or furnishings. Odour measurement generally involved the collection of representative air samples and then subjecting them to sensory analysis by a trained odours panel, as explained in the Chapter 3.
15
CHAPTER 3
METHODOLOGY FOR IEQ RESEARCH
3.0 Introduction
Most studies of indoor environmental quality (IEQ) are experimental in nature either laboratory or control chamber studies or field studies, or simulation. It involves measuring of indoor environmental parameters and contaminants and subjective investigation by means of questionnaires. The following describe the important aspects in IEQ research and investigation. Measurements of thermal comfort parameters, ventilation rate, and concentrations of chemical contaminants in the space are performed using standard instrument and procedures. Occupants’ perception of their environment and also risk effects on exposure to such environments are also investigated by means of questionnaires..
3.1 Thermal Comfort Measurements
The thermal comfort parameters (air temperature, relative humidity, air velocity and mean radiant temperature) are measured using standard instruments and procedures. The thermal comfort parameters of the indoor environment are measured using anemometer (air velocity and temperature), globe thermometer and hygrometer (humidity). The measurements are taken at 1 m above the floor for standing subject and 0.75 m for seated person. Data are recorded at certain intervals and time-weighted for a selected period of duration (a day or a week), depending on the storage capacity of the instruments.
3.2 Measurement of Indoor Contaminants
Indoor contaminants such as Carbon Monoxide (CO), Carbon Dioxide (CO2), Ozone (O3), Sulphur Dioxide (SO2) concentration were continuously monitored at the centre of the occupied area using appropriate instrument, such make is the Q-Trak Plus IAQ monitor. The outdoor air contaminants are also monitored at appropriate location outside the building to obtain the background concentration.
CO Measurement
The most commonly used method for CO measurement at fixed points indoors is by means of a non-dispersive infrared (NDIR) analyser. The NDIR principle is the basis of the EPA Reference Methods. Infrared energy from a source is passed through a cell containing the gas to be analysed, and the energy absorbed by the CO in the sample is measured by a suitable detector. The photometer is sensitized to CO by employing CO gas in either the detector or in a filter cell in the optical path, thereby limiting the measured absorption to one or more of the characteristic wavelengths at which Co strongly absorbs. CO monitors applying NDIR have proven reliability and sensitivity and provide a continuous record of CO concentrations, but they are too bulky for personal exposure monitors. Another method for CO measurement as equivalent to the NDIR is the gas filter correlation (GFC) method whereby the radiation passes through a spinning filter wheel that contains CO and nitrogen reference cells. The infrared radiation passes through a detector cell containing the air being sample. The CO concentrations in the sample are proportional to the differences between the nitrogen cell and the CO cell.

16
NO2 Measurement
NO2 is the most important of a number of nitrogen oxides (NOx) that may be present as a common contaminant in air as it is a respiratory irritant and capable of damaging materials; for example, it causes fading of certain types of fabrics dyes and causing damage to sensitive electronic equipment (Yocom et al., 1986). Instruments based on gas-phase chemiluminescence have been widely used for indoor air quality studies and are particularly useful where relationship between NO and NO2 and NO2 decay rate are desired. In this method the emission of photons from the gas-phase reaction of NO with ozone is measured; total oxides of nitrogen (the sum of NO and NO2 or NOx) are measured first by reducing all NOx to NO, NO2 is then determined by subtracting the quantity of NO from NOx. A number of commercially available portable NO2 monitoring devices including automated wet chemical, chemiluminescent, electrochemical, and other types of molecular diffusion passive monitors are being used for NOx monitoring.
SO2 Measurement
SO2 is an irritating gases at high concentrations (above 1 ppm) as such it principal concern in the ambient atmosphere (including indoor) is as a respiratory irritant, especially for asthmatics and its ability to oxidize to sulphuric acid aerosol and sulphates. There are several commercially available portable instruments suitable for indoor air quality monitoring based on pararosaniline chemistry and electrochemistry.
O3 Measurement
Ozone (O3) is an air pollutant normally associated with outdoor photochemical smog, whereby under these conditions O3 is generated in the lower atmosphere through complex series of reaction between nitrogen oxides and reactive hydrocarbons in the presence of strong sunlight. The major sources of O3 indoor are from office equipments such as photocopy machines and printers, electrostatic air cleaners and to some extent electric motors. The gas-phase chemiluminescence method from the reaction between ethylene and O3 is used for O3 monitoring.
Respirable particulate matter (RPM) Measurement
Inhale particles of sizes which are less than 10 µm, but particulate less than 3 µm, are termed as respirable particulate matter (RPM). RPT are produced principally by vapour condensation and agglomeration of Aitkin nuclei (<0.1 µm). There are commercially available samplers for RPM, PM10 or TSP monitoring that permit real time indoor measurement of any of these forms of particulate matter depending upon the type of sampling head.
Formaldehye (HCHO) Measurement
Indoors, formaldehyde (HCHO), a common component in synthetic resins, is emitted from a variety of sources, such as particle-board, glues and resins in furniture, carpets and panelling, urea formaldehye foam insulation (UFFI), various treated fabrics and environmental tobacco smoke. Three commonly employed measurement techniques for HCHO are: impinger sample collection with calorimetric analysis, automated wet chemistry, and passive dosimeters. The ASTM has developed a passive sampler standard method for formaldehyde (ASTM,1989).

17
Measurement of Microbial
There are several methods which can be used to sample microbial aerosols and samplers are categorised as: Gravity samplers, inertial impactors, and filtration devices. However, inertial impactors and filtration devices are the preferred type of collection devices (Burge and Solomon, 1987). The gravitational method is not recommended technique because it is subjected to both qualitative and quantitative errors, for example large spores, which may be innocuous, are over estimated and smaller, potentially more significant organisms are under estimated (Burge and Solomon, 1987). The Guidelines for the Assessment of Bio-aerosols in Indoor Environment, ACGIH, 1989 and Sampling Micro-organisms and Aeroallergens, ACGIH 1989b, give useful information for carrying out microbial aerosols monitoring and sampling.
Measurement of Volatile organic compounds (VOCs)
Indoor sources of VOCs include house hold products, building materials, drinking water, gas stations, dry cleaners, automobile exhaust and occupant activities such as hobbies and smoking. VOCs are a heterogeneous group of compounds, with unique sources in different microenvironment and there is no standard method for collecting and analyzing samples, and reporting results. Real time data can be obtained from in situ measurement with a portable gas chromatographs, but this method has limited application when complex mixtures are present in low concentration. The more common method involves three basic steps: adsorption of vapour phase organics onto a solid sorbent (polymeric resin or activated carbon), desorption of organics (either thermally of with a solvent), and analyses of the desorbed compounds (gas chromatograph with mass spectroscopy, electron capture, or flame ionisation detectors).
Measurement of Odours
The perception of odour has four major dimensions or descriptors that can be evaluated such as detectability (the limit value for absolute detection), intensity (odour intensity, sensory irritation intensity), character, and hedonic (pleasant or unpleasant) tone. Various methods are used to assess the relative strength of an odour. The common method is to grade an odour in accordance with a scale such as presented by ASHRAE (1985): 0 = no odour = threshold or just recognizable, 1 = slight odour, 2 = moderate; 3 = strong odour. Another method is to compare odour intensity of an environmental odour with a standard odour such as 1-butanol odour by matching the intensity of a 1-butanol odour with that of the environmental odour.
Fanger (1988) introduced the decipol method which comprises a panel of ten or more individuals who are trained to evaluate the perceived air quality in decipol or an untrained panel of at least 50 people. In this method, the emission rates are measured in olf, where 1 olf is defined as the emission rate causing the same level of dissatisfaction as bio-effluents from one seated person at any airflow. Concentration or ‘perceived air quality’ is measured in decipol. 1 decipol is defined as the concentration of pollution causing the same level of dissatisfaction as emission from a standard person diluted by a clean air flow of 10 l/s. In this context, ‘perceived air quality’ signifies dissatisfaction with or acceptability of indoor air quality.

18
Table 3.1, shows some of the measurement methods or techniques, detected compounds and detection limits for indoor
Table 3.1 Measurement methods, detected compounds and detection limits for indoor air.

19
3.3 Air Change Rates Measurements
Air change rate is defined as the ratio of air flow through a space or building to the effective volume of a space or building. There are a few methods of air change rate measurement using the tracer gas method namely Concentration Decay Method, Constant Emission Rate Method
and Constant Concentration Method. The Concentration Decay Method is the simplest and easy to use. In the Constant Concentration Decay Method the variation of tracer gas concentration with time is given by:
C(t) = C(o) e –(Q/V)t
Q/V = N
Or
N = ( ln C(o) – ln C(t) )/t
Where
N : air change rate (h-1)
C(O) : concentration of tracer gas at time = 0 (ppm)
C(t) : concentration of tracer gas at time = t (ppm)
t : total measurement period (h)
If N remains constant over the measurement period, the tracer gas concentration will exhibit a negative exponential decay. For practical purposes, the tracer gas concentration is often plotted against elapse time in hours on a semi-log paper. The negative slope of the line is then equal to N, the air change rate per hour. The number of times the whole volume of a space/building is replaced with outdoor air per hour is termed as the air change rate. The product of N and the volume of the space divided by the numbers of occupants gives the ventilation rate (litre/per second per person) or (cubic feet per minute (cfm)/person)) for the space. The average value of these air change rates was used as the mean air change rates of the building. For further treatise on this subject readers can refer to AIVC Measurement Techniques Guide 1988 (D. Etheridge and M. Sandberg 1999).
3.4 Subjective Assessment - Questionnaires
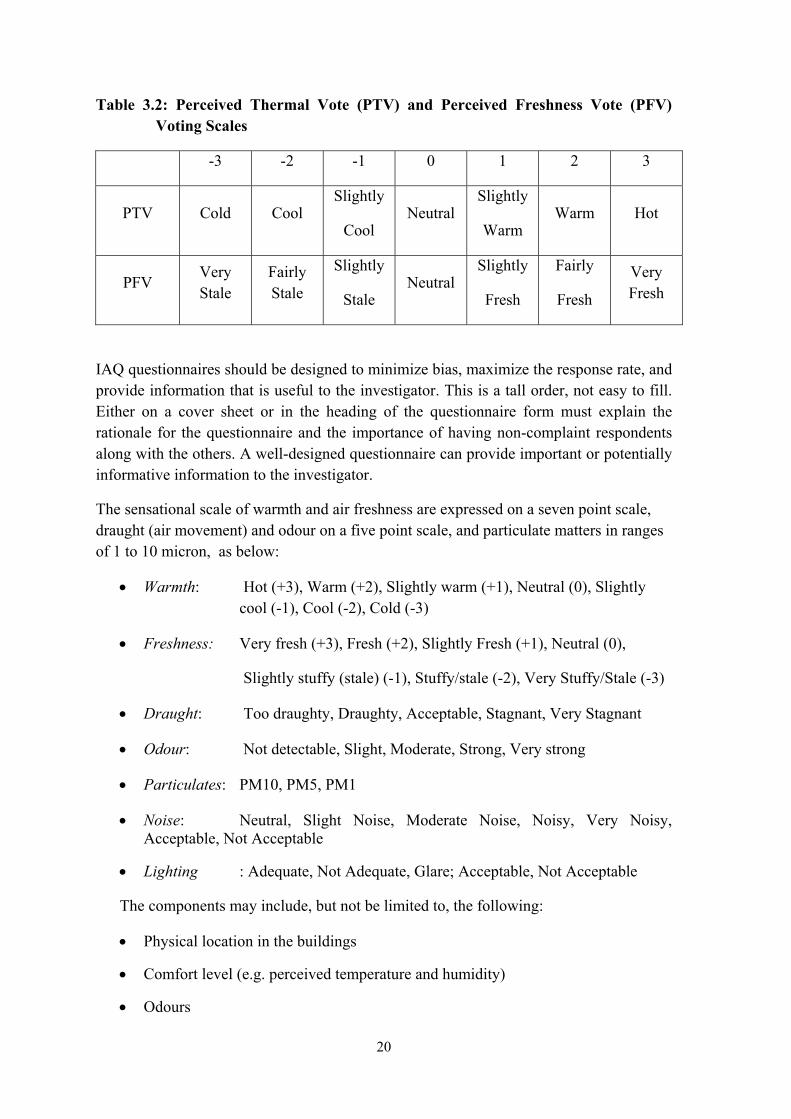
Office occupants’ perception and the effects of the indoor air parameters and contaminants on the occupants are assessed subjectively by means of questionnaires. The questionnaires are divided into sections, namely, occupants’ thermal sensation and others aspects of the office environmental conditions. The questionnaires contained questions for subjective data and took about 2-3 minutes to complete. A seven point scale is used to formulate a thermal sensation and is shown in Table 3.2. The data on the perceived thermal vote and perceived freshness vote are correlated with the physical measurements.
20
Table 3.2: Perceived Thermal Vote (PTV) and Perceived Freshness Vote (PFV) Voting Scales
-3 -2 -1 0 1 2 3
PTV Cold Cool Slightly
Cool Neutral
Slightly
Warm Warm Hot
PFV Very Stale
Fairly Stale
Slightly
Stale Neutral
Slightly
Fresh
Fairly
Fresh
Very Fresh
IAQ questionnaires should be designed to minimize bias, maximize the response rate, and provide information that is useful to the investigator. This is a tall order, not easy to fill. Either on a cover sheet or in the heading of the questionnaire form must explain the rationale for the questionnaire and the importance of having non-complaint respondents along with the others. A well-designed questionnaire can provide important or potentially informative information to the investigator.
The sensational scale of warmth and air freshness are expressed on a seven point scale, draught (air movement) and odour on a five point scale, and particulate matters in ranges of 1 to 10 micron, as below:
Warmth: Hot (+3), Warm (+2), Slightly warm (+1), Neutral (0), Slightly cool (-1), Cool (-2), Cold (-3)
Freshness: Very fresh (+3), Fresh (+2), Slightly Fresh (+1), Neutral (0),
Slightly stuffy (stale) (-1), Stuffy/stale (-2), Very Stuffy/Stale (-3)
Draught: Too draughty, Draughty, Acceptable, Stagnant, Very Stagnant
Odour: Not detectable, Slight, Moderate, Strong, Very strong
Particulates: PM10, PM5, PM1
Noise: Neutral, Slight Noise, Moderate Noise, Noisy, Very Noisy, Acceptable, Not Acceptable
Lighting : Adequate, Not Adequate, Glare; Acceptable, Not Acceptable
The components may include, but not be limited to, the following:
Physical location in the buildings
Comfort level (e.g. perceived temperature and humidity)
Odours

21
Health concerns thought to be associated with the building
Onset of symptoms (e.g. approximated date)
Occurrence of symptoms (e.g. early morning on a Monday)
Pre-existing conditions that might be more adversely impacted by exposures while in the building
Occurrence of symptoms relief (e.g. two hours after leaving work)
Observed unusual/suspicious activities or events
Some of the important elements to be considered when conducting subjective evaluation on indoor environmental quality (IEQ) is summarised as in Figure 3.1
Summer: too hot? Winter: too cold? Are you satisfied with the indoor environment?
Figure 3.1 Important Elements Regarding Indoor Environmental Quality (IEQ) Subjective Evaluatio

22

23
CHAPTER 4
INDOOR ENVIRONMENTAL RESEARCH AT UTHM
4.0 Introduction
The Research and Development interests of the Indoor Environmental Research Group (IERG), Centre for Energy and Industrial Environment Studies (CIEES), at the Faculty of Mechanical and Manufacturing Engineering, UTHM encompass studies on design for human needs such as thermal comfort, ventilation and air freshness, IAQ and SBS. Those studies have been made possible by the existence of a dedicated Industrial Environment Laboratory (IEL) which is well equipped for carrying out the state of the art research and consultancy works. The IEL is supported with a Walk-in Stability Chamber, WiSC which enable controlled experiments to be conducted. The WiSC and instruments are shown in Appendix 1. Some of the selected researches are summarised as follow:
4.1 Thermal Comfort and IAQ in Factory Environment in Malaysia
Field investigations of thermal comfort in six factory buildings were conducted. It involved some 1143 subjects and a total of 35 visits. Correlations between comfort votes and physical measurements in all buildings were analysed and compared with the ASHREA Standard 55-92 Comfort Zone (Summer Condition). The neutral temperature of the whole sample was 25.6 0C, i.e. 3.1 0C higher than that prescribed by ASHREA Standard 55-92. The neutral temperature i.e. 25.6 0C was suggested as a new indoor design temperature. The comfort zone for Malaysia was presented, as shown in Figure 4.1. The results can be used in energy-efficient air conditioning design in Malaysia. (Sources: M.Zainal et al. 1997, Adnan Husain 1997).
Figure 4.1 Comfort Chart for Malaysia (Source:Mohammad Zainal et al (1997), Adnan, 1997)

24
4.2 Effects of Outdoor Air Pollution (Haze) on Indoor Air Quality
Air pollution i.e. Haze has resulted the degradation of air quality both outdoor and indoor. Haze can endanger human and animal as it contained various poisonous chemical elements such as toxic gases in the atmosphere. The study was conducted in buildings in the areas of Parit Raja, Batu Pahat and Bukit Mertajam, Pulau Pinang, between September 1997 and March 1988, i.e. during the Haze phenomena which affected Malaysia. As a whole, the study’s findings were that; a) the composition of toxic gases like SO2, NO2 exceeded the safe limit compared with that of EPA Standard. Also the CO2
concentrations exceeded by almost 73% of that prescribed by ASHREA Standard 62 – 1989. (Source: Mohammad Zainal and Adnan Husain 1998).
4.3 The Effectiveness of Under Floor Air Distribution (UFAD) System in Indoor Environmental Control
This project aimed to evaluate the effectiveness of an under-floor air distribution system in controlling thermal comfort and indoor air quality in an office building. The building chosen was the Securities Commission’s Building located in Mont Kiara, Damansara, Malaysia. The building was chosen because it is served with an under floor air distribution system for the office spaces air conditioning purpose. Physical measurements were carried out such as air temperature, air velocity and relative humidity. Concentrations of indoor contaminants of carbon dioxide (CO2), carbon monoxide (CO), nitrogen dioxide (NO2), sulphur dioxide (SO2) and ozone (O3) were also monitored. Ventilation rates were determined in terms of percentage of outside air and air change rate (ACH). All the physical measurements were analysed and compared with ASHRAE Standard 55-92, ASHRAE Standard 62-89 and ISO Standard 7730-84. Selected results were: operative temperature ranging from 21.8oC - 24.3oC; relative humidity 54.9 % - 69.8 %; air velocity 0.01 m/s - 0.11 m/s; concentration of CO2 644 ppm ; and ventilation rates 19% outside air; and ACH range between 0.24 and 0.48. The vertical temperature variation in the occupied zone was less than 0.3oC, which is preferred to prevent ‘local discomfort’ of sensitive parts of the human body (Source: M.Z.M. Yusof and et al, 2006)
Results of studies were as follows:
4.3.1 Thermal Comfort Parameters
4.3.1.1 Air Temperature
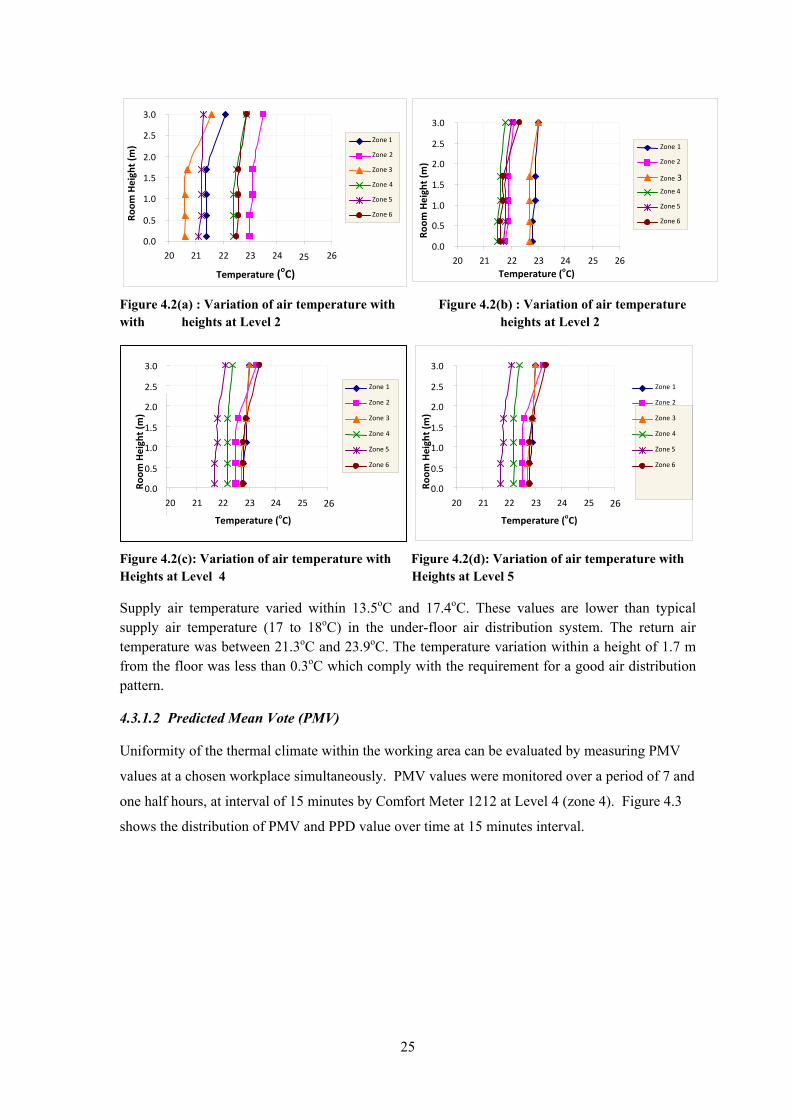
Air temperature was measured at 4 different heights with an anemometer which has a built-in thermometer. The final values of air temperature measured in each zone for every level are shown in Figures 4.2(a) – (d).
25
Figure 4.2(a) : Variation of air temperature with Figure 4.2(b) : Variation of air temperature with heights at Level 2 heights at Level 2
Figure 4.2(c): Variation of air temperature with Figure 4.2(d): Variation of air temperature with Heights at Level 4 Heights at Level 5
Supply air temperature varied within 13.5oC and 17.4oC. These values are lower than typical supply air temperature (17 to 18oC) in the under-floor air distribution system. The return air temperature was between 21.3oC and 23.9oC. The temperature variation within a height of 1.7 m from the floor was less than 0.3oC which comply with the requirement for a good air distribution pattern.
4.3.1.2 Predicted Mean Vote (PMV)
Uniformity of the thermal climate within the working area can be evaluated by measuring PMV
values at a chosen workplace simultaneously. PMV values were monitored over a period of 7 and
one half hours, at interval of 15 minutes by Comfort Meter 1212 at Level 4 (zone 4). Figure 4.3
shows the distribution of PMV and PPD value over time at 15 minutes interval.
0.0
0.5
1.0
1.5
2.0
2.5
3.0
20 21 22 23 24 25 26
Temperature (oC)
Room Height (m
)
Zone 1
Zone 2
Zone 3
Zone 4
Zone 5
Zone 6
0.0
0.5
1.0
1.5
2.0
2.5
3.0
20 21 22 23 24 25 26
Temperature (oC)
Room Height (m
)
Zone 1
Zone 2
Zone 3
Zone 4
Zone 5
Zone 6
0.0
0.5
1.0
1.5
2.0
2.5
3.0
20 21 22 23 24 25 26
Temperature (oC)
Room Height (m
)
Zone 1
Zone 2
Zone 3
Zone 4
Zone 5
Zone 6
0.0
0.5
1.0
1.5
2.0
2.5
3.0
20 21 22 23 24 25 26
Temperature (oC)
Room Height (m
) Zone 1
Zone 2
Zone 3
Zone 4
Zone 5
Zone 6

26
-0.9
-0.8
-0.7
-0.6
-0.5
-0.4
-0.3
-0.2
-0.1
009
:30
10:0
0
10:3
0
11:0
0
11:3
0
12:0
0
12:3
0
13:0
0
13:3
0
14:0
0
14:3
0
15:0
0
15:3
0
16:0
0
16:3
0
17:0
0
Time (hh:mm)P
MV
Figure 4.3: Distribution of PMV value over time.
Referring to Figure 4.3 it shows that the distributions of PMV values varied over time. The value
fell below -0.5 starting from 10.00 am till 14.45 pm, indicating that the temperature in the
workplace were slightly cool and more than 10% of the occupants were expected to express
dissatisfaction with the environment. At certain time, percentage of people dissatisfaction (PPD)
were high (more than 20%), indicating the PMV ≥ -0.8 due to the low temperature.
4.3.1.3 Indoor Contaminants
Indoor contaminants such as ozone (O3), sulphur dioxide (SO2), nitrogen dioxide (NO2) and also
carbon dioxide (CO2) were monitored over 1/2 hour period in selected zones using an indoor
environment monitor. All gases contaminants were within safety limits, the CO2 concentrations
measured do not exceed the recommended threshold limit of 1000 ppm.
4.4 Thermal Comfort, Freshness and Indoor Air Quality (IAQ) in Offices
The indoor air quality, thermal comfort and occupants’ perception of the indoor environment were investigated in the study. The samples office space/room was that belonging to the once Academic Block, designated as Block A4, UTHM. A total of 97 subjects participated in the questionnaire. The questionnaires related to thermal sensation and work area satisfaction were administrated to occupants. Physical measurements of parameters concerning thermal comfort and IAQ, which include ventilation rate, concentration of CO2 and CO were carried out as per standard procedures. Ventilation performance in term of air change rate and indoor air quality was compared with the ASHRAE Standard 62-89R. The CO2 and CO levels were found to be within the recommended limits. Over 60 per cent of occupants felt the existing temperature was
Comfort Meter Setting:
Metabolic, M: 1.2 (Light Sedentary Activity)
Clothing, Clo : 0.8

27
acceptable as in Figure 4.4a, and more than 80 per cent of the occupants were satisfied with the air freshness, as in Figure 4.4b.
0
5
10
15
20
25
30
35F
requ
ency
-3 -2 -1 0 1 2 3
Perceived Thermal Vote
05
1015202530354045
Freq
uenc
y
-3 -2 -1 0 1 2 3
Perceived Freshness Vote
Figure 4.4a: Occupants Perceived Figure 4.4b: Occupants Perceived Thermal Vote Freshness Vote
The neutral temperature for the building occupants was 27.7oC and at 23oC the predicted amount of fresh air for maintaining freshness was 14.8 L/s/person. The results of physical measurement and subjective measurement found that the occupants were feeling cool or slightly cool with the existing temperature. However, with the actual temperature range of the present study i.e. 23.8oC to 25.5oC and mean air velocity of 0.38m/s, most occupants voted the indoor environment was comfortable and neutral. The evaluation of occupants’ sensations on the work environment were summarised as in Figure 4.5. (Source: M. Z. M. Yusof et al. 2005)
5 4 3 3 3 2 3
3344
60
2537
47
61
3630
16
23
30
38
2121 12
13
31
22
6 83 9 4
137 6 3
1114112
0%
10%
20%
30%
40%
50%
60%
70%
80%
90%
100%
Air Qua
lity
Tempe
ratur
e
Sound
Space
Furnit
ure
Colour
s
Lightin
g
Percent
Very satisfied satisfied slightly satisfied
Slightly dissatisfied Dissatisfied Very dissatisfied
Figure 4.5: Occupants’ Perception on the Work Environment

28
4.5 Studies of Thermal Comfort, IAQ and SBS in Governmental Office Buildings.
The studies were carried out on three governmental office buildings situated in the districts of Batu Pahat and Kluang, Johor, Darul Takzim. Two of the buildings belong to the so called new generation of Governmental Office Building designated as the Bangunan Gunasama Perseketuan, Batu Pahat and Bangunan Gunasama Perseketuan, Kluang as Figures 4.6a and 4.6b, and the third building was the Tunku Mahkota Ibrahim Ismail, Batu Pahat, as Figure 4.6.c.
Subjective Analysis by means of questionnaires was used to gather data on the prevalence of SBS symptoms. Comfort and IAQ parameters such as air temperature, humidity, air movement/velocity, CO2 and CO were measured using standard instruments and procedures.
Figure 4.6a: Bangunan Gunasama Batu Pahat
Figure 4.4b : Bangunan Gunasama Kluang

29
The overall result showed that eight (8) common symptoms of SBS with more than 20% of respondents were chills, drowsiness, eye strain, eye irritation, skin dryness, headaches, dizziness and sneezing.
Figure 4.6c: Bangunan Tunku Mahkota Ibrahim Ismail, Batu Pahat
Analysis of individual symptom profile revealed that 37.6% (129 cases) of males and 62.4% (214 cases) of females reported symptom cases based on the scale of “frequently” and “occasionally”. A point to note that, a larger section of the female subjects experienced a higher prevalence of symptoms compared to that of male subjects.
Results of physical parameters correlated significantly with the eight common prevalence symptoms were that air temperature was in the range 21.7 – 23.7 0C, relative humidity 55 – 66%, air velocity 0.02 – 0.1 m/s and outside air supply into building 0.6 – 15.8 cfm/person. Insufficient supply of fresh/outdoor air coupled with the poor movement of air and high humidity were said to be the major cause for the prevalent of SBS symptoms in those buildings. (Sources: Mohd Hafirizal (2002), Ng Peak Sun (2002)) and Mohd Shukor (2003)).

30
4.6 Environmental Quality Index (EQI) For Engineering Laboratory
The method for defining the air pollution index, IPU by the Department of Environment
Malaysia, which is similar to the Pollution Standard Index, PSI by the EPA, U.S.A. has been applied to define the index of individual pollutant in a laboratory. Using scale of 1 to 5 to denote the level of pollution for an individual pollutant and assuming those pollutants are additive in the mixture, the EQI for a laboratory can be calculated and classified as good (0 -5); moderate (6 -10); unhealthy ( 11-15); very unhealthy (16 -20) and hazardous (21-25).
The calculation of the individual pollutants concentration level is based on the ACGIH Threshold Limit Value-Time Weighted Average, TLV-TWA
hours
TcTcTcTLV nn
8
).....( 2211
(1)
Where 21, cc and nc are pollutant concentration at time ,, 21 TT and nT respectively.
As defined above and knowing the IPU or PSI of each pollutants, the Environmental Quality Index EQI, for a given laboratory can be calculated as,
IPUIndividualEQI (2)
Using scale of 1 to 5 to denote the level of pollution for an individual pollutant and assuming those pollutants are additive in the mixture, the EQI for a laboratory can be calculated and classified as good (0 to 5), moderate (6 to 10), unhealthy (11 to 15), very unhealthy (16 to 20) and hazardous (21 to 25), as presented in Table 4.1. The indicated pollutants were ozone (O3), carbon monoxide (CO), sulphur dioxide (SO2), ammonia (NH3) and, particulate matters, P10.
Table 4.1: Interpretation of API in Relation with the Single Index and Multiple Index
API Scale
Single Index
Multiple Index
Health Effect Maximum Pollutant Concentration
PM10 (mg/m3)
CO
(ppm)
SO2
(ppm)
NO2
(ppm)
0 to 50 1 1 - 5 Good 0.075 4.5 0.02 0.085
51 to 100
2 6 - 10 Moderate 0.15 9 0.04 0.17
101 to 200
3 11 – 15 Unhealthy 0.35 15 0.08 0.6
201 to 300
4 16 - 20 Very Unhealthy 0.42 30 0.3 1.2
> 300 5 21 - 25 Hazardous 0.50 50 0.6 2.0

31
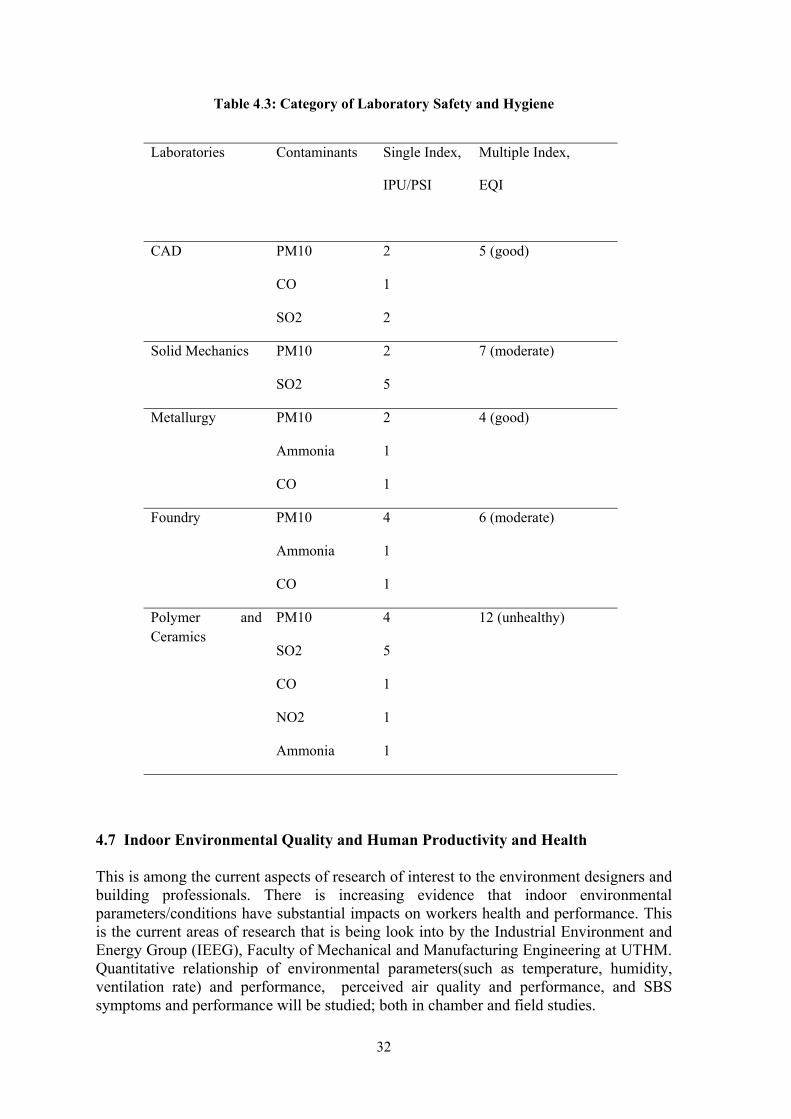
Measurement of indoor air pollutants, ranging from chemicals, particulate matters (PM10) and gases were carried out in various laboratories, as in Table 4.2 and the EQI for each laboratory was calculated. As shown in Table 4.3, the calculated EQI ranging between 4 (good) to 12 (unhealthy), depending on the nature of activities taking place in those laboratories. The method of defining the EQI as proposed can be extended to define the indoor environmental quality of other types of premises/buildings (Sources: M.Z.M. Yusof et-al. 2008, A.M.Leman et-al (2010), RFGS, Vote 0257 Report, 2011).
Table 4.2: Types of materials used/handled in laboratories
Laboratories Chemicals Composite/metals Others
CAD None None None
Mechanics of Solid
Mild steel
Sheet metal
Ferum Alloy
Metallurgy Ammonia Composite powder
Foundry Aluminium
Cast iron
Sheet metal
Ferum alloy
Polymer and Ceramic
Methanol, Saline,
Epoxy resin,
Polyester hardener
Mild steel
Aluminium
Fiber glass
Coconut fibre
32
Table 4.3: Category of Laboratory Safety and Hygiene
4.7 Indoor Environmental Quality and Human Productivity and Health
This is among the current aspects of research of interest to the environment designers and building professionals. There is increasing evidence that indoor environmental parameters/conditions have substantial impacts on workers health and performance. This is the current areas of research that is being look into by the Industrial Environment and Energy Group (IEEG), Faculty of Mechanical and Manufacturing Engineering at UTHM. Quantitative relationship of environmental parameters(such as temperature, humidity, ventilation rate) and performance, perceived air quality and performance, and SBS symptoms and performance will be studied; both in chamber and field studies.
Laboratories Contaminants
Single Index,
IPU/PSI
Multiple Index,
EQI
CAD PM10 2 5 (good)
CO 1
SO2 2
Solid Mechanics PM10 2 7 (moderate)
SO2 5
Metallurgy PM10 2 4 (good)
Ammonia 1
CO 1
Foundry PM10 4 6 (moderate)
Ammonia 1
CO 1
Polymer and Ceramics
PM10 4 12 (unhealthy)
SO2 5
CO 1
NO2 1
Ammonia 1

33
4.7.1: Effect of Temperature on Computer and Manual Drafting Activity
The study was aimed to evaluate the effect of environmental parameters on human performance. Subjects were assigned to perform a specific task i.e. a drafting work (as in Figure 4.5) and their performance to complete the task was measured. Two groups of subjects were involved; one group working with computer and the other carrying out the task manually.
Figure 4.7: Task Under Taken by Subjects
Temperature in the work station as in Figure 4.6, were varied between 170 to 330 C and at each temperature setting the subject’s performance in carrying out the drafting/drawing task were observed i.e. the time taken to finish the task was measured. The subjects were also asked to vote on their perceptions of the environment and its effects on specific parts of their body.
Figure 4.8: Showing the work station and location of equipments
The results indicated that subjects were productive within the normally comfort range of 230 to 250 C (normally accepted as the condition of thermal neutrality). Shifting away

34
from the thermal neutrality condition that is ‘cool to cold’ and ‘warm to hot’ has significant effect on human performance and also physically as shown in Table 4.4. (Sources: M.Z.M. Yusof et al (2011), A.M.H. Alhadar (2010)
Table 4.4: Summary of Performance with Environment Conditions
Task condit
ion
Mean Temp (oC)
Subjects
Mean comfort vote
Overall performance
(min)
Environment effects on body
1 17.9
S1 (M)
-2.6 Cold 30 Non
Efficient
Feeling cold on parts of body and Fingers feeling
pains
S1 (C)
-2.3 Cold 22.6 Normal Feeling cold on parts of
body and Fingers feeling pains
2 20.1
S2 (M)
-1.6 Cool 26.3 Low
Efficient
Feeling Cold on parts of body and Movement of
fingers are restricted
S2 (C)
-1.3 Cool 21 Normal Feeling Cold on parts of body and Movement of
fingers are restricted
3 23.3
S3 (M)
0 Normal 16 Very
EfficientNon of the symptoms
S3 (C)
0 Normal 12 Very
EfficientNon of the symptoms
4 25.2
S4 (M)
0.3 Normal 16 Very
EfficientNon of the symptoms
S4 (C)
0.3 Normal 11 Very
EfficientNon of the symptoms
5 27.1
S5 (M)
1.6 Warm 18.3 EfficientFeeling worm on parts of
body and Lost of concentration
S5 (C)
2 Warm 14 Very
Efficient
Feeling worm on parts of body and Lost of
concentration
6 29.8
S6 (M)
3 Hot 17 Very
EfficientFeeling worm on parts of body and Eyes feel tired
S6 (C)
3 Hot 13.3 Very
EfficientFeeling worm on parts of body and Eyes feel tired
C: By Computer; M: manually
35
CHAPTER 5
CONCLUSIONS
Indoor environmental quality has become an issue of concern in recent years for employers, building owners and managers, unions, and tenants. People today spend up to 90% of their lives indoors and very little time is spent outdoors in a typical day. Also, there is a greater variety of contaminants found indoors than outdoors, and the former is typically higher than the latter. Copy machines, laser printers, correction fluids, floor wax-strippers, furniture restoration chemicals, pesticides and environmental tobacco smoke (ETS) are examples of contaminants sources in a typical office today. Inadequate resources allocation led to cutting down maintenance budget and personnel for maintaining building systems. Additionally, most maintenance procedures and recommendations are specified to maintain design service life and no necessary to maintain acceptable IAQ. Peoples’ expectations for their work environment have changed - most office workers will not tolerate uncomfortable or unhealthy working environment. There is also a broad cross section of people in various degree of health that requiring special needs compared with the healthy young adults. IAQ litigation in recent years has become more common and worrisome to not only building owners but also property management firms, design firms, contractors, maintenance and cleaning companies, and manufacturers. The engineering community is also revising standards that will affect how buildings ought to be designed and maintained – for example, new additions to existing standard specifying specific maintenance practices to be followed. IAQ will continue to be an important issue for building operators, owners and tenants for many years to come. The science of IAQ is relatively young. What is accepted as good practice today may be an inadequate practice tomorrow. The building managers and engineers must keep abreast with the latest developments in IEQ and develop proactive programmes based on the latest findings, recommendations and requirements issued by IEQ researchers, experts and government bodies.

36

37
REFERENCES
AIVC (1996), AIVC Measurement Techniques Guide, Air Change Rate and Airtightness Measurement Techniques – An Application Guide, Air Infiltration and Ventilation Centre, University of Warwick, Coventry, England.
A.M. Leman, M.Z.M. Yusof, A.R. Omar, W. Jung (2010). Environmental quality index (EQI) for industrial ventilation and occupational safety and health evaluation in manufacturing plant, Asia Journal on Quality, Vol. 11 No. 3, Emerald Group Publishing Limited.
Adnan Husain (1997), The investigation of Thermal Comfort in Factory Buildings in Malaysia, M.Eng.Thesis, UTM, Skudai, Johor.
Anwr Mohamed Hmdan AlHadar (2010). Effects of Thermal Comfort on Human Performance, M.Eng. Thesis, UTHM, Batu Pahat, Johor.
ASHREA. (2004a), ASHREA Standard 55 – 2004, Thermal Environmental Conditions for Human Occupancy. American Society of Heating, Refrigeration and Air-Conditioning Engineers, Inc. Atlanta, GA, US
ASHRAE. (2004b). ASHRAE Standard 62.1-2004: Ventilation for acceptable indoor air quality. American Society of Heating, Refrigerating, and Air-Conditioning Engineers, Inc. Atlanta, GA, US
ASTM (1989). Standard Method for Formaldehyde in Indoor Air (Passive Sampler Methodology), Method No. D-5014, American Society for Testing and Materials, Philadelphia, PA.
Bedford, T., (1974), Basic Principles of Ventilation and Heating, Third Edition edited by F. A. Chrenko, H. K. Lewis.
Bluyssen, P.M., (2009), The Indoor Environment Handbook: How to make buildings healthy and comfortable, Earthscan Publishing, London.
Burge, H.A., and Solomon, W.R. (1987), Sampling and Analysis of Biological Aerosol, Atmospheric Environment 21:451-456.
Derek J. Croome, and David H. Rollasan (1988), Freshness, Ventilation and Temperature in Office, Proc. Healthy Buildings’88, vol.2, 393-402, Stockholm, Sweden.
Ed Bas, (2004), Indoor Air Quality: A Guide For Facility Managers, 2nd. Edition, The Fairmont Press, Inc.
EPA (2003), Indoor air quality: Glossary of terms. Washington, DC: EPA.
EPA (1995). The inside story: A guide to indoor air quality. Washington, DC: EPA
Etheridge D.and Sandberg M. (1996), Building Ventilation-Theory and Measurement, John Wiley & Sons, Chichester, England.
Fanger, P.O. (1988), Introduction to the olf and dicipol units indoors and outdoors, Energy and Buildings, 12 (1988), p.p. 1-6.
38
Fanger, P. O., J. Lauridsen, P. Bluyssen and G. Clausen (1988), Air Pollution Sources in Offices and Assembly Halls, Quantified by the Olf Unit, Energy and Buildings, 12 (1988), p.p. 7 – 19.
Geldard, F. A., (1972), The Human Sense, John Wiley. Brown, S.K. (1998), Beating the $12 Billion Cost of Polluted Air. CSIRO Press Release, Ref 98/55. EPD Hong Kong. (1997), API at Hong Kong. Environmental Protection Department of the Government of Hong Kong Special Administrative Region. ILBS1996. Uniform Building By-Laws 1984, International Law Book Services, Kuala Lumpur. US EPA. (1993), EPA’s Approach & Progress in Targeting Indoor Air Pollution. United States Environmental Protection Agency. M Zainal, A Husain, AM Leman, N Nordin (2005). Simulation of Comfort and Indoor Air Quality Level for Terrace House, Paper no 3.3-44, Abstracts for the 10th. International Conference on Indoor Air Quality and Climate, INDOOR AIR: International Journal of Indoor Environment and Health, Vol. 15, Supplement 11. Mohammad Zainal Md Yusof and Adnan Husain (1998). Kajian Awal Pengukuran Kualiti Udara Dalaman, pp.35 – 53, Jurnal Sains & Teknologi, June 1998, ITTHO. Muhamad Zainal Md Yusof and Adnan (1997). Thermal Comfort And Indoor Air Quality (IAQ) In Factory Environment, Proc. Asia Pacific Conference on the Built Environment, p.p.121- 135, P.J. Hilton Hotel, Malaysia. M.Z.M. Yusof, A.M.H. Alhadar, A.M. Leman, A. Husain, A. Hariri (2011). Effect of temperature on computer and manual drafting activity, Proc. ISHVAC 2011, 6-9 November 2011, Shanghai, China. M.Z.M. Yusof, W.A.W. Aziz, A.M. Leman, A. Husain (2008). Environmental Quality Index (EQI) for Engineering Laboratory, .Proc. Indoor Air 2008: The 11th. Int. Conference on Indoor Air Quality and Climate, 17 – 22 August 2008, Copenhagen, Denmark. M.Z.M.Yusof, A.M.Leman, A.Husain, S.M.R.Shah (2006). The Effectiveness of Under Floor Air Distribution (UFAD) System in Controlling Thermal Comfort and Indoor Air Quality., Proc. HB 2006 Healthy Buildings: Creating a Healthy Indoor Environment for People, International Conference, Vol. 11, pp. 135-140, 4-8 June 2006, Lisbon, Portugal. M.Z.M. Yusof, A.M. Leman, A. Husain, S. Hasan, J.P. Jun, N.A. M. Ahyan (2006). Indoor Environmental Quality (IEQ) in Food Processing Industry. Proc. HB 2006 Healthy Buildings: Creating a Healthy Indoor Environment for People, International Conference, Vol.11, pp. 196-199, 4-8 June 2006, Lisbon, Portugal. Mohd Hafirizal Omar (2002), Sindrom Bangunan Berpenyakit. B.Mech.Eng. Thesis, KUiTTHO. Mohd Shukor Othman (2003). Sindrom Bangunan Berpenyakit : Kajian Kes Di Bangunan Pejabat Kerajaan Generasi Baru diBangunan Gunasama Perseketuan, Kluang, B.Mech.Eng. Thesis, KUiTTHO. Ng Peak Sun (2002). Sick Building Syndrome (SBS) – A Field Study on a Government Office Building, B.Mech.Eng. Thesis, KUiTTHO.

39
US EPA. 1993. EPA’s Approach & Progress in Targeting Indoor Air Pollution. United States Environmental Protection Agency. N.M. Adam, A.M. Leman, M.Z.M. Yusof, A. Husain (2006). Dust Levels at Selected Rice Mills in Malaysia, Proc. HB 2006 Healthy Buildings: Creating a Healthy Indoor Environment for People, International Conference, Abstracts, pp.242, 4-8 June 2006, Lisbon, Portugal. Yocom, J.E., Baer, N.S., and Robinson, E., (1986).Air pollution Effects on Physical and Economic Systems, Air Pollution 6: 125-246, Academic Press, New York. A.M. Leman, A.R. Omar, M.Z.M.Yusof, A.Husain, N.M. Adam (2006).Monitoring of Indoor Air Quality for Safety and Health Factor Improvement Towards Sustainable Work Environment in Industry, Proc. ISESSEE 2006 : Int. Symposium & Exhibition on Sustainable Energy & Environment, 3 – 6 December, 2006, Maya Hotel, Kuala Lumpur, Malaysia.

40

41
APPENDIX 1
R &D Facilities at Industrial Environment Laboratory, CEIES, UTHM
Tracer Gas System
IAQ Analyser (Hand held) Aerosol Monitor
42
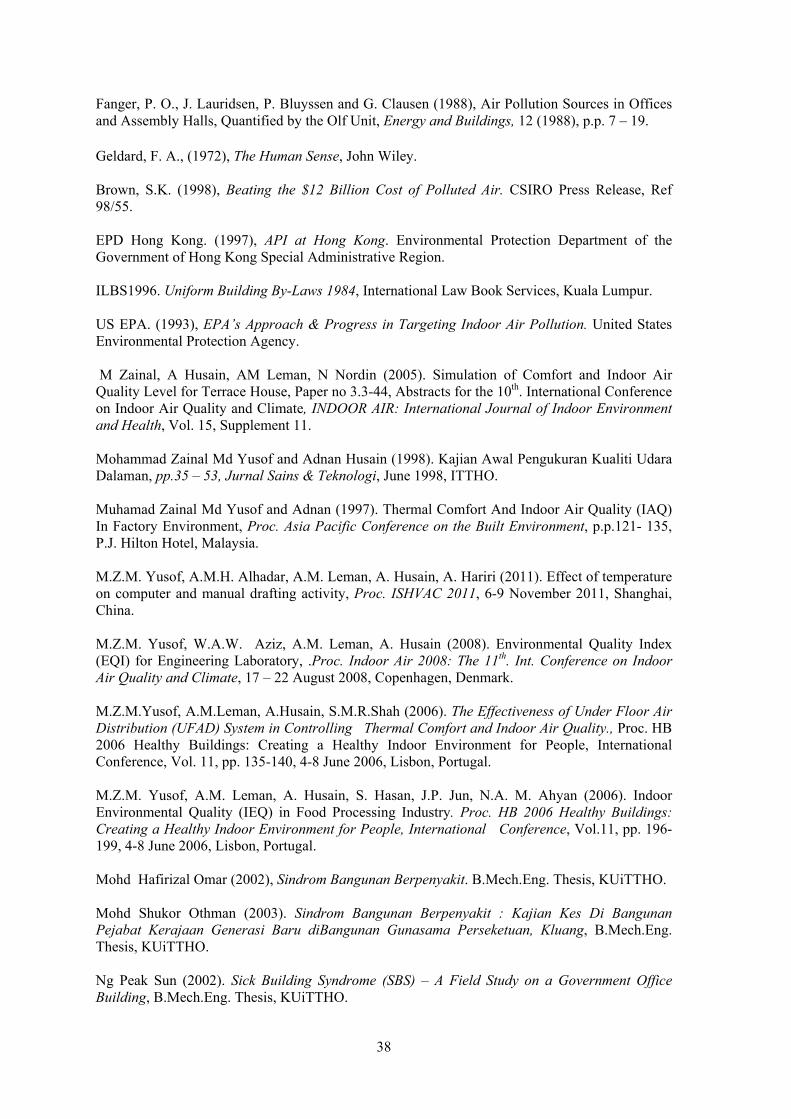
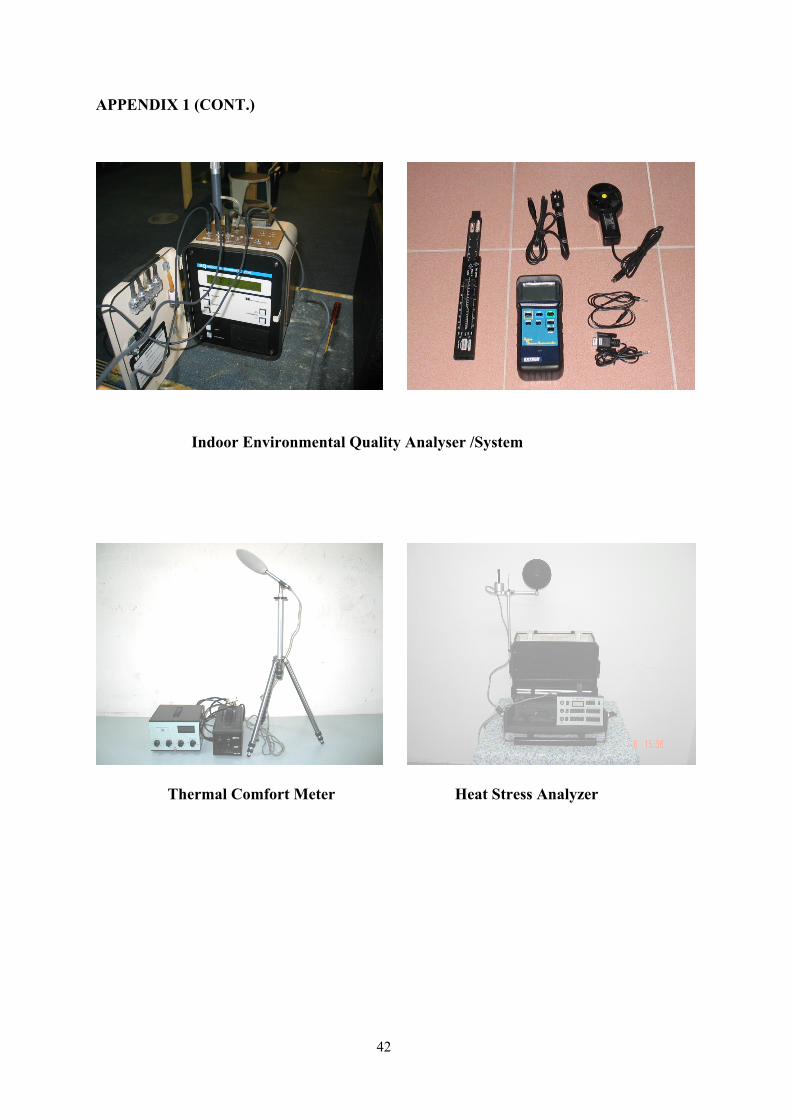
APPENDIX 1 (CONT.)
Indoor Environmental Quality Analyser /System
Thermal Comfort Meter Heat Stress Analyzer

43
Biodata
Professor Ir Mohammad Zainal Md Yusof was born on the 19th March, 1951 in Seremban, Negeri Sembilan. He started his primary education at Sekolah Melayu Rahang, Seremban, Sekolah Melayu Kampung Pandan Dalam, Kuala Lumpur, Sekolah Kebangsaan Jalan Air Molek, Johor Bahru, and Nat.ional Type Primary (English) School, Jalan Pasir Putih, Ipoh and his secondary education at Sekolah Menenggah (Lelaki) Jalan Ampang, Kuala Lumpur. He began his engineering education at Technical College, Kuala Lumpur in 1971 and graduated with a Diploma in Mechanical Engineering in 1974. He was awarded a federal scholarship to study for his B.Sc. in Mechanical Engineering from 1974 - 1976 and M.Sc. in Environmental Engineering (Bldg. Services) from 1978-80 at the University Strathclye, Glasgow.
Professor Ir. Mohammad Zainal Md Yusof began his academic carrier as Assistant Lecturer at the Universiti Teknologi Malaysia in 1976 and appointed as a lecturer in 1986 and Associate Professor in 1986. He has been a staff of UTHM since its inception, that is the then Pusat Latihan Staf Politeknik (PLSP) in 1993. Since then, he has been entrusted with a number of administrative and teaching responsibilities. He held the post of Head of Department, Mechanical Engineering from 1994 to 2000, Head of Programme at the Centre for Graduates studies from 2001 to 2002, the Deputy Dean (Industrial Relation) at the Faculty of Engineering Technology from 2002 to 2004. Prof. Ir. Mohammad Zainal was the first Dean of the Faculty of Mechanical and Manufacturing Engineering, prior to his compulsory retirement from civil service in March 2006 and since then a contract professor at the same faculty.
Prof. Ir. Mohammad Zainal lectures on research methodology, energy study and management, project management, engineering thermodynamic, engineering heat transfer, air conditioning system design, engineers in society and management and professional ethics. His research interest is in areas of design for human needs such as indoor environmental quality, thermal comfort, ventilation and sick building syndrome. To date, Prof. Ir. Mohammad Zainal has authored some 60 publications in international journals and refereed proceedings.
He is actively involved as a mentor for graduate engineers and panel for professional examination with the Institution of Engineers Malaysia (IEM) and Board of Engineers Malaysia (BEM). He also serves as panel member of evaluator for the Engineering Accreditation Council. Professor Ir. Mohammad Zainal also acts as chairman for the Jawatan Kuasa Kawalan Kualiti Buku Teks Pengajian Kejuruteraan Mekanikal, Ministry of Education Malaysia and Dewan Pustaka Malaysia. He is also a member of the Jawatankuasa Teknikal Penilaian Standard (JTPS), Ministry of Human Resources, Malaysia.