Embed Size (px)
Citation preview
Sustainability Report 2015
Doing the right thing for Scotland
01Sustainability Report
Customer charges go towards maintaining and improving:
29,986miles of water pipes
249water treatment works
32,007miles of sewer pipes
1,826waste water treatment works
Our vital role
Scottish Water provides vital water and waste water services, essential to daily life, to 2.46 million households and 150,000 business premises across Scotland.
Every day we provide 1.34 billion litres of clear and fresh drinking water and take away 847 million litres of waste water, which we treat before returning to the environment.
The quality of drinking water received at customers’ taps remains at an all-time high and our investment is helping to support jobs and the economy of Scotland, while protecting and enhancing the environment.
Our average household charges remain among the lowest in Great Britain – £39 lower per year than the average household charge in England and Wales.
We have been delivering one of the largest investment programmes in the UK water industry during 2010–15.
Contents
01 Our vital role Sustainability Report02 Foreword03 Improving resilience for a sustainable society05 Water resource resilience07 Innovative waste water treatment09 The Bridge – pursuing excellence in sustainable
building design11 Supporting a healthy and resilient workforce13 Volunteering in education14 Renewable energy projects – investing in
a low carbon future15 Operational Carbon Footprint 2014/15 Financial and Non-financial Tables19 Energy20 Waste21 Water22 How our industry is run23 Contact details
Icon key
We have developed the 3 icons shown below to represent the Environment, Society and the Economy. We have used the dark blue icons throughout this report to help you quickly identify the areas where our activities are having a positive impact.
Environment Society Economy

02Sustainability Report
Water and waste water services that are resilient to change are vital to a sustainable society. Our challenge is to find ways to be increasingly sustainable in how we deliver those services.
Our purpose is to support the protection of public health and the environment through providing high quality affordable drinking water and safely managing society’s waste water. We do this whilst ensuring our services are affordable and support Scotland’s economy. These are integral to a sustainable society.
We have a vast asset base that requires significant investment to maintain and enhance services to improve our resilience and meet customer, societal and environmental needs. Our assets will last for many decades, serving both current and future generations.
In striving to meet our vision of being trusted to care for the water on which Scotland depends, it is critical we fully understand what society and our customers expect of us, and that we respond to meet their needs.
We worked closely with customer groups and with customers over the past 4 years to understand what they want from their service. Their views have directly influenced our strategic projections and our regulatory business plan, to help us to address society’s needs over the next 25 years.
This, our fourth Sustainability Report, highlights a number of examples of our progress in delivering more resilient and sustainable services. It focuses on how we are working
to improve the resilience of our energy, buildings, people and services as well as the communities in which we live and work.
We’re pleased to report that our underlying carbon emissions fell by 1.4% this year, continuing a downward trend that we have maintained since we started measuring our carbon footprint in 2006/07. However, an increase in the emissions factor for grid electricity has led to a rise in our reportable carbon footprint in 2014/15, the first annual increase in our reportable emissions. Adjusting for changes in electricity emissions factors, our carbon footprint has fallen by over 15% since 2006/07.
We continued to improve our services while our household customers continue to enjoy one of the lowest average charges in Great Britain. Our focus remains on doing the right thing for our customers, the economy and Scotland’s environment.
“ We are committed to acting responsibly in how we deliver resilient services across Scotland – ensuring we continue to serve customers in a changing climate.”
Douglas Millican Chief Executive
Foreword
ResilienceThis refers to our ability to respond to and recover from unpredictable or extreme events, ensuring that we can continue to provide water and waste water services to our customers across Scotland in the face of challenging environmental, social and economic conditions. Achieving this requires us to have resilience built in to our networks, assets, systems and workforce.
03Sustainability Report
Improving resilience for a sustainable society
The water and waste water services we provide play a key role in supporting a sustainable, resilient Scotland. Our core purpose supports the 3 principles of sustainable development:
• Society – we provide vital public health protection through affordable access to safe, wholesome drinking water and safe sanitation, and we are committed to creating the right environment for our people to succeed.
• Environment – we work to ensure the sustainable use of many of Scotland’s water resources and catchments, and to safely treat and return society’s waste water to the environment.
• Economy – we provide efficient, effective services and help Scotland’s communities grow and thrive while delivering value for money to our customers, and we support thousands of construction jobs across Scotland.
We must ensure we deliver our services in a sustainable way. This requires us to work with our customers and stakeholders to balance the demands of society, the environment and the economy.
As we continue to improve efficiency throughout the business, our customers can be reassured that we are delivering more for less as we fulfil our vision of being trusted to care for the water on which Scotland depends.
The average Scottish household pays less than £1 a day for water and waste water services – £39 lower per year than the average bill in England and Wales. We continue to invest, when required, in enhancing our assets to deliver benefits for our customers and to support development in Scotland.
We will continue to improve our environmental performance through maintenance, operation and enhancement of our assets. Through our Business Plan we have implemented a number of projects focussed on resilience, such as an innovative aerated wetland in Fife to treat storm water flows before discharging them to the environment; improving the resilience of our drinking water resources throughout Scotland to ensure future supplies to customers; and the building of our new sustainable office outside Glasgow.
Service resilience is a key focus for Scottish Water. Resilience to climate and environmental change will help secure a sustainable Scotland.
In this report we consider how some of our activities help to improve our resilience. The chapter on Wellbeing & Resilience (page 13) highlights the importance of our people in delivering our services. We need a resilient workforce to be a resilient business.
SUSTAINABLEDEVELOPMENT
Envi
ronm
ent
Economy
Society
Principles of Sustainable Development
04Sustainability Report
In this report we highlight a number of key activities that illustrate how we are seeking to provide our services in a way that balances public health, life in the community, environmental protection and cost including:
• Innovation in waste water treatment
• Generating energy from renewable sources
• Improving resilience through water resource management
• Improving the resilience of our workforce
The work we do today and the developments we make will continue to contribute to the resilience of communities and the environment for years to come. We will continue to work in a more sustainable way to deliver your water and waste water services.
Highlights of the year
Customers help us to reduce sewer blockages and the associated flooding and pollution risks.
Partnership working helps prevent pollution at source and creates space for nature.
Our focus on finding sustainable ways to deliver our services helps to keep customers’ bills down.
We use modern hydropower installations to generate low-carbon electricity (Chapter 6)
Wetland schemes can provide sustainable waste water treatment (Chapter 2)
How did this activity contribute to our resilience?Building resilience is achieved in many different ways. At the end of each chapter we explain how the initiatives we’ve explored have contributed to building our resilience.
05Sustainability Report
Water resource resilience
Water resource resilience refers to Scottish Water’s ability to provide adequate quantities of treated water to our customers, taking into account various environmental, regulatory and asset-based limitations.
As part of our Business Planning process we produce a Water Resource Plan (WRP). The WRP examines current and future challenges and opportunities that we face in ensuring all customers have a secure supply of clear, fresh, safe drinking water for the next 25 years and beyond. In the WRP, we identify investment to improve the resilience of our water resources, reducing the risk of customers experiencing long-term interruptions to their supply caused by water resource limitations.
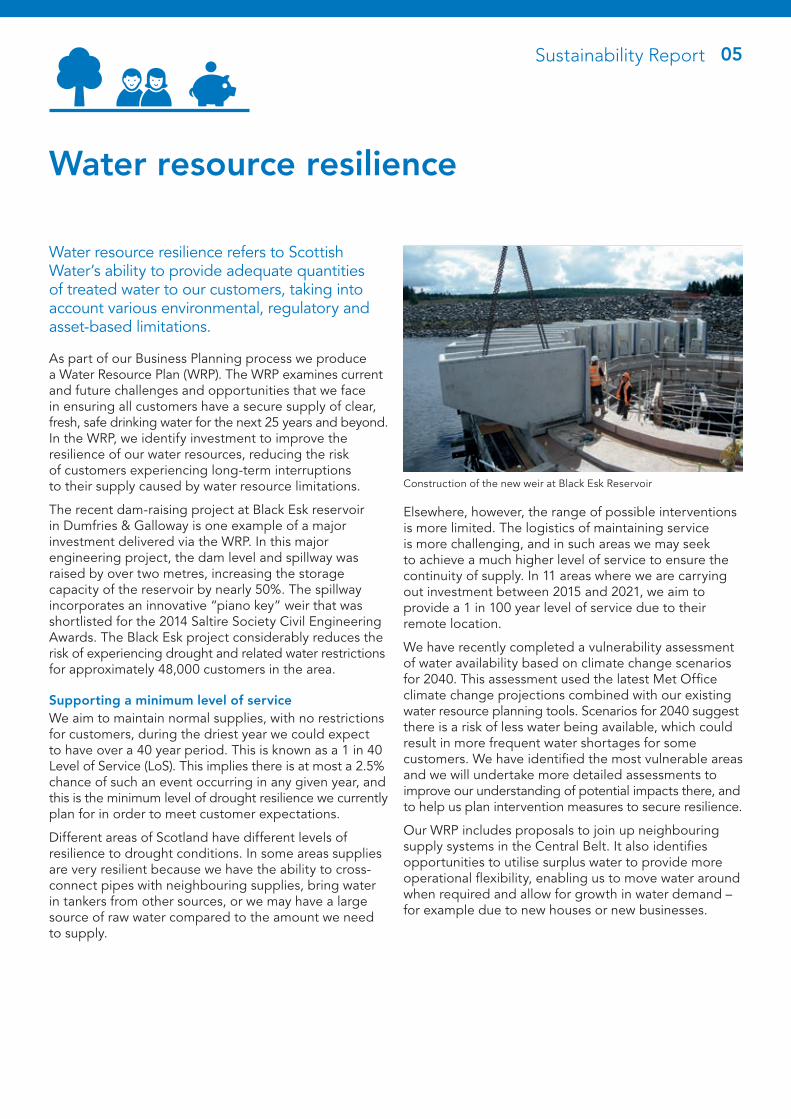
The recent dam-raising project at Black Esk reservoir in Dumfries & Galloway is one example of a major investment delivered via the WRP. In this major engineering project, the dam level and spillway was raised by over two metres, increasing the storage capacity of the reservoir by nearly 50%. The spillway incorporates an innovative “piano key” weir that was shortlisted for the 2014 Saltire Society Civil Engineering Awards. The Black Esk project considerably reduces the risk of experiencing drought and related water restrictions for approximately 48,000 customers in the area.
Supporting a minimum level of serviceWe aim to maintain normal supplies, with no restrictions for customers, during the driest year we could expect to have over a 40 year period. This is known as a 1 in 40 Level of Service (LoS). This implies there is at most a 2.5% chance of such an event occurring in any given year, and this is the minimum level of drought resilience we currently plan for in order to meet customer expectations.
Different areas of Scotland have different levels of resilience to drought conditions. In some areas supplies are very resilient because we have the ability to cross- connect pipes with neighbouring supplies, bring water in tankers from other sources, or we may have a large source of raw water compared to the amount we need to supply.
Construction of the new weir at Black Esk Reservoir
Elsewhere, however, the range of possible interventions is more limited. The logistics of maintaining service is more challenging, and in such areas we may seek to achieve a much higher level of service to ensure the continuity of supply. In 11 areas where we are carrying out investment between 2015 and 2021, we aim to provide a 1 in 100 year level of service due to their remote location.
We have recently completed a vulnerability assessment of water availability based on climate change scenarios for 2040. This assessment used the latest Met Office climate change projections combined with our existing water resource planning tools. Scenarios for 2040 suggest there is a risk of less water being available, which could result in more frequent water shortages for some customers. We have identified the most vulnerable areas and we will undertake more detailed assessments to improve our understanding of potential impacts there, and to help us plan intervention measures to secure resilience.
Our WRP includes proposals to join up neighbouring supply systems in the Central Belt. It also identifies opportunities to utilise surplus water to provide more operational flexibility, enabling us to move water around when required and allow for growth in water demand – for example due to new houses or new businesses.
06Sustainability Report
Our Drought Plans demonstrate our ability to continue to serve customers when faced with an extreme dry weather event. Having management plans in place, agreed with SEPA, ensures environmental impact is minimal as a drought emerges. Operational measures to maintain service for our customers typically include asking customers to use water wisely, increased leakage detection and repair, reducing the volumes of compensation flows, and tankering from other sources to supplement supplies.
Protecting the water environmentAs well as our duty to customers, we have a responsibility to protect the environment. All of our water abstractions are licenced by SEPA to meet European Water Framework Directive environmental standards, including facilities such as compensation flows (the flow Scottish Water needs to maintain to ensure the health of the environment) and provision of fish passes (to allow fishes to swim past obstacles such as dams).
All of these measures help improve the resilience of our water resources to future demand and environmental change.
How did this activity contribute to our resilience?Planning ahead to take account of a changing climate is a key element of developing a truly resilient water service strategy. Only by understanding how changes in rainfall patterns are likely to affect different water resource zones can we put in place measures to ensure secure levels of service can be maintained for all our customers.
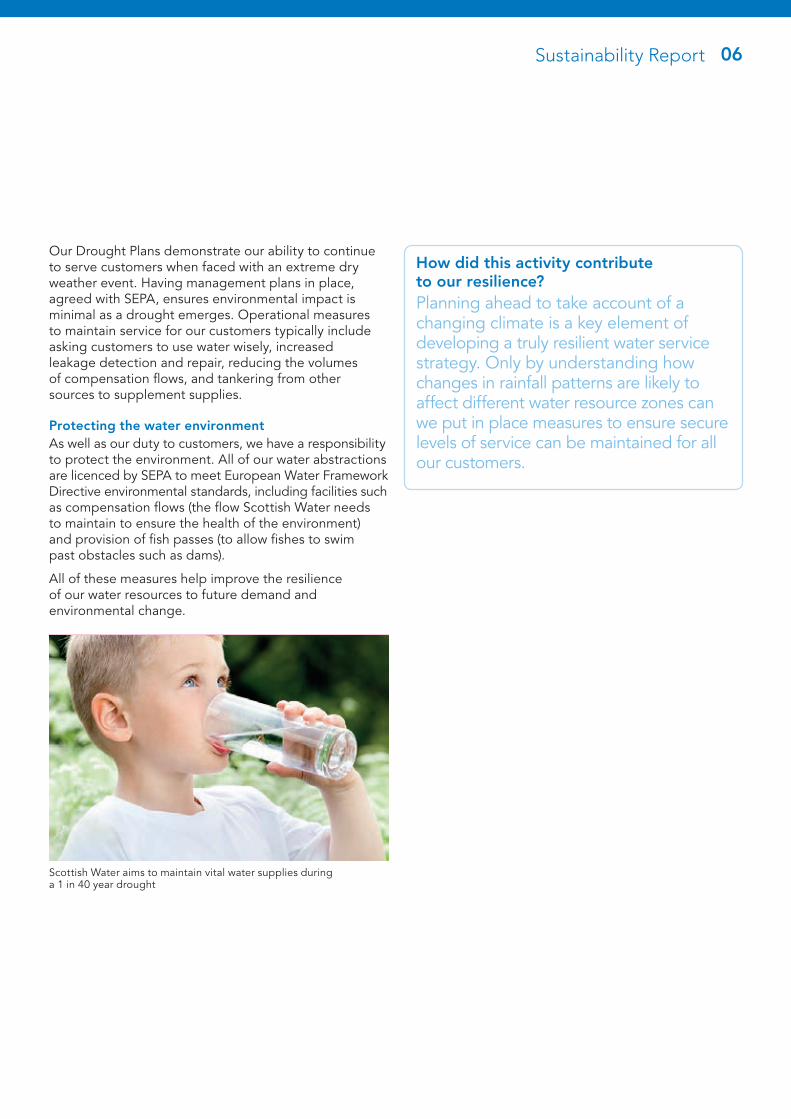
Scottish Water aims to maintain vital water supplies during a 1 in 40 year drought
07Sustainability Report
Innovative waste water treatment
Scottish Water is responsible for treating waste water and returning it safely to the environment. A project in Fife shows how natural processes can help to transform a watercourse that was seriously polluted by sewage overflows. As well as tackling pollution, the wetland provides a valuable wildlife habitat and saves energy.
The Cowdenbeath Wetlands Project is an innovative environmental solution that uses natural processes to treat water that previously spilt from two combined sewer overflows (CSOs) directly to the Lochgelly Burn. CSOs are designed to discharge flows to water bodies during periods of high rainfall, to protect houses and businesses from flooding.
Most CSOs cause little or no environmental impact. But some result in pollution that can degrade local streams and rivers, as was the case with the overflows at Cowdenbeath – the Lochgelly Burn has a very low flow rate and could not provide enough dilution to prevent unacceptable environmental impact.
Applying innovative technologyThis was resolved by a three-phase project: construction of a 4,000m2 wetland, installation of a screen and sewer connection from one of the overflows, and an upgrade of the pumping stations and tanks that previously handled the storm water.
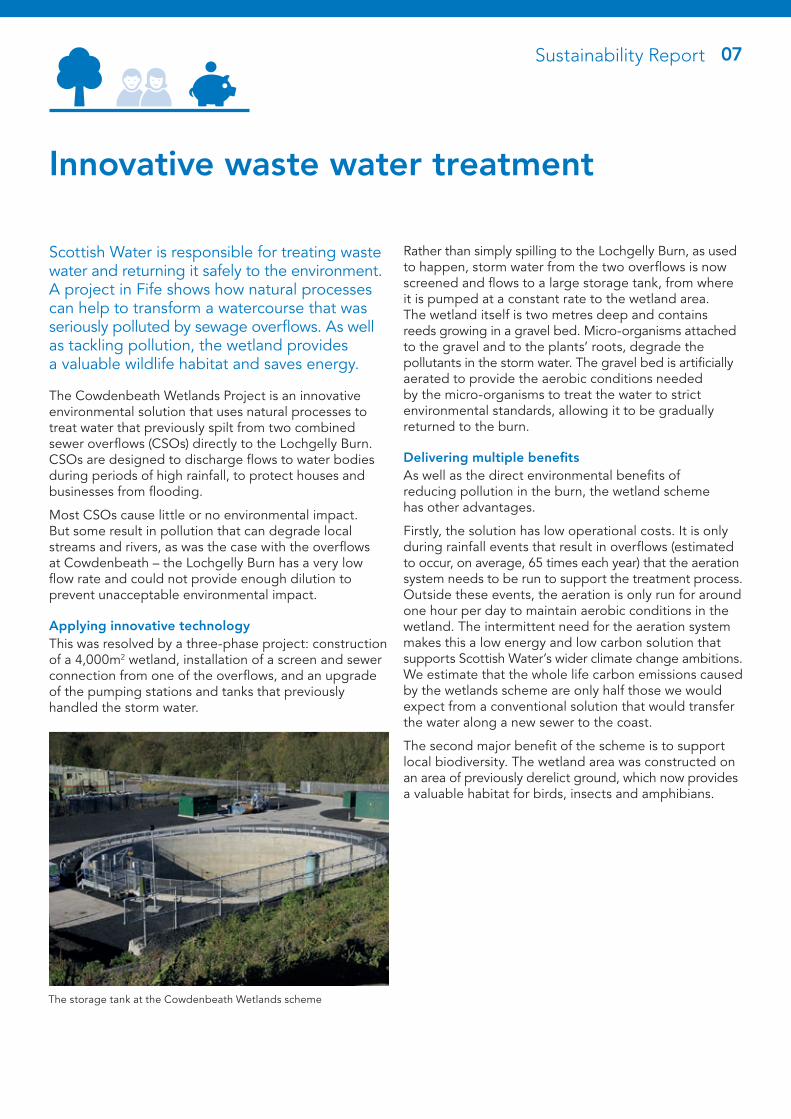
Rather than simply spilling to the Lochgelly Burn, as used to happen, storm water from the two overflows is now screened and flows to a large storage tank, from where it is pumped at a constant rate to the wetland area. The wetland itself is two metres deep and contains reeds growing in a gravel bed. Micro-organisms attached to the gravel and to the plants’ roots, degrade the pollutants in the storm water. The gravel bed is artificially aerated to provide the aerobic conditions needed by the micro-organisms to treat the water to strict environmental standards, allowing it to be gradually returned to the burn.
Delivering multiple benefitsAs well as the direct environmental benefits of reducing pollution in the burn, the wetland scheme has other advantages.
Firstly, the solution has low operational costs. It is only during rainfall events that result in overflows (estimated to occur, on average, 65 times each year) that the aeration system needs to be run to support the treatment process. Outside these events, the aeration is only run for around one hour per day to maintain aerobic conditions in the wetland. The intermittent need for the aeration system makes this a low energy and low carbon solution that supports Scottish Water’s wider climate change ambitions. We estimate that the whole life carbon emissions caused by the wetlands scheme are only half those we would expect from a conventional solution that would transfer the water along a new sewer to the coast.
The second major benefit of the scheme is to support local biodiversity. The wetland area was constructed on an area of previously derelict ground, which now provides a valuable habitat for birds, insects and amphibians.
The storage tank at the Cowdenbeath Wetlands scheme

08Sustainability Report
Finally, innovative remediation work to treat contaminated land in-situ saved some 16,000m3 of soil from being sent to landfill, avoiding the need for 3,200 vehicle movements. Eddie Burns, Scottish Water’s project manager for the scheme, said:
“This was a site that nobody had cared for for a long period of time, and we’ve returned it to a state where it looks great, reeds are growing and we’ve enhanced the environment as well.”
Enhancing the local environmentThe Lochgelly Burn had been classified by SEPA as being “Seriously Polluted” on its River Classification Scheme, partly as a result of the overflows. The wetland scheme is expected to play a key role in raising the standard to “Good”, a significant improvement in local environmental conditions.
How did this activity contribute to our resilience?Innovative wastewater treatment schemes such as the Cowdenbeath Wetlands allow us to meet strict environmental standards while saving money and using less energy. Natural processes are inherently more resilient to change than fixed processes. Using natural processes to treat wastewater overflows is a more cost- and carbon-effective way to improve our environmental performance, contributing to our financial resilience.
Water before and after treatment in the wetlands
09Sustainability Report
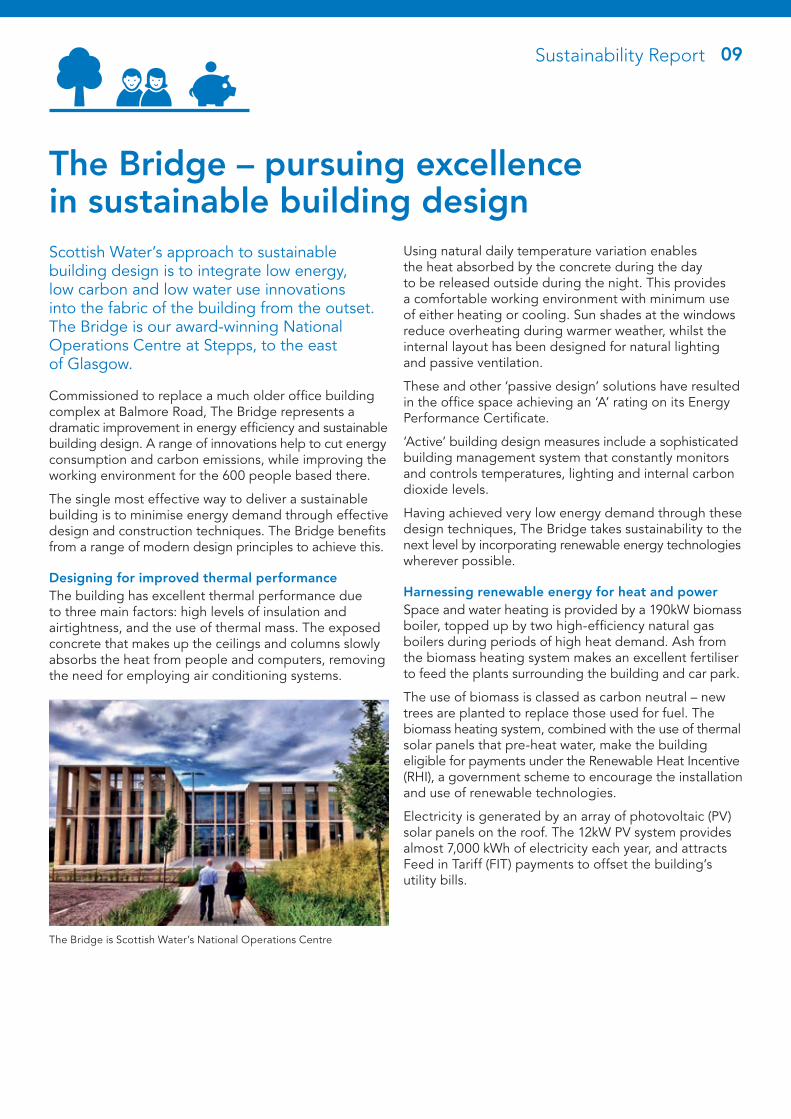
Scottish Water’s approach to sustainable building design is to integrate low energy, low carbon and low water use innovations into the fabric of the building from the outset. The Bridge is our award-winning National Operations Centre at Stepps, to the east of Glasgow.
Commissioned to replace a much older office building complex at Balmore Road, The Bridge represents a dramatic improvement in energy efficiency and sustainable building design. A range of innovations help to cut energy consumption and carbon emissions, while improving the working environment for the 600 people based there.
The single most effective way to deliver a sustainable building is to minimise energy demand through effective design and construction techniques. The Bridge benefits from a range of modern design principles to achieve this.
Designing for improved thermal performanceThe building has excellent thermal performance due to three main factors: high levels of insulation and airtightness, and the use of thermal mass. The exposed concrete that makes up the ceilings and columns slowly absorbs the heat from people and computers, removing the need for employing air conditioning systems.
Using natural daily temperature variation enables the heat absorbed by the concrete during the day to be released outside during the night. This provides a comfortable working environment with minimum use of either heating or cooling. Sun shades at the windows reduce overheating during warmer weather, whilst the internal layout has been designed for natural lighting and passive ventilation.
These and other ‘passive design’ solutions have resulted in the office space achieving an ‘A’ rating on its Energy Performance Certificate.
‘Active’ building design measures include a sophisticated building management system that constantly monitors and controls temperatures, lighting and internal carbon dioxide levels.
Having achieved very low energy demand through these design techniques, The Bridge takes sustainability to the next level by incorporating renewable energy technologies wherever possible.
Harnessing renewable energy for heat and powerSpace and water heating is provided by a 190kW biomass boiler, topped up by two high-efficiency natural gas boilers during periods of high heat demand. Ash from the biomass heating system makes an excellent fertiliser to feed the plants surrounding the building and car park.
The use of biomass is classed as carbon neutral – new trees are planted to replace those used for fuel. The biomass heating system, combined with the use of thermal solar panels that pre-heat water, make the building eligible for payments under the Renewable Heat Incentive (RHI), a government scheme to encourage the installation and use of renewable technologies.
Electricity is generated by an array of photovoltaic (PV) solar panels on the roof. The 12kW PV system provides almost 7,000 kWh of electricity each year, and attracts Feed in Tariff (FIT) payments to offset the building’s utility bills.
The Bridge – pursuing excellence in sustainable building design
The Bridge is Scottish Water’s National Operations Centre
10Sustainability Report
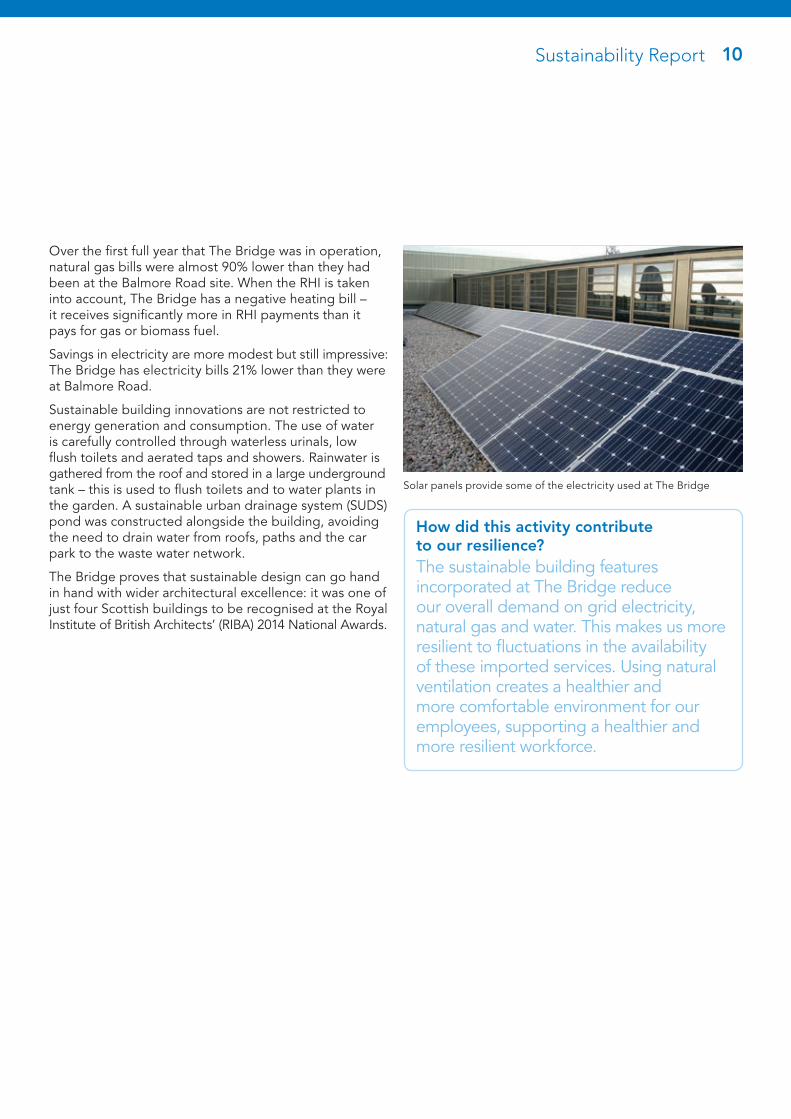
Over the first full year that The Bridge was in operation, natural gas bills were almost 90% lower than they had been at the Balmore Road site. When the RHI is taken into account, The Bridge has a negative heating bill – it receives significantly more in RHI payments than it pays for gas or biomass fuel.
Savings in electricity are more modest but still impressive: The Bridge has electricity bills 21% lower than they were at Balmore Road.
Sustainable building innovations are not restricted to energy generation and consumption. The use of water is carefully controlled through waterless urinals, low flush toilets and aerated taps and showers. Rainwater is gathered from the roof and stored in a large underground tank – this is used to flush toilets and to water plants in the garden. A sustainable urban drainage system (SUDS) pond was constructed alongside the building, avoiding the need to drain water from roofs, paths and the car park to the waste water network.
The Bridge proves that sustainable design can go hand in hand with wider architectural excellence: it was one of just four Scottish buildings to be recognised at the Royal Institute of British Architects’ (RIBA) 2014 National Awards.
How did this activity contribute to our resilience?The sustainable building features incorporated at The Bridge reduce our overall demand on grid electricity, natural gas and water. This makes us more resilient to fluctuations in the availability of these imported services. Using natural ventilation creates a healthier and more comfortable environment for our employees, supporting a healthier and more resilient workforce.
Solar panels provide some of the electricity used at The Bridge
11Sustainability Report
Supporting a healthy and resilient workforceWhen Scottish Water mentions its assets, we are normally referring to the treatment works, pumping stations and other physical structures that enable us to provide water and waste water services. But when it comes to ensuring we are fit to withstand the challenges of the future, our most important asset is our workforce.
Keeping our people safe, healthy and resilient is of fundamental importance to Scottish Water. We described the importance of health and safety in our 2013 Sustainability Report; in this edition we discuss the initiatives we have developed to support overall wellbeing and resilience amongst our workforce. The programme covers four interconnected areas:
• Physical wellbeing
• Emotional wellbeing
• The energised person
• Agility in the workplace
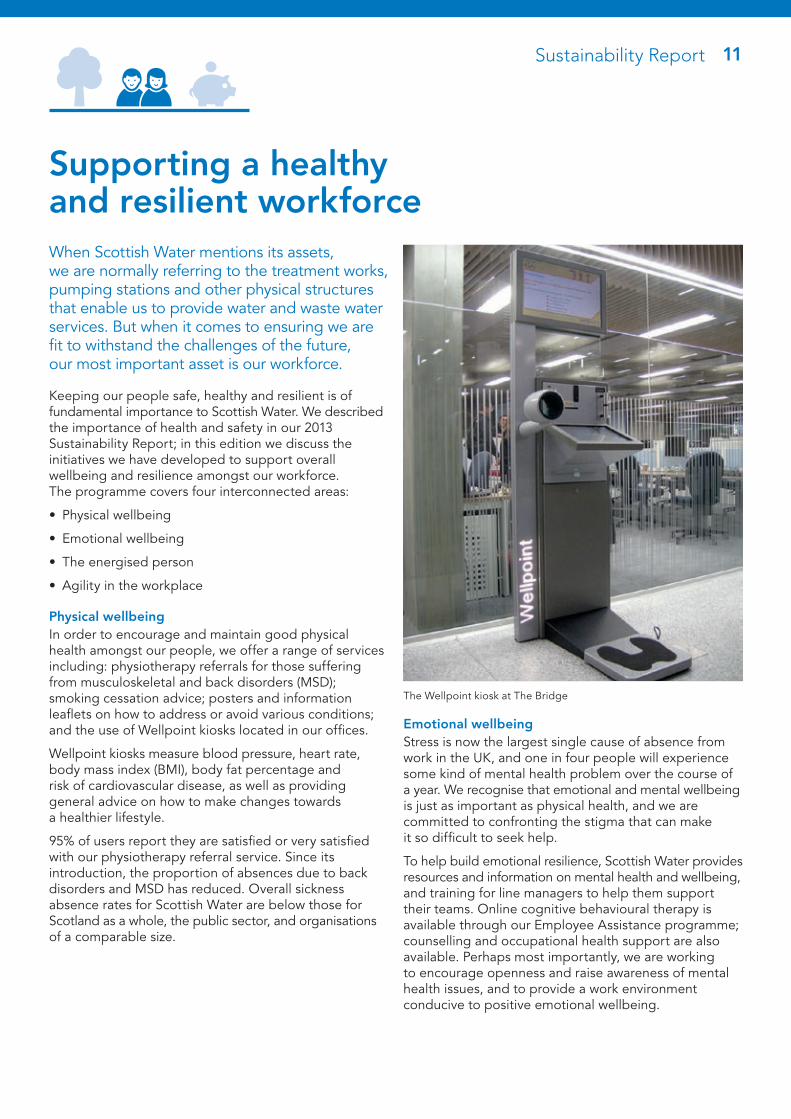
Physical wellbeingIn order to encourage and maintain good physical health amongst our people, we offer a range of services including: physiotherapy referrals for those suffering from musculoskeletal and back disorders (MSD); smoking cessation advice; posters and information leaflets on how to address or avoid various conditions; and the use of Wellpoint kiosks located in our offices.
Wellpoint kiosks measure blood pressure, heart rate, body mass index (BMI), body fat percentage and risk of cardiovascular disease, as well as providing general advice on how to make changes towards a healthier lifestyle.
95% of users report they are satisfied or very satisfied with our physiotherapy referral service. Since its introduction, the proportion of absences due to back disorders and MSD has reduced. Overall sickness absence rates for Scottish Water are below those for Scotland as a whole, the public sector, and organisations of a comparable size.
The Wellpoint kiosk at The Bridge
Emotional wellbeingStress is now the largest single cause of absence from work in the UK, and one in four people will experience some kind of mental health problem over the course of a year. We recognise that emotional and mental wellbeing is just as important as physical health, and we are committed to confronting the stigma that can make it so difficult to seek help.
To help build emotional resilience, Scottish Water provides resources and information on mental health and wellbeing, and training for line managers to help them support their teams. Online cognitive behavioural therapy is available through our Employee Assistance programme; counselling and occupational health support are also available. Perhaps most importantly, we are working to encourage openness and raise awareness of mental health issues, and to provide a work environment conducive to positive emotional wellbeing.
12Sustainability Report
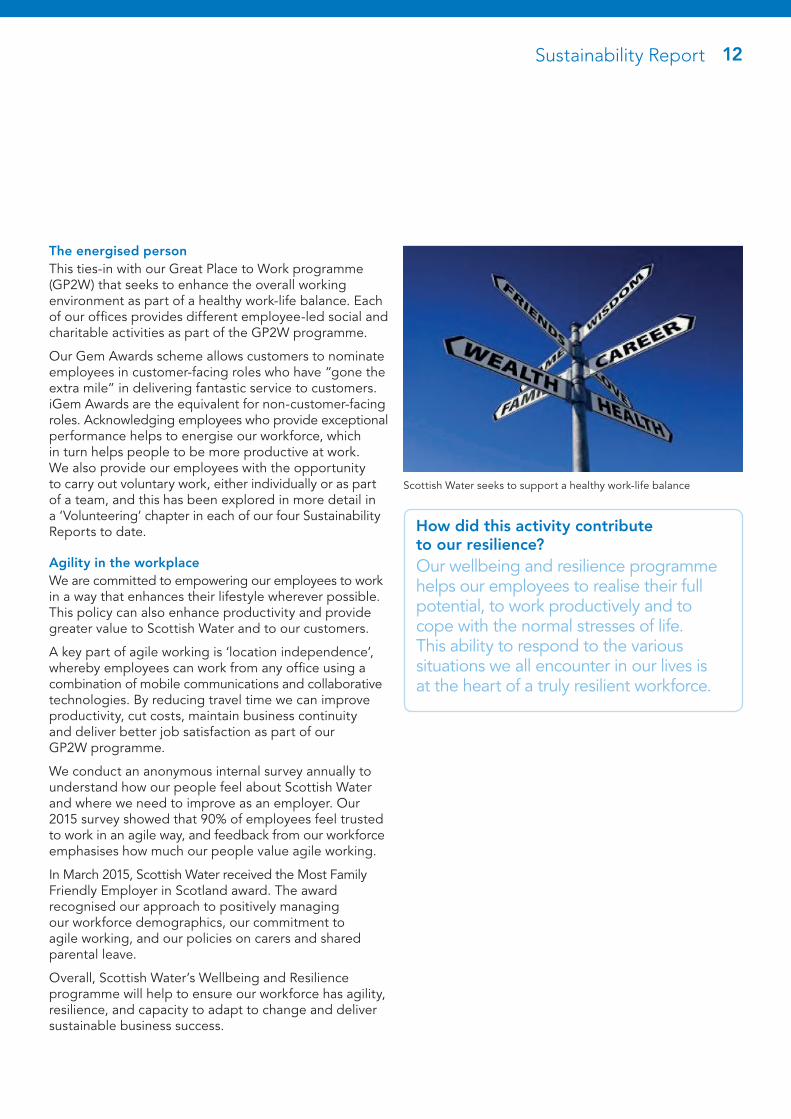
The energised personThis ties-in with our Great Place to Work programme (GP2W) that seeks to enhance the overall working environment as part of a healthy work-life balance. Each of our offices provides different employee-led social and charitable activities as part of the GP2W programme.
Our Gem Awards scheme allows customers to nominate employees in customer-facing roles who have “gone the extra mile” in delivering fantastic service to customers. iGem Awards are the equivalent for non-customer-facing roles. Acknowledging employees who provide exceptional performance helps to energise our workforce, which in turn helps people to be more productive at work. We also provide our employees with the opportunity to carry out voluntary work, either individually or as part of a team, and this has been explored in more detail in a ‘Volunteering’ chapter in each of our four Sustainability Reports to date.
Agility in the workplaceWe are committed to empowering our employees to work in a way that enhances their lifestyle wherever possible. This policy can also enhance productivity and provide greater value to Scottish Water and to our customers.
A key part of agile working is ‘location independence’, whereby employees can work from any office using a combination of mobile communications and collaborative technologies. By reducing travel time we can improve productivity, cut costs, maintain business continuity and deliver better job satisfaction as part of our GP2W programme.
We conduct an anonymous internal survey annually to understand how our people feel about Scottish Water and where we need to improve as an employer. Our 2015 survey showed that 90% of employees feel trusted to work in an agile way, and feedback from our workforce emphasises how much our people value agile working.
In March 2015, Scottish Water received the Most Family Friendly Employer in Scotland award. The award recognised our approach to positively managing our workforce demographics, our commitment to agile working, and our policies on carers and shared parental leave.
Overall, Scottish Water’s Wellbeing and Resilience programme will help to ensure our workforce has agility, resilience, and capacity to adapt to change and deliver sustainable business success.
How did this activity contribute to our resilience?Our wellbeing and resilience programme helps our employees to realise their full potential, to work productively and to cope with the normal stresses of life. This ability to respond to the various situations we all encounter in our lives is at the heart of a truly resilient workforce.
Scottish Water seeks to support a healthy work-life balance
13Sustainability Report
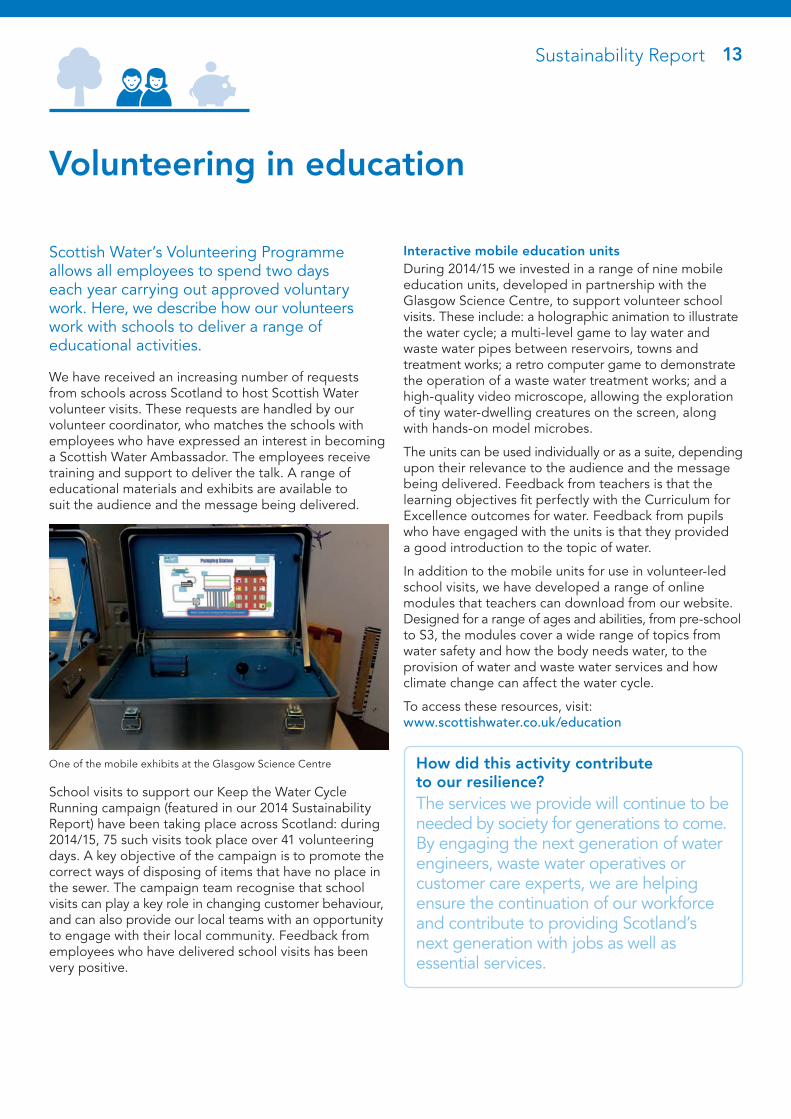
Interactive mobile education unitsDuring 2014/15 we invested in a range of nine mobile education units, developed in partnership with the Glasgow Science Centre, to support volunteer school visits. These include: a holographic animation to illustrate the water cycle; a multi-level game to lay water and waste water pipes between reservoirs, towns and treatment works; a retro computer game to demonstrate the operation of a waste water treatment works; and a high-quality video microscope, allowing the exploration of tiny water-dwelling creatures on the screen, along with hands-on model microbes.
The units can be used individually or as a suite, depending upon their relevance to the audience and the message being delivered. Feedback from teachers is that the learning objectives fit perfectly with the Curriculum for Excellence outcomes for water. Feedback from pupils who have engaged with the units is that they provided a good introduction to the topic of water.
In addition to the mobile units for use in volunteer-led school visits, we have developed a range of online modules that teachers can download from our website. Designed for a range of ages and abilities, from pre-school to S3, the modules cover a wide range of topics from water safety and how the body needs water, to the provision of water and waste water services and how climate change can affect the water cycle.
To access these resources, visit: www.scottishwater.co.uk/education
Volunteering in education
Scottish Water’s Volunteering Programme allows all employees to spend two days each year carrying out approved voluntary work. Here, we describe how our volunteers work with schools to deliver a range of educational activities.
We have received an increasing number of requests from schools across Scotland to host Scottish Water volunteer visits. These requests are handled by our volunteer coordinator, who matches the schools with employees who have expressed an interest in becoming a Scottish Water Ambassador. The employees receive training and support to deliver the talk. A range of educational materials and exhibits are available to suit the audience and the message being delivered.
School visits to support our Keep the Water Cycle Running campaign (featured in our 2014 Sustainability Report) have been taking place across Scotland: during 2014/15, 75 such visits took place over 41 volunteering days. A key objective of the campaign is to promote the correct ways of disposing of items that have no place in the sewer. The campaign team recognise that school visits can play a key role in changing customer behaviour, and can also provide our local teams with an opportunity to engage with their local community. Feedback from employees who have delivered school visits has been very positive.
One of the mobile exhibits at the Glasgow Science Centre How did this activity contribute to our resilience?The services we provide will continue to be needed by society for generations to come. By engaging the next generation of water engineers, waste water operatives or customer care experts, we are helping ensure the continuation of our workforce and contribute to providing Scotland’s next generation with jobs as well as essential services.

14Sustainability Report
The new installation allows connection to the national grid, and is also significantly larger, at 148 kW. It was commissioned at the end of 2013 and has run smoothly ever since. During the operating year 2014/15, the turbine generated 1,057 MWh of zero-carbon electricity, 886 MWh of which was exported to the grid, with the remainder being used on site.
Through Feed-In and Export Tariffs, the scheme earned Scottish Water £214,000 in income. An additional benefit is that operators on site have become much more energy- conscious as a result of the hydro installation at Megget, and have enthusiastically engaged with the project.
Renewable energy – planning for the futureLooking forward to the next investment period, Scottish Water will continue to invest in renewable energy projects. Between 2015 and 2021, we plan to install renewables with the capacity to generate a further 6.5 GWh of electricity each year. Over the same period, energy efficiency initiatives will reduce our overall electricity demand by 11.0 GWh per year.
Renewable energy projects – investing in a low carbon futureThe zero-carbon electricity we generate from our renewables portfolio reduces the amount of power we import from the grid, and allows us to offset our carbon footprint by exporting the surplus.
The largest element in Scottish Water’s operational carbon footprint (CFP) is emissions related to consumption of grid electricity. In 2014/15, grid electricity emissions contributed 76% of our total CFP. Reducing the amount of power we import from the grid is therefore central to our long term carbon management strategy.
During our SR10 investment period (2010-2015), we installed a total of 6.0 MW of renewable electricity capacity: 3.6 MW from hydro (water), 0.2 MW from small-scale wind, 1.9 MW from photovoltaic solar (PV) and 0.3 MW from anaerobic digestion. The renewable installations commissioned during this period have the potential to generate 25 GWh of carbon-free electricity each year, with the potential to reduce our annual footprint by 13,250 tonnes of carbon dioxide equivalent.
Case study: The Megget hydro schemeThe hydro installation recently commissioned at Megget Reservoir in the Scottish Borders, is a good example of the way we’ve been investing in modern renewable energy schemes. There was previously a 30 kW hydro turbine driven by the reservoir’s compensation flow (the flow from the dam that Scottish Water needs to maintain to ensure the health of the Megget Water).
The new hydropower installation at Megget Reservoir
How did this activity contribute to our resilience?By increasing our renewable energy generating capacity, we reduce the amount of power we import from the national grid, reducing our reliance on external power sources. As well as cutting our energy costs and carbon footprint, this improves our energy security by making us more resilient to fluctuations in the cost and availability of electricity from the grid.
15
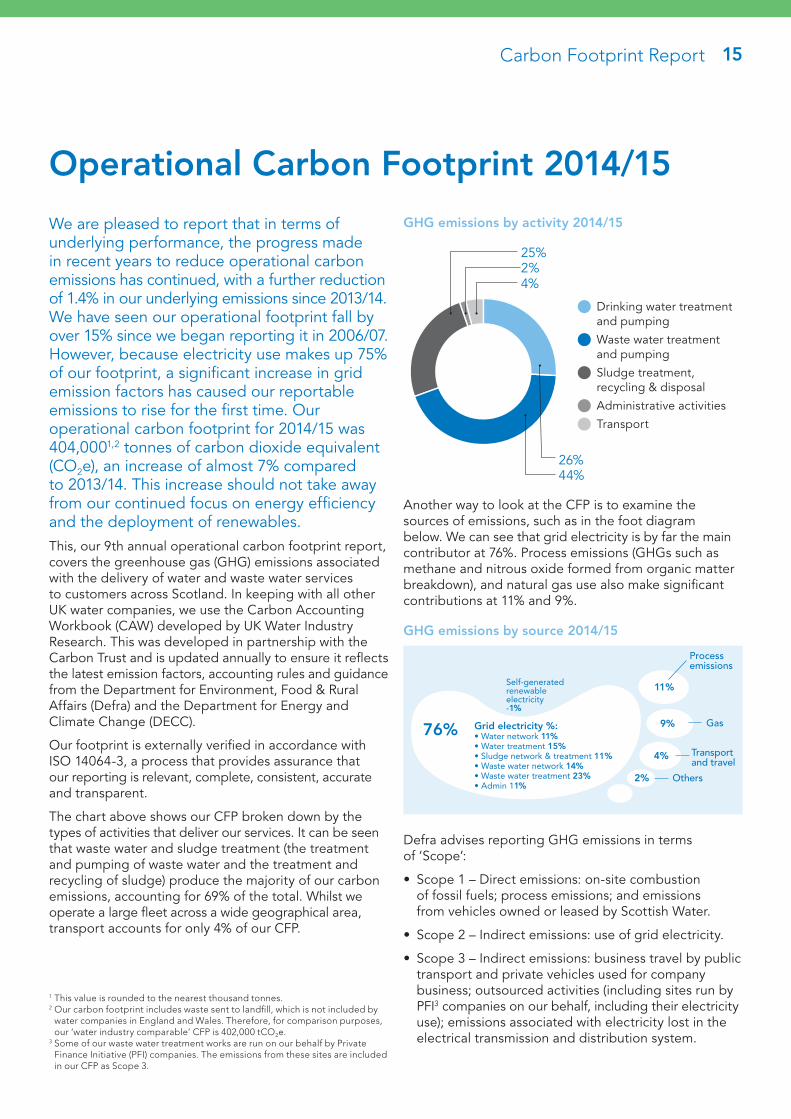
Another way to look at the CFP is to examine the sources of emissions, such as in the foot diagram below. We can see that grid electricity is by far the main contributor at 76%. Process emissions (GHGs such as methane and nitrous oxide formed from organic matter breakdown), and natural gas use also make significant contributions at 11% and 9%.
Defra advises reporting GHG emissions in terms of ‘Scope’:
• Scope 1 – Direct emissions: on-site combustion of fossil fuels; process emissions; and emissions from vehicles owned or leased by Scottish Water.
• Scope 2 – Indirect emissions: use of grid electricity.
• Scope 3 – Indirect emissions: business travel by public transport and private vehicles used for company business; outsourced activities (including sites run by PFI3 companies on our behalf, including their electricity use); emissions associated with electricity lost in the electrical transmission and distribution system.
Carbon Footprint Report
Operational Carbon Footprint 2014/15
We are pleased to report that in terms of underlying performance, the progress made in recent years to reduce operational carbon emissions has continued, with a further reduction of 1.4% in our underlying emissions since 2013/14. We have seen our operational footprint fall by over 15% since we began reporting it in 2006/07. However, because electricity use makes up 75% of our footprint, a significant increase in grid emission factors has caused our reportable emissions to rise for the first time. Our operational carbon footprint for 2014/15 was 404,0001,2 tonnes of carbon dioxide equivalent (CO2e), an increase of almost 7% compared to 2013/14. This increase should not take away from our continued focus on energy efficiency and the deployment of renewables.This, our 9th annual operational carbon footprint report, covers the greenhouse gas (GHG) emissions associated with the delivery of water and waste water services to customers across Scotland. In keeping with all other UK water companies, we use the Carbon Accounting Workbook (CAW) developed by UK Water Industry Research. This was developed in partnership with the Carbon Trust and is updated annually to ensure it reflects the latest emission factors, accounting rules and guidance from the Department for Environment, Food & Rural Affairs (Defra) and the Department for Energy and Climate Change (DECC).
Our footprint is externally verified in accordance with ISO 14064-3, a process that provides assurance that our reporting is relevant, complete, consistent, accurate and transparent.
The chart above shows our CFP broken down by the types of activities that deliver our services. It can be seen that waste water and sludge treatment (the treatment and pumping of waste water and the treatment and recycling of sludge) produce the majority of our carbon emissions, accounting for 69% of the total. Whilst we operate a large fleet across a wide geographical area, transport accounts for only 4% of our CFP.
1 This value is rounded to the nearest thousand tonnes.2 Our carbon footprint includes waste sent to landfill, which is not included by
water companies in England and Wales. Therefore, for comparison purposes, our ‘water industry comparable’ CFP is 402,000 tCO2e.
3 Some of our waste water treatment works are run on our behalf by Private Finance Initiative (PFI) companies. The emissions from these sites are included in our CFP as Scope 3.
Drinking water treatment and pumping
Waste water treatment and pumping
Sludge treatment, recycling & disposal
Administrative activities
Transport
25%
4%2%
26%44%
GHG emissions by activity 2014/15
GHG emissions by source 2014/15
76%
Process emissions
11%
Gas9%
Others2%
Transport and travel
4%
Self-generated renewable electricity -1%
Grid electricity %:• Water network 11%• Water treatment 15%• Sludge network & treatment 11%• Waste water network 14%• Waste water treatment 23%• Admin 11%
16Carbon Footprint Report
Carbon Intensity of Water and Waste waterIt is useful to understand the carbon intensity of our service – the amount of carbon emitted to treat and supply a litre of water or collect and treat a litre of waste water.
Our water service has the lowest carbon intensity in the UK. This is mainly due to more opportunity to use gravity to supply our customers (rather than pumping).
Our waste water service carbon intensity is slightly lower than the UK average. We now calculate this on the ‘flow to full treatment’ (i.e. it includes much of the rain water that enters our sewers). Previously it was calculated excluding rainwater, but few water companies now share that measure and we can no longer undertake a comparison.
Customers who know how much water they use and waste water they produce (in litres or megalitres) can use the carbon intensity figures in the table below to calculate their water and waste water CFP (CO2e in grams per litre (g/l) or tonnes per mega litre (t/Ml))4,5.
Customer footprinting
Emissions SourcesCO2e emissions (g/l or t/Ml)
Drinking water services – includes extraction, treatment & pumping of drinking water supply
0.17
Waste water services – includes pumping & treatment of waste water and transport & treatment of sludges
0.336
4 Figures include emissions associated with administration, transport and waste sent to landfill; i.e. our whole operational CFP shared between water and waste water. They are indicative and based on the best available information. They will change over time and customers should ensure they use the latest figures if calculating emissions associated with their water and waste water services.
5 Water Industry Comparison: As with overall CFPs, UK water industry carbon intensity ratios exclude waste to landfill. Our ‘water industry comparable’ carbon intensity figures are: Water = 0.16; Waste water = 0.32.
6 The carbon intensity figures for waste water are not comparable to past years because the metric has changed as explained.
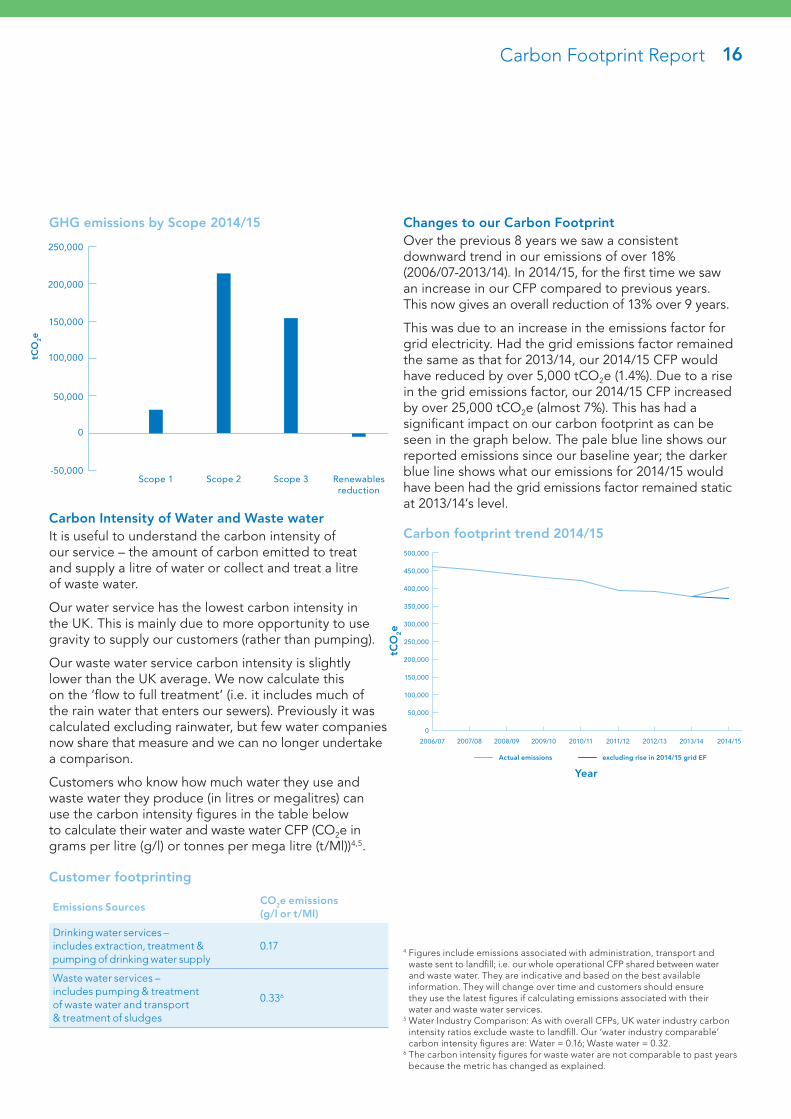
Changes to our Carbon FootprintOver the previous 8 years we saw a consistent downward trend in our emissions of over 18% (2006/07-2013/14). In 2014/15, for the first time we saw an increase in our CFP compared to previous years. This now gives an overall reduction of 13% over 9 years.
This was due to an increase in the emissions factor for grid electricity. Had the grid emissions factor remained the same as that for 2013/14, our 2014/15 CFP would have reduced by over 5,000 tCO2e (1.4%). Due to a rise in the grid emissions factor, our 2014/15 CFP increased by over 25,000 tCO2e (almost 7%). This has had a significant impact on our carbon footprint as can be seen in the graph below. The pale blue line shows our reported emissions since our baseline year; the darker blue line shows what our emissions for 2014/15 would have been had the grid emissions factor remained static at 2013/14’s level.
150,000
100,000
50,000
0
250,000
200,000
300,000
400,000
350,000
450,000
500,000
2006/07 2007/08 2008/09 2009/10
Actual emissions excluding rise in 2014/15 grid EF
2010/11 2011/12 2012/13 2013/14 2014/15
tCO
2e
Year
Carbon footprint trend 2014/15
0
-50,000
50,000
100,000
150,000
200,000
250,000
Scope 1 Scope 2
tCO
2e
Scope 3 Renewablesreduction
GHG emissions by Scope 2014/15
17Carbon Footprint Report
Differences compared to 2013/14 CFPIt is important to understand changes between years and whether they are genuine or caused by a change in the accounting methodology. When we analyse the changes between years we split them into three categories. Often more than one category can have an impact on emissions from the same area of the carbon footprint. The three categories we use are:
• ‘Genuine’ – real changes in CO2e emissions (i.e. from operational changes).
• ‘Baseline’ – the inclusion of previously unavailable data or the exclusion of previously available data sources or changes in emission factors. These changes may mask genuine increases and decreases.
• ‘Reallocation’ – moving emissions from one part of the CFP to another (affecting the relative size of the divisions in the GHG emissions by activity diagram on page 15, but not the total CFP).
Our 2014/15 carbon footprint saw a net increase of over 25,000 tCO2e (nearly 7%) compared to 2013/14. This is the net increase of a 32,000 tCO2e gross increase and a 7,000 tCO2e gross decrease. The main factors are:
• electricity (increase)
• process emissions (decrease)
• renewables (decrease)
• natural gas use (decrease)
ElectricityGross emissions from grid electricity use increased by over 31,000 tCO2e (over 11%), despite only seeing a 1 GWh increase in electricity used.
In 2014/15 the electricity emission factor increased by nearly 11%. This factor represents the average CO2e emissions from the UK national grid. The factor changes year to year as the fuel mix (coal, gas, renewable etc.) used in power stations changes. The emissions factor for the transmission and distribution of electricity increased by over 13%.
The change to the electricity emission factors is the cause of the net increase in emissions. This would be classed as a baseline increase as it does not represent an increase in electricity used due to operational reasons.
Process EmissionsProcess emissions are generated during the secondary treatment of waste water and the treatment, storage and disposal and/or recycling of sewage sludge. These are separate from the emissions resulting from the fuel (electricity and fossil fuels) used in waste water and sludge treatment and disposal/recycling.
Process emissions saw a genuine reduction of nearly 3,000 tCO2e in 2014/15 compared to 2013/14 (nearly 43% of the 7,000 tCO2e gross reduction). The total amount of raw sludge produced was nearly 2% lower than the previous year and the amounts of sludge digested and incinerated reduced by 4% and 13% respectively.
RenewablesThe amount of renewable electricity (REGO and non REGO)7 reported within our carbon footprint has increased compared to 2013/14. This is down to 3 factors:
• A number of sites that were previously operated by SW Horizons are now owned by Scottish Water, increasing the number of sites we report from 17 to 45.
• The amount of renewable energy produced at number of sites in 2013/14 was less than expected. The output from these sites improved in 2014/15.
• Additional sites achieved REGO accreditation, meaning the electricity generated has a lower emissions factor.
The amount of REGO accredited renewable energy exported was 9.3 GWh in 2013/14, increasing to 12 GWh in 2014/15. This resulted in a reduction of over 1,500 tCO2e compared to previous years (accounting for around 24% of the gross reduction).
This reduction is a combination of baseline changes (from the sites transferred to Scottish Water) and genuine (from the increased output and sites receiving REGO accreditation).
Natural GasEmissions relating to the use of natural gas have decreased by over 900 tCO2e (around 14% of the gross reduction).
This decrease can be attributed to improved accuracy in the data collected (baseline change) and genuine decreases in gas used.
7 Renewable Energy Guarantees of Origin.
18
Conclusion As anticipated in 2013/14, the downward trend seen in our CFP over the first 8 years of reporting has been partially reversed by the increase in the grid emissions factor. We would not expect a further increase in 2015/16, though it may take a further year or two to return the CFP levels we saw in 2013/14.
Once completed, our carbon footprint was externally verified by a consultancy experienced in GHG inventories, who stated:
“The data quality of the 2014/15 Scottish Water carbon footprint has improved compared to previous years, especially with regards to:
• Applying the correct methodology for converting from wet tonnes to tonnes of dry solids for wastes to landfill;
• Having a comprehensive data tracker sheet for all parts of the footprint;
• The availability of the re-baselined footprint data for more accurate historical comparisons of potential parameter ranges.”
2014/15 is the first year for required reporting by the public sector under the Climate Change (Scotland) Act.
Our external verifier states:
“Scottish Water is well placed to undertake reporting since it has accurate records and documentation of its carbon footprint going back to 2006/07 and underwent a re-baselining exercise last year to bring the methodology in line with DECC revised factors and the updated boundary. Scottish Water is likely to be one of the relatively few public sector organisations that undergo independent third party verification of their carbon footprint.”
8 In accordance with Part 3 of the British Standard BS EN ISO 14064-3:2012 Specification for guidance for the validation and verification of greenhouse gas assertions.
Carbon Footprint Report

19Financial and Non-financial Tables
Energy
Overview of direct impactsWe have installed more than 4,000 smart meters at our sites, enabling us to target energy efficiency opportunities.
Last year we increased our installed renewable capacity by 60%, to 45 GWh. This gives us the potential to generate up to 10% of the electricity we need every year. We continue to increase and diversify our renewables portfolio.
Overview of indirect impactsScottish Water already hosts 350 GWh of 3rd party wind schemes and is working with several developers on other sites. By 2018 we expect to be hosting renewable energy amounting to over twice that which we consume annually.
2010/11 2011/12 2012/13 2013/14 2014/15Financial indicators (£k)
Total energy expenditure 40,975 37,421 39,617 44,007 43,596
CRC gross expenditure (2011 onwards) n/a 2,684 2,970 2,940 3,930
Expenditure on official business travel 7,636 8,812 9,115 9,091 8,705
Non-financial indicators (kWh)
Electricity – non-renewable 440,735,205 443,243,018 446,069,836 447,744,042 442,424,732
Electricity – renewable9 7,102,888 8,091,759 9,499,503 8,491,158 11,102,412
Gas 15,301,956 10,604,587 12,538,051 12,089,558 10,676,179
9 The values reported for the use of renewable energy between 2010/11 and 2013/14 have been revised compared to last year’s report. For the reporting years 10/11 to 12/13 an improvement in how we gather and analyse data has resulted in revised values. In 13/14 an error in our calculations resulted in us slightly under reporting the amount of renewables used; this has now been corrected. The error had no impact on our reported carbon footprint.
Renewable energy figures include hydro electricity, CHP (combined heat and power), wind, and solar PV (photovoltaic).
CRC (Carbon Reduction Commitment) gross expenditure increased due to an increase in the cost per tonne of CO2 allowance.
Financial figures exclude Private Finance Initiative activities (PFI). Non-financial figures relate to Scottish Water’s regulated business, and exclude non-regulated businesses (Business Stream and Scottish Water Horizons). They also exclude PFI activities, however the PFI wastewater service is included in Scottish Water’s Carbon Footprint reported earlier.
Energy consumption (kWh)
440,735,205
15,301,9567,102,888
443,243,018
10,604,5878,091,759
446,069,836
12,538,0519,499,503
447,744,042
12,089,5588,491,158
442,424,732
10,676,17911,102,412
2010/11 2011/12 2012/13 2013/14 2014/15
Electricity – renewableElectricity – non-renewable Gas
20Financial and Non-financial Tables
Waste
Overview of direct impactsThe quality of data available on waste arising from our offices has improved significantly and we are far less reliant on estimating waste tonnages from assumed volumes. Increased accuracy of our contractor reporting has also helped target areas where additional communication and guidance to employees may be required, leading to increased employee engagement. We are currently piloting the recycling of food waste at our Dundee office (this is in addition to food waste recycling at all our offices with canteens).
Overview of indirect impactsAround 80% of blockages in drains and sewers across Scotland are caused by the wrong items being flushed down toilets or poured down sinks. In our Sustainability Report 2014 we explored the first two phases of our “Keeping the Water Cycle Running” campaign. A further two phases ran in 2014/15, using advertising and social media to highlight the correct way of disposing of such items. This actively supports our work to alleviate the consequences of sewer flooding due to blockages of fat and baby wipes etc.
In 2014/15, employees contributed over 500 working days as part of our volunteering scheme. This included 4 days of beach cleaning.
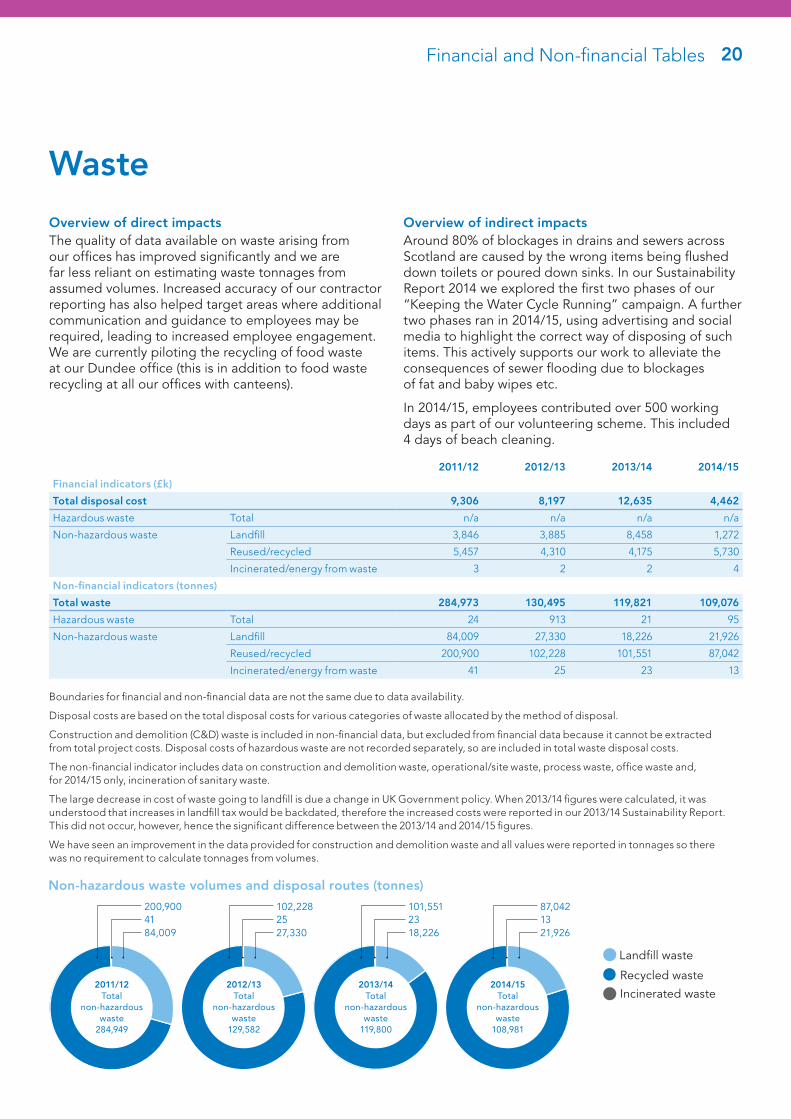
2011/12 2012/13 2013/14 2014/15
Financial indicators (£k)
Total disposal cost 9,306 8,197 12,635 4,462
Hazardous waste Total n/a n/a n/a n/a
Non-hazardous waste Landfill 3,846 3,885 8,458 1,272
Reused/recycled 5,457 4,310 4,175 5,730
Incinerated/energy from waste 3 2 2 4
Non-financial indicators (tonnes)
Total waste 284,973 130,495 119,821 109,076
Hazardous waste Total 24 913 21 95
Non-hazardous waste Landfill 84,009 27,330 18,226 21,926
Reused/recycled 200,900 102,228 101,551 87,042
Incinerated/energy from waste 41 25 23 13
Boundaries for financial and non-financial data are not the same due to data availability.
Disposal costs are based on the total disposal costs for various categories of waste allocated by the method of disposal.
Construction and demolition (C&D) waste is included in non-financial data, but excluded from financial data because it cannot be extracted from total project costs. Disposal costs of hazardous waste are not recorded separately, so are included in total waste disposal costs.
The non-financial indicator includes data on construction and demolition waste, operational/site waste, process waste, office waste and, for 2014/15 only, incineration of sanitary waste.
The large decrease in cost of waste going to landfill is due a change in UK Government policy. When 2013/14 figures were calculated, it was understood that increases in landfill tax would be backdated, therefore the increased costs were reported in our 2013/14 Sustainability Report. This did not occur, however, hence the significant difference between the 2013/14 and 2014/15 figures.
We have seen an improvement in the data provided for construction and demolition waste and all values were reported in tonnages so there was no requirement to calculate tonnages from volumes.
Non-hazardous waste volumes and disposal routes (tonnes)
102,228
27,33025
2012/13Total
non-hazardous waste
129,582
200,900
84,00941
2011/12Total
non-hazardous waste
284,949
101,551
18,22623
2013/14Total
non-hazardous waste
119,800
87,042
21,92613
2014/15Total
non-hazardous waste
108,981
Recycled waste
Landfill waste
Incinerated waste
21Financial and Non-financial Tables
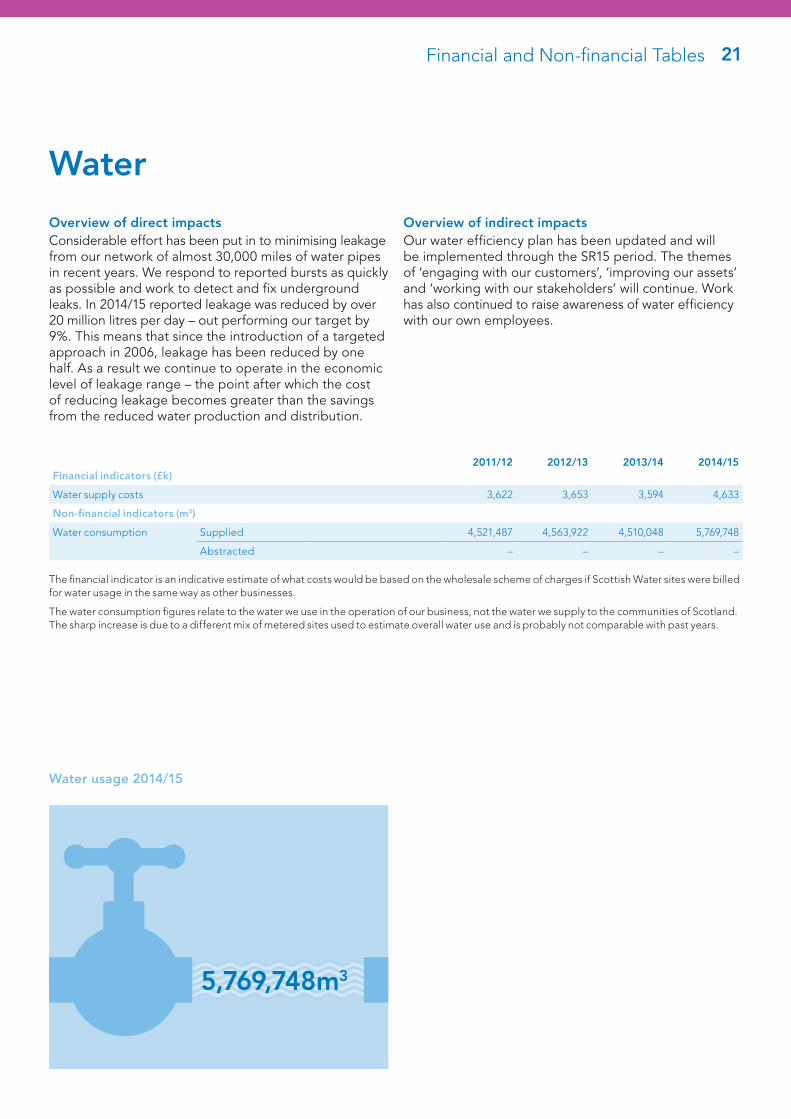
Water
2011/12 2012/13 2013/14 2014/15Financial indicators (£k)
Water supply costs 3,622 3,653 3,594 4,633
Non-financial indicators (m3)
Water consumption Supplied 4,521,487 4,563,922 4,510,048 5,769,748
Abstracted – – – –
Overview of direct impactsConsiderable effort has been put in to minimising leakage from our network of almost 30,000 miles of water pipes in recent years. We respond to reported bursts as quickly as possible and work to detect and fix underground leaks. In 2014/15 reported leakage was reduced by over 20 million litres per day – out performing our target by 9%. This means that since the introduction of a targeted approach in 2006, leakage has been reduced by one half. As a result we continue to operate in the economic level of leakage range – the point after which the cost of reducing leakage becomes greater than the savings from the reduced water production and distribution.
Water usage 2014/15
The financial indicator is an indicative estimate of what costs would be based on the wholesale scheme of charges if Scottish Water sites were billed for water usage in the same way as other businesses.
The water consumption figures relate to the water we use in the operation of our business, not the water we supply to the communities of Scotland. The sharp increase is due to a different mix of metered sites used to estimate overall water use and is probably not comparable with past years.
Overview of indirect impactsOur water efficiency plan has been updated and will be implemented through the SR15 period. The themes of ‘engaging with our customers’, ‘improving our assets’ and ‘working with our stakeholders’ will continue. Work has also continued to raise awareness of water efficiency with our own employees.
5,769,748m3
22
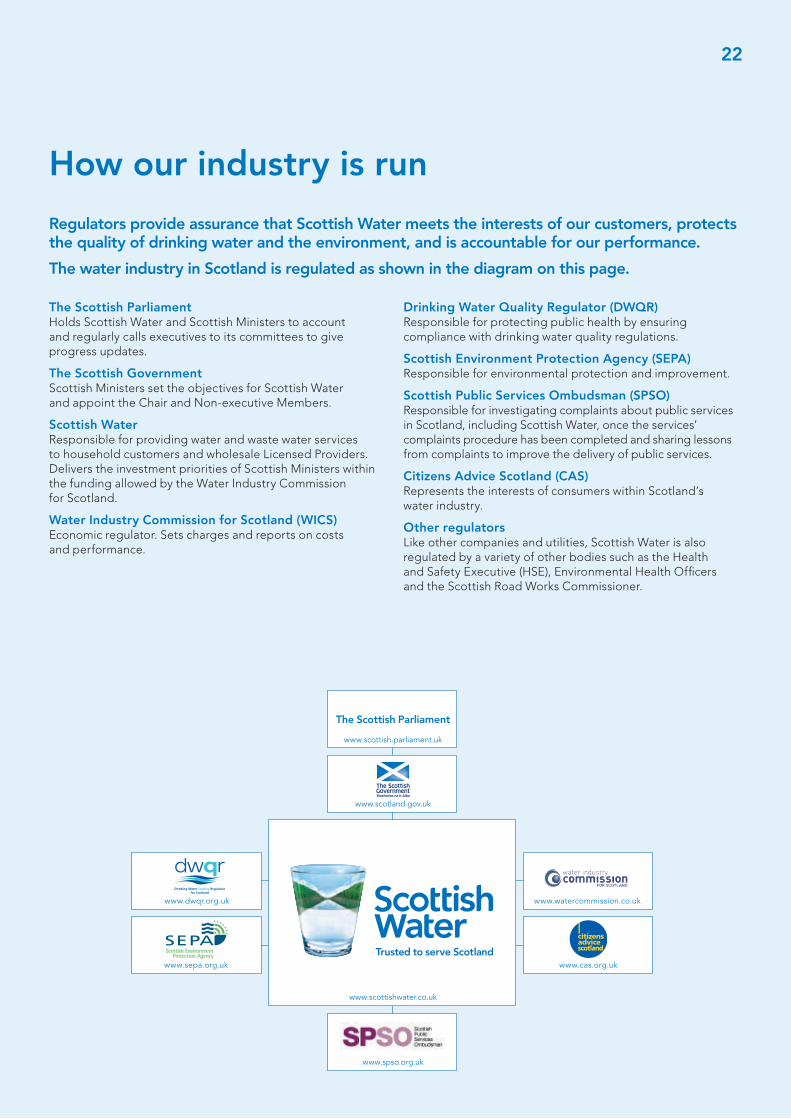
How our industry is run
The Scottish Parliament Holds Scottish Water and Scottish Ministers to account and regularly calls executives to its committees to give progress updates.
The Scottish Government Scottish Ministers set the objectives for Scottish Water and appoint the Chair and Non-executive Members.
Scottish Water Responsible for providing water and waste water services to household customers and wholesale Licensed Providers. Delivers the investment priorities of Scottish Ministers within the funding allowed by the Water Industry Commission for Scotland.
Water Industry Commission for Scotland (WICS) Economic regulator. Sets charges and reports on costs and performance.
Drinking Water Quality Regulator (DWQR) Responsible for protecting public health by ensuring compliance with drinking water quality regulations.
Scottish Environment Protection Agency (SEPA) Responsible for environmental protection and improvement.
Scottish Public Services Ombudsman (SPSO) Responsible for investigating complaints about public services in Scotland, including Scottish Water, once the services’ complaints procedure has been completed and sharing lessons from complaints to improve the delivery of public services.
Citizens Advice Scotland (CAS) Represents the interests of consumers within Scotland’s water industry.
Other regulators Like other companies and utilities, Scottish Water is also regulated by a variety of other bodies such as the Health and Safety Executive (HSE), Environmental Health Officers and the Scottish Road Works Commissioner.
www.scotland.gov.uk
The Scottish Parliament
www.scottish.parliament.uk
www.spso.org.uk
www.watercommission.co.ukwww.dwqr.org.uk
www.sepa.org.uk www.cas.org.uk
Regulators provide assurance that Scottish Water meets the interests of our customers, protects the quality of drinking water and the environment, and is accountable for our performance.
The water industry in Scotland is regulated as shown in the diagram on this page.
www.scottishwater.co.uk

SW SR 2015
Scottish WaterCorporate CommunicationsCastle House6 Castle DriveCarnegie CampusDunfermlineFife KY11 8GG
Customer Helpline 0800 0778778scottishwater.co.uk