Embed Size (px)
Citation preview

Water Balance for Operability & Sustainability
At Genentech’s South San Francisco Campus
A Project Report
Presented to
The Faculty of the Department of General Engineering
San Jose State University
In Partial Fulfillment
of the Requirements for the Degree
Master of Science
In
General Engineering
By
Nicole Liu
Ajit Singh
Andy Wong
May 2012
Project Report
ii
SAN JOSE STATE UNIVERSITY
The Undersigned Project Committee Approves the Project Titled
Water Balance for Operability & Sustainability
at Genentech’s South San Francisco Campus
By
Nicole Liu
Ajit Singh
Andy Wong
APPROVED FOR THE DEPARTMENT OF GENERAL ENGINEERING
Prof. David Krack, Academic Advisor Date Director of EH&S Department San Jose State University Katy Scott, Industrial Advisor Date Manager at EH&S Department Genentech, Inc

Project Report
iii
ABSTRACT
Water Balance for Operability and Sustainability at Genentech’s South San Francisco Manufacturing Facility
The industrial sector is one of the major consumers of water resources after agriculture.
As water consumption in the world increases over the years, it is even more important for
industries to focus on sustainable water consumption practices to conserve our natural resources.
Genentech is part of the biotechnology industry, using biological processes to develop
pharmaceutical remedies for significant unmet medical needs. In line with its corporate
principles, Genentech continues to strive for environmental sustainability improvements in it’s
drug research, development, and manufacturing processes. Water conservation is one of
Genentech’s primary sustainability focus areas.
In order to achieve efficient water use, it is important to establish a detailed
understanding of the plant’s water use. A water balance is an important tool in this step because
it demonstrates the inflows, outflows, and internal users of a water usage system. This tool can
help Genentech identify areas in the plant that consume excessive amounts of water and
prioritize their water conservation efforts in these areas. A detailed water balance also enables
efficient daily use of water systems by describing a normal operating state, assisting
troubleshooting and speeding correction of system failures that increase water loss.
The objective of this project report is to present the details and results of our water
balance of Building 3. Building 3 is Genentech’s highest volume user of water and largest
manufacturing building in South San Francisco. After our water balance analysis, we were able
to determine that roughly 40% of the water consumed in Building 3 is consumed through the
Water Purification Process. In addition, the cleaning system was the second highest water

Project Report
iv
consumer in the Building 3 Water Balance. Recommendations to improve Genentech’s water
consumption were provided for possible future implementation.
Project Report
v
TABLE OF CONTENTS
1.0 INTRODUCTION ................................................................................................................. 1 2.0 BACKGROUND ON EXISTING WATER CONSUMPTION AND CONSERVATION MEASURES ................................................................................................................................... 3 3.0 PROJECT SCOPE ................................................................................................................. 5
3.1 Scope Overview ................................................................................................................. 5 3.2 Project Benefits .................................................................................................................. 5
4.0 HYPOTHESIS ....................................................................................................................... 6 5.0 WATER BALANCE ............................................................................................................. 7 6.0 PROJECT JUSTIFICATION .............................................................................................. 11
6.1 Water Conservation Benefits ........................................................................................... 11 6.2 Operability Improvements................................................................................................ 12 6.3 Cost Efficiency................................................................................................................. 13 6.4 Environmental Benefits.................................................................................................... 14
7.0 WATER BALANCE OF BUILDING THREE: INTRODUCTION................................... 15 8.0 BREAKDOWN AND ANALYSIS OF “SYSTEMS” IN BUILDING THREE................. 16
8.1 WATER PURIFICATION SYSTEM .............................................................................. 16 8.1.1 Analysis of Water Purification .................................................................................. 17 8.1.2 Recommended Water Conservation Projects ............................................................ 23
8.2 SANITARY SYSTEM..................................................................................................... 25 8.2.1 Introduction to Sanitary System ................................................................................ 25 8.2.2 Assumptions Used ..................................................................................................... 25 8.2.3 Recommendations ..................................................................................................... 26
8.3 AUTOCLAVE SYSTEM................................................................................................. 27 8.3.1 Autoclave Description ............................................................................................... 27 8.3.2 Autoclave Data Collection Method ........................................................................... 28 8.3.3 Autoclave Water Usage Estimation........................................................................... 29 8.3.4 Autoclave Water Conservation Recommendations................................................... 29
8.4 CLEAN-IN-PLACE (CIP) SYSTEM .............................................................................. 31 8.4.1 CIP System and Process Description ........................................................................ 31 8.4.2 CIP Data Collection Method ..................................................................................... 32 8.4.3 CIP-1.......................................................................................................................... 34 8.4.4 CIP-2.......................................................................................................................... 35
Project Report
vi
8.4.5 CIP-3.......................................................................................................................... 38 8.4.6 CIP-4.......................................................................................................................... 39 8.4.7 CIP-5.......................................................................................................................... 42 8.4.8 CIP-9.......................................................................................................................... 44 8.4.9 CIP-10........................................................................................................................ 45 8.4.10 CIP-12...................................................................................................................... 48 8.4.11 T-7421 ..................................................................................................................... 50 8.4.12 Building 3 CIP System Rate of Water Usage Summary ......................................... 52 8.4.13 CIP Water Conservation Recommendations ........................................................... 52
8.5 STEAM-IN-PLACE SYSTEM ........................................................................................ 53 8.5.1 Steam-in-Place System Description .......................................................................... 53 8.5.2 SIP Data Collection Method...................................................................................... 54 8.5.3 SIP Water Usage Estimation ..................................................................................... 54 8.5.4 SIP Water Conservation Recommendations ............................................................. 56
8.6 CLEAN-OUT-OF-PLACE WASHERS .......................................................................... 57 8.6.1 Clean-Out-of-Place Description ................................................................................ 57 8.6.2 Clean-Out-of-Place Analysis..................................................................................... 57 8.6.3 COP Washer Recommendations ............................................................................... 59
8.7 PRODUCTION AND OPERATIONS............................................................................. 60 8.7.1 Introduction ............................................................................................................... 60 8.7.2 Analysis of Assessment............................................................................................. 62 8.7.3 Recommendations for Water Conservation............................................................... 63 8.7.4 Recommendations for Further Calculations.............................................................. 64
9.0 WATER BALANCE SUMMARY...................................................................................... 65 10.0 ECONOMIC ANALYSIS ................................................................................................. 67
10.1 EXECUTIVE SUMMARY............................................................................................ 67 10.2 PROBLEM STATEMENT ............................................................................................ 68 10.3 SOLUTION AND VALUE PROPOSITION................................................................. 69 10.4 MARKET SIZE.............................................................................................................. 69
10.4.1 Water Conservation Potential.................................................................................. 71 10.4.2 Potential Savings for Industries............................................................................... 71
10.5 COMPETITORS ............................................................................................................ 72 10.6 CUSTOMERS................................................................................................................ 74 10.7 COST/ANNUAL EXPENSES....................................................................................... 75

Project Report
vii
10.8 PRICE POINT................................................................................................................ 76 10.9 SWOT ANALYSIS........................................................................................................ 76 10.10 PROFIT AND LOSS/RETURN ON INVESTMENTS................................................. 77 10.11 PERSONNEL................................................................................................................. 79 10.12 BUSINESS STRATEGY ............................................................................................... 79
10.12.1 Revenue Model ....................................................................................................... 80 10.13 STRATEGIC ALLIANCE............................................................................................. 81 10.14 EXIT STRATEGY......................................................................................................... 81
11.0 CONCLUSION.................................................................................................................. 82 12.0 ACKNOWLEDGEMENTS............................................................................................... 83 13.0 REFERENCES .................................................................................................................. 84 APPENDIX................................................................................................................................... 85
Project Report
viii
LIST OF TABLES
Table 1.1: Genentech / Roche 2012 Sustainability Goals …….…………………………….2
Table 6.1: Water Usage ……………………………………..……………………….…….13 Table 8.1: Estimated Water Loss from RO Units ………………………………………….18 Table 8.2: Water Loss from PW System “Heat-Up.……………………………………......23 Table 8.3: Representation of People Working in Different Units of Building 3……...........25 Table 8.4: Building 3 Autoclave Water Usage Rate Estimation (gal/day)…………………29 Table 8.5: CIP-2 Water Usage Calculation………………………………………………...37 Table 8.6: Number of Wash Cycles and Minutes per Wash Cycle…………………….......38 Table 8.7: CIP-4 Water Usage Calculation………………………………………………...41 Table 8.8: CIP-5 Water Usage Calculation………………………………………………...44 Table 8.9: CIP-10 Water Usage Calculation……………………………………………….47 Table 8.10: CIP-12 Water Usage Calculation………………………………………………50 Table 8.11: T-7421 Water Usage Calculation……………………………………………...51 Table 8.12: Total Water Usage Rate of Building 3 CIP Process…………………………..52 Table 8.13: Millipore Corporation’s 2003 Principles of Steam-In-Place………………….55 Table 8.14: Water Usage Rate Calculation per SIP System………..…………………….. 56 Table 8.15: Calculations showing total volume for one cycle of COP Washer………..…..58 Table 8.16: Estimated Water Loss for COP Washers………………………………………58 Table 8.17: Water Consumed and Final Volume per Run for Production Operations..........62 Table 8.18: Daily water consumption and Bulk Produced for Production Operations…….62 Table 10.1: Potential savings from water conservation in 2000 in California……………..71
Table 10.2: Calculated potential savings through water conservation in California……….71

Project Report
ix
Table 10.3: Competitors info by location and size………………………………………..72 Table 10.4: Annual Cost Breakdown Structure for the First Three Years………………..75 Table 10.5: Projected Cost, Sales, and Net Income for the First Three Years……………77
Project Report
x
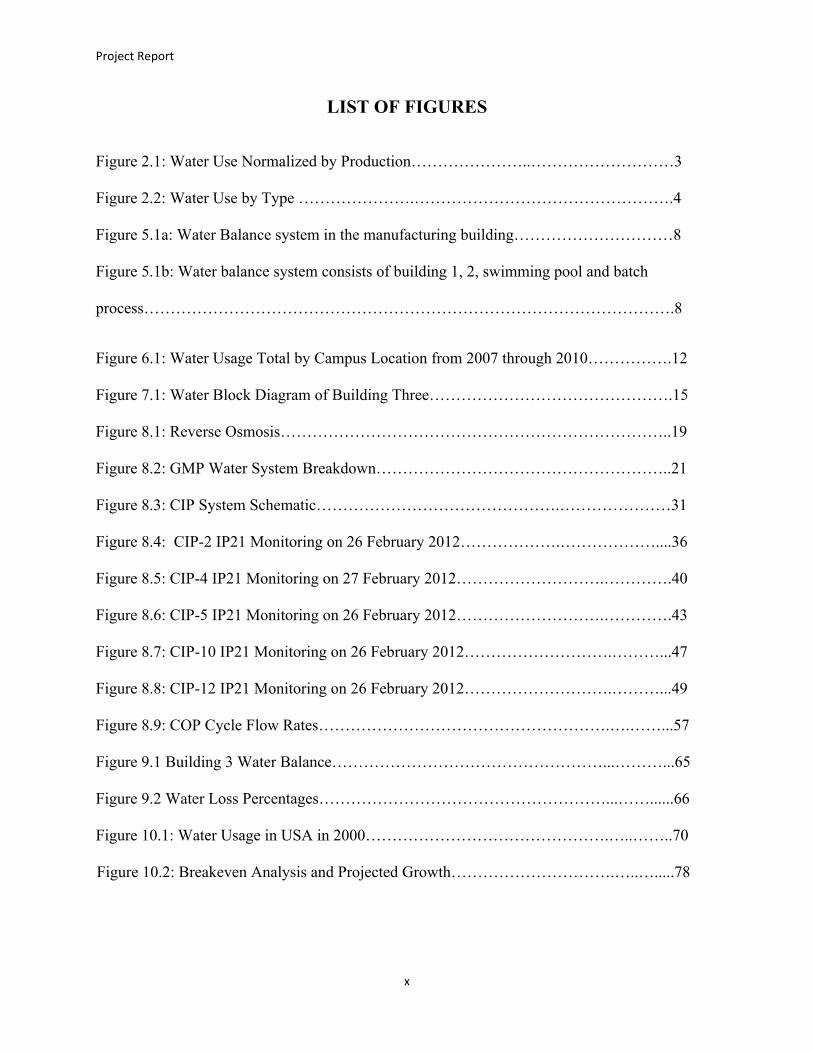
LIST OF FIGURES
Figure 2.1: Water Use Normalized by Production…………………..………………………3 Figure 2.2: Water Use by Type ………………….………………………………………….4 Figure 5.1a: Water Balance system in the manufacturing building…………………………8 Figure 5.1b: Water balance system consists of building 1, 2, swimming pool and batch
process……………………………………………………………………………………….8
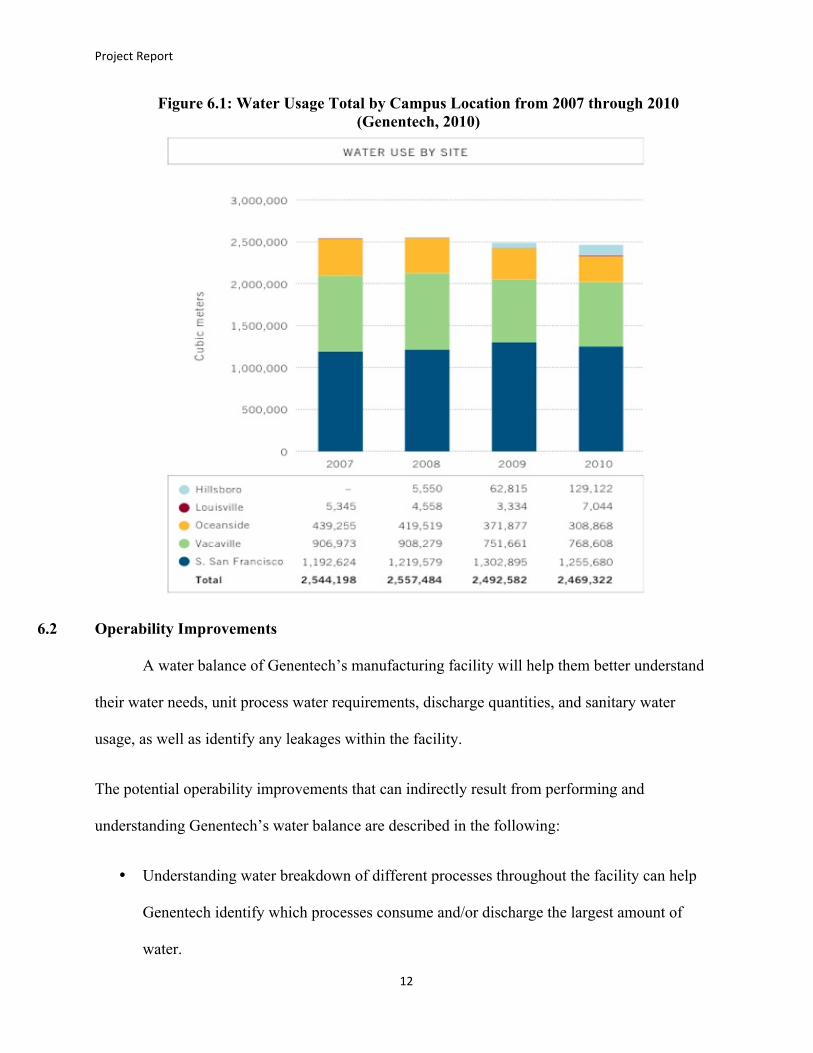
Figure 6.1: Water Usage Total by Campus Location from 2007 through 2010…………….12
Figure 7.1: Water Block Diagram of Building Three……………………………………….15 Figure 8.1: Reverse Osmosis………………………………………………………………..19 Figure 8.2: GMP Water System Breakdown………………………………………………..21
Figure 8.3: CIP System Schematic……………………………………….…………………31
Figure 8.4: CIP-2 IP21 Monitoring on 26 February 2012……………….………………....36 Figure 8.5: CIP-4 IP21 Monitoring on 27 February 2012……………………….………….40 Figure 8.6: CIP-5 IP21 Monitoring on 26 February 2012……………………….………….43 Figure 8.7: CIP-10 IP21 Monitoring on 26 February 2012……………………….………...47 Figure 8.8: CIP-12 IP21 Monitoring on 26 February 2012……………………….………...49 Figure 8.9: COP Cycle Flow Rates……………………………………………….….……...57 Figure 9.1 Building 3 Water Balance……………………………………………...………...65
Figure 9.2 Water Loss Percentages………………………………………………...……......66 Figure 10.1: Water Usage in USA in 2000……………………………………….…..……..70
Figure 10.2: Breakeven Analysis and Projected Growth………………………….…..….....78
Project Report
1
1.0 INTRODUCTION
Every year, the world population is increasing. As human population increases, we have
a higher demand on our natural resources. Therefore, it is important we do our best in
conserving our natural resources. One of the most important natural resources to consider is
water. According to the United States Geological Survey Report in 2000, industry water usage is
roughly 50% of the total water usage in the United States. Manufacturing industries come in at
second place in water usage, after power plant industries.
Per Section 2, Article X of the California Constitution, the Legislative Mandate is: (1)
Water shall be put to beneficial use to the fullest extent possible, (2) Waste or unreasonable use
of water shall be prevented, and (3) Water shall be conserved to the benefit of the people.
However there is a gray area that defines “waste or unreasonable use”. Most companies in
California are not required to monitor their water consumption and discharge. In addition, many
cities do not regulate wastewater discharge volumes, only toxicity. Therefore, as long as a
company is not “unreasonably” using their water, there is no mandate for companies to take
additional measures to try to conserve water. As long as companies are willing to pay for all of
their natural resources, there is not a clear limit on how much they consume since every company
operates differently. As long as their usage is not “unreasonable” they are justified under
California Law.
The industrial sector is one of the major consumers of water resources after agriculture.
As water consumption in the world increases over the years, it is even more important for
industries to focus on sustainable water consumption practices to conserve our natural resources.
Genentech is part of the biotechnology industry, using biological processes to develop
pharmaceutical remedies for significant unmet medical needs. Its company headquarters and
main manufacturing plant is located in South San Francisco.
Project Report
2
In addition to their commitment to patients, Genentech also has a commitment to
environmental sustainability. In 2005, Genentech was the first bio-pharmaceutical company to
join the California Climate Action Registry and to publish environmental sustainability goals.
After Genentech merged with the Roche Corporation in 2009, the company began developing
plans for contributing to the following Roche Corporate goals. According to the Roche 2011
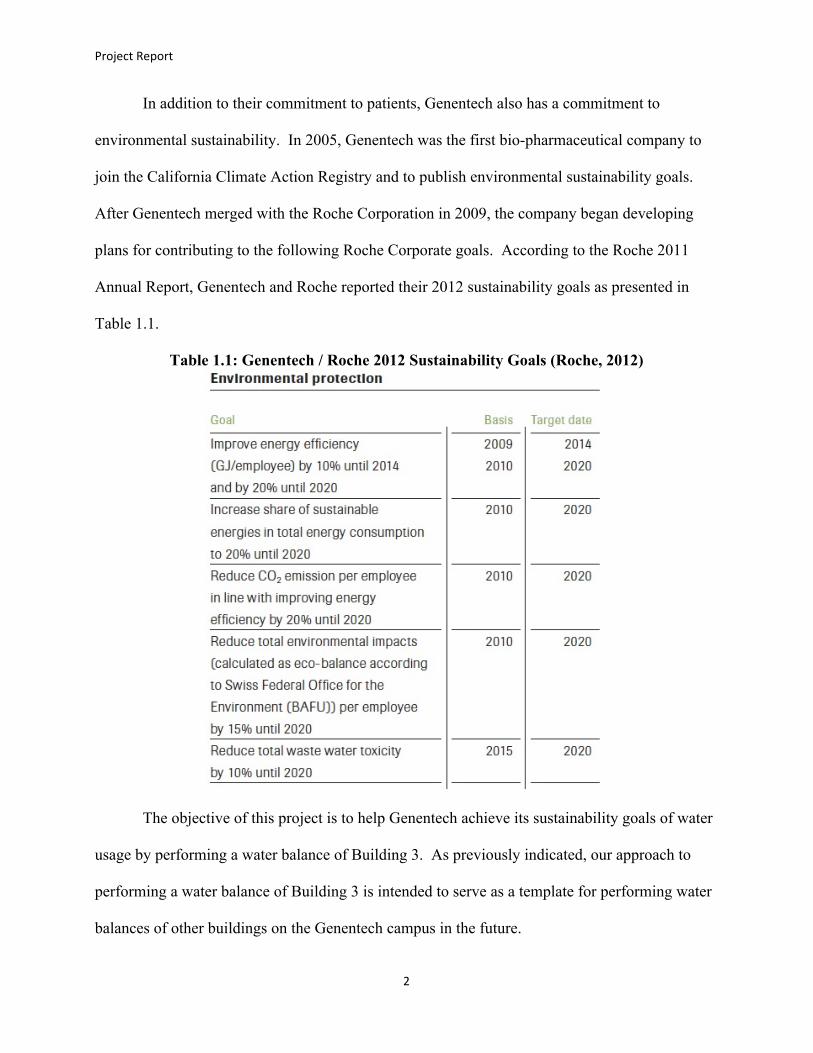
Annual Report, Genentech and Roche reported their 2012 sustainability goals as presented in
Table 1.1.
Table 1.1: Genentech / Roche 2012 Sustainability Goals (Roche, 2012)
The objective of this project is to help Genentech achieve its sustainability goals of water
usage by performing a water balance of Building 3. As previously indicated, our approach to
performing a water balance of Building 3 is intended to serve as a template for performing water
balances of other buildings on the Genentech campus in the future.
Project Report
3
2.0 BACKGROUND ON EXISTING WATER CONSUMPTION AND CONSERVATION MEASURES
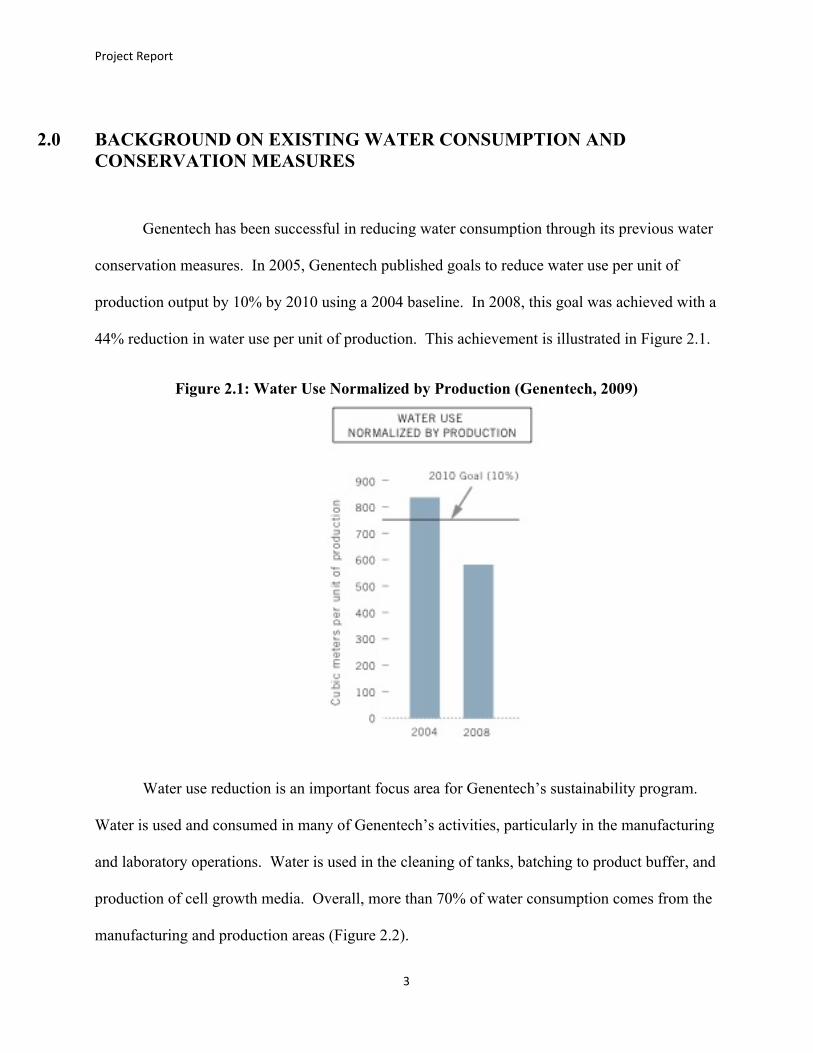
Genentech has been successful in reducing water consumption through its previous water
conservation measures. In 2005, Genentech published goals to reduce water use per unit of
production output by 10% by 2010 using a 2004 baseline. In 2008, this goal was achieved with a
44% reduction in water use per unit of production. This achievement is illustrated in Figure 2.1.
Figure 2.1: Water Use Normalized by Production (Genentech, 2009)
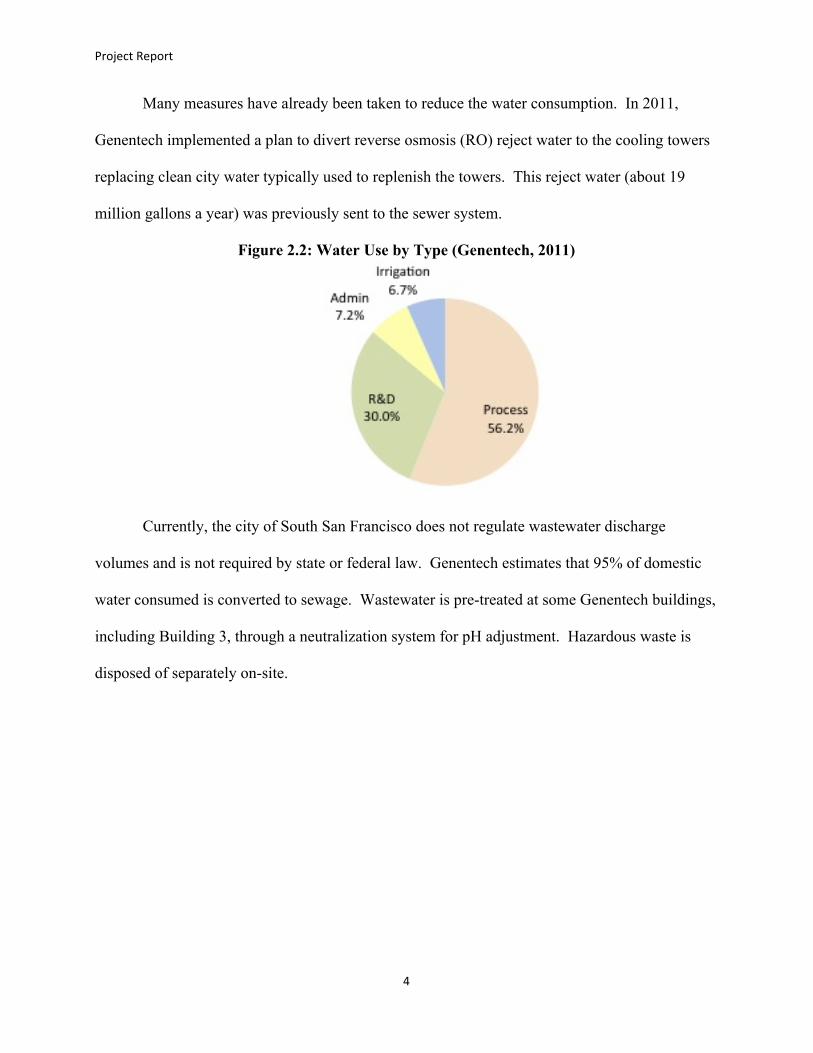
Water use reduction is an important focus area for Genentech’s sustainability program.
Water is used and consumed in many of Genentech’s activities, particularly in the manufacturing
and laboratory operations. Water is used in the cleaning of tanks, batching to product buffer, and
production of cell growth media. Overall, more than 70% of water consumption comes from the
manufacturing and production areas (Figure 2.2).
Project Report
4
Many measures have already been taken to reduce the water consumption. In 2011,
Genentech implemented a plan to divert reverse osmosis (RO) reject water to the cooling towers
replacing clean city water typically used to replenish the towers. This reject water (about 19
million gallons a year) was previously sent to the sewer system.
Figure 2.2: Water Use by Type (Genentech, 2011)
Currently, the city of South San Francisco does not regulate wastewater discharge
volumes and is not required by state or federal law. Genentech estimates that 95% of domestic
water consumed is converted to sewage. Wastewater is pre-treated at some Genentech buildings,
including Building 3, through a neutralization system for pH adjustment. Hazardous waste is
disposed of separately on-site.
Project Report
5
3.0 PROJECT SCOPE
3.1 Scope Overview
The scope of this project focused on water conservation. Since more than 70% of water
use stems from the production / manufacturing areas, our water balance focused on Building 3
which is the highest consumer of water out of all production/manufacturing buildings. Our water
balance generally focused on processes in Building 3 that consumes the largest amount of water.
Based on results, we evaluated possible water conservation projects. Genentech has 40 buildings
including 6 main manufacturing buildings at South San Francisco. The scope of our water
balance project only addresses Building 3. However, there are 5 more main manufacturing
buildings that need a water balance evaluation. As such, the Building 3 water balance approach
may serve as a template for performing water balances of the other manufacturing buildings in
the future.
3.2 Project Benefits
There are many benefits from this project. Most importantly, Genentech can gain a better
understanding of all of the water flows through the manufacturing buildings from city water
intake to wastewater discharge. This project also helps Genentech better understand which areas,
operations, or processes in the water balance consume the most water. Then, water conservation
projects can be implemented to primarily focus on these high water consumption points.
Holistically, performing a water balance is one of many steps Genentech can take to meet their
sustainability goals.
Project Report
6
4.0 HYPOTHESIS
There are certain processes in Genentech’s South San Francisco campus that use
excessive amounts of domestic water. This hypothesis will be tested by performing a water
balance for Building 3. The results from this study will help Genentech identify potential
process improvement needs and serve as one of many steps towards reaching Genentech’s water
conservation and environmental sustainability goals. Additionally, based on study results, our
team can provide recommendations for future water conservation and process improvement
projects.
Project Report
7
5.0 WATER BALANCE
A water balance is a useful tool for reducing water usage at a manufacturing facility such
as Genentech. The main components of a water balance include water usage system, inflows,
and outflows. The first step in developing a water balance is to identify the system that requires
a water balance. The system can be anything where water flows in and comes out from it.
Examples of such a system are a human body, swimming pool, or a large manufacturing facility.
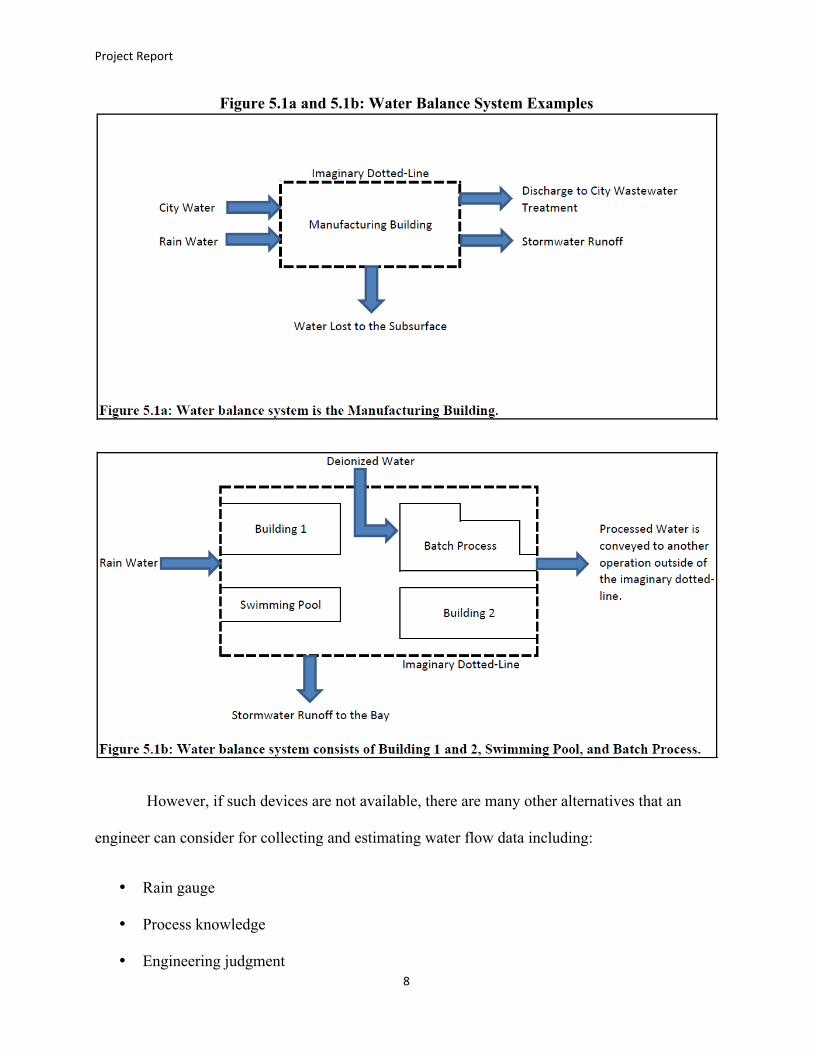
It is useful to draw an imaginary dotted-line around the system that an engineer is to evaluate.
Figure 5.1a and 5.1b provide examples of using an imaginary dotted-line to define a system that
an engineer is to perform a water balance on. As shown on Figure 5.1b, a system can also be a
combination of different buildings, operations, and processes. Therefore, a water balance system
can also be defined as any area within the imaginary dotted-line.
The second step in developing a water balance is to identify the inflows and outflows of
water to and from the system. The inflows are any incoming streams that contain water that
penetrate the imaginary dotted-line of a system. Similarly, the outflows are any out-going
streams that contain water that penetrate the imaginary dotted-line of a system. As seen in
Figure 5.1a, the inflows are city water and rainwater while outflows are discharge to city water
treatment, storm water runoff and water loss to subsurface. As one can imagine, there can be
many inflows and outflows in a complex industrial process or system. Therefore, identifying
inflows and outflows of an industrial facility can be a huge endeavor for an engineer. After all
the inflows and outflows have been identified, the next step is to quantify all these water flows.
The easiest way to measure water flows is by using a water meter or totalizer. These devices will
give instantaneous readings of water flow rates.
Project Report
8
Figure 5.1a and 5.1b: Water Balance System Examples
However, if such devices are not available, there are many other alternatives that an
engineer can consider for collecting and estimating water flow data including:
• Rain gauge
• Process knowledge
• Engineering judgment
Project Report
9
• Standard published factors
• Engineering calculations
• Operating manuals (GEMI, 2011)
The amount of rainfall that enters a site can be estimated using a rain gauge. A rain
gauge measures inches of water per unit area. By multiplying the inches of rainfall per year by
the surface area of the site, the volume of rainfall that enters the site in a year can be estimated.
If a site does not have its own rain gauge, rainfall data from a local weather station or airport can
be used. These locations have their own rain gauge for measuring rainfall.
Water usage of a specific manufacturing process can also be estimated by process
knowledge or engineering judgment. Often times process operators, technicians, and engineers
who operate and maintain a specific processing unit can give the best estimate or judgment of the
unit’s water usage because they are most familiar with the unit. Water usage may also be
monitored and recorded by the engineer or automatically logged in a data software program.
There are published factors to estimate industrial water usage rates. Factors for sanitary
water usage range from 10 to 25 gallons/person/shift exclusive of industrial wastes. The lower
value includes the flow from toilets and employee washing while the higher value includes
estimated water usage if the facility has toilets and showers, food preparation and dishwashing
equipment (a cafeteria) (GEMI, 2011). In a typical industrial facility, one of the processing units
that consume the largest amount of water is the boiler system. There are published factors to
estimate the amount of water produced by the boiler blow down. These factors range from 5 to
10% of the steam generation rate (GEMI, 2011).
Engineering calculations can be used to estimate water usage. Specification data and
engineering calculations for a specific operating unit can usually be found in its operating
Project Report
10
manual. For example, the water capacity of a sprinkler head is found in its operating manual as 5
gallons/minute. If a specific sprinkler zone has ten sprinkler heads, then the total water usage
rate of that zone can be estimated by multiplying the sprinkler head capacity (5 gallons/minute)
by ten sprinkler heads, which results in a total usage rate of 50 gallons/minute. Depending on the
operating time of the specific sprinkler zone, the total volume of water used within the operating
time can be calculated by multiplying the water usage rate by the operating time of the sprinkler
zone.
Specifically for the scope of our project, we gathered a lot of the information from the
Site EHS Department at SSF, Utility Operators at SSF, and Process Explorer Database that
monitors the flows and totalizers at the site.
Our project ignored the amount of rainfall for the site water balance since the rainfall is
collected in the storm drains and not conveyed to the wastewater sewer system.
Project Report
11
6.0 PROJECT JUSTIFICATION
There are many benefits that can come from the implementation of our project. The
following presents project benefits including:
• Water conservation
• Operability Improvements
• Cost Efficiency
• Environmental benefits
6.1 Water Conservation Benefits
As shown on Figure 6.1, the water usage of Genentech’s South San Francisco campus
from years 2005 to 2009 was flat at an average of 1,207,560 cubic meters. By understanding the
facility’s water balance, Genentech can initiate many water conservation projects. Examples of
water conservation measures include:
• Recycling the sanitary and other non-toxic wastewater so as to reduce dependency on city
water.
• Reducing water usage for each process through sustainable practices.
The benefits of water conservation include:
• Reducing the cost of water usage
• Reducing the risk of overloading the pump station and sewer system; and
• Meeting Genentech’s sustainability goal for water conservation.
• Reducing the carbon emissions associated with water transport and treatment.
Project Report
12
Figure 6.1: Water Usage Total by Campus Location from 2007 through 2010 (Genentech, 2010)
6.2 Operability Improvements
A water balance of Genentech’s manufacturing facility will help them better understand
their water needs, unit process water requirements, discharge quantities, and sanitary water
usage, as well as identify any leakages within the facility.
The potential operability improvements that can indirectly result from performing and
understanding Genentech’s water balance are described in the following:
• Understanding water breakdown of different processes throughout the facility can help
Genentech identify which processes consume and/or discharge the largest amount of
water.
Project Report
13
• Identify processes and operations in which fresh water could be replaced by recycled
water such as in landscaping and sanitary purposes where recycled water is often used.
• Adding water meters or control valves to better manage water usage.
6.3 Cost Efficiency
Cost efficiency is one of the many underlying reasons for initiating a project. We
calculated Genentech’s Building 3 water usage and discharge cost using the annual water usage
and discharge data. We started our cost evaluation with Building 3 because Building 3 has the
highest water consumption of all buildings. After we have completed evaluating Building 3,
Genentech could move on to evaluate other buildings in order of highest water consumption.
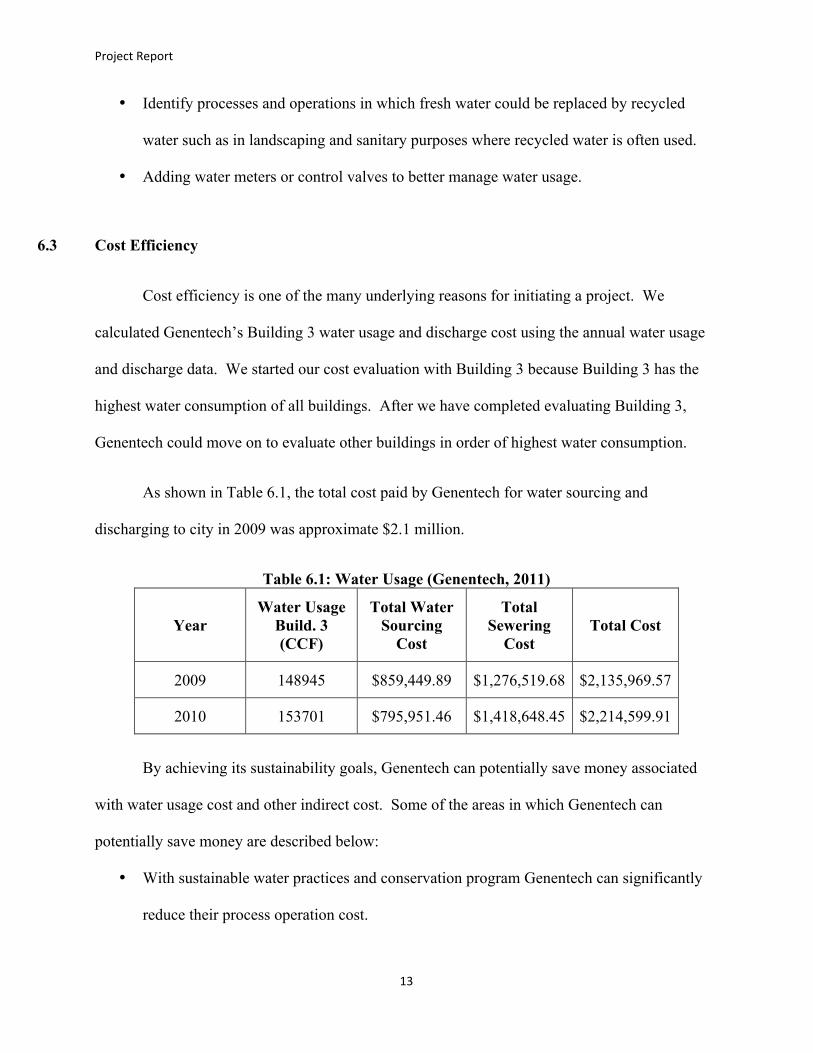
As shown in Table 6.1, the total cost paid by Genentech for water sourcing and
discharging to city in 2009 was approximate $2.1 million.
Table 6.1: Water Usage (Genentech, 2011)
Year Water Usage
Build. 3 (CCF)
Total Water Sourcing
Cost
Total Sewering
Cost Total Cost
2009 148945 $859,449.89 $1,276,519.68 $2,135,969.57
2010 153701 $795,951.46 $1,418,648.45 $2,214,599.91
By achieving its sustainability goals, Genentech can potentially save money associated
with water usage cost and other indirect cost. Some of the areas in which Genentech can
potentially save money are described below:
• With sustainable water practices and conservation program Genentech can significantly
reduce their process operation cost.

Project Report
14
• Since the quantity of sewer discharge is directly related to domestic water use, by
reducing water consumption, the quantity of sewer discharge is also reduced. This will in
turn reduce the loading rate of the city’s pump station (Pump Station No. 8) and local
sewer system, reducing risks of wastewater overflow into the San Francisco Bay.
6.4 Environmental Benefits
The results from our water balance can help Genentech initiate and identify many water
conservation projects and process improvement needs. The implementation of these activities
can lead to many environmental benefits. Some of the environmental benefits that can indirectly
result from our project are described in the following:
• Possible reduction in water consumption (after water conservation project
implementations), putting less demand on our natural resources.
• Improved ability to meet environmental compliance limits.
Project Report
15
7.0 WATER BALANCE OF BUILDING THREE: INTRODUCTION
In order to first conduct a water balance of the Building Three Manufacturing Building, first a
basic diagram of the building needed to be identified. This breaks down all of the “systems” that
will need to be analyzed.
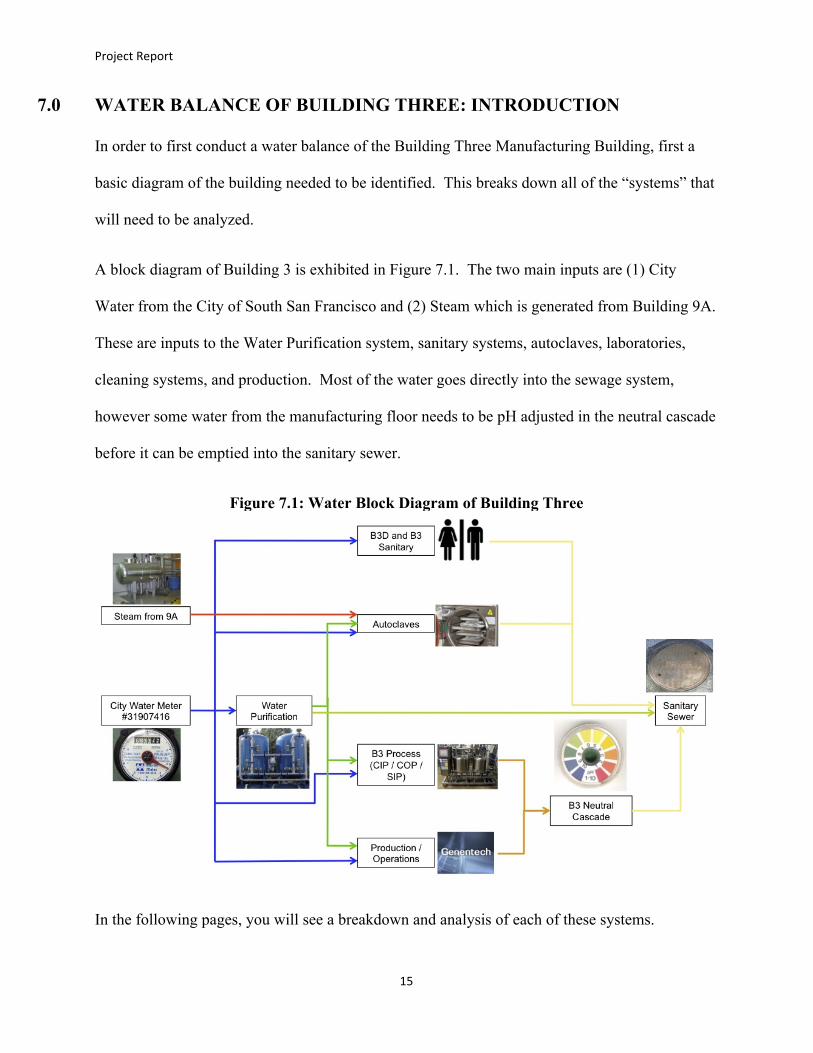
A block diagram of Building 3 is exhibited in Figure 7.1. The two main inputs are (1) City
Water from the City of South San Francisco and (2) Steam which is generated from Building 9A.
These are inputs to the Water Purification system, sanitary systems, autoclaves, laboratories,
cleaning systems, and production. Most of the water goes directly into the sewage system,
however some water from the manufacturing floor needs to be pH adjusted in the neutral cascade
before it can be emptied into the sanitary sewer.
Figure 7.1: Water Block Diagram of Building Three
In the following pages, you will see a breakdown and analysis of each of these systems.
Project Report
16
8.0 BREAKDOWN AND ANALYSIS OF “SYSTEMS” IN BUILDING THREE
8.1 WATER PURIFICATION SYSTEM
At Genentech, there are two types of water systems: Good Manufacturing Practice (GMP)
systems and non-GMP systems. GMP systems are water systems used for the production of
pharmaceutical material. Non-GMP systems are water systems used for sanitary purposes
(bathrooms, break rooms) and laboratories that do not require GMP water for their testing.
The Water Purification system takes in all of the city water from the City of San Francisco and is
converted to higher-grade water such as Deionized Water (DI), Purified Water (PW), or Water-
for-Injection (WFI). The water purification process for each grade of water is different and
different steps are taken to purify the water to the desired quality. Each water purification
system is a continuous process that produces a desired quality of water and contains no added
substance. In addition, all of our water systems meet the standards and requirements in the
United States Pharmacopeia (USP) and European Pharmacopeia (EP).
Deionized Water or DIW is prepared by ion exchange of city (potable) water. Purified Water or
PW is prepared by ion exchange, reverse osmosis, distillation, or other suitable methods. Water-
For-Injection or WFI is purified by distillation or by reverse osmosis.
These grades of water are used throughout the manufacturing floor for cleaning of equipment,
buffer makeup, and production operations. This part of the analysis focuses only on the water
loss during the water purification process. Any water loss and usage identified in cleaning or
production operations will be addressed at the later sections.
Project Report
17
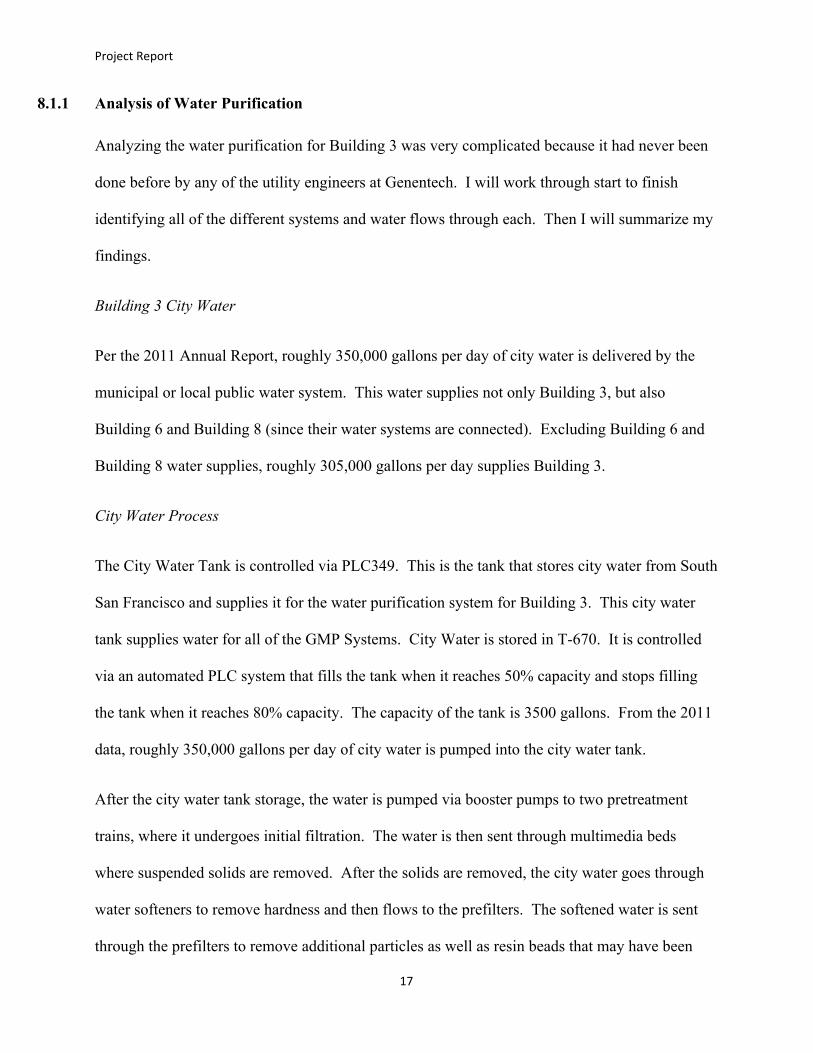
8.1.1 Analysis of Water Purification
Analyzing the water purification for Building 3 was very complicated because it had never been
done before by any of the utility engineers at Genentech. I will work through start to finish
identifying all of the different systems and water flows through each. Then I will summarize my
findings.
Building 3 City Water
Per the 2011 Annual Report, roughly 350,000 gallons per day of city water is delivered by the
municipal or local public water system. This water supplies not only Building 3, but also
Building 6 and Building 8 (since their water systems are connected). Excluding Building 6 and
Building 8 water supplies, roughly 305,000 gallons per day supplies Building 3.
City Water Process
The City Water Tank is controlled via PLC349. This is the tank that stores city water from South
San Francisco and supplies it for the water purification system for Building 3. This city water
tank supplies water for all of the GMP Systems. City Water is stored in T-670. It is controlled
via an automated PLC system that fills the tank when it reaches 50% capacity and stops filling
the tank when it reaches 80% capacity. The capacity of the tank is 3500 gallons. From the 2011
data, roughly 350,000 gallons per day of city water is pumped into the city water tank.
After the city water tank storage, the water is pumped via booster pumps to two pretreatment
trains, where it undergoes initial filtration. The water is then sent through multimedia beds
where suspended solids are removed. After the solids are removed, the city water goes through
water softeners to remove hardness and then flows to the prefilters. The softened water is sent
through the prefilters to remove additional particles as well as resin beads that may have been
Project Report
18
released from the water softeners. After the water is softened, it is exposed to UV lights to
initially remove microorganisms. After the UV lights, the water flows to the shell and tube heat
exchangers to achieve optimal temperature, where heating may or may not be necessary, before
the water is pumped through the RO membranes. Once the water leaves the heat exchangers, it
is injected with sodium bisulfate to remove chlorine that may still be present. At this stage,
sodium hydroxide may also be injected if adjusting the pH of the water is necessary. It is
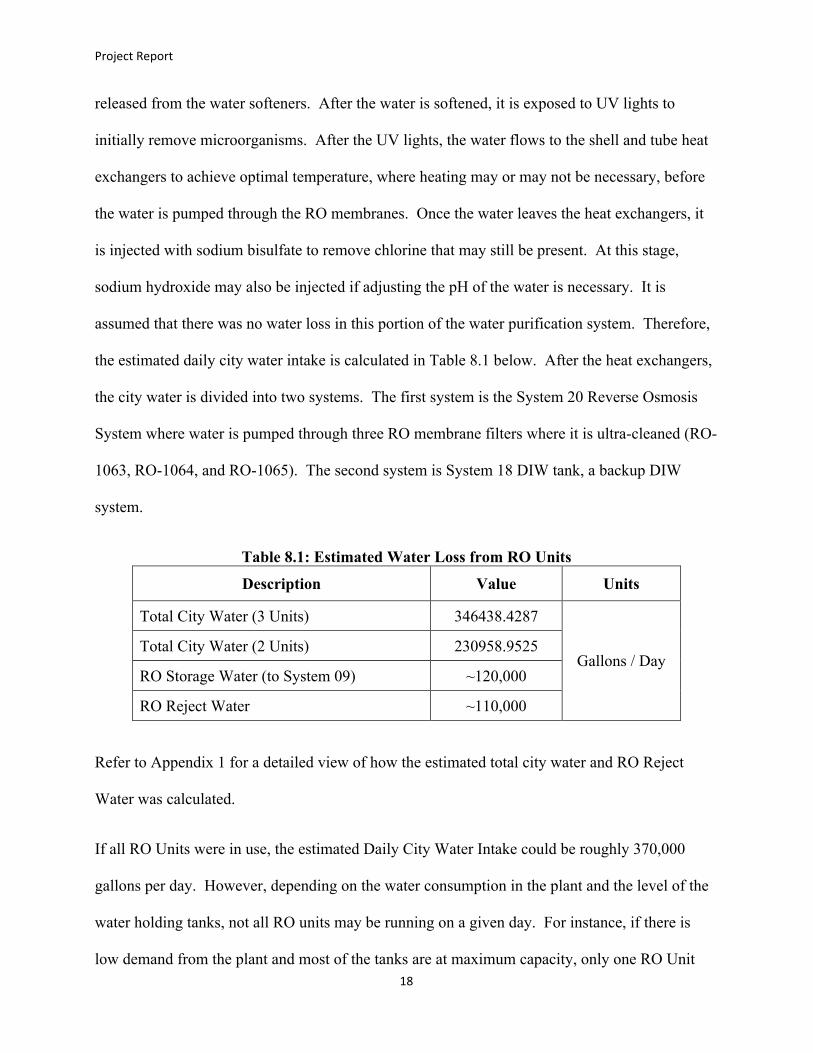
assumed that there was no water loss in this portion of the water purification system. Therefore,
the estimated daily city water intake is calculated in Table 8.1 below. After the heat exchangers,
the city water is divided into two systems. The first system is the System 20 Reverse Osmosis
System where water is pumped through three RO membrane filters where it is ultra-cleaned (RO-
1063, RO-1064, and RO-1065). The second system is System 18 DIW tank, a backup DIW
system.
Table 8.1: Estimated Water Loss from RO Units
Description Value Units
Total City Water (3 Units) 346438.4287
Total City Water (2 Units) 230958.9525
RO Storage Water (to System 09) ~120,000
RO Reject Water ~110,000
Gallons / Day
Refer to Appendix 1 for a detailed view of how the estimated total city water and RO Reject
Water was calculated.
If all RO Units were in use, the estimated Daily City Water Intake could be roughly 370,000
gallons per day. However, depending on the water consumption in the plant and the level of the
water holding tanks, not all RO units may be running on a given day. For instance, if there is
low demand from the plant and most of the tanks are at maximum capacity, only one RO Unit
Project Report
19
may be running. However, if there is high demand for the water, then two or sometimes even
three RO Units may be operating at a given moment. Generally, there are only two RO Units
operating at a given time, lowering our city water intake to approximately 230,000 gallons per
day.
System 20 Reverse Osmosis (RO)
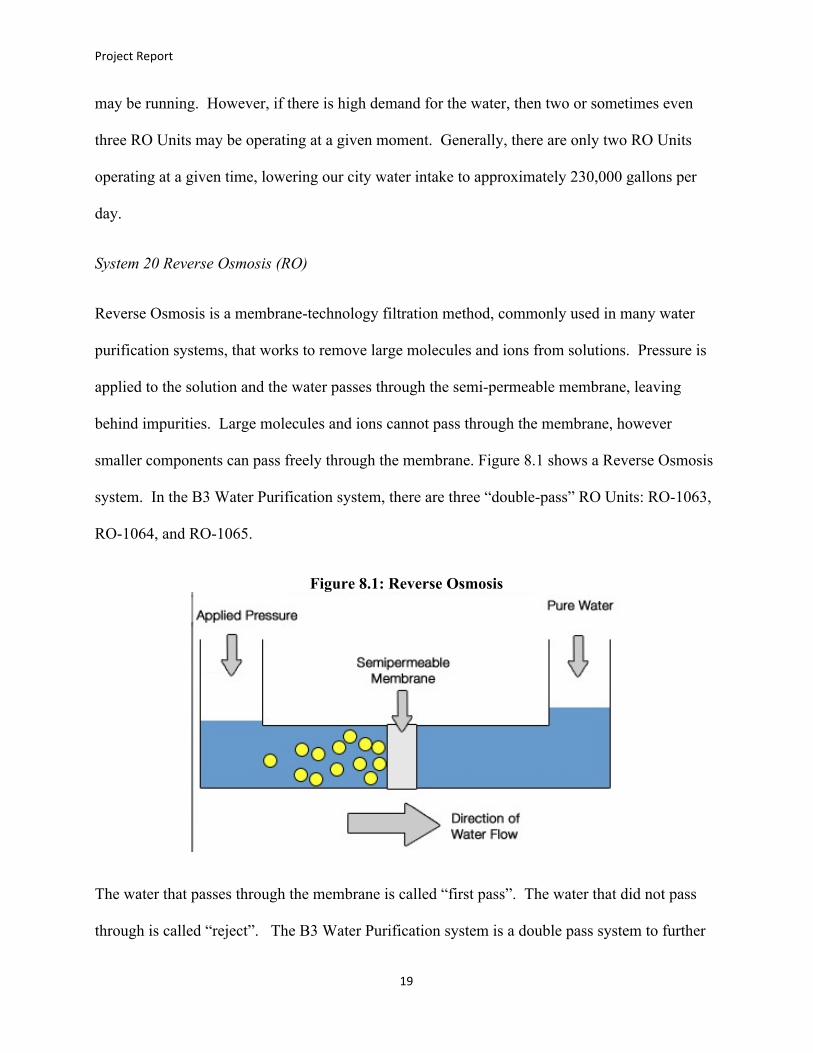
Reverse Osmosis is a membrane-technology filtration method, commonly used in many water
purification systems, that works to remove large molecules and ions from solutions. Pressure is
applied to the solution and the water passes through the semi-permeable membrane, leaving
behind impurities. Large molecules and ions cannot pass through the membrane, however
smaller components can pass freely through the membrane. Figure 8.1 shows a Reverse Osmosis
system. In the B3 Water Purification system, there are three “double-pass” RO Units: RO-1063,
RO-1064, and RO-1065.
Figure 8.1: Reverse Osmosis
The water that passes through the membrane is called “first pass”. The water that did not pass
through is called “reject”. The B3 Water Purification system is a double pass system to further

Project Report
20
purify the permeate from one RO by running it through another RO to achieve a higher quality
water. Some of the reject water is recycled back into the RO Unit. The reject water is sent
directly to the drain and accounts for majority of the water loss in the water purification system.
Only until recently, a water conservation project was implemented that transferred all of the RO
reject water to the cooling towers in a neighboring building and is currently saving the company
millions of gallons of water a year.
After the RO Membranes, water is sent to the three Continuous Electronic Deionization (CEDI)
units to lower conductivity to a specified range. Water is then sent through the two resin
strainers and then flows through a secondary set of UV lights. After the water leaves the UV
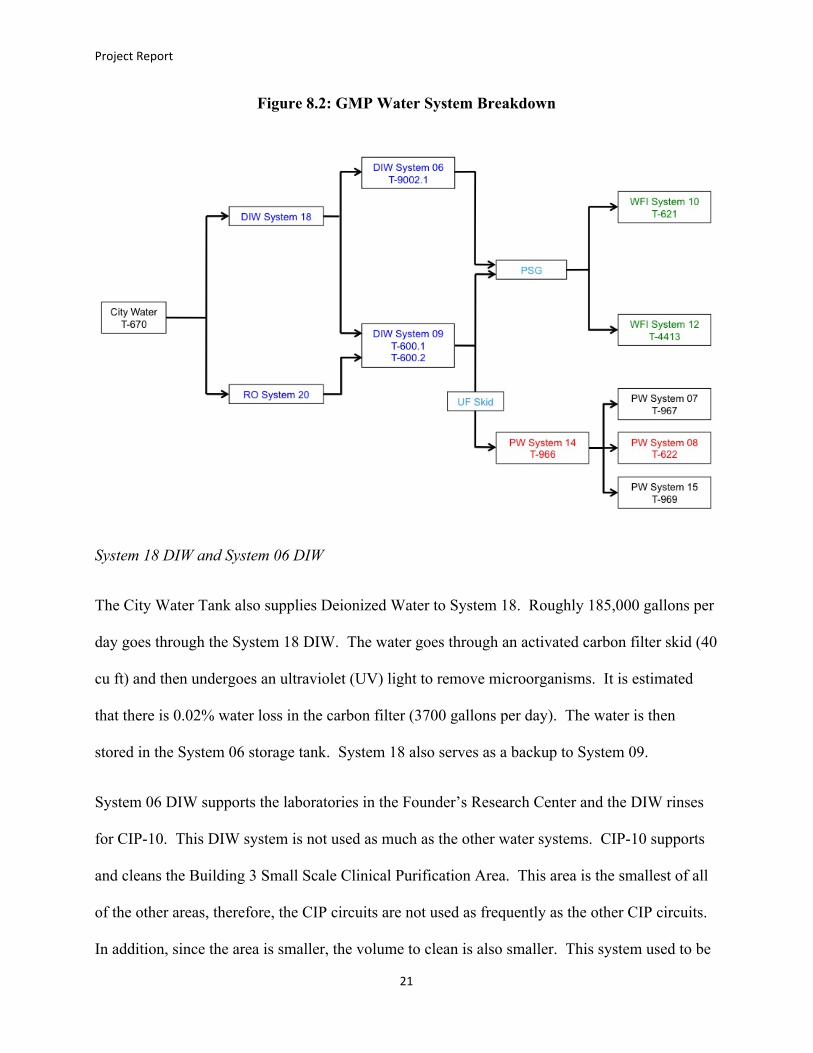
lights, it is considered Deionized (DIW) and stored in the System 9 tanks, T-600.1 and T-600.2.
Figure 8.2 shows the GMP water system breakdown.
There is a monthly totalizer on the RO Units that calculates the total water that is stored in
System 9 Tanks and averages to roughly 120,000 gallons a month. From this value, it is
estimated that roughly 110,000 gallons per day is RO Reject Water and discharged directly to the
drain. Fortunately, last year a RO Reject Water Project was implemented that diverts roughly
50% of the reject water to the cooling towers in Building 9A. The remaining 50% is still
discharged in the drain, but still one step towards sustainability.
Project Report
21
Figure 8.2: GMP Water System Breakdown
System 18 DIW and System 06 DIW
The City Water Tank also supplies Deionized Water to System 18. Roughly 185,000 gallons per
day goes through the System 18 DIW. The water goes through an activated carbon filter skid (40
cu ft) and then undergoes an ultraviolet (UV) light to remove microorganisms. It is estimated
that there is 0.02% water loss in the carbon filter (3700 gallons per day). The water is then
stored in the System 06 storage tank. System 18 also serves as a backup to System 09.
System 06 DIW supports the laboratories in the Founder’s Research Center and the DIW rinses
for CIP-10. This DIW system is not used as much as the other water systems. CIP-10 supports
and cleans the Building 3 Small Scale Clinical Purification Area. This area is the smallest of all
of the other areas, therefore, the CIP circuits are not used as frequently as the other CIP circuits.
In addition, since the area is smaller, the volume to clean is also smaller. This system used to be
Project Report
22
used more frequently in Building 3, however within the past five years, water usage has been for
DIW systems has switched over to System 09. Therefore, the demand for System 06 is lower
and evident in stagnant flow rate in IP-21. Since this DIW system is not used as frequently, in
order to prevent microbial growth and allow movement through the piping, utility operators
perform a 5-fold flush into the drain of the System 06 storage tank. This allows enough
movement of the DIW through the piping. The estimated water loss is roughly ~750 gallons per
day.
Purified and WFI Systems
After the RO Membranes, the deionized water is transferred through a ultrafiltration (UF) Skid
with negligible water loss to produce purified water (PW). The water-for-injection (WFI) system
is generated from the WFI Still which is supplied from the Pure Steam Generator (PSG). System
14 and System 08 holding tanks are stored at 85 °C. There will be loss of water through
evaporation, but for the simplicity of this report, it was assumed to be negligible. These PW and
WFI Systems are all stored in Holding Tanks until they are needed for use for cleaning,
steaming, or routine operations. Their outflows are diagrammed in each of the corresponding
systems, Autoclaves, Cleaning-In-Process Systems, and Sanitization-In-Process Systems.
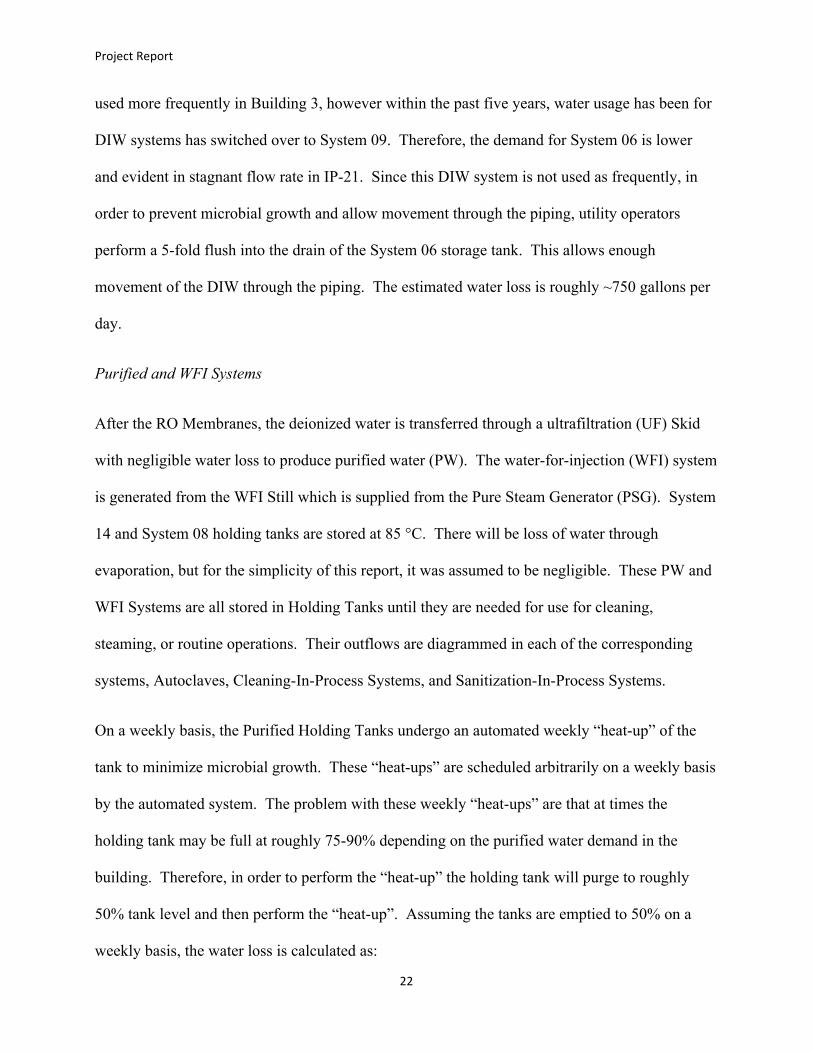
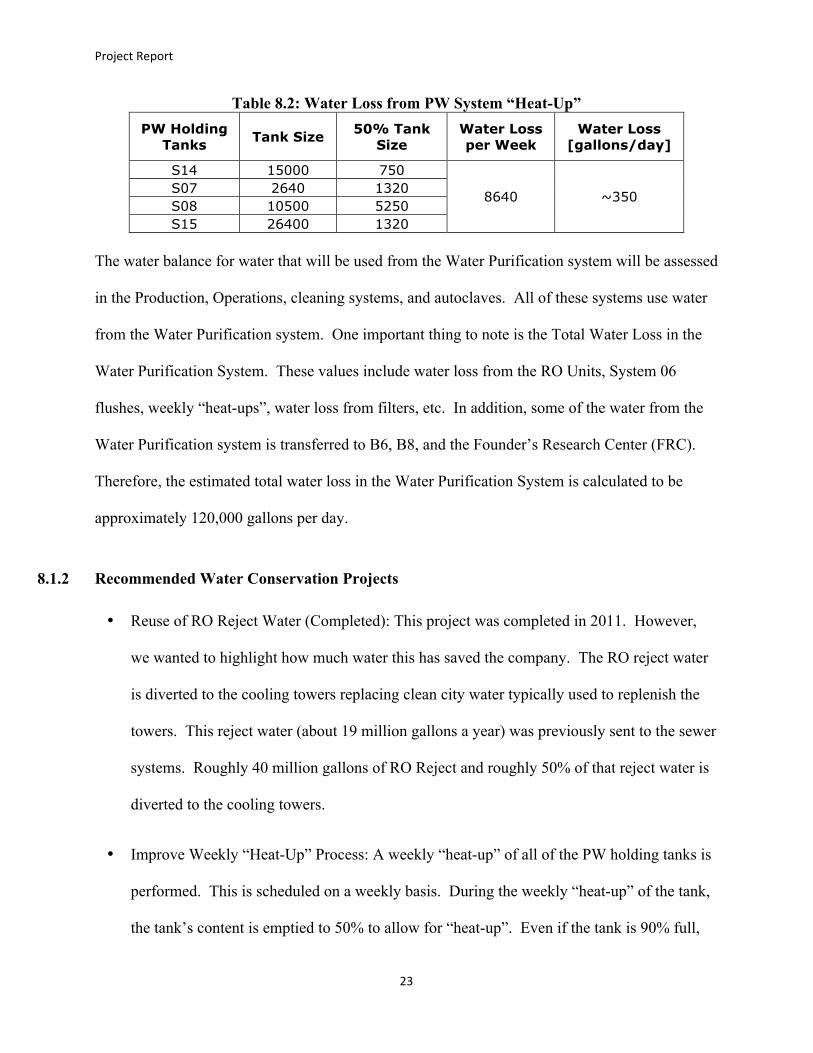
On a weekly basis, the Purified Holding Tanks undergo an automated weekly “heat-up” of the
tank to minimize microbial growth. These “heat-ups” are scheduled arbitrarily on a weekly basis
by the automated system. The problem with these weekly “heat-ups” are that at times the
holding tank may be full at roughly 75-90% depending on the purified water demand in the
building. Therefore, in order to perform the “heat-up” the holding tank will purge to roughly
50% tank level and then perform the “heat-up”. Assuming the tanks are emptied to 50% on a
weekly basis, the water loss is calculated as:
Project Report
23
Table 8.2: Water Loss from PW System “Heat-Up” PW Holding
Tanks Tank Size 50% Tank Size
Water Loss per Week
Water Loss [gallons/day]
S14 15000 750 S07 2640 1320 S08 10500 5250 S15 26400 1320
8640 ~350
The water balance for water that will be used from the Water Purification system will be assessed
in the Production, Operations, cleaning systems, and autoclaves. All of these systems use water
from the Water Purification system. One important thing to note is the Total Water Loss in the
Water Purification System. These values include water loss from the RO Units, System 06
flushes, weekly “heat-ups”, water loss from filters, etc. In addition, some of the water from the
Water Purification system is transferred to B6, B8, and the Founder’s Research Center (FRC).
Therefore, the estimated total water loss in the Water Purification System is calculated to be
approximately 120,000 gallons per day.
8.1.2 Recommended Water Conservation Projects
• Reuse of RO Reject Water (Completed): This project was completed in 2011. However,
we wanted to highlight how much water this has saved the company. The RO reject water
is diverted to the cooling towers replacing clean city water typically used to replenish the
towers. This reject water (about 19 million gallons a year) was previously sent to the sewer
systems. Roughly 40 million gallons of RO Reject and roughly 50% of that reject water is
diverted to the cooling towers.
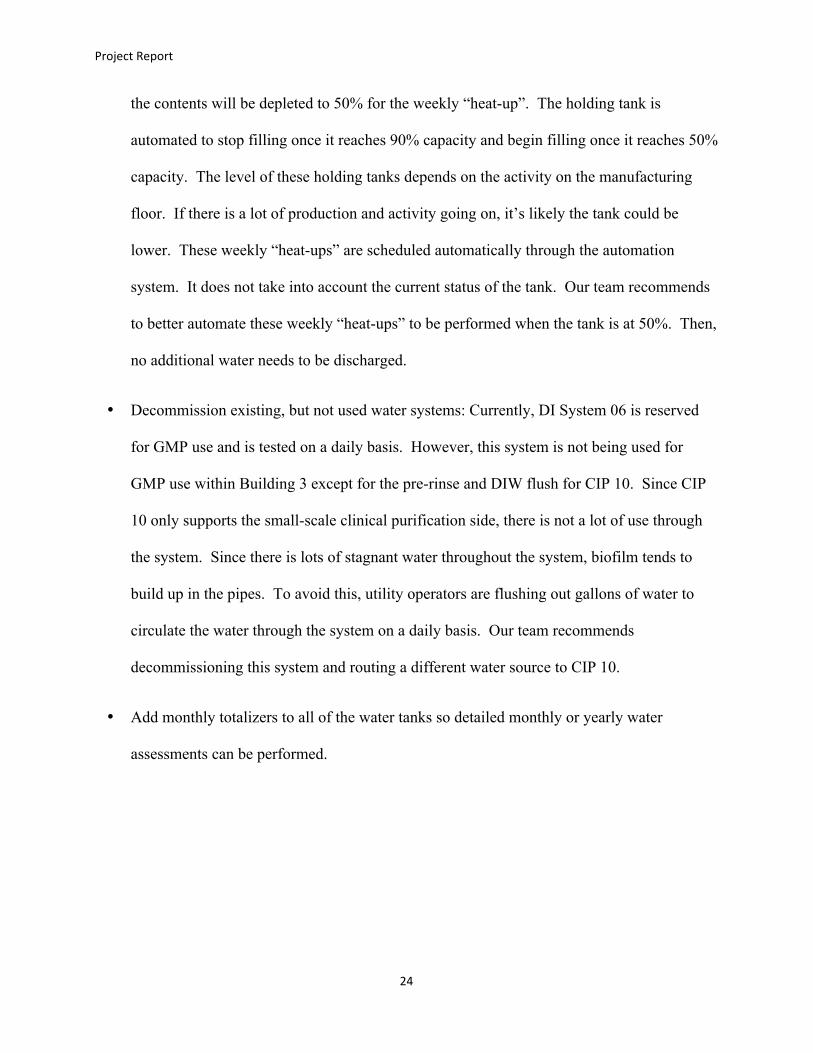
• Improve Weekly “Heat-Up” Process: A weekly “heat-up” of all of the PW holding tanks is
performed. This is scheduled on a weekly basis. During the weekly “heat-up” of the tank,
the tank’s content is emptied to 50% to allow for “heat-up”. Even if the tank is 90% full,
Project Report
24
the contents will be depleted to 50% for the weekly “heat-up”. The holding tank is
automated to stop filling once it reaches 90% capacity and begin filling once it reaches 50%
capacity. The level of these holding tanks depends on the activity on the manufacturing
floor. If there is a lot of production and activity going on, it’s likely the tank could be
lower. These weekly “heat-ups” are scheduled automatically through the automation
system. It does not take into account the current status of the tank. Our team recommends
to better automate these weekly “heat-ups” to be performed when the tank is at 50%. Then,
no additional water needs to be discharged.
• Decommission existing, but not used water systems: Currently, DI System 06 is reserved
for GMP use and is tested on a daily basis. However, this system is not being used for
GMP use within Building 3 except for the pre-rinse and DIW flush for CIP 10. Since CIP
10 only supports the small-scale clinical purification side, there is not a lot of use through
the system. Since there is lots of stagnant water throughout the system, biofilm tends to
build up in the pipes. To avoid this, utility operators are flushing out gallons of water to
circulate the water through the system on a daily basis. Our team recommends
decommissioning this system and routing a different water source to CIP 10.
• Add monthly totalizers to all of the water tanks so detailed monthly or yearly water
assessments can be performed.
Project Report
25
8.2 SANITARY SYSTEM
8.2.1 Introduction to Sanitary System
Water used and discharged from restrooms, showers, kitchens, laundry, dishwashing and other
non-industrial operations is called sanitary water or gray water. However, for the purpose of this
calculation, only the water discharged from the restrooms were considered for this calculation.
There The sanitary system is an integral part of an overall water balance, but constitutes only a
small part to the overall water usage and discharge in Genentech.
8.2.2 Assumptions Used
1) All toilets, faucets and showers are considered the same capacity.
2) Leaks from pipes, evaporation, loss to ground and other system are considered negligible.
3) Calculations are based on average water usage of 20 gallons per day per employee.
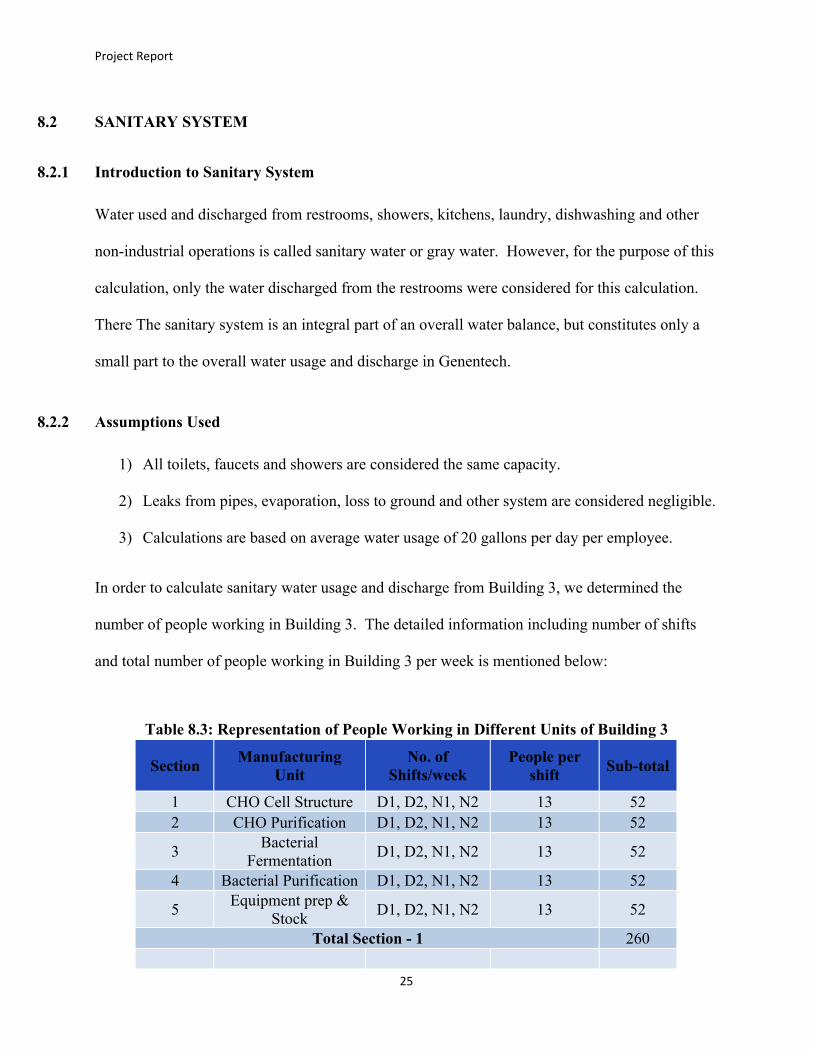
In order to calculate sanitary water usage and discharge from Building 3, we determined the
number of people working in Building 3. The detailed information including number of shifts
and total number of people working in Building 3 per week is mentioned below:
Table 8.3: Representation of People Working in Different Units of Building 3
Section Manufacturing Unit
No. of Shifts/week
People per shift Sub-total
1 CHO Cell Structure D1, D2, N1, N2 13 52 2 CHO Purification D1, D2, N1, N2 13 52
3 Bacterial Fermentation D1, D2, N1, N2 13 52
4 Bacterial Purification D1, D2, N1, N2 13 52
5 Equipment prep & Stock D1, D2, N1, N2 13 52
Total Section - 1 260
Project Report
26
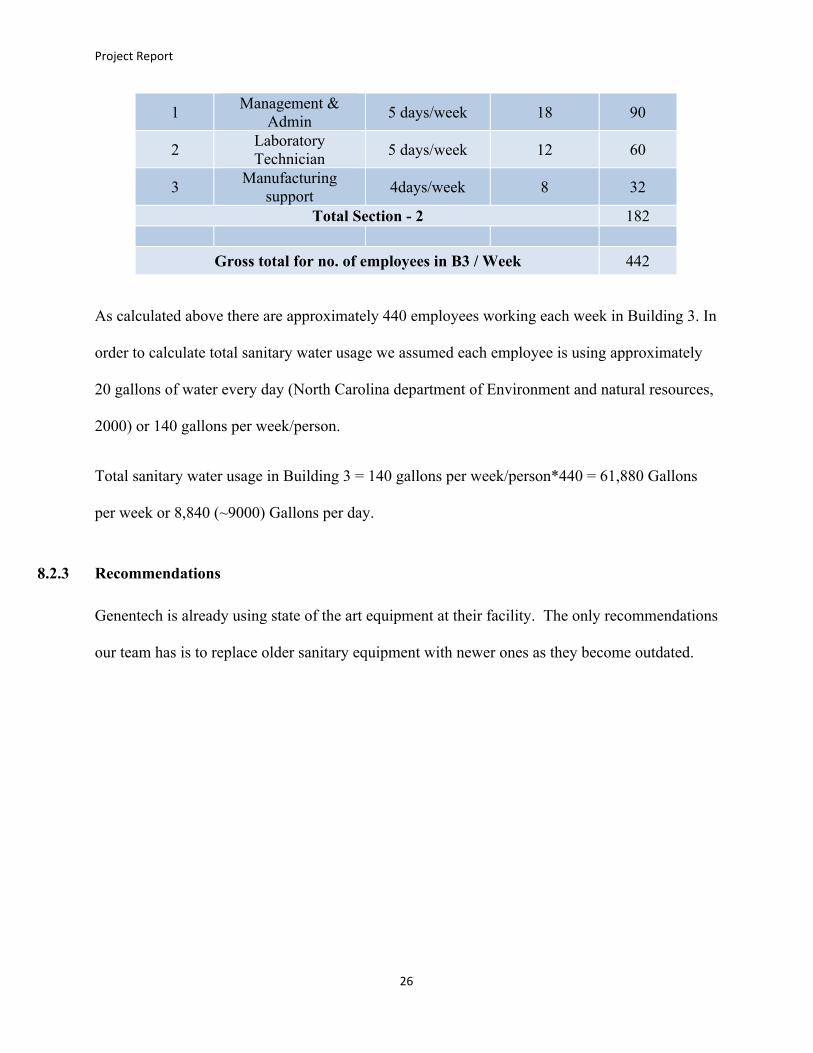
1 Management & Admin 5 days/week 18 90
2 Laboratory Technician 5 days/week 12 60
3 Manufacturing support 4days/week 8 32
Total Section - 2 182
Gross total for no. of employees in B3 / Week 442
As calculated above there are approximately 440 employees working each week in Building 3. In
order to calculate total sanitary water usage we assumed each employee is using approximately
20 gallons of water every day (North Carolina department of Environment and natural resources,
2000) or 140 gallons per week/person.
Total sanitary water usage in Building 3 = 140 gallons per week/person*440 = 61,880 Gallons
per week or 8,840 (~9000) Gallons per day.
8.2.3 Recommendations
Genentech is already using state of the art equipment at their facility. The only recommendations
our team has is to replace older sanitary equipment with newer ones as they become outdated.
Project Report
27
8.3 AUTOCLAVE SYSTEM
8.3.1 Autoclave Description
The autoclaves in Building 3 are one of the processing systems selected for our water balance
evaluation due to the large amount of water they consume. Autoclave is a process by which
equipment is sterilized by exposure to saturated steam. This saturated steam creates a very high
temperature and pressure within an enclosed pressure vessel to kill the bacteria. After the
completion of the steam sterilization process, the hot steam can be disposed of in a variety of
ways depending on the autoclave model. One way of disposing the hot steam is by discharging it
directly into the sanitary sewer system. However, before the hot steam gets discharged into the
sewer, it needs to be cooled down using cold potable water. Steam that is cooled and
subsequently condenses into liquid is called condensate. The condensate has to be at or below
140°C before it gets discharged into the sewer to prevent pipe damage (Morris & Masten, 2012).
After the condensate gets discharged, the autoclave system will usually undergo a drying process
by which water is used to draw a vacuum in the chamber to expedite the drying process
(Environmental Protection Agency (EPA) & Department of Energy (DOE), 2005). As such, an
autoclave can consume a significant amount of water.
In summary, there are three ways an autoclave consumes water:
1. Generating steam for sterilization.
2. Cooling condensate for meeting sewer discharge requirements.
3. Drawing water to create a vacuum for expedited drying process.
Project Report
28
8.3.2 Autoclave Data Collection Method
Building 3 has four autoclave systems, all of which are of the Steris Finn Aqua autoclave model.
We came up with two options for collecting autoclave data for our water balance as listed in the
following:
• Automated monitoring programs
• Published data sources
However, we were unable to find established monitoring programs of autoclave operations in
Building 3 that would provide system parameter readings such as the IP21 monitoring program
for CIP systems.
As such, we are only able to rely on published data for performing our water balance on the
autoclave systems in Building 3. Based on the May 2005 Water Efficiency Guide for
Laboratories produced by Laboratories for the 21st Century which is a joint program of the U.S.
Environmental Protection Agency (EPA) and the U.S. Department of Energy (DOE), the water
usage rate of a laboratory-type sterilizer (i.e., autoclave) ranges from 1 to 3 gallons per minute
(gpm) and some autoclaves can operate 24 hours per day (EPA & DOE, 2005). Also, based on
the 2008 Watersmart Guidebook: A Water-Use Efficiency Plan and Review Guide for New
Businesses produced by East Bay Municipal Utility District (EBMUD), autoclave water use per
cycle is in the range of 350 to 400 gallons per cycle (loads). In busy facilities such as large
hospitals, delivery facilities, and central sterile facilities, 15 to 20 loads can be sterilized per day
(EBMUD, 2008).
Project Report
29
8.3.3 Autoclave Water Usage Estimation
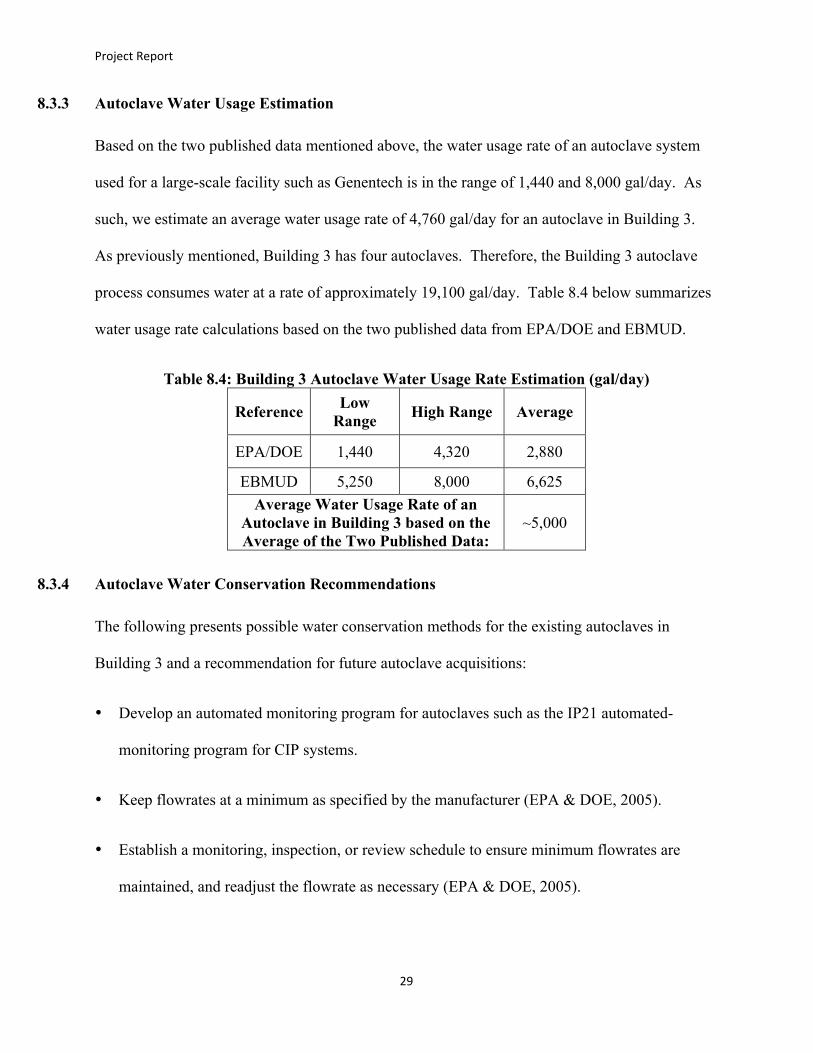
Based on the two published data mentioned above, the water usage rate of an autoclave system
used for a large-scale facility such as Genentech is in the range of 1,440 and 8,000 gal/day. As
such, we estimate an average water usage rate of 4,760 gal/day for an autoclave in Building 3.
As previously mentioned, Building 3 has four autoclaves. Therefore, the Building 3 autoclave
process consumes water at a rate of approximately 19,100 gal/day. Table 8.4 below summarizes
water usage rate calculations based on the two published data from EPA/DOE and EBMUD.
Table 8.4: Building 3 Autoclave Water Usage Rate Estimation (gal/day)
Reference Low Range High Range Average
EPA/DOE 1,440 4,320 2,880
EBMUD 5,250 8,000 6,625 Average Water Usage Rate of an
Autoclave in Building 3 based on the Average of the Two Published Data:
~5,000
8.3.4 Autoclave Water Conservation Recommendations
The following presents possible water conservation methods for the existing autoclaves in
Building 3 and a recommendation for future autoclave acquisitions:
• Develop an automated monitoring program for autoclaves such as the IP21 automated-
monitoring program for CIP systems.
• Keep flowrates at a minimum as specified by the manufacturer (EPA & DOE, 2005).
• Establish a monitoring, inspection, or review schedule to ensure minimum flowrates are
maintained, and readjust the flowrate as necessary (EPA & DOE, 2005).

Project Report
30
• Install an expansion tank instead of using cold water to temper the condensate. Make sure
that this replacement will not interfere with normal operations (EPA & DOE, 2005).
• Install automatic shut-off feature to automatically turn off water when the autoclave is not in
use. Make sure that this feature will not interfere with normal operations (EPA & DOE,
2005).
• Utilize high quality steam for a more efficient use of water (EPA & DOE, 2005).
• Recycle the condensate and cooling water for non-potable uses such as for boilers and
cooling towers (EPA & DOE, 2005).
• Install water conservation retrofit kits for older units. These devices reduce water use by
controlling the flow of the cooling water (tempering kits) or by replacing the need for water
to draw a vacuum within the chamber for the drying process (venturi kits). Tempering kits
senses the temperature of the autoclave condensate and allows cooling water to flow and mix
with the condensate only as needed before the condensate is discharged into the sewer
system. The venturi kit replaces the need for using water to draw a vacuum with a
mechanical vacuum pump (EBMUD, 2008).
Purchase autoclaves that recirculate water and/or automatically turns off water flow when the
system is not in use (EPA & DOE, 2005).
Project Report
31
8.4 CLEAN-IN-PLACE (CIP) SYSTEM
The clean-in-place (CIP) systems in Building 3 are one of the processing systems selected for our
water balance evaluation due to the large amount of water they consume. CIP is a process by
which equipment and systems are cleaned without disassembly. It is an essential component of
Genentech’s manufacturing process because it decontaminates and sterilizes manufacturing
equipment to prevent contamination of the next batch of product.
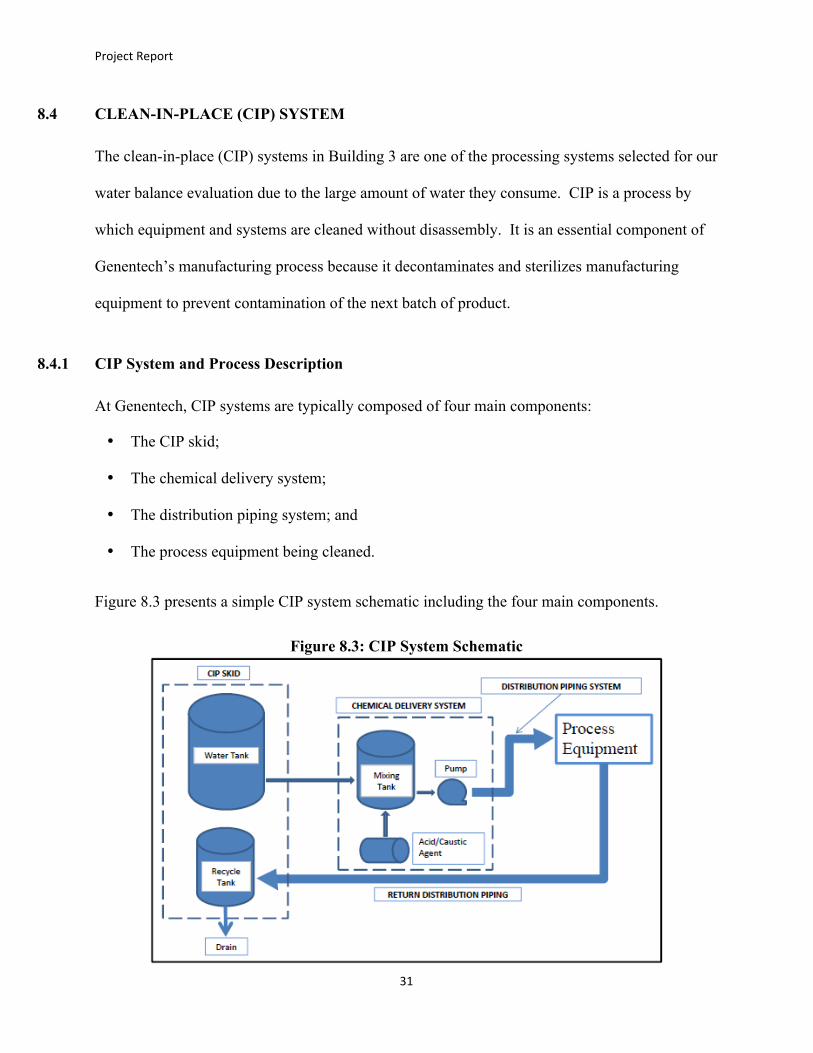
8.4.1 CIP System and Process Description
At Genentech, CIP systems are typically composed of four main components:
• The CIP skid;
• The chemical delivery system;
• The distribution piping system; and
• The process equipment being cleaned.
Figure 8.3 presents a simple CIP system schematic including the four main components.
Figure 8.3: CIP System Schematic
Project Report
32
As seen in Figure 8.3, the process equipment being cleaned is connected to the CIP skid (source
of cleaning solution) by the distribution piping and chemical delivery system. A typical water
flow path of a CIP process starts from the water tank on the CIP skid, through the chemical
delivery system where water, depending on the cleaning phase the CIP process, may be mixed
with cleaning chemicals including acid and caustic agents, distribution piping system, process
equipment, and then returns through the return distribution piping, back to the CIP skid and into
a second tank on the skid (typically a recycle tank), and finally out to the drain.
8.4.2 CIP Data Collection Method
Building 3 has nine CIP systems that vary slightly in system design, make-up of components,
and the equipment that each system cleans. However, the cleaning process of these CIP systems
is similar. Because the CIP systems have slightly different components and designs, data and
information pertaining to water usage of the CIP systems were collected from various types of
water monitoring devices as described below. In general, data and information used to estimate
the water balance of the CIP systems in Building 3 were collected using three main methods:
• Genentech’s automated system monitoring program called Aspen Process Explorer (IP21);
• CIP batch reports;
• CIP system reference manual; and
• Engineering calculations/data from system operators.
Genentech’s automated IP21 program monitors and logs CIP system parameters over time by
electronic communication from devices such as a totalizer, a flow meter, a tank water level
indicator, and a temperature gauge. As previously mentioned, due to different system
components and designs, water data (e.g., water flows and water totals) may be recorded using a
Project Report
33
flow meter at one CIP system and from a tank water level indicator at another CIP system.
Furthermore, there may be a different combination of device sources that is used to record water
data at each CIP system. We were able to obtain water data from IP21 including flowrates and
water levels in CIP tanks.
CIP batch reports are time logs of a CIP operation. In particular, the length of time for each
phase of a wash cycle is recorded and the number of wash cycles per day is presented in the
reports. Batch reports were useful to verify the phase and cycle times recorded in the IP21
program.
CIP reference manual was used for one of the CIP systems (T-7421) in Building 3. CIP
reference manuals are properties of Genentech and are used as guidelines for operating the CIP
systems. CIP system specifications and parameters are found in these manuals such as optimum
flowrates.
We were also able to obtain engineering calculations that were previously performed by an
operator for one of the CIP systems (CIP-1). These engineering calculations provided results of
total water usage by different phases of the CIP cleaning cycle per equipment cleaned. We were
able to use this data to estimate the daily water usage rate of the CIP system based on a few
assumptions such as the average number of cleaning cycles performed in one day.
As previously mentioned, Building 3 has nine CIP systems: CIP-1, CIP-2, CIP-3, CIP-4, CIP-5,
CIP-9, CIP-10, CIP-12, and T-7421. A description of each of the CIP systems and their water
balance is presented in the following.
Project Report
34
8.4.3 CIP-1
CIP-1 is one of the oldest and highly utilized, large-scale CIP skid in Building 3. This cleaning
skid serves the Cell Culture Fermentation area of the building. It is used to clean a variety of
laboratory equipments, tanks, and process pipelines. CIP-1 has six-phase sequence in one wash
cycle as shown in the following:
• Phase 1: Pre-Rinse
• Phase 2: Caustic Wash
• Phase 3: Post-Caustic Rinse
• Phase 4: Acid Wash
• Phase 5: Post-Acid Rinse
• Phase 6: Final Rinse
Air Purge phases were later added between each phase cycle and after the Final Rinse phase to
prevent mechanical problems. However, these phases do not utilize water and do not affect our
water balance.
As previously indicated, CIP-1 is the only CIP system for which we were able to directly obtain
estimated water usage totals in each phase and wash cycle for each of the equipment cleaned by
the system from a Genentech engineer. Based on the data obtained from the Genentech engineer,
we were able to calculate an average water usage rate of CIP-1. In our water usage rate
estimations, we conservatively assumed that all of the equipments connected to the CIP-1 system
are cleaned once per day. Based on data obtained from the Genentech engineer, we estimate a
Project Report
35
water usage rate of 48,000 liters per day (L/day) or 12,700 gallons per day (gal/day) for CIP-1.
Water usage totals and estimated water usage rates for CIP-1 are presented in Appendix 3.
8.4.4 CIP-2
CIP-2 is a sister skid to CIP-1 and therefore has similar features to CIP-1. This cleaning skid
serves the Purification and Final Purification areas of the Building 3. It is used to clean a variety
of laboratory tanks and process pipelines. CIP-2 has six-phase sequence in a wash cycle as
shown in the following:
• Phase 1: Pre-Rinse
• Phase 2: Caustic Wash
• Phase 3: Post-Caustic Rinse
• Phase 4: Acid Wash
• Phase 5: Post-Acid Rinse
• Phase 6: Final Rinse
An Air Purge phase occurs after the Final Rinse phase. However, this phase does not utilize
water and does not affect our water balance.
The IP21 program monitors and logs CIP-2 system parameters including flowrates and water
tank levels. IP21 has a graph function that allowed us to select specific parameters to plot
against a specified time period of operation. This allowed us to observe the behavior of a
parameter over a period of time.

Project Report
36
To evaluate CIP-2 water usage in a 24-hour time period, we first selected an arbitrary day (26
February 2012) of operation and two system parameters (distribution flowrate [CIP Sup Flow]
and feed tank water level [Tank 740 Level]) to represent the X-axis and Y-axis, respectively, in
the IP21 graph function. This graph is presented in Figure 8.4 and includes additional system
parameters that were not of use in our evaluation. We also looked at the CIP-2 batch reports on
26 February 2012 to verify the operating times and number of wash cycles indicated in the IP21
graph. Using data from the IP21 graph and batch reports, we calculated the total amount of
water used in one wash cycle and averaged that water amount over the duration of the wash cycle
to estimate a water usage per minute rate. We then determined the total number of minutes of
CIP operation during 26 February 2012 from the batch reports and subsequently estimated the
daily water usage rate of CIP-2 by multiplying the water usage per minute rate by the total
number of minutes of operation during that day.
Figure 8.4: CIP-2 IP21 Monitoring on 26 February 2012

Project Report
37
Table 8.4 presents the total water usage calculation for one wash cycle on 26 February 2012. As
seen in Table 8.4, the total amount of water used during the wash cycle is 3,400 liters and the
duration of the wash cycle is 30.4 minutes. As a result, the estimated water usage rate during this
wash cycle is 112 liters per minute (L/min). Table 8.5 summarizes the number of wash cycles
performed during 26 February 2012 as well as the total minutes per wash cycle. As seen in
Table 8.5, CIP-2 was operated for a total of 284 minutes. Assuming a water usage rate of 112
L/min over 284 minutes of operation per day, we estimate a daily water usage rate of
approximately 32,000 L/day or 8,400 gal/day for CIP-2.
Table 8.5: CIP-2 Water Usage Calculation
Date Phase Start Time
End Time
Time Operated
Flow Volume 1
(L)
Flow Volume 2
(L)
Flow Volume 3
(L)
Total Volume
(L)
Pre-Rinse 3:42:27 3:45:50 0:03:23 198 56.5 145.05 400
Caustic Wash 3:45:50 3:53:52 0:08:02 NA 800
Post-Caustic Rinse
3:53:52 3:57:16 0:03:24 198 56.5 145.05 400
Acid Wash 3:57:16 4:05:17 0:08:01 NA 800
Post-Acid Rinse 4:05:17 4:08:36 0:03:19 198 56.5 145.05 400
2/26/2012
Final Rinse 4:08:36 4:12:55 0:04:19 465 62 NA 550
Total: 0:30:28 Total: 3,400
Flow Rate
(L/min): 112

Project Report
38
8.4.5 CIP-3
CIP-3 is a large-scale skid that is used to clean a variety of tanks, process pipelines, and
manifolds in the CHO Purification areas of Building 3. CIP-3 has six-phase sequence in a wash
cycle as shown in the following:
• Phase 1: Pre-Rinse
• Phase 2: Caustic Wash
• Phase 3: Post-Caustic Rinse
• Phase 4: Acid Wash
• Phase 5: Post-Acid Rinse
• Phase 6: Final Rinse
Table 8.6: Number of Wash Cycles and Minutes per Wash Cycle Wash Cycle: 1 2 3 4 5 6 7 8 9
CIP Date Minutes per Wash Cycle Total Minutes per Day
2 2/26/2012 30.4 36.8 34.8 30.25 29.8 30.4 30.4 30.4 30.4 284 4 2/27/2012 67.3 71.7 70.5 - - - - - - 210 5 2/26/2012 80.4 85.2 84.8 84.6 95.6 - - - - 431 10 2/26/2012 82.3 82.7 - - - - - - - 165 12 2/26/2012 144.9 83.4 88.5 88.9 83.7 141.2 121 88.9 - 841
An Air Purge phase occurs between the Pre-Rinse phase and subsequent phases. The main
purpose of this Air Purge phase is to reduce the amount of pre-rinse water used and to drain
liquid holdup in the system and equipment/lines and reduce dilution of chemicals in the
subsequent phases. However, this phase does not utilize water and does not affect our water
balance.
Project Report
39
There were no appropriate parameters found for CIP-3 in the IP21 program to assist our
calculation of total water usage. As such, the water usage rate estimation for CIP-3 is based on
similar CIP systems in terms of size and/or usage. There are four other CIPs that fit these criteria
and they are CIP-1, CIP-2, CIP-5, and CIP-12. Taking the average daily water usage rate of
these four CIP systems gives an estimated daily water usage rate of 30,000 L/day or 8,000
gal/day for CIP-3.
8.4.6 CIP-4
CIP-4 is a large-scale educator-controlled system that is used to clean fermentor systems in the
Large Scale Clinical CHO Cell Culture areas of Building 3. CIP-4 has six-phase sequence in a
wash cycle as shown in the following:
• Phase 1: Pre-Rinse
• Phase 2: Caustic Wash
• Phase 3: Post-Caustic Rinse
• Phase 4: Acid Wash
• Phase 5: Post-Acid Rinse
• Phase 6: Final Rinse
An Air Purge phase occurs between Caustic Wash and Post-Caustic Rinse, Acid Wash and Post-
Acid Rinse, and after Final Rinse. However, this phase does not utilize water and does not affect
our water balance.
Project Report
40
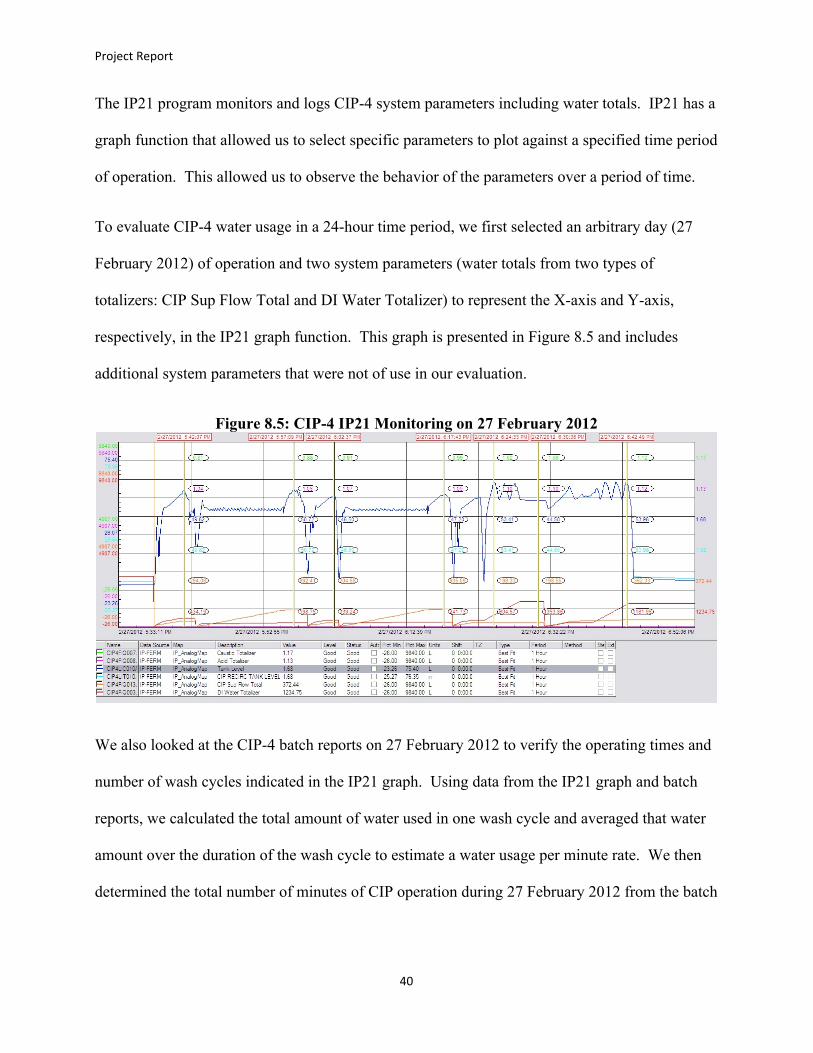
The IP21 program monitors and logs CIP-4 system parameters including water totals. IP21 has a
graph function that allowed us to select specific parameters to plot against a specified time period
of operation. This allowed us to observe the behavior of the parameters over a period of time.
To evaluate CIP-4 water usage in a 24-hour time period, we first selected an arbitrary day (27
February 2012) of operation and two system parameters (water totals from two types of
totalizers: CIP Sup Flow Total and DI Water Totalizer) to represent the X-axis and Y-axis,
respectively, in the IP21 graph function. This graph is presented in Figure 8.5 and includes
additional system parameters that were not of use in our evaluation.
Figure 8.5: CIP-4 IP21 Monitoring on 27 February 2012
We also looked at the CIP-4 batch reports on 27 February 2012 to verify the operating times and
number of wash cycles indicated in the IP21 graph. Using data from the IP21 graph and batch
reports, we calculated the total amount of water used in one wash cycle and averaged that water
amount over the duration of the wash cycle to estimate a water usage per minute rate. We then
determined the total number of minutes of CIP operation during 27 February 2012 from the batch
Project Report
41
reports and subsequently estimated the daily water usage rate of CIP-4 by multiplying the water
usage per minute rate by the total number of minutes of operation during that day.
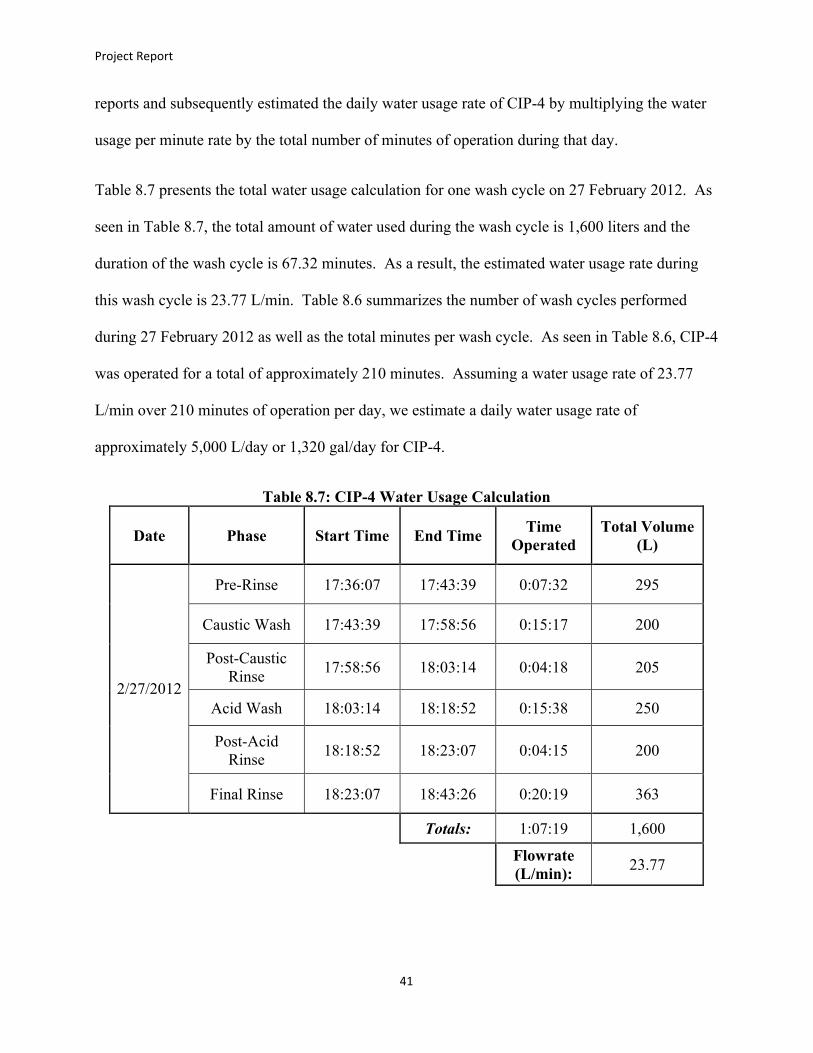
Table 8.7 presents the total water usage calculation for one wash cycle on 27 February 2012. As
seen in Table 8.7, the total amount of water used during the wash cycle is 1,600 liters and the
duration of the wash cycle is 67.32 minutes. As a result, the estimated water usage rate during
this wash cycle is 23.77 L/min. Table 8.6 summarizes the number of wash cycles performed
during 27 February 2012 as well as the total minutes per wash cycle. As seen in Table 8.6, CIP-4
was operated for a total of approximately 210 minutes. Assuming a water usage rate of 23.77
L/min over 210 minutes of operation per day, we estimate a daily water usage rate of
approximately 5,000 L/day or 1,320 gal/day for CIP-4.
Table 8.7: CIP-4 Water Usage Calculation
Date Phase Start Time End Time Time Operated
Total Volume (L)
Pre-Rinse 17:36:07 17:43:39 0:07:32 295
Caustic Wash 17:43:39 17:58:56 0:15:17 200
Post-Caustic Rinse 17:58:56 18:03:14 0:04:18 205
Acid Wash 18:03:14 18:18:52 0:15:38 250
Post-Acid Rinse 18:18:52 18:23:07 0:04:15 200
2/27/2012
Final Rinse 18:23:07 18:43:26 0:20:19 363
Totals: 1:07:19 1,600
Flowrate (L/min): 23.77
Project Report
42
8.4.7 CIP-5
CIP-5 is a large-scale skid that is used to clean a variety of tanks and transfer lines in the CHO
Final Purification areas of Building 3. CIP-5 has six-phase sequence in a wash cycle as shown in
the following:
• Phase 1: Pre-Rinse
• Phase 2: Caustic Wash
• Phase 3: Post-Caustic Rinse
• Phase 4: Acid Wash
• Phase 5: Post-Acid Rinse
• Phase 6: Final Rinse
An Air Purge phase occurs between Caustic Wash and Post-Caustic Rinse, and after Final Rinse.
However, this phase does not utilize water and does not affect our water balance.
The IP21 program monitors and logs CIP-5 system parameters including water tank levels. IP21
has a graph function that allowed us to select a specific parameter to plot against a specified time
period of operation. This allowed us to observe the behavior of the parameter over a period of
time.
To evaluate CIP-5 water usage in a 24-hour time period, we first selected an arbitrary day (26
February 2012) of operation and one system parameter (water tank level [T-1401-1 Level]) to
represent the X-axis and Y-axis, respectively, in the IP21 graph function. This graph is presented
in Figure 8.6. We also looked at the CIP-5 batch reports on 26 February 2012 to verify the
operating times and number of wash cycles indicated in the IP21 graph.
Project Report
43
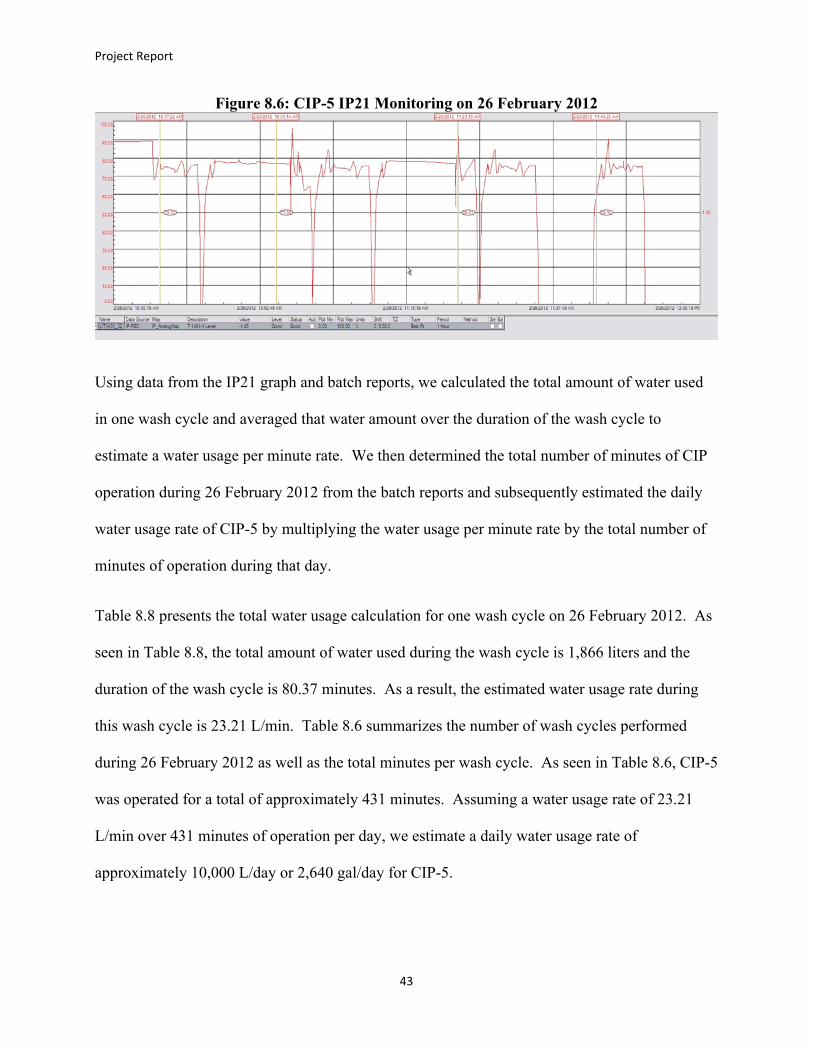
Figure 8.6: CIP-5 IP21 Monitoring on 26 February 2012
Using data from the IP21 graph and batch reports, we calculated the total amount of water used
in one wash cycle and averaged that water amount over the duration of the wash cycle to
estimate a water usage per minute rate. We then determined the total number of minutes of CIP
operation during 26 February 2012 from the batch reports and subsequently estimated the daily
water usage rate of CIP-5 by multiplying the water usage per minute rate by the total number of
minutes of operation during that day.
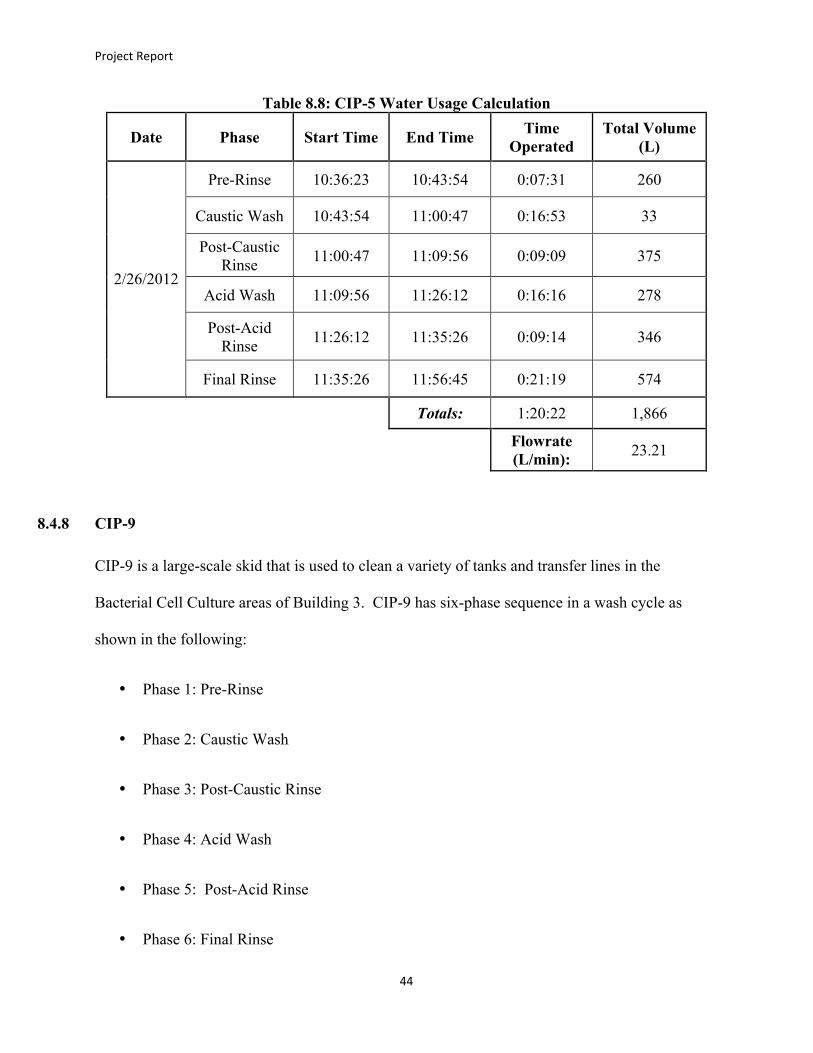
Table 8.8 presents the total water usage calculation for one wash cycle on 26 February 2012. As
seen in Table 8.8, the total amount of water used during the wash cycle is 1,866 liters and the
duration of the wash cycle is 80.37 minutes. As a result, the estimated water usage rate during
this wash cycle is 23.21 L/min. Table 8.6 summarizes the number of wash cycles performed
during 26 February 2012 as well as the total minutes per wash cycle. As seen in Table 8.6, CIP-5
was operated for a total of approximately 431 minutes. Assuming a water usage rate of 23.21
L/min over 431 minutes of operation per day, we estimate a daily water usage rate of
approximately 10,000 L/day or 2,640 gal/day for CIP-5.
Project Report
44
Table 8.8: CIP-5 Water Usage Calculation
Date Phase Start Time End Time Time Operated
Total Volume (L)
Pre-Rinse 10:36:23 10:43:54 0:07:31 260
Caustic Wash 10:43:54 11:00:47 0:16:53 33
Post-Caustic Rinse 11:00:47 11:09:56 0:09:09 375
Acid Wash 11:09:56 11:26:12 0:16:16 278
Post-Acid Rinse 11:26:12 11:35:26 0:09:14 346
2/26/2012
Final Rinse 11:35:26 11:56:45 0:21:19 574
Totals: 1:20:22 1,866
Flowrate (L/min): 23.21
8.4.8 CIP-9
CIP-9 is a large-scale skid that is used to clean a variety of tanks and transfer lines in the
Bacterial Cell Culture areas of Building 3. CIP-9 has six-phase sequence in a wash cycle as
shown in the following:
• Phase 1: Pre-Rinse
• Phase 2: Caustic Wash
• Phase 3: Post-Caustic Rinse
• Phase 4: Acid Wash
• Phase 5: Post-Acid Rinse
• Phase 6: Final Rinse
Project Report
45
An Air Purge phase occurs between the Pre-Rinse phase and subsequent phases. The main
purpose of this Air Purge phase is to reduce the amount of pre-rinse water used and to drain
liquid holdup in the system and equipment/lines and reduce dilution of chemicals in the
subsequent phases. However, this phase does not utilize water and does not affect our water
balance.
There were no appropriate parameters found for CIP-9 in the IP21 program to assist our
calculation of total water usage. As such, the water usage rate estimation for CIP-9 is based on
similar CIP systems in terms of size and/or usage. There are six other CIPs that fit these criteria
and they are CIP-1, CIP-2, CIP-3, CIP-4, CIP-5, and CIP-12. Taking the average daily water
usage rate of these six CIP systems gives an estimated daily water usage rate of 25,400 L/day or
6,700 gal/day for CIP-9.
8.4.9 CIP-10
CIP-10 is a smaller-scale skid that is used to clean a variety of tanks and process pipelines in the
Small Scale Clinical CHO Purification areas of Building 3. CIP-10 has six-phase sequence in a
wash cycle as shown in the following:
• Phase 1: Pre-Rinse
• Phase 2: Caustic Wash
• Phase 3: Post-Caustic Rinse
• Phase 4: Acid Wash
• Phase 5: Post-Acid Rinse
• Phase 6: Final Rinse
Project Report
46
An Air Purge phase occurs between the Pre-Rinse phase and subsequent phases. The main
purpose of this Air Purge phase is to reduce the amount of pre-rinse water used and to drain
liquid holdup in the system and equipment/lines and reduce dilution of chemicals in the
subsequent phases. However, this phase does not utilize water and does not affect our water
balance.
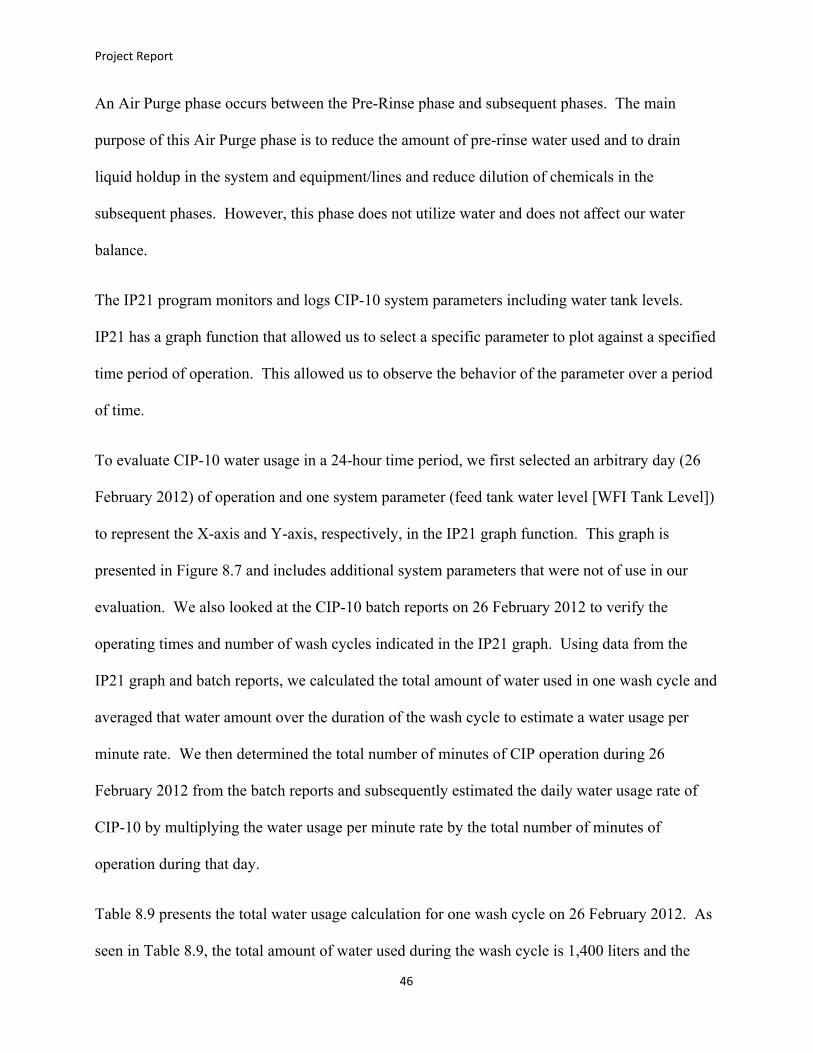
The IP21 program monitors and logs CIP-10 system parameters including water tank levels.
IP21 has a graph function that allowed us to select a specific parameter to plot against a specified
time period of operation. This allowed us to observe the behavior of the parameter over a period
of time.
To evaluate CIP-10 water usage in a 24-hour time period, we first selected an arbitrary day (26
February 2012) of operation and one system parameter (feed tank water level [WFI Tank Level])
to represent the X-axis and Y-axis, respectively, in the IP21 graph function. This graph is
presented in Figure 8.7 and includes additional system parameters that were not of use in our
evaluation. We also looked at the CIP-10 batch reports on 26 February 2012 to verify the
operating times and number of wash cycles indicated in the IP21 graph. Using data from the
IP21 graph and batch reports, we calculated the total amount of water used in one wash cycle and
averaged that water amount over the duration of the wash cycle to estimate a water usage per
minute rate. We then determined the total number of minutes of CIP operation during 26
February 2012 from the batch reports and subsequently estimated the daily water usage rate of
CIP-10 by multiplying the water usage per minute rate by the total number of minutes of
operation during that day.
Table 8.9 presents the total water usage calculation for one wash cycle on 26 February 2012. As
seen in Table 8.9, the total amount of water used during the wash cycle is 1,400 liters and the
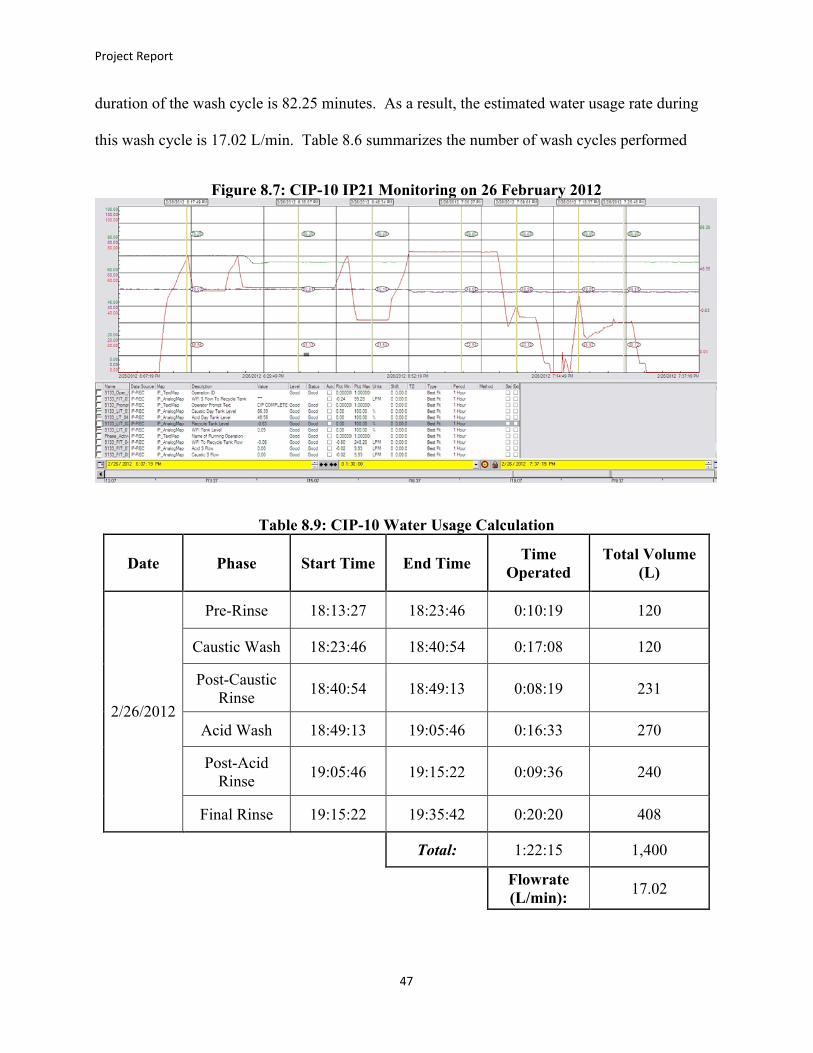
Project Report
47
duration of the wash cycle is 82.25 minutes. As a result, the estimated water usage rate during
this wash cycle is 17.02 L/min. Table 8.6 summarizes the number of wash cycles performed
Figure 8.7: CIP-10 IP21 Monitoring on 26 February 2012
Table 8.9: CIP-10 Water Usage Calculation
Date Phase Start Time End Time Time Operated
Total Volume (L)
Pre-Rinse 18:13:27 18:23:46 0:10:19 120
Caustic Wash 18:23:46 18:40:54 0:17:08 120
Post-Caustic Rinse 18:40:54 18:49:13 0:08:19 231
Acid Wash 18:49:13 19:05:46 0:16:33 270
Post-Acid Rinse 19:05:46 19:15:22 0:09:36 240
2/26/2012
Final Rinse 19:15:22 19:35:42 0:20:20 408
Total: 1:22:15 1,400
Flowrate (L/min): 17.02

Project Report
48
during 26 February 2012 as well as the total minutes per wash cycle. As seen in Table 8.6, CIP-
10 was operated for a total of approximately 165 minutes. Assuming a water usage rate of 17.02
L/min over 165 minutes of operation per day, we estimate a daily water usage rate of
approximately 2,810 L/day or 750 gal/day for CIP-10.
8.4.10 CIP-12
CIP-12 is a large-scale skid that is used to clean a variety of tanks and transfer lines in the
Bacterial Purification areas of Building 3. CIP-12 has 6 phase sequence in a wash cycle as
shown in the following:
• Phase 1: Pre-Rinse
• Phase 2: Caustic Wash
• Phase 3: Post-Caustic Rinse
• Phase 4: Acid Wash
• Phase 5: Post-Acid Rinse
• Phase 6: Final Rinse
An Air Purge phase occurs between the Pre-Rinse phase and subsequent phases. The main
purpose of this Air Purge phase is to reduce the amount of pre-rinse water used and to drain
liquid holdup in the system and equipment/lines and reduce dilution of chemicals in the
subsequent phases. However, this phase does not utilize water and does not affect our water
balance.
The IP21 program monitors and logs CIP-12 system parameters including water tank levels.
IP21 has a graph function that allowed us to select a specific parameter to plot against a specified
time period of operation. This allowed us to observe the behavior of the parameter over a period
of time.

Project Report
49
To evaluate CIP-12 water usage in a 24-hour time period, we first selected an arbitrary day (26
February 2012) of operation and one system parameter (feed tank water level [DIW/WFI Tank
Level]) to represent the X-axis and Y-axis, respectively, in the IP21 graph function. This graph
is presented in Figure 8.8 and includes additional system parameters that were not of use in our
evaluation. We also looked at the CIP-12 batch reports on 26 February 2012 to verify the
operating times and number of wash cycles indicated in the IP21 graph. Using data from the
IP21 graph and batch reports, we calculated the total amount of water used in one wash cycle and
averaged that water amount over the duration of the wash cycle to estimate a water usage per
minute rate. We then determined the total number of minutes of CIP operation during 26
February 2012 from the batch reports and subsequently estimated the daily water usage rate of
CIP-12 by multiplying the water usage per minute rate by the total number of minutes of
operation during that day.
Table 8.10 presents the total water usage calculation for one wash cycle on 26 February 2012.
As seen in Table 8.10, the total amount of water used during the wash cycle is 4,700 liters and
the duration of the wash cycle is 144.90 minutes. As a result, the estimated water usage rate
during.
Figure 8.8: CIP-12 IP21 Monitoring on 26 February 2012

Project Report
50
Table 8.10: CIP-12 Water Usage Calculation
Date Phase Start Time End Time Time Operated
Total Volume (L)
Pre-Rinse 0:59:13 1:09:49 0:10:36 1035
Caustic Wash 1:09:49 1:28:33 0:18:44 423
Post-Caustic Rinse 1:28:33 1:37:25 0:08:52 963
Acid Wash 1:37:25 1:55:38 0:18:13 423
Post-Acid Rinse 1:55:38 2:07:13 0:11:35 1,319
2/26/2012
Final Rinse 2:07:13 3:24:07 1:16:54 486
Total: 2:24:54 4,700
Flowrate (L/min): 32.44
this wash cycle is 32.44 L/min. Table 8.6 summarizes the number of wash cycles performed
during 26 February 2012 as well as the total minutes per wash cycle. As seen in Table 8.6, CIP-
12 was operated for a total of approximately 841 minutes. Assuming a water usage rate of 32.44
L/min over 841 minutes of operation per day, we estimate a daily water usage rate of
approximately 28,000 L/day or 7,400 gal/day for CIP-12.
8.4.11 T-7421
T-7421 is an automated CIP system used to clean large-scale CHO centrifuges in Building 3. T-
7421 has six phase sequence in a wash cycle as shown in the following:
• Phase 1: Pre-Rinse
• Phase 2: Caustic Wash
• Phase 3: Post-Caustic Rinse
• Phase 4: Acid Wash
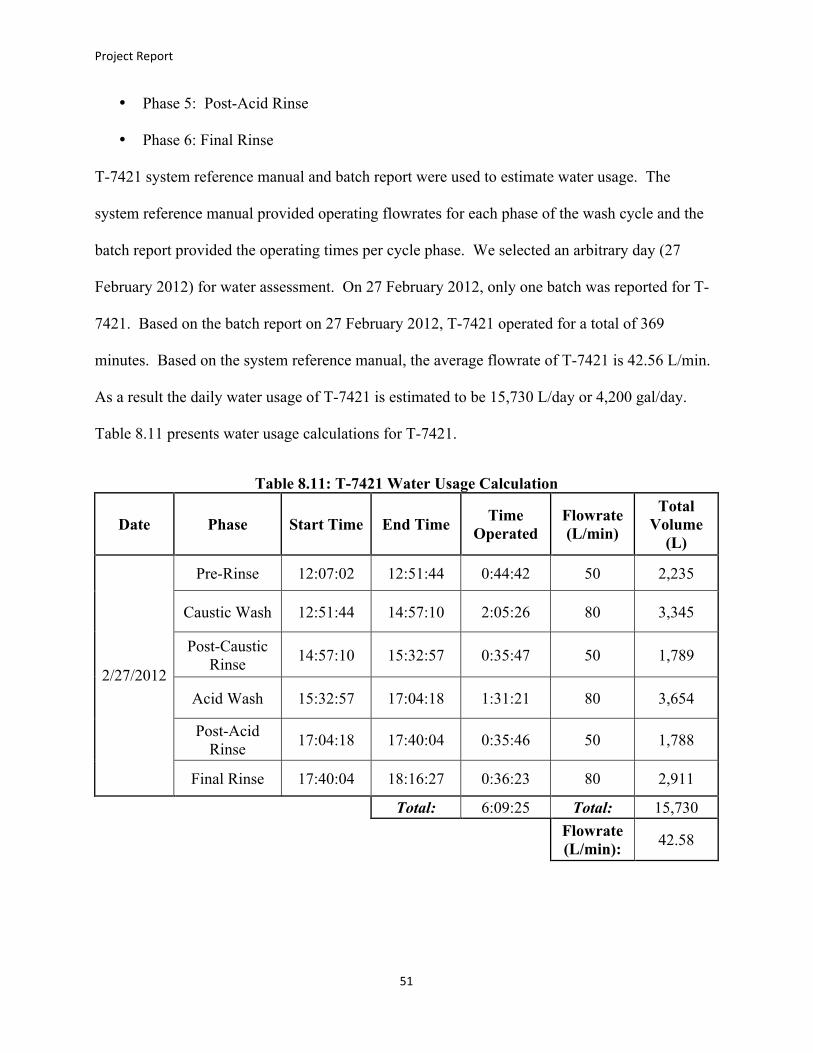
Project Report
51
• Phase 5: Post-Acid Rinse
• Phase 6: Final Rinse
T-7421 system reference manual and batch report were used to estimate water usage. The
system reference manual provided operating flowrates for each phase of the wash cycle and the
batch report provided the operating times per cycle phase. We selected an arbitrary day (27
February 2012) for water assessment. On 27 February 2012, only one batch was reported for T-
7421. Based on the batch report on 27 February 2012, T-7421 operated for a total of 369
minutes. Based on the system reference manual, the average flowrate of T-7421 is 42.56 L/min.
As a result the daily water usage of T-7421 is estimated to be 15,730 L/day or 4,200 gal/day.
Table 8.11 presents water usage calculations for T-7421.
Table 8.11: T-7421 Water Usage Calculation
Date Phase Start Time End Time Time Operated
Flowrate (L/min)
Total Volume
(L)
Pre-Rinse 12:07:02 12:51:44 0:44:42 50 2,235
Caustic Wash 12:51:44 14:57:10 2:05:26 80 3,345
Post-Caustic Rinse 14:57:10 15:32:57 0:35:47 50 1,789
Acid Wash 15:32:57 17:04:18 1:31:21 80 3,654
Post-Acid Rinse 17:04:18 17:40:04 0:35:46 50 1,788
2/27/2012
Final Rinse 17:40:04 18:16:27 0:36:23 80 2,911
Total: 6:09:25 Total: 15,730
Flowrate (L/min): 42.58
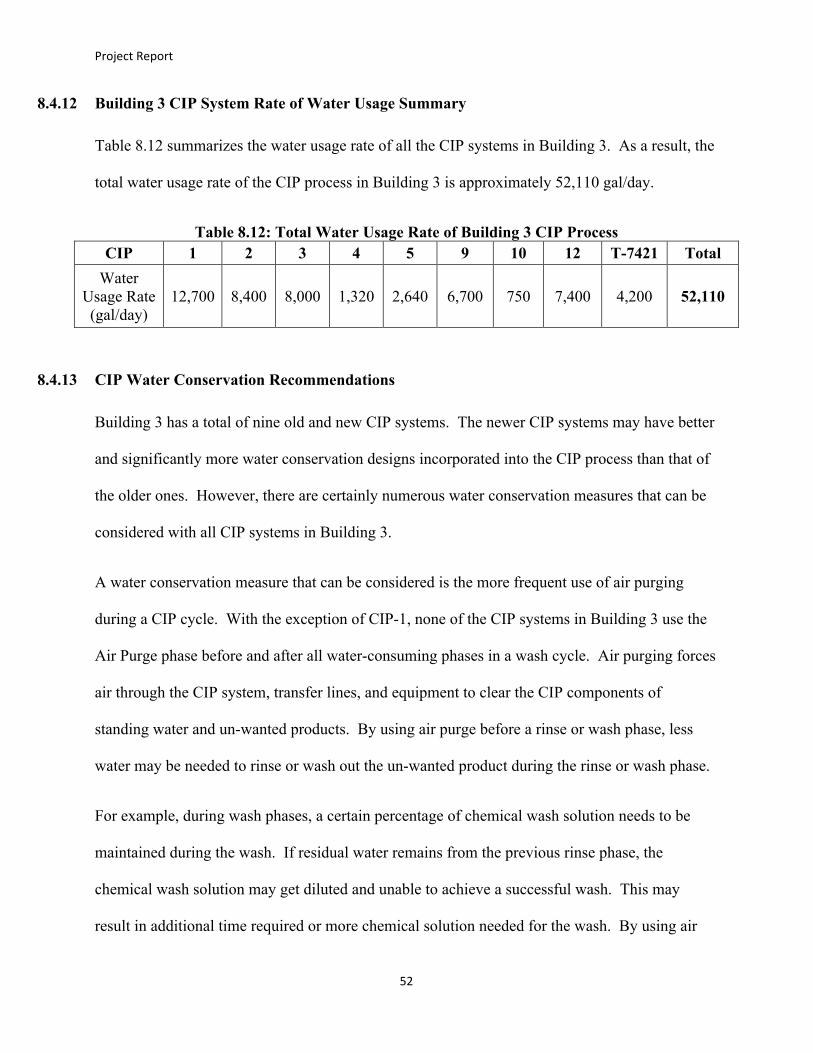
Project Report
52
8.4.12 Building 3 CIP System Rate of Water Usage Summary
Table 8.12 summarizes the water usage rate of all the CIP systems in Building 3. As a result, the
total water usage rate of the CIP process in Building 3 is approximately 52,110 gal/day.
Table 8.12: Total Water Usage Rate of Building 3 CIP Process CIP 1 2 3 4 5 9 10 12 T-7421 Total
Water Usage Rate (gal/day)
12,700 8,400 8,000 1,320 2,640 6,700 750 7,400 4,200 52,110
8.4.13 CIP Water Conservation Recommendations
Building 3 has a total of nine old and new CIP systems. The newer CIP systems may have better
and significantly more water conservation designs incorporated into the CIP process than that of
the older ones. However, there are certainly numerous water conservation measures that can be
considered with all CIP systems in Building 3.
A water conservation measure that can be considered is the more frequent use of air purging
during a CIP cycle. With the exception of CIP-1, none of the CIP systems in Building 3 use the
Air Purge phase before and after all water-consuming phases in a wash cycle. Air purging forces
air through the CIP system, transfer lines, and equipment to clear the CIP components of
standing water and un-wanted products. By using air purge before a rinse or wash phase, less
water may be needed to rinse or wash out the un-wanted product during the rinse or wash phase.
For example, during wash phases, a certain percentage of chemical wash solution needs to be
maintained during the wash. If residual water remains from the previous rinse phase, the
chemical wash solution may get diluted and unable to achieve a successful wash. This may
result in additional time required or more chemical solution needed for the wash. By using air
Project Report
53
purge to clear the system of residual water in between the rinse and wash phases, more efficient
use of water may be achieved during the wash phase.
Another water conservation measure that can be considered is the use of ozone sanitation. This
innovative technology is similar to using air to clean the system in the air purging phase except
the gas used is ozone. Also, unlike air purging in which air is forced through the system quickly,
ozone is used to fill the system and allowed longer time for contact with contaminants in the
inner surface of the system. Ozone is a disinfectant in the form of gas and can destroy
contaminants within the system. As such, ozone can replace some hot water cycles, which, as a
result, may save energy cost and reduce water usage. Ozone can also dissolve in water and can
be used in combination with rinse/wash phases. This may reduce the time needed to clean
contaminants allowing for a more efficient process and water reduction (Ozone Solutions, 2012).
8.5 STEAM-IN-PLACE SYSTEM
8.5.1 Steam-in-Place System Description
The steam-in-place (SIP) systems in Building 3 are one of the processing systems selected for
our water balance evaluation due to its close association with the CIP process. However, unlike
the CIP process, the SIP does not consume a large amount of water. Nevertheless, it is still
useful to estimate the water consumption rate of SIP as it is a water consuming process. SIP is a
process by which the entire processing equipment is sterilized-in-place by exposing bacteria to
saturated steam without having to disassemble or manipulate equipment that might compromise
the integrity of the downstream areas of the equipment. The entire processing equipment may
include vessels, valves, process lines, and filter assemblies (Millipore, 2003). This saturated
steam creates a very high temperature and pressure within the system to kill the bacteria. SIP
Project Report
54
involves the use of specific components such as steam traps, pressure regulators, and sterilizing
vent filters to evacuate air and condensate, and to cool down, dry, and maintain the sterility of the
equipment following sterilization (Millipore, 2003). Typically, an SIP process cycle occurs
immediately after a CIP process cycle during sterilization of equipment. Therefore, the SIP
concept is similar to that of CIP. The only difference is CIP uses mainly water for sterilization
and SIP uses steam.
8.5.2 SIP Data Collection Method
In our attempt to find information on SIP processes in Building 3, we encountered some
constraints that prevented us from obtaining information and data for the existing SIP systems in
Building 3. As such, we are only able to rely on published data and assumptions for performing
our water balance on the SIP systems in Building 3. According to the 2003 Principles of Steam-
In-Place produced by Millipore Corporation (Millipore, 2003), for an SIP cycle operating at a
temperature of 121°C, the inlet steam is generally supplied in a range of 1.2 to 1.5 barg and the
pipeline steam velocity should be in the range of 20 to 30 meters per second (m/s). Using Table
8.12 extracted from Table B of Principles of Steam-In-Place and the assumption that the piping
size for all SIP systems in Building 3 is approximately 40 millimeters (mm), we estimate a steam
mass flowrate of 144 kilograms per hour (kg/h) per SIP system. This estimation is described in
detail in the following section.
8.5.3 SIP Water Usage Estimation
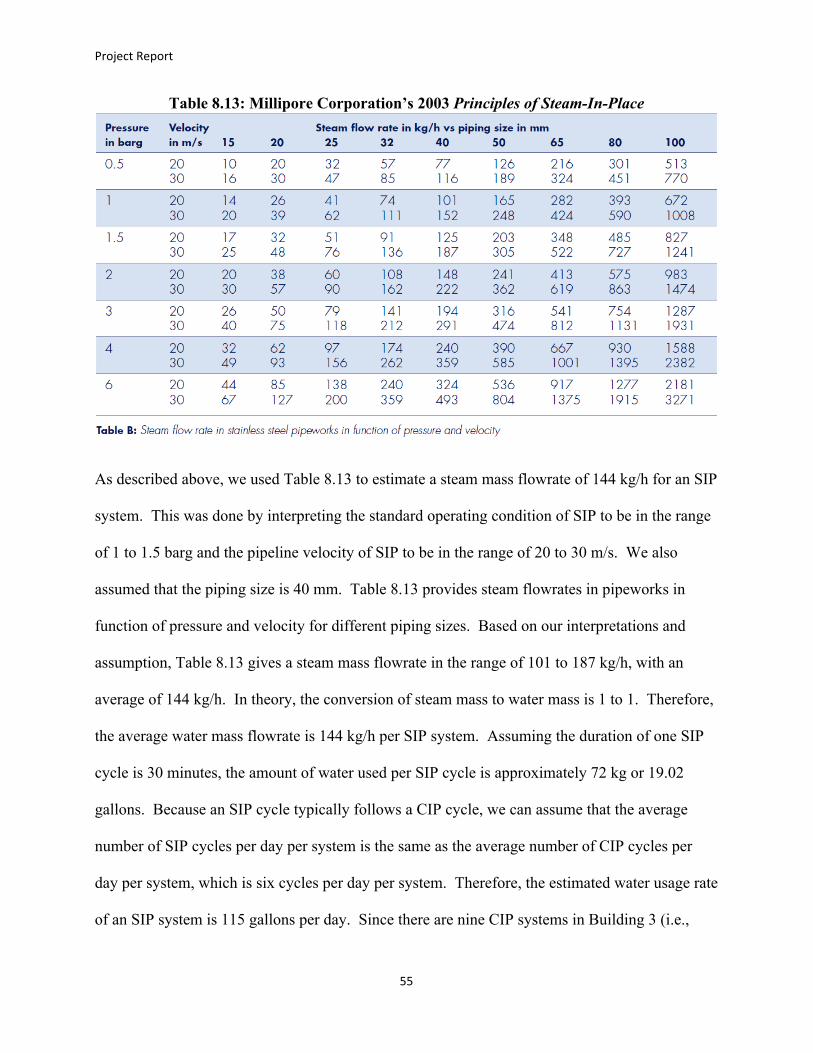
Project Report
55
Table 8.13: Millipore Corporation’s 2003 Principles of Steam-In-Place
As described above, we used Table 8.13 to estimate a steam mass flowrate of 144 kg/h for an SIP
system. This was done by interpreting the standard operating condition of SIP to be in the range
of 1 to 1.5 barg and the pipeline velocity of SIP to be in the range of 20 to 30 m/s. We also
assumed that the piping size is 40 mm. Table 8.13 provides steam flowrates in pipeworks in
function of pressure and velocity for different piping sizes. Based on our interpretations and
assumption, Table 8.13 gives a steam mass flowrate in the range of 101 to 187 kg/h, with an
average of 144 kg/h. In theory, the conversion of steam mass to water mass is 1 to 1. Therefore,
the average water mass flowrate is 144 kg/h per SIP system. Assuming the duration of one SIP
cycle is 30 minutes, the amount of water used per SIP cycle is approximately 72 kg or 19.02
gallons. Because an SIP cycle typically follows a CIP cycle, we can assume that the average
number of SIP cycles per day per system is the same as the average number of CIP cycles per
day per system, which is six cycles per day per system. Therefore, the estimated water usage rate
of an SIP system is 115 gallons per day. Since there are nine CIP systems in Building 3 (i.e.,
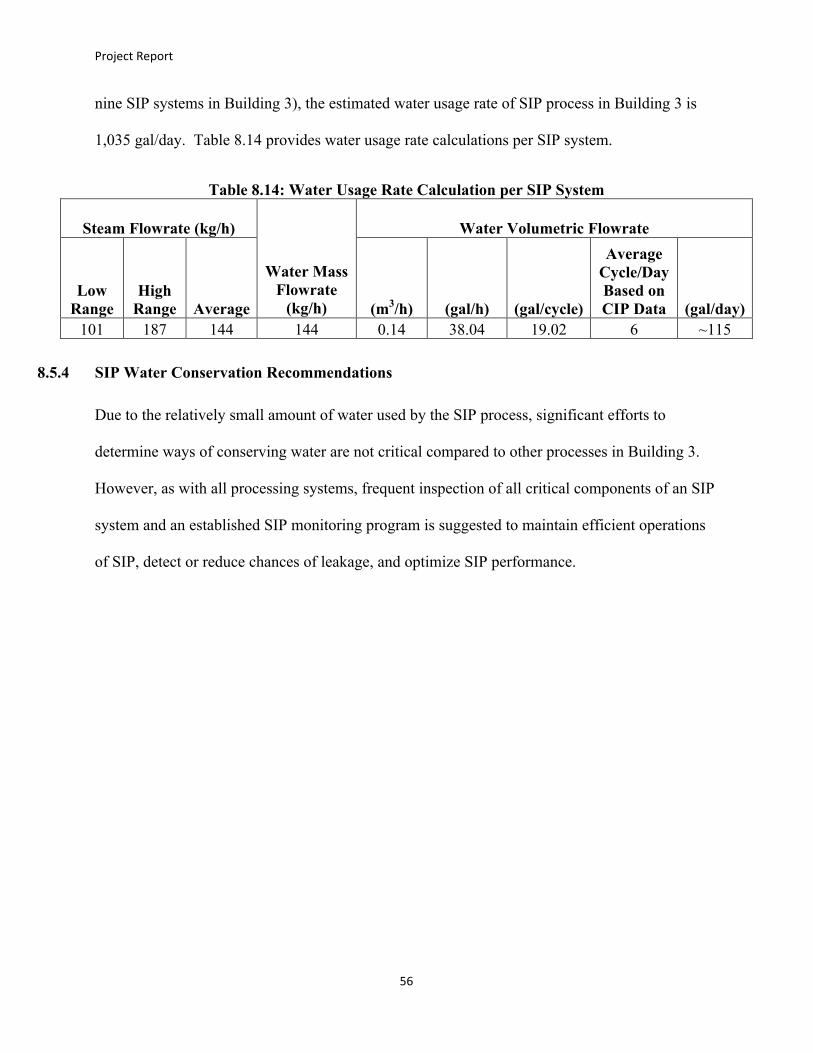
Project Report
56
nine SIP systems in Building 3), the estimated water usage rate of SIP process in Building 3 is
1,035 gal/day. Table 8.14 provides water usage rate calculations per SIP system.
Table 8.14: Water Usage Rate Calculation per SIP System
Steam Flowrate (kg/h) Water Volumetric Flowrate
Low Range
High Range Average
Water Mass Flowrate
(kg/h) (m3/h) (gal/h) (gal/cycle)
Average Cycle/Day Based on CIP Data (gal/day)
101 187 144 144 0.14 38.04 19.02 6 ~115
8.5.4 SIP Water Conservation Recommendations
Due to the relatively small amount of water used by the SIP process, significant efforts to
determine ways of conserving water are not critical compared to other processes in Building 3.
However, as with all processing systems, frequent inspection of all critical components of an SIP
system and an established SIP monitoring program is suggested to maintain efficient operations
of SIP, detect or reduce chances of leakage, and optimize SIP performance.
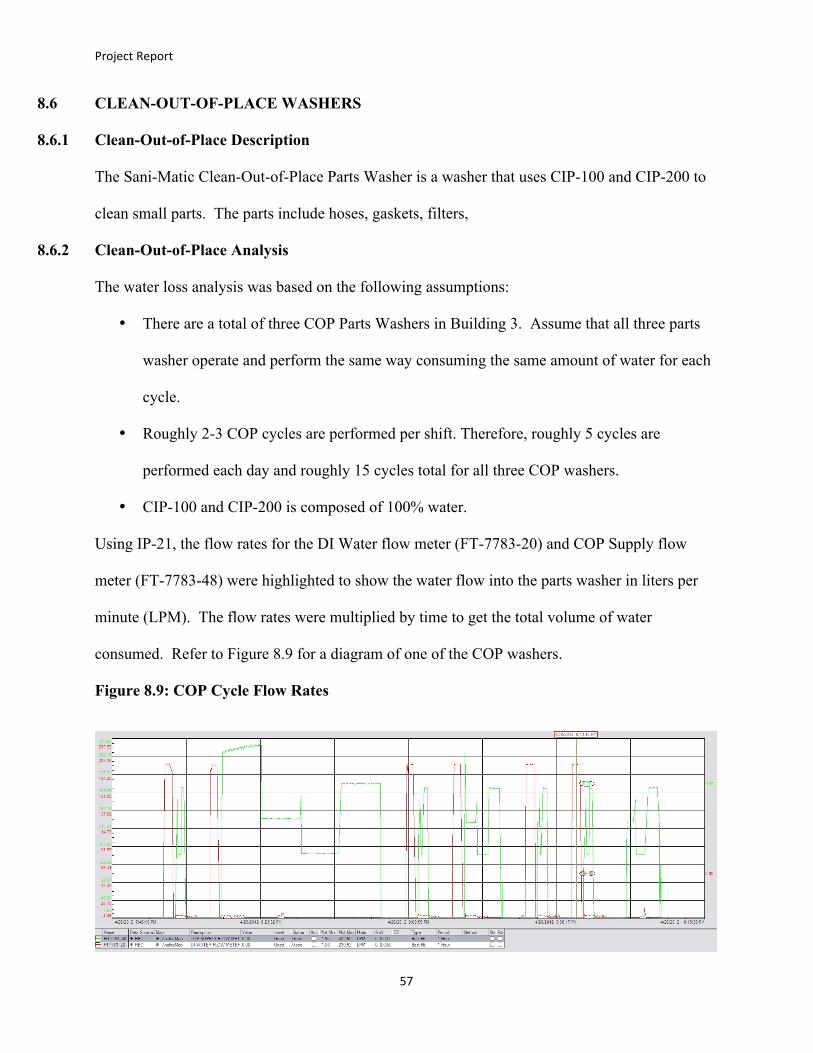
Project Report
57
8.6 CLEAN-OUT-OF-PLACE WASHERS
8.6.1 Clean-Out-of-Place Description
The Sani-Matic Clean-Out-of-Place Parts Washer is a washer that uses CIP-100 and CIP-200 to
clean small parts. The parts include hoses, gaskets, filters,
8.6.2 Clean-Out-of-Place Analysis
The water loss analysis was based on the following assumptions:
• There are a total of three COP Parts Washers in Building 3. Assume that all three parts
washer operate and perform the same way consuming the same amount of water for each
cycle.
• Roughly 2-3 COP cycles are performed per shift. Therefore, roughly 5 cycles are
performed each day and roughly 15 cycles total for all three COP washers.
• CIP-100 and CIP-200 is composed of 100% water.
Using IP-21, the flow rates for the DI Water flow meter (FT-7783-20) and COP Supply flow
meter (FT-7783-48) were highlighted to show the water flow into the parts washer in liters per
minute (LPM). The flow rates were multiplied by time to get the total volume of water
consumed. Refer to Figure 8.9 for a diagram of one of the COP washers.
Figure 8.9: COP Cycle Flow Rates
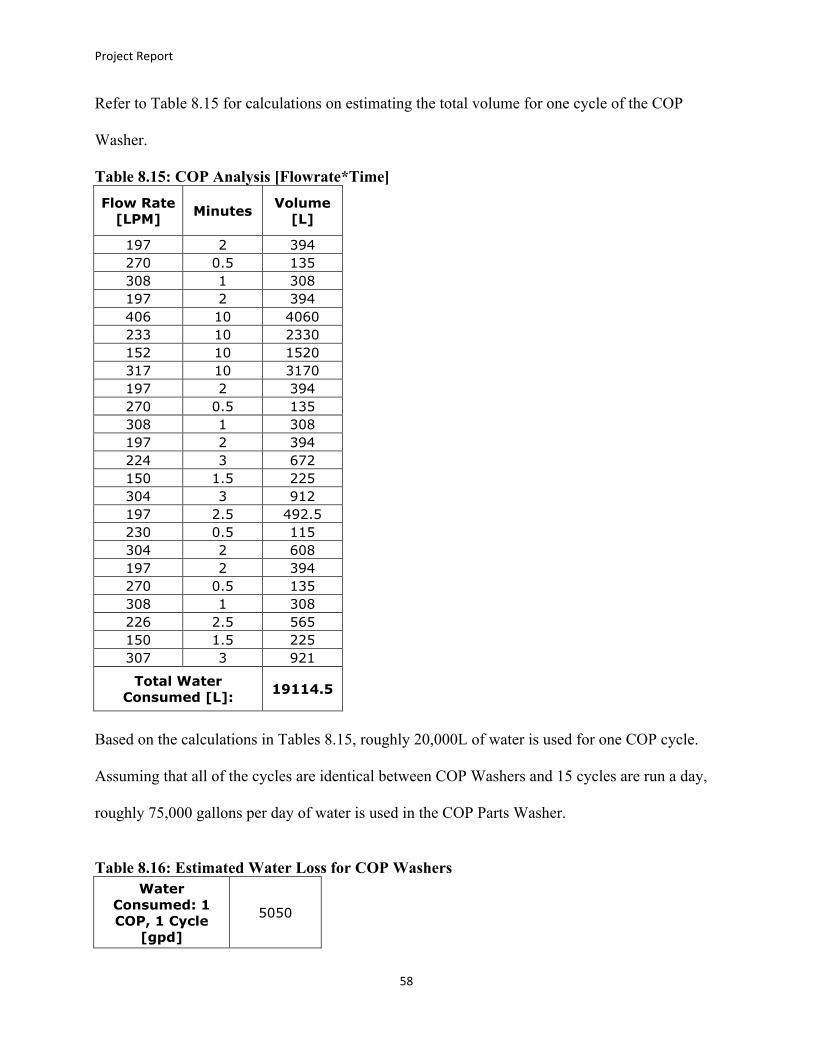
Project Report
58
Refer to Table 8.15 for calculations on estimating the total volume for one cycle of the COP
Washer.
Table 8.15: COP Analysis [Flowrate*Time] Flow Rate
[LPM] Minutes Volume [L]
197 2 394 270 0.5 135 308 1 308 197 2 394 406 10 4060 233 10 2330 152 10 1520 317 10 3170 197 2 394 270 0.5 135 308 1 308 197 2 394 224 3 672 150 1.5 225 304 3 912 197 2.5 492.5 230 0.5 115 304 2 608 197 2 394 270 0.5 135 308 1 308 226 2.5 565 150 1.5 225 307 3 921
Total Water Consumed [L]: 19114.5
Based on the calculations in Tables 8.15, roughly 20,000L of water is used for one COP cycle.
Assuming that all of the cycles are identical between COP Washers and 15 cycles are run a day,
roughly 75,000 gallons per day of water is used in the COP Parts Washer.
Table 8.16: Estimated Water Loss for COP Washers
Water Consumed: 1 COP, 1 Cycle
[gpd]
5050
Project Report
59
8.6.3 COP Washer Recommendations
These systems are already run under a fully automated program that has been validated to ensure
efficiency of cleaning.
(1) Ensure the COP Parts Washer is loaded to it’s maximum capacity for each COP
cycle for efficiency.
(2) Evaluate how many cycles are needed based on availability of parts.
Project Report
60
8.7 PRODUCTION AND OPERATIONS
8.7.1 Introduction
The Production and Operations system provides the water used in manufacturing operations.
This includes upstream and downstream processing of manufacturing. Upstream includes either
cell culture production or fermentation activities. Downstream processing includes protein
purification activities. The South San Francisco plant currently manufactures both Commercial
and Clinical Products.
The South San Francisco plant is built for both production of clinical and commercial product
using E.coli or Chinese Hamster Ovary (CHO) host cells. The plant is operational 365 days of
the year, 24 hours as day. When the plant is producing a product, that is called a product
campaign. The campaign will follow the same steps from beginning to end until the desired
amount of product is produced. Each batch from beginning to end is called a run. A campaign
may have multiple runs. For instance, a clinical campaign may have three to four runs. A
commercial campaign may have 12-14 runs.
For the CHO host cells, a product can be run at a 2000 Liter (2K) scale or a 12000 Liter (12K)
scale. The largest tank at the SSF Plant is a 12K Fermentor. For Bacterial or E.coli cells, the
product can be run at a 1000 Liter (1K) scale. The plant is typically scheduled to run one 12K
scale campaign, one CHO 2K scale, and one Bacterial 1K scale. However, under special
circumstances, the SSF site does have the capacity to run two 12K or two 2K fermentors
simultaneously if necessary. Typically for CHO campaigns, there are only two campaigns
running at one time due to the capacity of the plant and its resources.

Project Report
61
The following assessment was performed to evaluate the water consumption from the
manufacturing operations. These did not include any cleaning of equipment, which was
evaluated as a separate section. All manufacturing operations included preparation of operations,
actual operations, and closing of operations.
The water balance assessment was calculated using the volume of all of the components that
went into the operation and the final volume of the product. An in depth analysis went into all
the buffer solutions requiring water that went into operation of a product using the Bill of
Materials (BOM). All the inputs together gives the total volume used for one run of one
campaign. The output is the average of the final volume for each of the campaigns. All other
material that was used in the process and not in the final product was discarded down the drain to
the neutralization system or through the hazardous waste program.
There are a couple of assumptions that were made in the calculation of this assessment:
(1) Buffers are composed of 100% water.
(2) Only the three most recent clinical campaigns and the most recent commercial campaign
were assessed. The water usage can change from campaign to campaign due to the
change in process and operations.
(3) Variability between runs: Final bulk volumes were averaged for the entire campaign.
Most of these are concentrated bulk, and less percent water.
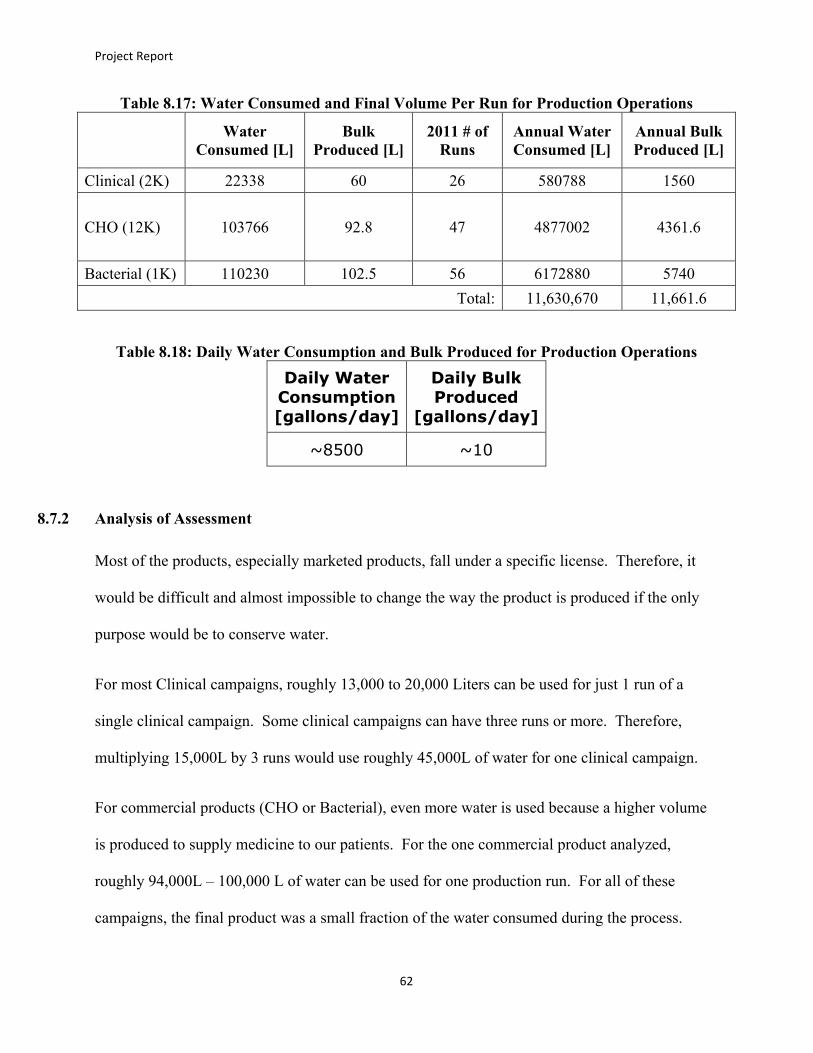
Project Report
62
Table 8.17: Water Consumed and Final Volume Per Run for Production Operations
Water Consumed [L]
Bulk Produced [L]
2011 # of Runs
Annual Water Consumed [L]
Annual Bulk Produced [L]
Clinical (2K) 22338 60 26 580788 1560
CHO (12K) 103766 92.8 47 4877002 4361.6
Bacterial (1K) 110230 102.5 56 6172880 5740 Total: 11,630,670 11,661.6
Table 8.18: Daily Water Consumption and Bulk Produced for Production Operations
Daily Water Consumption [gallons/day]
Daily Bulk Produced
[gallons/day]
~8500 ~10
8.7.2 Analysis of Assessment
Most of the products, especially marketed products, fall under a specific license. Therefore, it
would be difficult and almost impossible to change the way the product is produced if the only
purpose would be to conserve water.
For most Clinical campaigns, roughly 13,000 to 20,000 Liters can be used for just 1 run of a
single clinical campaign. Some clinical campaigns can have three runs or more. Therefore,
multiplying 15,000L by 3 runs would use roughly 45,000L of water for one clinical campaign.
For commercial products (CHO or Bacterial), even more water is used because a higher volume
is produced to supply medicine to our patients. For the one commercial product analyzed,
roughly 94,000L – 100,000 L of water can be used for one production run. For all of these
campaigns, the final product was a small fraction of the water consumed during the process.
Project Report
63
8.7.3 Recommendations for Water Conservation
• Buffer Strategy: Currently, buffers that are produced from raw materials are batched before
an operation will take place. There is a calculated “required volume” of buffer that will be
used for that specific operation. However, most of the campaign coordinators over-
estimate this value. It is better to have extra buffer than to hold operations to batch
additional buffer. Our recommendation is to perform more buffer strategy assessments in
the process development side or compare the batch sizes to previous campaigns to see if a
smaller batch size can be implemented.
o For example, if historical data shows that the required volume for an operation took
700L of buffer solution and recipes require batching 1000L of buffer, then the batch
size should be reduced to roughly 800L. The extra 100L could allow for some
variability between required volumes between runs. Some things that would need to
be taken into consideration during this calculation is volume required for priming the
skids, if this buffer is used for other steps, etc.
• Ability to Batch Smaller Quantities: Many of the buffer mix tanks used for batching buffers
are fairly large. However, for some steps, only a small volume of buffer is required, but
since there are no validated small mix tanks available in the B3 Manufacturing Plant, a
large volume of the buffer is batched and discarded. For example, one of the steps requires
Conditioning Buffer. However, historical data shows that less than 50mL is used for this
step. However, the smallest batch size is 30L. This means that ~29L of the conditioning
buffer is discarded for each run of the campaign. This can occur for 3-4 runs of one
product campaign and multiple products over one year.

Project Report
64
• Water Conservation Promotion Campaign: When asking a lot of the technicians in the
plant, they didn’t even know how much the price of WFI was in the plant. This water is
taken from the SSF City Water and undergoes a series of purification steps in the B3 Yard
where it is refined to WFI-grade quality.
• Reduction of Human Error: Many times there are instances or discrepancies where an entire
batch of buffer is dumped because a technician inadvertently added too much raw material
or the wrong buffer was used for the wrong operations so a new buffer needed to be
batched. If we find ways to prevent this from occurring and have more controls to prevent
human error, we can batch less buffer and use less water.
8.7.4 Recommendations for Further Calculations
• Look into all of the Commercial Campaigns carefully and assess each one for water usage.
This includes campaigns with CHO and E. coli host cells.
• Look into the buffer components of each solution to assess how much water was used to
make that buffer.
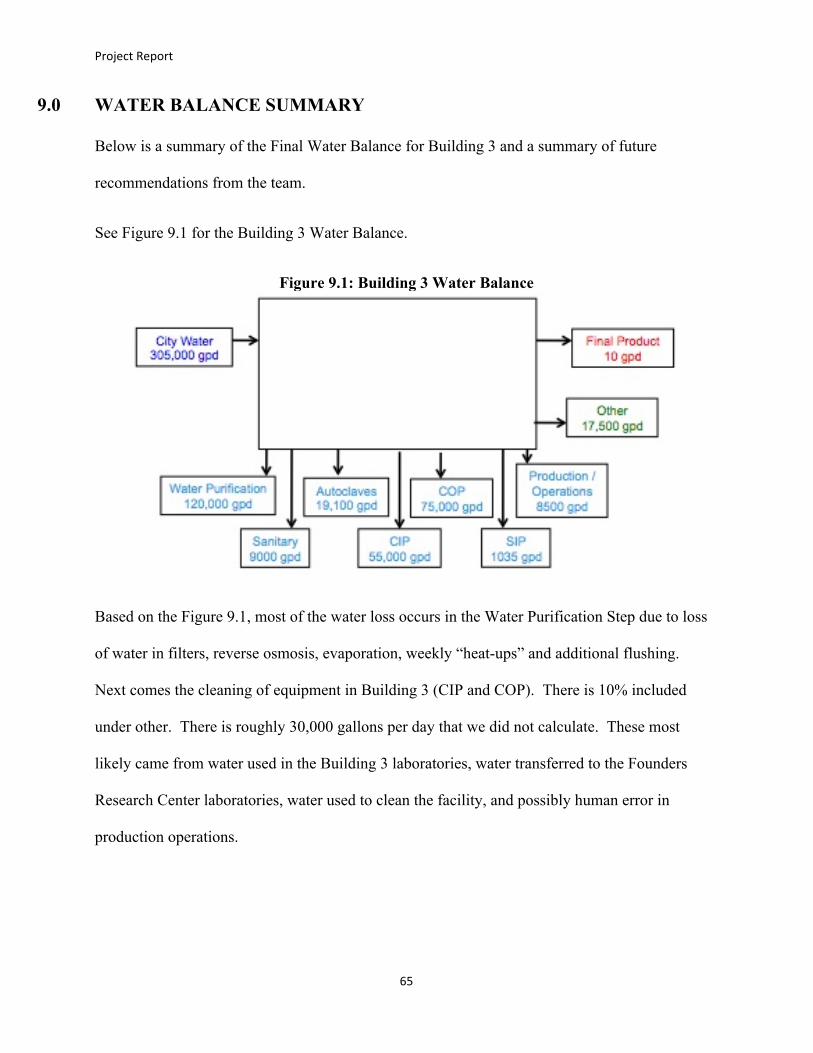
Project Report
65
9.0 WATER BALANCE SUMMARY
Below is a summary of the Final Water Balance for Building 3 and a summary of future
recommendations from the team.
See Figure 9.1 for the Building 3 Water Balance.
Figure 9.1: Building 3 Water Balance
Based on the Figure 9.1, most of the water loss occurs in the Water Purification Step due to loss
of water in filters, reverse osmosis, evaporation, weekly “heat-ups” and additional flushing.
Next comes the cleaning of equipment in Building 3 (CIP and COP). There is 10% included
under other. There is roughly 30,000 gallons per day that we did not calculate. These most
likely came from water used in the Building 3 laboratories, water transferred to the Founders
Research Center laboratories, water used to clean the facility, and possibly human error in
production operations.
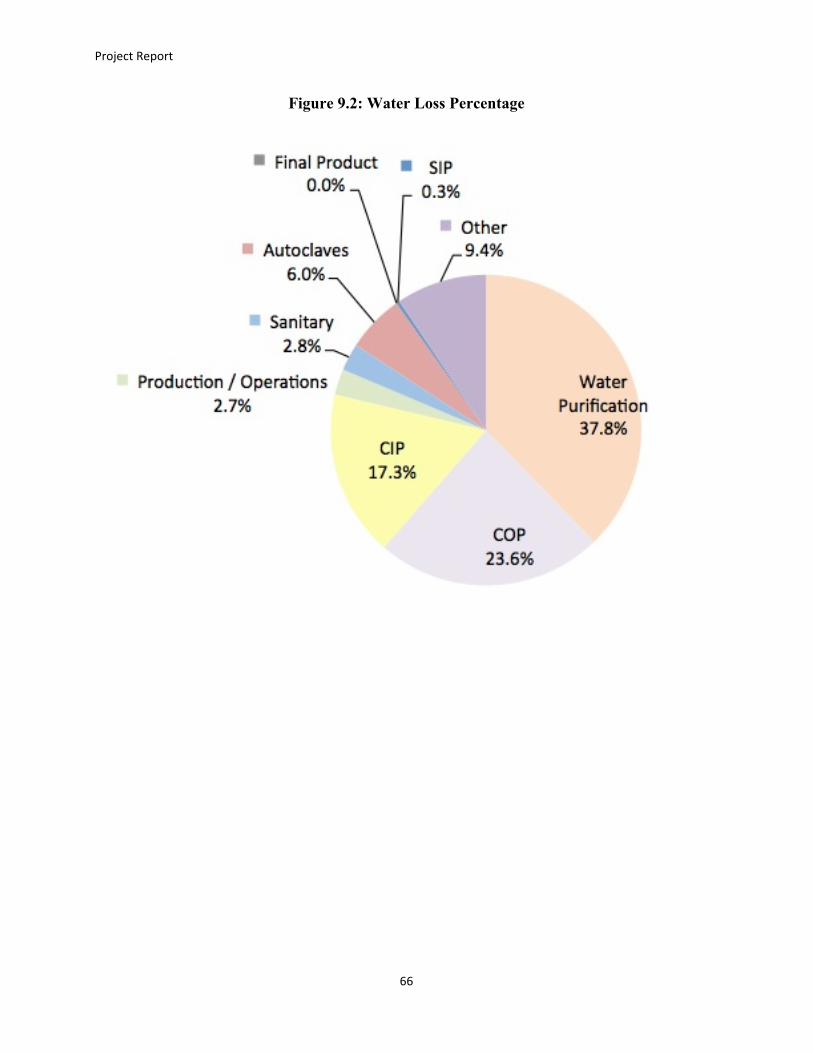
Project Report
66
Figure 9.2: Water Loss Percentage
Project Report
67
10.0 ECONOMIC ANALYSIS
10.1 EXECUTIVE SUMMARY
ANA Water Solutions is a San Jose, CA startup established in 2012 by Nicole Liu. ANA
provides consulting to analyze a company’s water in-take and out-flow utilization for the entire
company or departments within a company. Managing scarce and valuable water resources while
demand for water is increasing remains a challenge. In addition, the costs associated with water
usage and discharge and permit requirements are growing concerns to industries. With increasing
city water rates and in accordance with California state law of reducing industrial water usage by
20% by 2020 achieving water sustainability will be a must for organization to remain
competitive.
ANA Water Solution is capable of providing water balancing services to clients that must
achieve water efficiency to remain competitive and ecologically responsible. ANA has the
technology and knowledge to measure water input and output rates and identify inefficiencies in
water usage. The Bay Area market size in our consulting space is approximately $100 million,
and is projected to grow to $200-250 million by 2020 when California state water usage
regulations are in place. Our potential customers include private, public and commercial
establishments like schools, colleges, shopping malls, golf courses, hotels, semi conductor
manufacturing, power plants, and so forth.
While there are many Bay Area competitors in our space, our innovation is not just measuring
water in-take and out-flow, but the use of our engineering knowledge and skills to innovate
creative and effective solutions to improve each individual client’s water usage efficiencies. In
addition, our consulting fees provide a significant competitive advantage over fees charged by
our competitors.

Project Report
68
We are seeking $500K in seed funding until break even at the end of the first year of operation.
Funds will be used for salary, marketing, and operational expenses. We anticipate an 8-fold ROI
by the end of 2017, and a 15 fold ROI by 2020 when CA water regulations are in place.
Our business model involves promoting the match between the engineering analysis expertise of
the technical team to a client’s need to identify and improve water usage efficiency. Innovative
technical, possible hardware or software solutions to improving efficiencies will be protected and
provide a source of increased value to the company. Revenues will be generated by offering
clients fee options ranging from fee for service and profit sharing through annual fee payments
based on a percentage of the reduced water costs to a company as a result of our services. The
later revenue model offers a greater likelihood of revenue growth.
Consulting companies in our space are likely to exit by acquisition or merger with an existing
larger consulting company. Examples include Arup, URS etc.
10.2 PROBLEM STATEMENT
Industry water usage composes 45% of the total water usage in the United States. Manufacturing
Industries comes at second place in water usage, only after power plants. With limited
availability of resources, increasing demand due to growing population, and higher federal and
state environmental regulations, achieving water efficiency will be a deciding factor when
presenting annual profits.
Water balance is a very powerful tool for driving water conservation strategy and achieving
environmental sustainability. A thorough water assessment will determine where the water is
consumed and where the water can be conserved.

Project Report
69
Genentech Inc. is a biopharmaceutical company whose headquarters is located in South San
Francisco. The headquarters consists of manufacturing buildings, research laboratories for drugs
and several other office buildings. In addition to creating high quality products for medical
needs, Genentech is committed to Environmental Sustainability goals. The company is working
to reduce overall water usage and discharge in order to achieve water efficiency as well as
meeting parent Roche Corporation Sustainability goals.
10.3 SOLUTION AND VALUE PROPOSITION
Our water balance at Genentech facility started with Building 3, which is their major
manufacturing building and largest water consumer. The project will help them understand
water flows throughout their facility. This will give them a better understanding of processes or
areas, which consume large amount of water. Moreover, Genentech will save over one million
dollars in coming years by reducing their water usage and discharge volume.
10.4 MARKET SIZE
The market size of our service is very big as the San Francisco Bay Area is home for major
manufacturing, technology firms, refineries, power plants, universities and colleges, construction
corporations and health care services. With increasing federal and state regulation amid
increasing city water usage and discharge rates, the market size of our service will grow further
in the near future. We estimated that there are roughly 4000 small and large organizations, which
our company can target. Based on an average spending by these organizations, the total size of
our services is $100 million as of now but will grow up to $200-250 million by 2020.

Project Report
70
In Figure 10.1 below, industries are the highest consumers of water in the United States, which
also includes power plants (Community pulse: Sonoma County Water Agency Report). ANA
Water Solutions will target our customers on small and medium size organizations.
Figure 10.1: Water Usage in USA in 2000
• Small Industries/establishments: This includes small industries employing less than 20
people, hotels, restaurants, parks management groups etc.
• Medium Industries/Establishments: This includes facilities like colleges & universities,
big commercial establishments like malls, theme parks, government offices and private
buildings, food processing industries, paper and pulp industries etc.
• Heavy Industries: This includes big power plants, refineries, big real estate projects, golf
courses, resorts and private clubs.
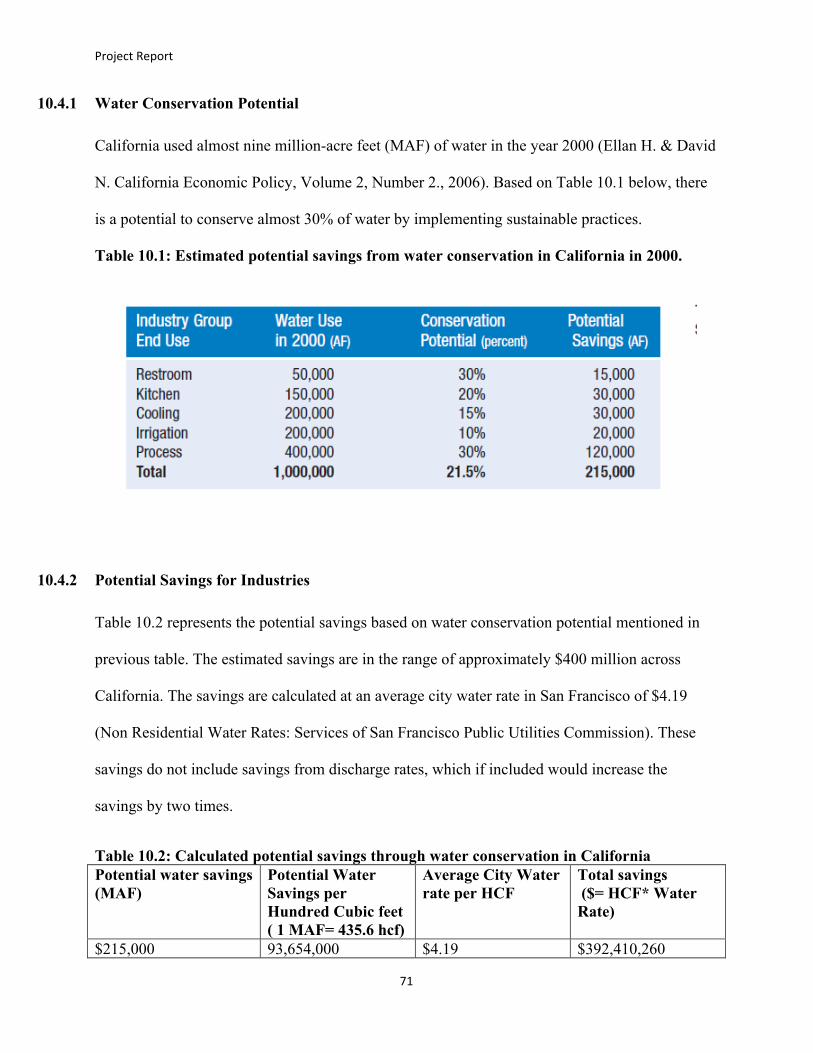
Project Report
71
10.4.1 Water Conservation Potential
California used almost nine million-acre feet (MAF) of water in the year 2000 (Ellan H. & David
N. California Economic Policy, Volume 2, Number 2., 2006). Based on Table 10.1 below, there
is a potential to conserve almost 30% of water by implementing sustainable practices.
Table 10.1: Estimated potential savings from water conservation in California in 2000.
10.4.2 Potential Savings for Industries
Table 10.2 represents the potential savings based on water conservation potential mentioned in
previous table. The estimated savings are in the range of approximately $400 million across
California. The savings are calculated at an average city water rate in San Francisco of $4.19
(Non Residential Water Rates: Services of San Francisco Public Utilities Commission). These
savings do not include savings from discharge rates, which if included would increase the
savings by two times.
Table 10.2: Calculated potential savings through water conservation in California Potential water savings (MAF)
Potential Water Savings per Hundred Cubic feet ( 1 MAF= 435.6 hcf)
Average City Water rate per HCF
Total savings ($= HCF* Water Rate)
$215,000 93,654,000 $4.19 $392,410,260

Project Report
72
10.5 COMPETITORS
Competition is very important for a healthy business. Knowing your competitor helps in
improving strategies, products and services. It brings cost effectiveness and also helps in finding
new strategies for marketing and expands your customer size. We have several competitors in
and around the Bay Area. These competitors range from non-profit organizations, startups, small
and large consulting companies, and environmental conservation groups. Some of our
competitors like URS & Arup are big players in the market and offer industry wide services but
our direct competition are with startups and non-profit organizations. The following is an
analysis of each company’s strengths and weaknesses.
Table 10.3: Competitors COMPANY LOCATION BUSINESS SIZE
Environmental Building Strategies San Francisco Environmental
Consulting small
Arup San Francisco Sustainability Consulting large
Ecology Action Santa Cruz Non-profit
Environmental Consulting
small
URS San Jose Engineering large
Simon & Associates San Francisco Green Building Consulting small
Water Wise Inc. Glendora Water small
Environmental Building Strategies (EBS): The EBS provides green building and sustainability
solutions to customers. The company offers competitive services in Energy savings and waste
reduction and also helps other organizations to achieve LEED ratings for green buildings. The
company does not offer direct water balance and auditing services.
Strength: Highly qualified team, Certified Experts and major green building organization.
Weakness: Lags in water auditing service.

Project Report
73
Arup: It was founded in 1946 and is global firm offering services in design, construction and
consulting business. They have successfully completed many projects like offering structural
design of opera house in Sydney followed by great work done in Beijing Olympics. They have
highly qualified experts in their organization; well build customer network and significant
presence in the Bay Area. But at the same time their water auditing services are very costly as
compared to us.
Strength: Global technical Expertise, Established market, Strong name awareness
Weakness: Costly services and lacks service support and low market reach.
URS: URS is global fully integrated organization offering services in engineering, construction
and other technical services especially for United States defense establishments. The company
was established in 1951 and has 2011 revenues of almost $9.5 Billion. They have big product
and service line, offices in almost 50 countries and good customer base in United States.
Strength: Technical Expertise, Industry wide presence, Brand name and well capitalized.
Weakness: Services are expensive and do not offer direct services in water auditing.
Water wise Consulting Inc: Water wise is water management and consulting company with
head office in Glendora, CA. They offer competitive services in water auditing, Indoor and
Outdoor water management, agriculture water auditing and various other educational programs.
Currently this organization is our biggest competitor.
Strength: Good Technical Team, Competitive pricing and water rebates program.
Weakness: Low Industrial operation exposure
Project Report
74
ANA Water Solutions: ANA provides cost effective and efficient water auditing services in and
around bay area. We have highly educated, LEED certified and registered water engineers in our
team. The organization has successfully completed some major projects and also in fray to get
some big projects. We offer onsite water audit services, financial estimates of water management
program, and water rebates program from California Government. The organization also run
educational program with non-profit organization to spread knowledge about water conservation.
Strength: Strong Team, Competitive pricing for Services and support, Water Management,
financial estimates and Water rebates program.
Weakness: Small Size Company, Low budget, Less Market reach
10.6 CUSTOMERS
Water conservation is not a federal or state responsibility. It is a necessity of today’s business.
With increasing water rates and regulated discharge by state government, there is an urgent need
of water management and conservation practices in order to save natural resources and also
reduce high water bills. Some industries like power plants, refineries, golf courses and food
industries pay almost million of dollars every year for water usage and discharge. Some of our
potential customers, which are located around the Bay Area are:
• Manufacturing: 200 (employing between 20-49 people)
• Colleges: 50-60
• Technology: 180-200
• Construction and Real Estate: 50
• Refineries: 5
• Power plants: 10 (includes coal, gas and Nuclear)

Project Report
75
• Public buildings: 1200
• Country clubs and golf courses: 87
• Hotels: 1250
• Public schools: 1832 & Private Schools: 700
10.7 COST/ANNUAL EXPENSES
The projected annual cost of business operation for the first three years is presented in Table
10.4, which also shows the cost breakdown structure of the business operation. As shown in
Table 10.4, employee salary constitutes a substantial portion of the total cost. As the company
grows and more projects are acquired, employee salary will increase due to annual adjustments,
bonuses & promotions and also there is need to hire more employees. As more employees join
our workforce, we will need to seek a larger office space, which means an increase in rental and
utility costs as well as many other associated item costs (Table 10.4).
Table 10.4: Annual Cost Breakdown Structure for the First Three Years Description 2011 2012 2013 Employees Salary $225,000.00 $375,000.00 $525,000.00 Manager Salary $100,000.00 $120,000.00 $130,000.00 CEO Salary $150,000.00 $170,000.00 $225,000.00 Rent $15,000.00 $18,000.00 $20,000.00 Accountant (Quarterly) $5,000.00 $7,000.00 $10,000.00 Software $1,000.00 $1,000.00 $2,000.00 Utilities $2,000.00 $3,000.00 $4,000.00 Office Supplies $300.00 $400.00 $500.00 Telephone bills $1,500.00 $1,700.00 $2,000.00 Internet services $200.00 $300.00 $400.00 Conference/Exhibitions $500.00 $700.00 $1,000.00 Marketing $5,000.00 $7,000.00 $10,000.00 Travel Allowances $2,000.00 $2,500.00 $3,000.00 Miscellaneous $3,000.00 $4,000.00 $5,000.00
Total: $510,500.00 $710,600.00 $937,900.00
Project Report
76
10.8 PRICE POINT
Initially we plan to keep the price of our services low compared to our competitor. The average
cost of assessment can vary from $5000 (small facility, hotels, schools, colleges & restaurants) to
$20,000 (small manufacturing plants, large hotels, large university campuses and medium size
distribution centers) and up to $80,000 (large refineries, power plants, golf clubs, big
manufacturing organizations) which depend upon the size of the facility, complexities involved
and cost & expenses involved.
10.9 SWOT ANALYSIS
Strength: Our team is highly talented, well qualified and experienced in performing a water
balance across small units to large industrial complex. Since we are a small company, services
and support are fast and reliable and we also provide financial estimates of water conservation
measures and water rebates to our customers to recover their investment.
Weakness: As a startup we need capital infusion from time to time. Also managing a business at
the beginning can be expensive and challenging. Moreover, to compete with existing companies
in the market, we have to develop strong marketing strategies. Our customer base is in it’s
development stage so it will take some time to have brand recognition in the market. In addition,
water conservation has limited financial return, as water is still inexpensive in the Bay Area.
Opportunities: There are a plethora of opportunities in the water balancing and conservation
market. Water resources are very scarce and needs to be conserved. Our potential customers are
any companies or organizations that want to implement more sustainable practices and may not
know where to start. Our company will have further opportunities to expand our customer base
due to increasing city water rates and higher state permit regulations.

Project Report
77
Threats: Our main threat is to complete our projects on time and try to bring our business into
profits otherwise investors will lose interest into our company. Also we need to maintain a
positive relationship with our customers.
10.10 PROFIT AND LOSS/RETURN ON INVESTMENTS
In the first two years of business operations, we anticipate a majority of our projects will be small
to medium-sized projects. We do not expect to make a profit in the first two years due to high
initial capital and lower volume sales. However, as we complete more projects and our reputation
grows, we anticipate an increased demand for our services. In addition, we expect to receive
more large-sized projects over time. As a result our revenue is expected to increase at a high rate
during the first three years of operation. We expect to hit the breakeven point in our third year at
which the revenue will offset the operational cost. As our revenue grows at a higher rate than the
operational cost, we will begin to make a profit starting from the third year; and our profit will
continue to grow with time. Table 10.5 presents the projected cost, number of projects, revenue,
and net income for the first three years of business operation. Figure 10.2 provides a graph
showing the breakeven analysis of our cost and revenue projections.
Table 10.5: Projected Cost, Sales, and Net Income for the First Three Years
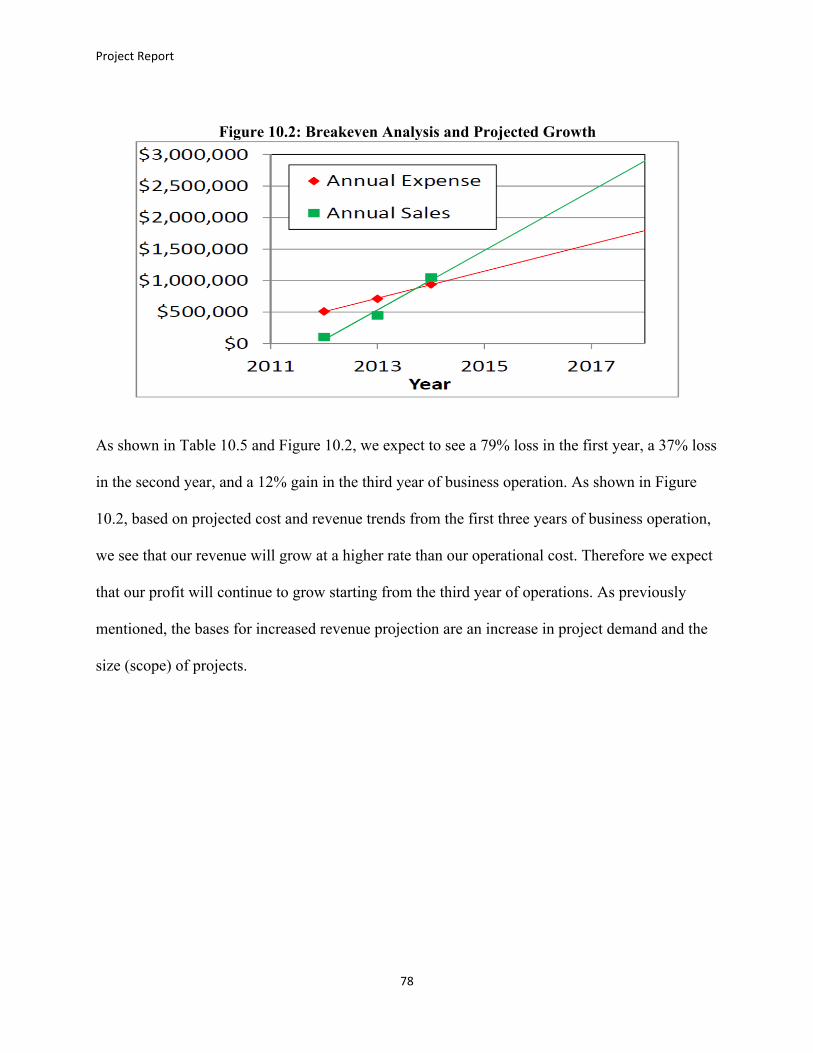
Project Report
78
Figure 10.2: Breakeven Analysis and Projected Growth
As shown in Table 10.5 and Figure 10.2, we expect to see a 79% loss in the first year, a 37% loss
in the second year, and a 12% gain in the third year of business operation. As shown in Figure
10.2, based on projected cost and revenue trends from the first three years of business operation,
we see that our revenue will grow at a higher rate than our operational cost. Therefore we expect
that our profit will continue to grow starting from the third year of operations. As previously
mentioned, the bases for increased revenue projection are an increase in project demand and the
size (scope) of projects.

Project Report
79
10.11 PERSONNEL
CEO 7-8 years of experience of technical aspects involved in water auditing
business and ability to run businesses successfully, sales/marketing
experience a plus, be liaison between company and investors and with
existing & new clients.
Manager/Advisor 4-5 years of experience in water balancing field. She/he must be a certified
professional in water conservation program and be a technical advisor and
mentor of projects.
Engineer 2-3 years of experience in water consulting, Bachelor in environment
related major, LEED certified, ability to handle multiple projects, excellent
communication skills, flexible with field/onsite work and must have good
understanding of organization goals and objectives.
10.12 BUSINESS STRATEGY
As a small organization we do not have a separate sales and marketing department so our
business and revenue model is completely based on our relationship with our clients and making
new contacts in market. We plan to sell our service to an organization that wants to achieve
water efficiency and reduce their water bills for a fee. As soon as we receive a project our team
will perform an initial assessment of the client facility and present our findings. We also offer
incentives to our customers for government sponsored rebate programs. We will be advertising
our services through environment related conferences, trade shows, environment journals and
magazines and making contacts in the industry.
Project Report
80
10.12.1 Revenue Model
Our services are based on three revenue models which are: 1) Project or Contract fee, 2) Savings
Sharing Model and 3) Hybrid Model. Our customers have a choice to pick any one of these three
models. The decision to pick a model is a mutual consent between the customers and our
company.
1) Project or Contract fee: This is fixed fee paid by customers, which is agreed upon after
the completion of our services. This is the total service cost for customers and is
estimated after consideration of several factors like the length of project, initial facility
assessment, complexity involved, and inflation and market fluctuations.
2) Savings Sharing Model: In this model, the customer does not pay any direct fee at all.
ANA provides a site assessment and estimates the savings potential from the project.
Customers will then agree to share some percentage of that savings. The customer incurs
the entire cost for implementing water conservation measures. This model generates a
consistent income for the company.
3) Hybrid Model: This is a combination of the first two models: Contract fee & Savings
Sharing Model. This model allows the customer to pay an initial amount (agreed upon
with our company) for our services and share a percentage of potential savings from the
project.
Project Report
81
10.13 STRATEGIC ALLIANCE
To remain competitive and in order to acquire new projects we have established many alliance
and partnerships with various non-profit organizations and counties in the Bay Area. These
partnerships help us understand changing regulations, keep us up to date about new industrial
standards, and promotes our company to potential customers. The following is a list of our
alliances and partnerships:
Alliance for Water Efficiency
Bay Area Water Supply and Conservation Agency
California Department of Water Resources
California Urban Water Conservation Council
City and County of San Francisco, Department of Environment
ImagineH2O
SF Public Utilities Commission
USGBC: United States Green Building Council
10.14 EXIT STRATEGY
We will continue to offer our services to clients and will achieve profitability in almost 2-3 years
based on existing projects in hand and new opportunities in the market. The addition of more
products will increase our customer-base. In the near future, we will try to go public or become
a acquired by one of the larger environmental consulting agencies.
Project Report
82
11.0 CONCLUSION
This project will help Genentech form a baseline for their water consumption activities in
their manufacturing and production facilities. The water balance will summarize the overall
process water usage. This will help the company focus on higher water-consumption processes
and activities. The endless possibilities of many water conservation projects that can occur after
the water balance is complete will lower Genentech’s “water footprint”. With increased water
rates and compliances requirements, this water assessment will definitely give an impetus to
Genentech’s sustainability goal.
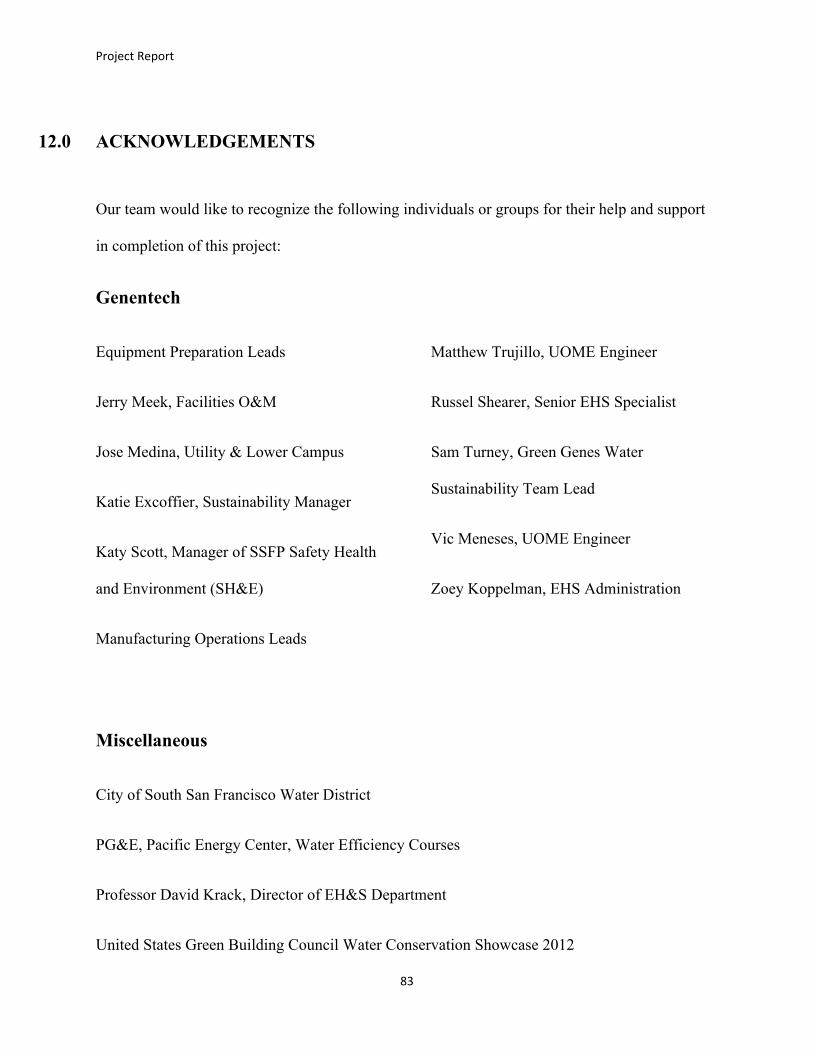
Project Report
83
12.0 ACKNOWLEDGEMENTS
Our team would like to recognize the following individuals or groups for their help and support
in completion of this project:
Genentech
Equipment Preparation Leads
Jerry Meek, Facilities O&M
Jose Medina, Utility & Lower Campus
Katie Excoffier, Sustainability Manager
Katy Scott, Manager of SSFP Safety Health
and Environment (SH&E)
Manufacturing Operations Leads
Matthew Trujillo, UOME Engineer
Russel Shearer, Senior EHS Specialist
Sam Turney, Green Genes Water
Sustainability Team Lead
Vic Meneses, UOME Engineer
Zoey Koppelman, EHS Administration
Miscellaneous
City of South San Francisco Water District
PG&E, Pacific Energy Center, Water Efficiency Courses
Professor David Krack, Director of EH&S Department
United States Green Building Council Water Conservation Showcase 2012
Project Report
84
13.0 REFERENCES
1) Dyett & Bhatia. (2007). Genentech Facilities Ten-Year Master Plan. San Francisco, CA.
2) East Bay Municipal Utility District. (2008). Watersmart Guidebook: A Water-Use
Efficiency Plan and Review Guide for New Businesses. Oakland, CA.
3) EIP Associates. (2006). Master EIR for Genentech Corporate Facilities Research &
Development Overlay District Expansion and Master Plan. Los Angeles, CA.
4) Genentech. (2011). 2009 Corporate Sustainability Update. Available from
http://www.gene.com/gene/about/environmental/past-reports/
5) Genentech. (2012). Roche 2011 Annual Report. Available from
http://www.roche.com/annual_reports.htm
6) Genentech Environmental Health and Safety (EHS) department. (2011).
7) Global Environmental Management Initiative. (2011). Case Example, Pfizer Inc.: Use of
a Water Balance to Reduce Water Usage. Available from
http://www.gemi.org/waterplanner/module3.asp
8) “Laboratories for the 21st Century” by United States Environmental Protection Agency &
United States Department of Energy. (2005). Water Efficiency Guide for Laboratories.
9) Millipore. (2003). Principles of Steam-In-Place. Billerica, MA.
10) Morris, M., & Masten, S. (2012). Michigan State University, Department of Civil and
Environmental Engineering. MSU Water Consumption.
11) Services of San Francisco Public Utilities Commission. (2011). Available from
http://www.sfwater.org/index.aspx?page=170
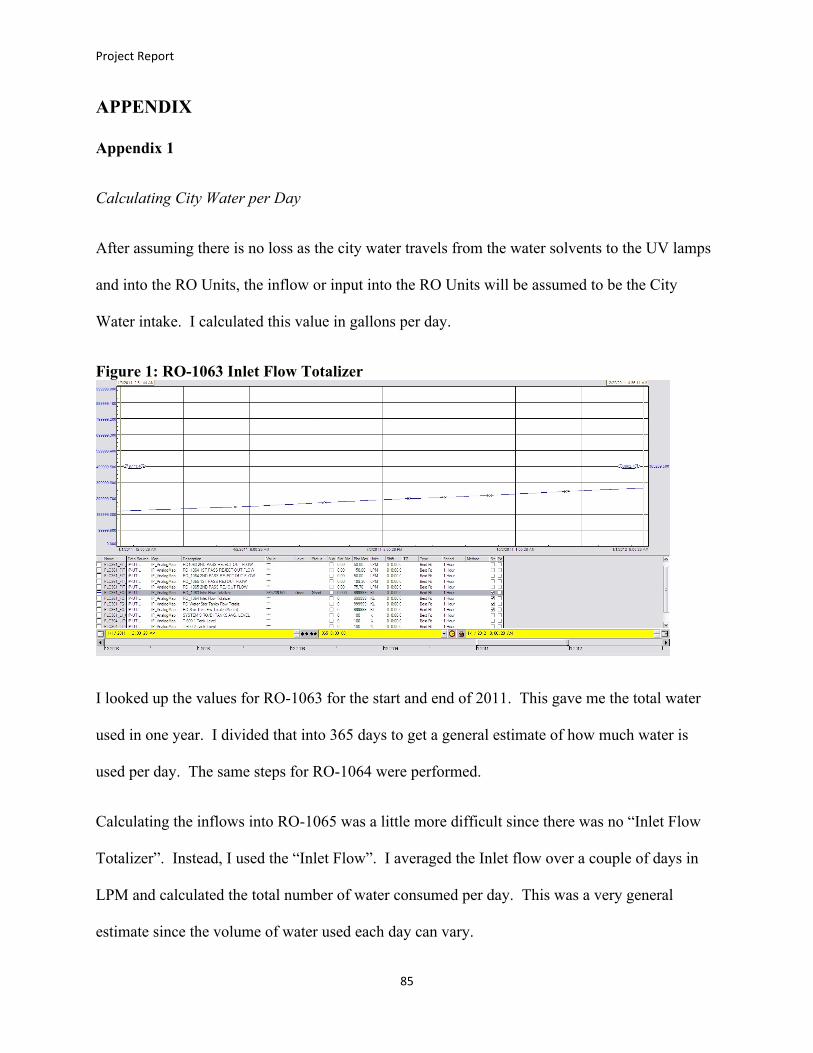
Project Report
85
APPENDIX
Appendix 1
Calculating City Water per Day
After assuming there is no loss as the city water travels from the water solvents to the UV lamps
and into the RO Units, the inflow or input into the RO Units will be assumed to be the City
Water intake. I calculated this value in gallons per day.
Figure 1: RO-1063 Inlet Flow Totalizer
I looked up the values for RO-1063 for the start and end of 2011. This gave me the total water
used in one year. I divided that into 365 days to get a general estimate of how much water is
used per day. The same steps for RO-1064 were performed.
Calculating the inflows into RO-1065 was a little more difficult since there was no “Inlet Flow
Totalizer”. Instead, I used the “Inlet Flow”. I averaged the Inlet flow over a couple of days in
LPM and calculated the total number of water consumed per day. This was a very general
estimate since the volume of water used each day can vary.

Project Report
86
Appendix 2
In order to calculate the inflows into the DIW System 9 tanks (T600.1 and T600.2), I looked at
the outflows from the RO membrane filters. Assuming that there is negligible water loss in the
transfer, the outflows from the RO membrane filters should be equivalent to the inflows for the
DIW System 9. Using the monthly totalizer for the RO Unit, I was able to see how much water
flowed into the tanks over 2011. Then I averaged this value over 365 days to find a daily value.
Figure 2: Outflows from RO Units
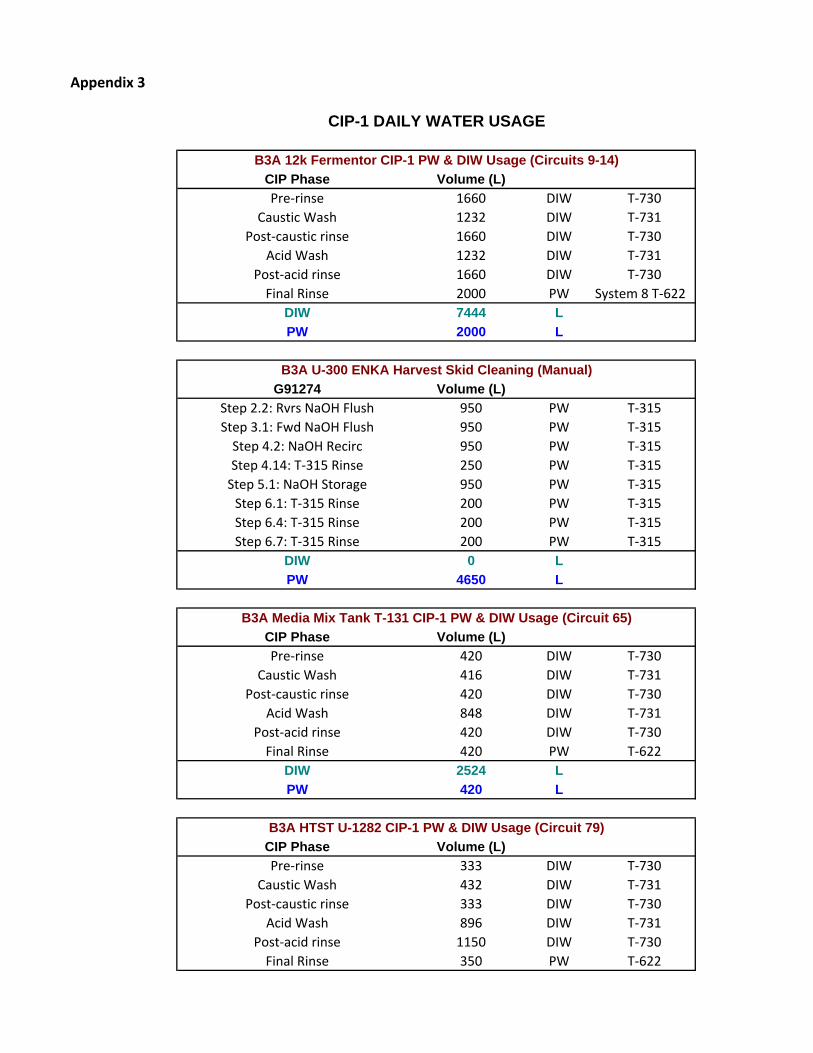
Appendix 3
CIP Phase Volume (L)
Pre‐rinse 1660 DIW T‐730
Caustic Wash 1232 DIW T‐731
Post‐caustic rinse 1660 DIW T‐730
Acid Wash 1232 DIW T‐731
Post‐acid rinse 1660 DIW T‐730
Final Rinse 2000 PW System 8 T‐622
DIW 7444 L
PW 2000 L
G91274 Volume (L)
Step 2.2: Rvrs NaOH Flush 950 PW T‐315
Step 3.1: Fwd NaOH Flush 950 PW T‐315
Step 4.2: NaOH Recirc 950 PW T‐315
Step 4.14: T‐315 Rinse 250 PW T‐315
Step 5.1: NaOH Storage 950 PW T‐315
Step 6.1: T‐315 Rinse 200 PW T‐315
Step 6.4: T‐315 Rinse 200 PW T‐315
Step 6.7: T‐315 Rinse 200 PW T‐315
DIW 0 L
PW 4650 L
CIP Phase Volume (L)
Pre‐rinse 420 DIW T‐730
Caustic Wash 416 DIW T‐731
Post‐caustic rinse 420 DIW T‐730
Acid Wash 848 DIW T‐731
Post‐acid rinse 420 DIW T‐730
Final Rinse 420 PW T‐622
DIW 2524 L
PW 420 L
CIP Phase Volume (L)
Pre‐rinse 333 DIW T‐730
Caustic Wash 432 DIW T‐731
Post‐caustic rinse 333 DIW T‐730
Acid Wash 896 DIW T‐731
Post‐acid rinse 1150 DIW T‐730
Final Rinse 350 PW T‐622
CIP-1 DAILY WATER USAGE
B3A 12k Fermentor CIP-1 PW & DIW Usage (Circuits 9-14)
B3A U-300 ENKA Harvest Skid Cleaning (Manual)
B3A Media Mix Tank T-131 CIP-1 PW & DIW Usage (Circuit 65)
B3A HTST U-1282 CIP-1 PW & DIW Usage (Circuit 79)

DIW 3144 L
PW 350 L
CIP Phase Volume (L)
Pre‐rinse 263 DIW T‐730
Caustic Wash 432 DIW T‐731
Post‐caustic rinse 263 DIW T‐730
Acid Wash 896 DIW T‐731
Post‐acid rinse 891 DIW T‐730
Final Rinse 263 PW T‐622
DIW 2744 L
PW 263 L
CIP Phase Volume (L)
Pre‐rinse 271 DIW T‐730
Caustic Wash 416 DIW T‐731
Post‐caustic rinse 271 DIW T‐730
Acid Wash 848 DIW T‐731
Post‐acid rinse 271 DIW T‐730
Final Rinse 271 PW T‐622
DIW 2078 L
PW 271 L
CIP Phase Volume (L)
Pre‐rinse 1267 DIW T‐730
Caustic Wash 1232 DIW T‐731
Post‐caustic rinse 1267 DIW T‐730
Acid Wash 832 DIW T‐731
Post‐acid rinse 1267 DIW T‐730
Final Rinse 1330 PW T‐622
DIW 5865 L
PW 1330 L
CIP Phase Volume (L)
Pre‐rinse 785 DIW T‐730
Caustic Wash 592 DIW T‐731
Post‐caustic rinse 785 DIW T‐730
Acid Wash 592 DIW T‐731
Post‐acid rinse 785 DIW T‐730
Final Rinse 907 PW T‐622
DIW 3539 L
PW 907 L
B3A Media Mix Tank T-130 CIP-1 PW & DIW Usage (Circuit 64)
B3A 2k Fermentor CIP-1 PW & DIW Usage (Circuits 5-8)
B3A 400-L Fermentor CIP-1 PW & DIW Usage (Circuits 1-4)
B3A HTST U-1281 CIP-1 PW & DIW Usage (Circuit 78)

1420.026 Volume (L)
Step 2.1 & 2.5 PW Fill for Caustic 100 PW
Step 2.19 PW Rinse 100 PW
Steps 3.2 & 3.5 PW Fill for Acid 100 PW
Step 3.19 PW Rinse 100 PW
Step 3.19 PW Rinse 100 PW
Step 3.19 PW Rinse 100 PW
DIW 0 L
PW 600 L
CIP Phase Volume (L)
Pre‐rinse 263 DIW T‐730
Caustic Wash 592 DIW T‐731
Post‐caustic rinse 413 DIW T‐730
Acid Wash 592 DIW T‐731
Post‐acid rinse 413 DIW T‐730
Final Rinse 263 PW T‐622
DIW 2272 L
PW 263 L
CIP Phase Volume (L)
Pre‐rinse 508 DIW T‐730
Caustic Wash 592 DIW T‐731
Post‐caustic rinse 798 DIW T‐730
Acid Wash 576 DIW T‐731
Post‐acid rinse 798 DIW T‐730
Final Rinse 560 PW T‐622
DIW 3271 L
PW 560 L
CIP Phase Volume (L)
Pre‐rinse 525 DIW T‐730
Caustic Wash 592 DIW T‐731
Post‐caustic rinse 525 DIW T‐730
Acid Wash 592 DIW T‐731
Post‐acid rinse 525 DIW T‐730
Final Rinse 683 PW T‐622
DIW 2759 L
PW 683 L
B3A Portable Media Tank CIP-1 PW & DIW Usage
B3A 80-L Fermentor Cleaning (Manual)
B3A Transfer Line CIP-1 PW & DIW Usage (Low Flow Circuits)
B3A Transfer Line CIP-1 PW & DIW Usage (High Flow Circuits)


![Towards Systematic Privacy and Operability (PRIOP) Studies · Hazard and Operability Studies The international standard IEC 61882 [2] de nes what a Hazard and Operability (HAZOP)](https://img.dokumen.tips/doc/110x75/5e9fb7d8f9d766473e1e43a5/towards-systematic-privacy-and-operability-priop-studies-hazard-and-operability.jpg)