Embed Size (px)
Citation preview
Supplementary Online Content
Osinusi A, Meissner EG, Lee Y-J, et al. Sofosbuvir and ribavirin for hepatitis C genotype 1 in patients with unfavorable treatment characteristics: a randomized clinical trial. JAMA. doi:10.1001/JAMA.2013.109309 eTable 1. Subjects With HCV RNA Below the Level of Quantification (Part 1)
eTable 2. Adverse Events During the Treatment Period (Part 1) eTable 3. Rates of Sustained Virologic Response Among Patients by Baseline
Characteristics (Part 2) eTable 4. VK/PK/PD Modeling of Sofosbuvir and Ribavirin (Part 2) eFigure 1. Fitted HCV Decay of Individual Subjects (Part 2)
eFigure 2. Viral Kinetic Pharmaconkintetic and Pharmacodynamics Curves eFigure 3. Histologic Response
eFigure 4. Biochemical and Hemotolgical Changes With Treatement
This supplementary material has been provided by the authors to give readers additional information about their work.
Downloaded From: http://jama.jamanetwork.com/ by Jules Levin on 08/28/2013
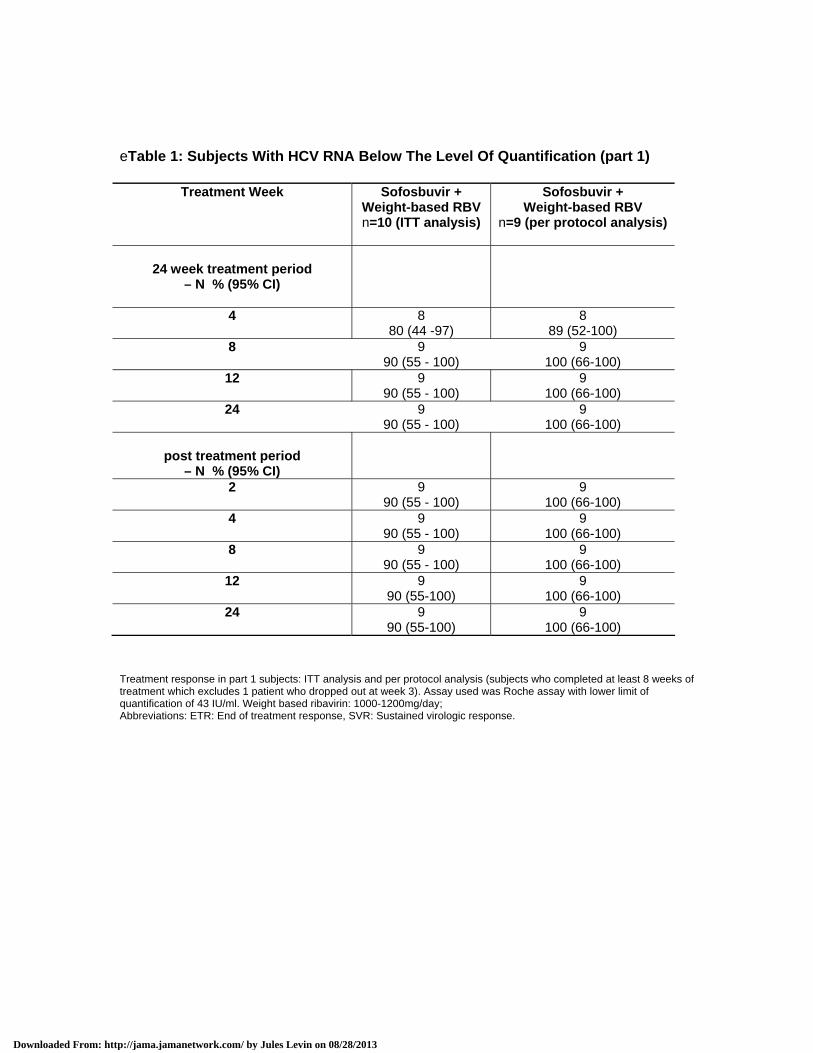
eTable 1: Subjects With HCV RNA Below The Level Of Quantification (part 1)
Treatment Week Sofosbuvir + Weight-based RBV n=10 (ITT analysis)
Sofosbuvir + Weight-based RBV
n=9 (per protocol analysis)
24 week treatment period
– N % (95% CI)
4 8 80 (44 -97)
8 89 (52-100)
8 9 90 (55 - 100)
9 100 (66-100)
12 9 90 (55 - 100)
9 100 (66-100)
24 9 90 (55 - 100)
9 100 (66-100)
post treatment period
– N % (95% CI)
2 9 90 (55 - 100)
9 100 (66-100)
4 9 90 (55 - 100)
9 100 (66-100)
8 9 90 (55 - 100)
9 100 (66-100)
12 9 90 (55-100)
9 100 (66-100)
24 9 90 (55-100)
9 100 (66-100)
Treatment response in part 1 subjects: ITT analysis and per protocol analysis (subjects who completed at least 8 weeks of treatment which excludes 1 patient who dropped out at week 3). Assay used was Roche assay with lower limit of quantification of 43 IU/ml. Weight based ribavirin: 1000-1200mg/day; Abbreviations: ETR: End of treatment response, SVR: Sustained virologic response.
Downloaded From: http://jama.jamanetwork.com/ by Jules Levin on 08/28/2013
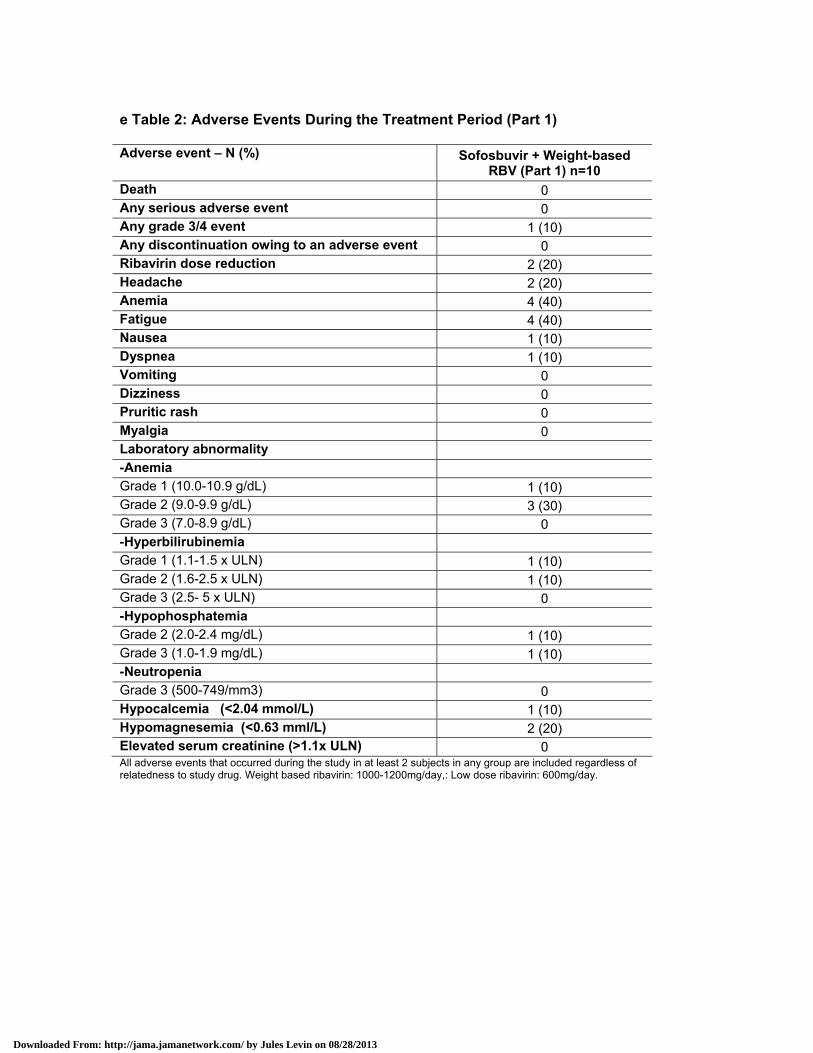
e Table 2: Adverse Events During the Treatment Period (Part 1)
Adverse event – N (%) Sofosbuvir + Weight-based RBV (Part 1) n=10
Death 0 Any serious adverse event 0 Any grade 3/4 event 1 (10) Any discontinuation owing to an adverse event 0 Ribavirin dose reduction 2 (20) Headache 2 (20) Anemia 4 (40) Fatigue 4 (40) Nausea 1 (10) Dyspnea 1 (10) Vomiting 0 Dizziness 0 Pruritic rash 0 Myalgia 0 Laboratory abnormality -Anemia Grade 1 (10.0-10.9 g/dL) 1 (10) Grade 2 (9.0-9.9 g/dL) 3 (30) Grade 3 (7.0-8.9 g/dL) 0 -Hyperbilirubinemia Grade 1 (1.1-1.5 x ULN) 1 (10) Grade 2 (1.6-2.5 x ULN) 1 (10) Grade 3 (2.5- 5 x ULN) 0 -Hypophosphatemia Grade 2 (2.0-2.4 mg/dL) 1 (10) Grade 3 (1.0-1.9 mg/dL) 1 (10) -Neutropenia Grade 3 (500-749/mm3) 0 Hypocalcemia (<2.04 mmol/L) 1 (10) Hypomagnesemia (<0.63 mml/L) 2 (20) Elevated serum creatinine (>1.1x ULN) 0 All adverse events that occurred during the study in at least 2 subjects in any group are included regardless of relatedness to study drug. Weight based ribavirin: 1000-1200mg/day,: Low dose ribavirin: 600mg/day.
Downloaded From: http://jama.jamanetwork.com/ by Jules Levin on 08/28/2013
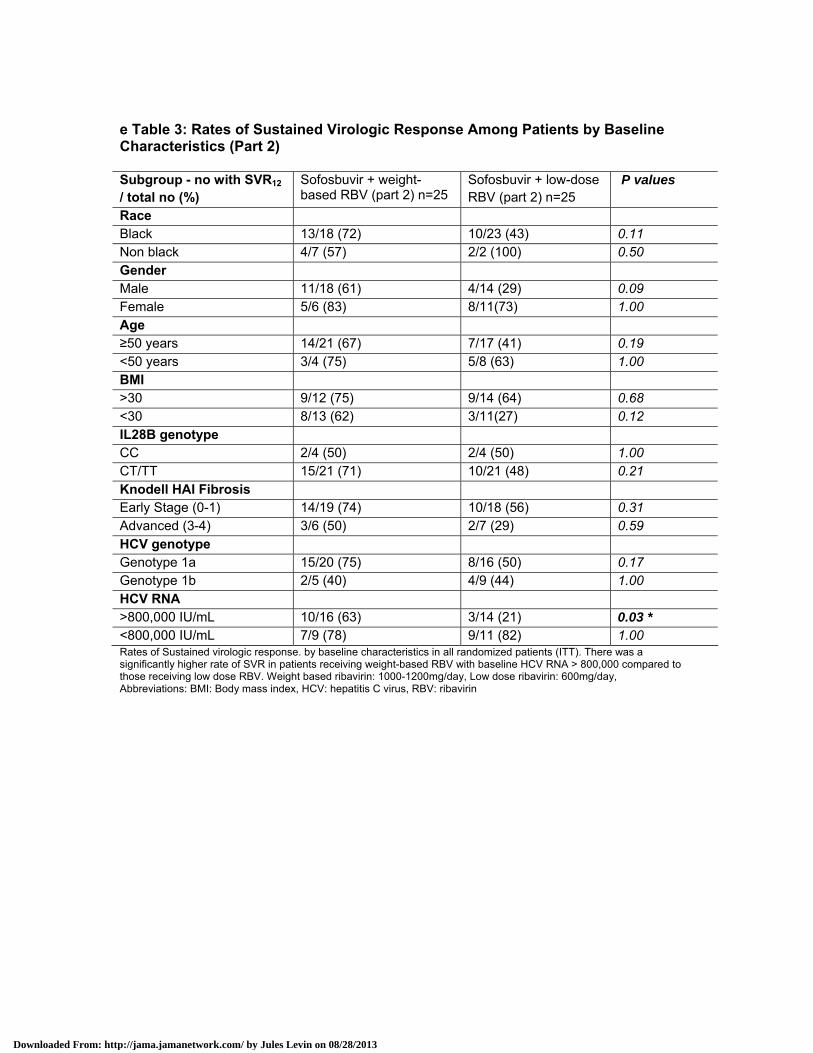
e Table 3: Rates of Sustained Virologic Response Among Patients by Baseline Characteristics (Part 2) Subgroup - no with SVR12
/ total no (%) Sofosbuvir + weight-based RBV (part 2) n=25
Sofosbuvir + low-dose RBV (part 2) n=25
P values
Race Black 13/18 (72) 10/23 (43) 0.11 Non black 4/7 (57) 2/2 (100) 0.50 Gender Male 11/18 (61) 4/14 (29) 0.09 Female 5/6 (83) 8/11(73) 1.00 Age ≥50 years 14/21 (67) 7/17 (41) 0.19 <50 years 3/4 (75) 5/8 (63) 1.00 BMI >30 9/12 (75) 9/14 (64) 0.68 <30 8/13 (62) 3/11(27) 0.12 IL28B genotype CC 2/4 (50) 2/4 (50) 1.00 CT/TT 15/21 (71) 10/21 (48) 0.21 Knodell HAI Fibrosis Early Stage (0-1) 14/19 (74) 10/18 (56) 0.31 Advanced (3-4) 3/6 (50) 2/7 (29) 0.59 HCV genotype Genotype 1a 15/20 (75) 8/16 (50) 0.17 Genotype 1b 2/5 (40) 4/9 (44) 1.00 HCV RNA >800,000 IU/mL 10/16 (63) 3/14 (21) 0.03 * <800,000 IU/mL 7/9 (78) 9/11 (82) 1.00 Rates of Sustained virologic response. by baseline characteristics in all randomized patients (ITT). There was a significantly higher rate of SVR in patients receiving weight-based RBV with baseline HCV RNA > 800,000 compared to those receiving low dose RBV. Weight based ribavirin: 1000-1200mg/day, Low dose ribavirin: 600mg/day, Abbreviations: BMI: Body mass index, HCV: hepatitis C virus, RBV: ribavirin
Downloaded From: http://jama.jamanetwork.com/ by Jules Levin on 08/28/2013
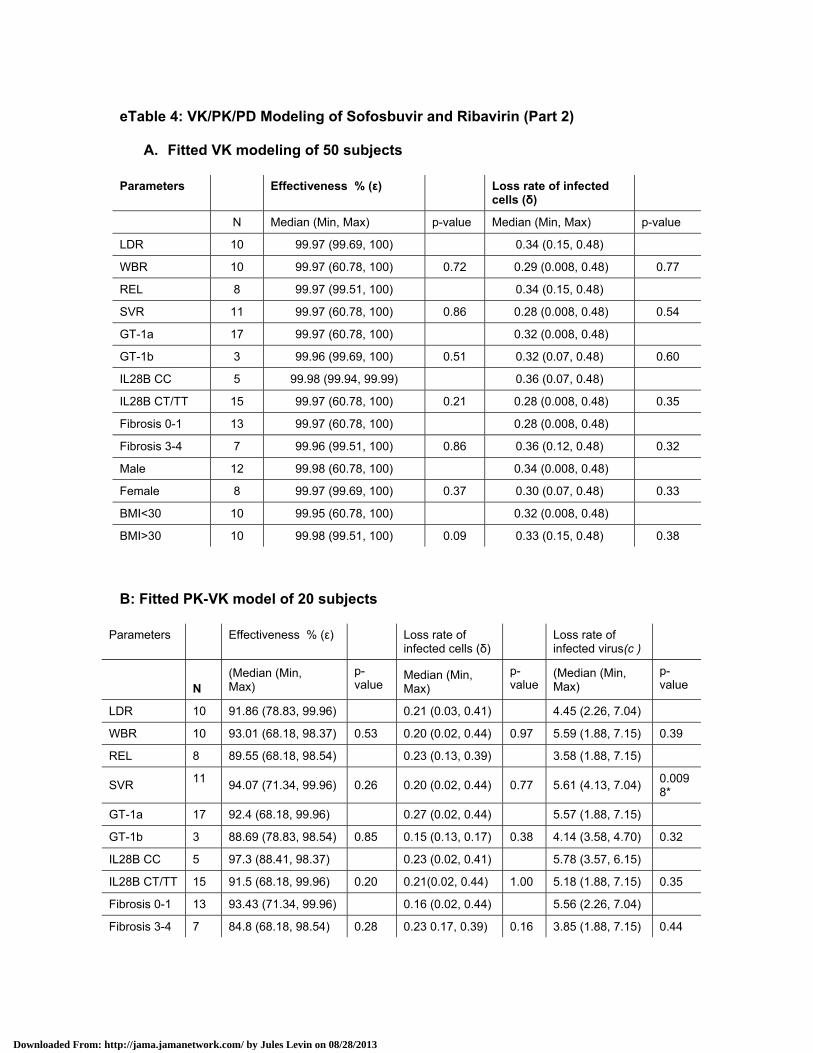
eTable 4: VK/PK/PD Modeling of Sofosbuvir and Ribavirin (Part 2)
A. Fitted VK modeling of 50 subjects
Parameters Effectiveness % (ε) Loss rate of infected cells (δ)
N Median (Min, Max) p-value Median (Min, Max) p-value
LDR 10 99.97 (99.69, 100) 0.34 (0.15, 0.48)
WBR 10 99.97 (60.78, 100) 0.72 0.29 (0.008, 0.48) 0.77
REL 8 99.97 (99.51, 100) 0.34 (0.15, 0.48)
SVR 11 99.97 (60.78, 100) 0.86 0.28 (0.008, 0.48) 0.54
GT-1a 17 99.97 (60.78, 100) 0.32 (0.008, 0.48)
GT-1b 3 99.96 (99.69, 100) 0.51 0.32 (0.07, 0.48) 0.60
IL28B CC 5 99.98 (99.94, 99.99) 0.36 (0.07, 0.48)
IL28B CT/TT 15 99.97 (60.78, 100) 0.21 0.28 (0.008, 0.48) 0.35
Fibrosis 0-1 13 99.97 (60.78, 100) 0.28 (0.008, 0.48)
Fibrosis 3-4 7 99.96 (99.51, 100) 0.86 0.36 (0.12, 0.48) 0.32
Male 12 99.98 (60.78, 100) 0.34 (0.008, 0.48)
Female 8 99.97 (99.69, 100) 0.37 0.30 (0.07, 0.48) 0.33
BMI<30 10 99.95 (60.78, 100) 0.32 (0.008, 0.48)
BMI>30 10 99.98 (99.51, 100) 0.09 0.33 (0.15, 0.48) 0.38
B: Fitted PK-VK model of 20 subjects
Parameters Effectiveness % (ε) Loss rate of infected cells (δ)
Loss rate of infected virus(c )
N (Median (Min, Max)
p-value
Median (Min, Max)
p-value
(Median (Min, Max)
p-value
LDR 10 91.86 (78.83, 99.96) 0.21 (0.03, 0.41) 4.45 (2.26, 7.04)
WBR 10 93.01 (68.18, 98.37) 0.53 0.20 (0.02, 0.44) 0.97 5.59 (1.88, 7.15) 0.39
REL 8 89.55 (68.18, 98.54) 0.23 (0.13, 0.39) 3.58 (1.88, 7.15)
SVR 11
94.07 (71.34, 99.96) 0.26 0.20 (0.02, 0.44) 0.77 5.61 (4.13, 7.04) 0.0098*
GT-1a 17 92.4 (68.18, 99.96) 0.27 (0.02, 0.44) 5.57 (1.88, 7.15)
GT-1b 3 88.69 (78.83, 98.54) 0.85 0.15 (0.13, 0.17) 0.38 4.14 (3.58, 4.70) 0.32
IL28B CC 5 97.3 (88.41, 98.37) 0.23 (0.02, 0.41) 5.78 (3.57, 6.15)
IL28B CT/TT 15 91.5 (68.18, 99.96) 0.20 0.21(0.02, 0.44) 1.00 5.18 (1.88, 7.15) 0.35
Fibrosis 0-1 13 93.43 (71.34, 99.96) 0.16 (0.02, 0.44) 5.56 (2.26, 7.04)
Fibrosis 3-4 7 84.8 (68.18, 98.54) 0.28 0.23 0.17, 0.39) 0.16 3.85 (1.88, 7.15) 0.44
Downloaded From: http://jama.jamanetwork.com/ by Jules Levin on 08/28/2013

Male 12 96.86 (68.18, 99.96) 0.20 (0.02, 0.44) 5.48 (1.88, 7.15)
Female 8 90.53 (78.83, 94.71) 0.24 0.21 (0.04, 0.33) 0.97 5.38 (2.26, 6.15) 0.91
BMI<30 10 89.95 (68.18, 98.54) 0.21 (0.04, 0.44) 5.57 (2.26, 7.15)
BMI>30 10 95.61 (69.39, 99.96) 0.19 0.20 (0.02, 0.41) 0.68 4.94 (1.88, 7.04) 0.68
The compartments considered are: IV : Infectious Virus;NIV : Non Infectious Virus;
I NIV V V : Viral Load; I : Infected
Cells and T : Target Cells. Parameters are ε: Effectiveness of drug; : Effect of RBV26; p : Proliferation of infected cells, 27;c: Loss rate of free virus;β: De-novo infection rate;Υ: Regeneration of target cells28 and δ: Loss rate of infected cells A; Fitted VK modeling of all 50 randomized patients. B: VK-PK model of randomized patients (n=20) WBR: Weight based ribavirin: 1000-1200mg/day,: LDR Low dose ribavirin: 600mg/day, GT: Genotype; REL: relapse; SVR: sustained virologic responder; BMI :body mass index
Downloaded From: http://jama.jamanetwork.com/ by Jules Levin on 08/28/2013

SVR REL
DO
SVR
SVR SVR
SVR
SVR
SVR SVR
SVR
SVR
SVR SVR
SVR
SVR SVR
SVR SVR
SVR
SVR
SVR
SVR SVR SVR SVR
SVR SVR
SVR
SVR SVR
REL
REL REL
REL REL REL
DO
DO DO
REL REL REL
REL REL REL
REL REL
REL REL
Downloaded From: http://jama.jamanetwork.com/ by Jules Levin on 08/28/2013

WBR arm LDR arm
SVR Relapser
k
Koko
M
edia
n H
CV
RN
A D
ecay
SVR Relapser
M
edia
n Ef
ficie
ncy
of b
lock
ing
vira
l pr
oduc
tion
SVR Relapser
H
CV
RN
A D
ecay
Med
ian
HC
V R
NA
Dec
ay
Sofosbuvir + WBR Sofosbuvir + LDR
Median HCV Decay
Downloaded From: http://jama.jamanetwork.com/ by Jules Levin on 08/28/2013

Fitted curves for hepatitis C viral kinetics (VK) in 50 randomized participants (a and b), pharmacokinetics and pharmacodynamics (PK-PD) in 20 randomized participants (c), and pharmacodynamics and viral kinetic (PD-VK) in 20 randomized participants (d). (a) The median fitted curves are plotted for viral decay (VK) with the overall median plotted in blue. (b) The median viral decay curves were rapid and independent of ribavirin dosing (c) The median value of mean efficiency of drug blocking viral production in the PK-PD model was similar in SVR vs. relapsers (p=0.26) (d) The PK-VK model for viral decay showed a significantly higher loss rate of infectious virus in patients who achieved SVR compared to relapsers , (p=0.009) Abbreviations: SVR: Sustained virologic responders; pharmacokinetics (PK); pharmacodynamics (PD); viral kinetics (VK). Details of the VK/PK/PD modeling are as below:
Pharmacokinetics (PK) : Used Bateman function using parameters k₁ and k₂ for drug absorption and elimination.
Pharmacodynamics (PD): Used an intermediate compartment Z defined by ( ) ( ) ( )Z t aC t aZ t through the Hill function
50
( )( )
( )
h
h h
Z ttZ t IC
Viral kinetic (VK): based on the general model for HCV viral kinetics ( ) (1 )(1 ) ( ) ( )
( ) (1 ) ( ) ( )
( ) ( )( ) ( ) ( ) ( )(1 ) ( )
(0) (0)
( ) ( )( ) (1 )
(0) (0)
NI NI
V t pI t cV tV t pI t cV t
T t I tI t T t V t pI t I tT I
T t I tT tT I
Data was fitted by maximum likelihood method accounting for data below the quantitation limits.For the VK model without using a PK-PD approach, only a constant drug effectiveness, infected cell loss rate and baseline viral load were fitted. Loss rate of free virus c was fixed to 5/day, regeneration rate γ to 3/day, proliferation p to 3/day, and ribavirin effect ρ was 60%. Further parameters were obtained from steady state conditions before treatment started. For a full PK-PD approach, the same parameter assumptions were used; additionally, the rate a for the intermediate compartment was log (2)/2/day and the hill parameter was 1.
Downloaded From: http://jama.jamanetwork.com/ by Jules Levin on 08/28/2013
a
d
b
c Downloaded From: http://jama.jamanetwork.com/ by Jules Levin on 08/28/2013
PreTreatment
End ofTreatment
PreTreatment
End ofTreatment
0
5
10
15
HA
I Inf
lam
mat
ion
Scor
e
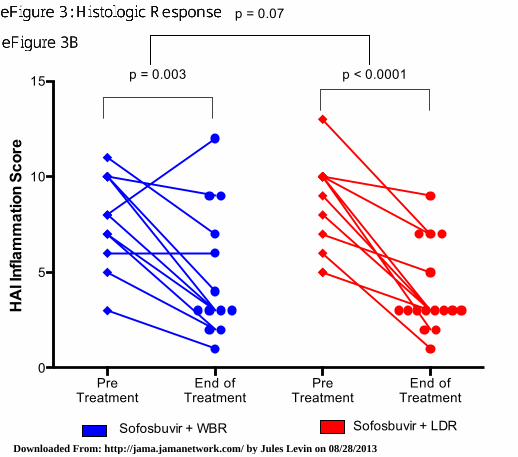
p < 0.0001p = 0.003
p = 0.07
Sofosbuvir + WBR Sofosbuvir + LDRDownloaded From: http://jama.jamanetwork.com/ by Jules Levin on 08/28/2013
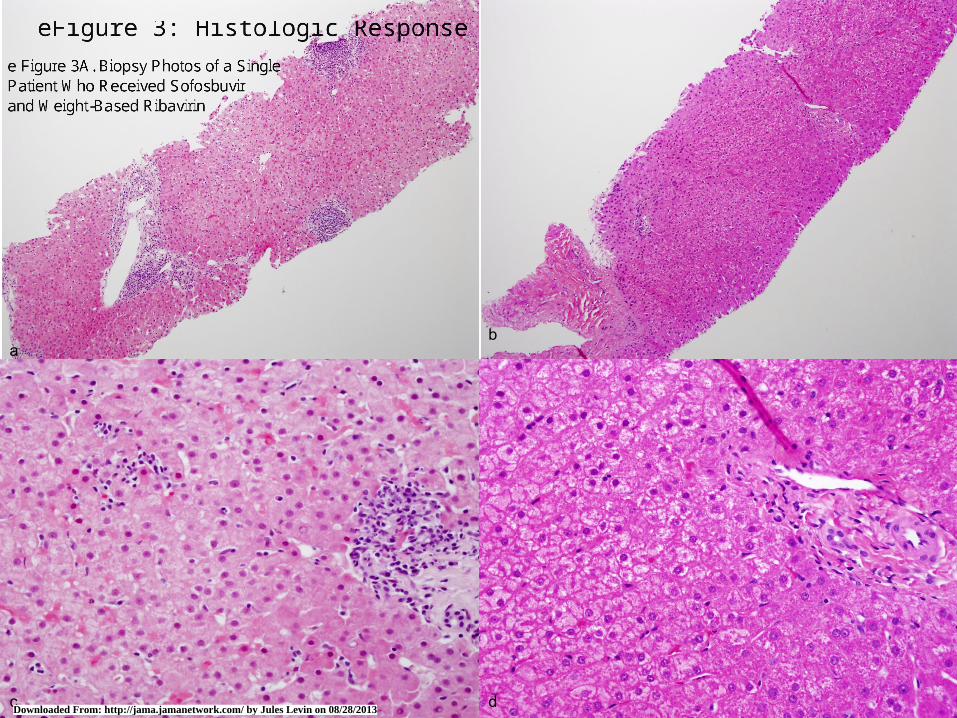
A: Biopsy photos of a single patient who received Sofosbuvir and weight-based RBV
a, c: Pre-treatment – There is moderate hepatitis, with dense portal inflammation, focal perivenular inflammation and multiple foci of spotty lobular inflammation (a: 100x; b: 400x)
b,d: Post-treatment- There is only mild portal inflammation without interface hepatitis. The foci of lobular inflammation were very rare. (c:100x; d:400x)
B: Change in Hepatic Inflammation at the end of treatment.
Twenty-nine participants had paired liver biopsies at the end of treatment.There was a significant improvement in the fibrosis scores at the end of treatment in all groups.This was not significantly different across groups.
WBR: Weight based ribavirin: 1000-1200mg/day;LDR Low dose ribavirin: 600mg/day,
Downloaded From: http://jama.jamanetwork.com/ by Jules Levin on 08/28/2013
Day 0 Day 3 Day 7 Day 10 Day 14 Week 3 Week 4 Week 60
20
40
60
80
100M
ean
ALT
Lev
el (U
/ L) Sofosbuvir+WBR Sofosbuvir+LDR
ULN
Time points on treatmentDownloaded From: http://jama.jamanetwork.com/ by Jules Levin on 08/28/2013
wk 4 wk 12 wk 240
20
40
60
80
100
Time points on treatment
% o
f sub
ject
s w
ith
Hgb
dro
p >
2g/d
L
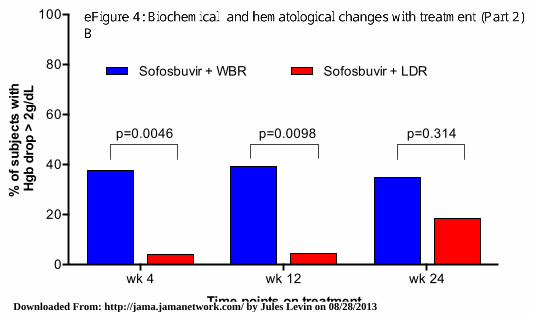
p=0.0046 p=0.314p=0.0098
Sofosbuvir + LDRSofosbuvir + WBR
Downloaded From: http://jama.jamanetwork.com/ by Jules Levin on 08/28/2013
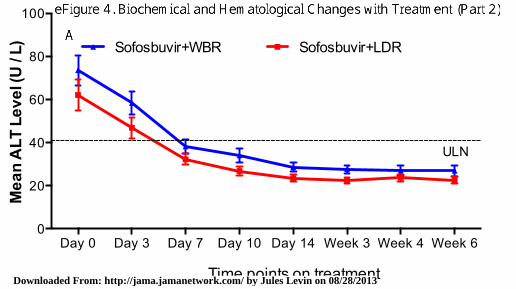
eFigure 4. Biochemical and Hematological Changes with Treatment (Part 2), legend ALT: Alaninine aminotransferase, ULN: Upper limit of normal 41U/L B: Hemoglobin decline over time. Percentage of participants who experienced a hemoglobin drop of >2g/dL by a certain timepoint. There was significantly higher proportion of participants on weight based RBVwho experienced Hgb drop >2g/dl at week 4 and week 12 compared to low dose RBV. Hgb: hemoglobin. WBR: Weight based ribavirin: 1000-1200mg/day; LDR Low dose ribavirin: 600mg/day,
Downloaded From: http://jama.jamanetwork.com/ by Jules Levin on 08/28/2013