Embed Size (px)
Citation preview
A. Knop-GerickeFritz-Haber-Institut der Max-Planck-Gesellschaft, Depertment of Inorganic Chemistry,
D-14195 Berlin, Germany
Subsurface Species in Heterogeneous Catalytic Reactions: Subsurface Species in Heterogeneous Catalytic Reactions: Insights by in situ Photoelectron SpectroscopyInsights by in situ Photoelectron Spectroscopy
Outline
• Technical aspects
• Methanol oxidation over Cu
• Ethylene Epoxidation over Ag
Collaborators
LBNL & ALS: D.F. Ogletree, G. Lebedev, H. BluhmZ. Hussain, C.S. Fadley, M. Salmeron
FHI: M. Hävecker, K. Ihmann, E. Kleimenov,D. Teschner, S. Zafeiratos, E. Vass, P. Schnörch R. Schlögl
Boreskov Inst. of Catalysis: V.I. Bukhtiyarov
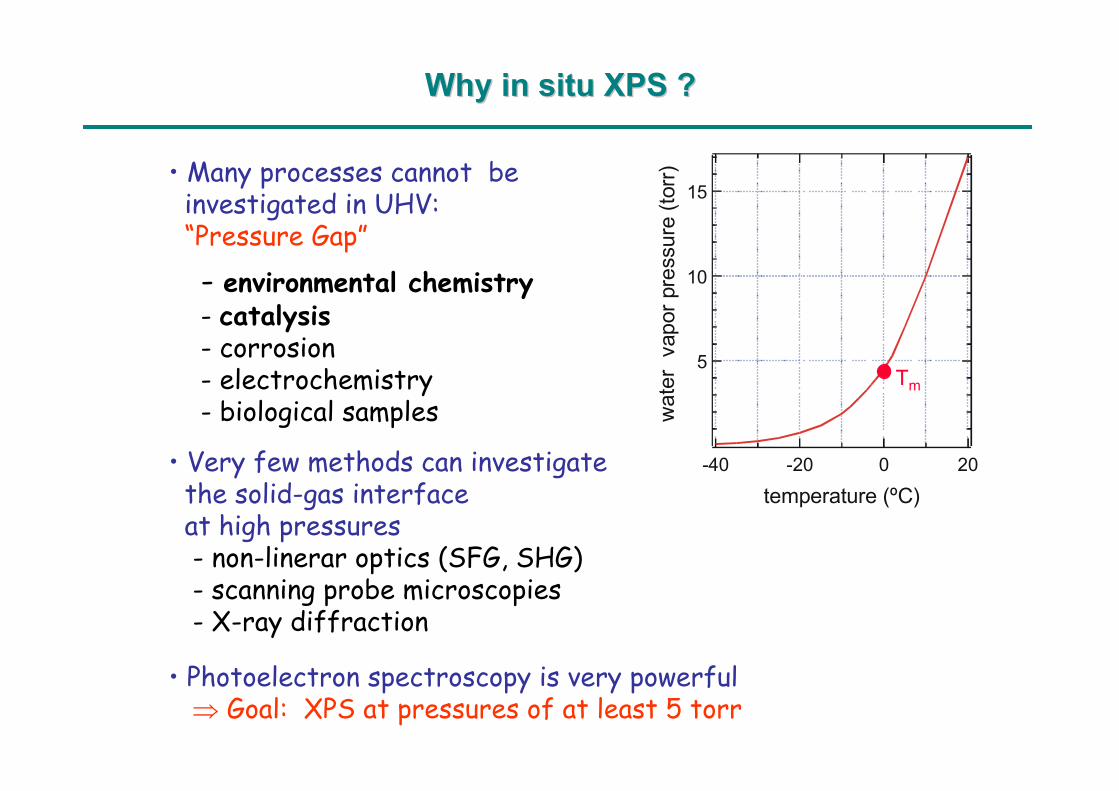
• Very few methods can investigatethe solid-gas interfaceat high pressures- non-linerar optics (SFG, SHG)- scanning probe microscopies- X-ray diffraction
Why in situ XPS ?Why in situ XPS ?
15
10
5
-40 -20 0 20
temperature (ºC)
vapo
rpr e
s sur
e(t o
r r)w
ater Tm
• Photoelectron spectroscopy is very powerful⇒ Goal: XPS at pressures of at least 5 torr
• Many processes cannot beinvestigated in UHV:“Pressure Gap”- environmental chemistry- catalysis- corrosion- electrochemistry- biological samples
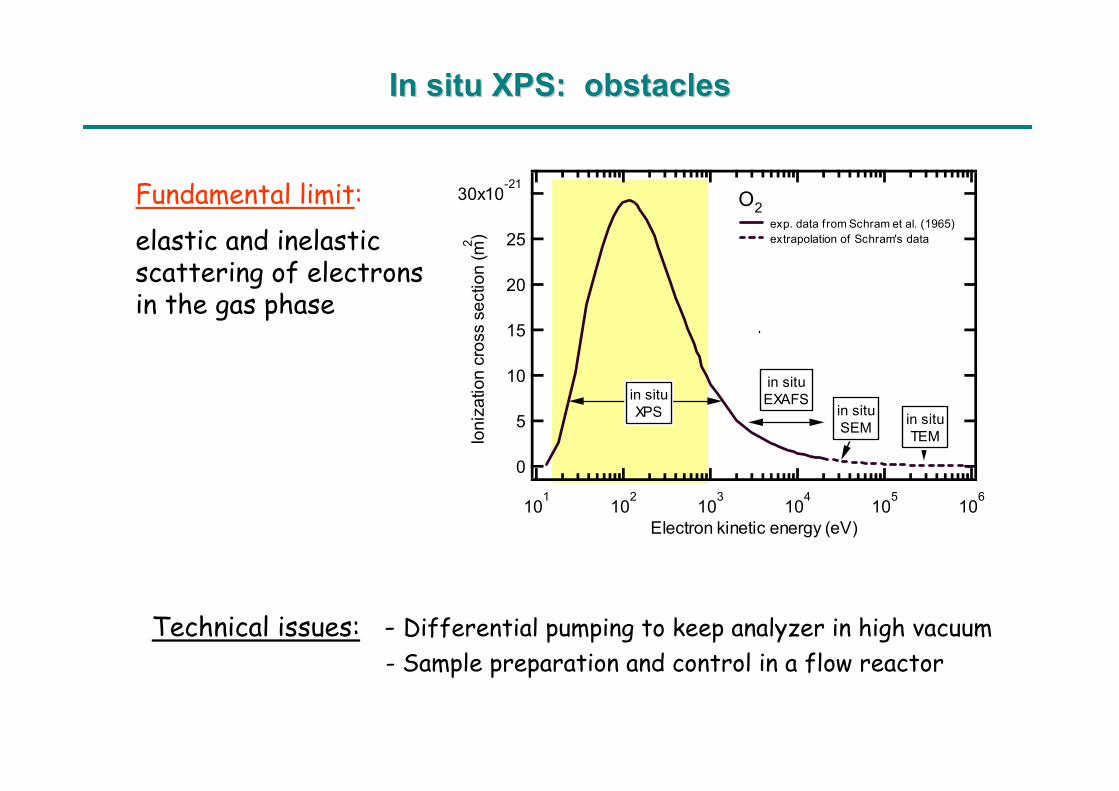
Fundamental limit:elastic and inelasticscattering of electronsin the gas phase
Technical issues: - Differential pumping to keep analyzer in high vacuum- Sample preparation and control in a flow reactor
In situ XPS: obstaclesIn situ XPS: obstacles
30x10-21
25
20
15
10
5
0Io
niza
tion
cros
s se
ctio
n (m
2 )
101
102
103
104
105
106
Electron kinetic energy (eV)
in situSEM in situ
TEM
in situEXAFSin situ
XPS
O2 exp. data from Schram et al. (1965) extrapolation of Schram's data
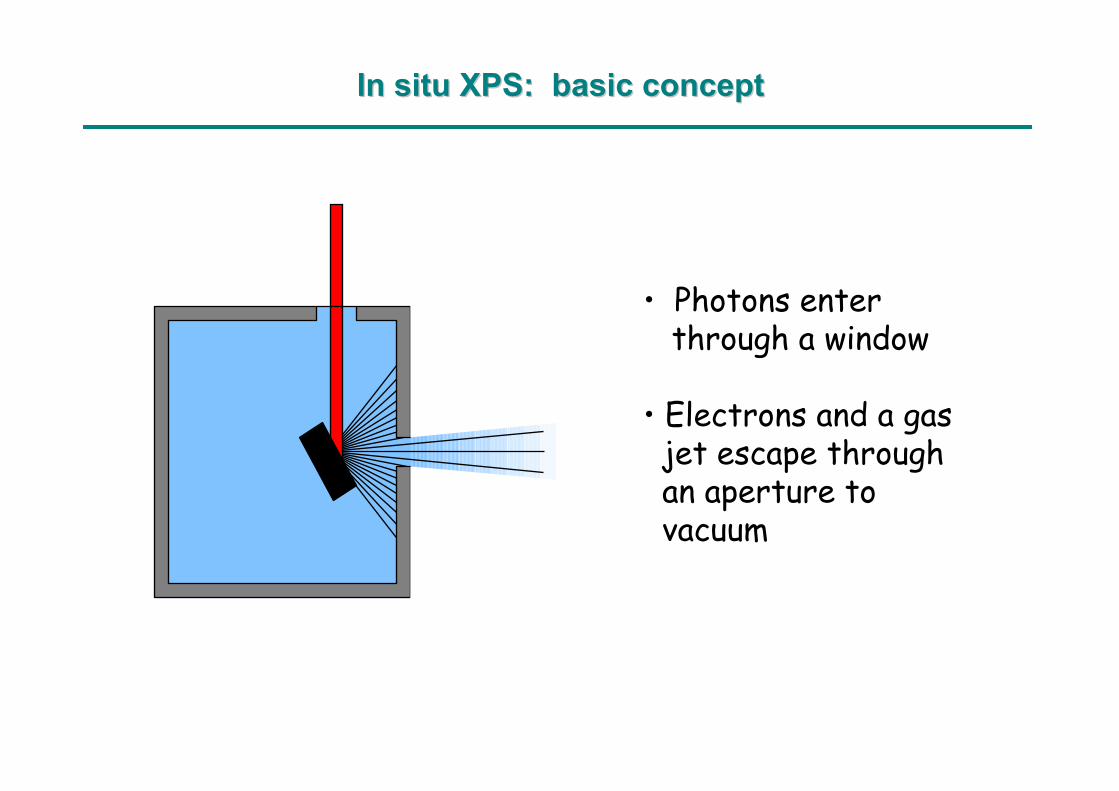
• Photons enterthrough a window
• Electrons and a gasjet escape throughan aperture tovacuum
In situ XPS: basic conceptIn situ XPS: basic concept
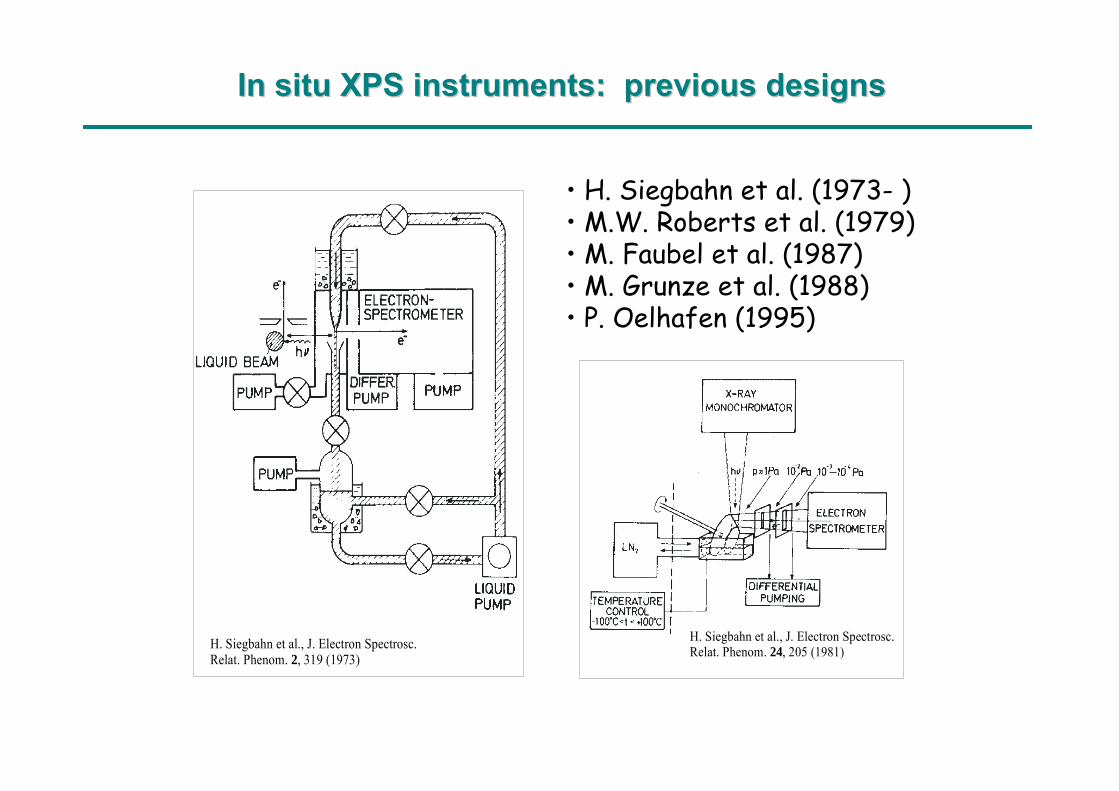
H. Siegbahn et al., J. Electron Spectrosc. Relat. Phenom. , 319 (1973)2
• H. Siegbahn et al. (1973- )• M.W. Roberts et al. (1979)• M. Faubel et al. (1987) • M. Grunze et al. (1988)• P. Oelhafen (1995)
H. Siegbahn et al., J. Electron Spectrosc. Relat. Phenom. , 205 (1981)24
In situ XPS instruments: previous designsIn situ XPS instruments: previous designs
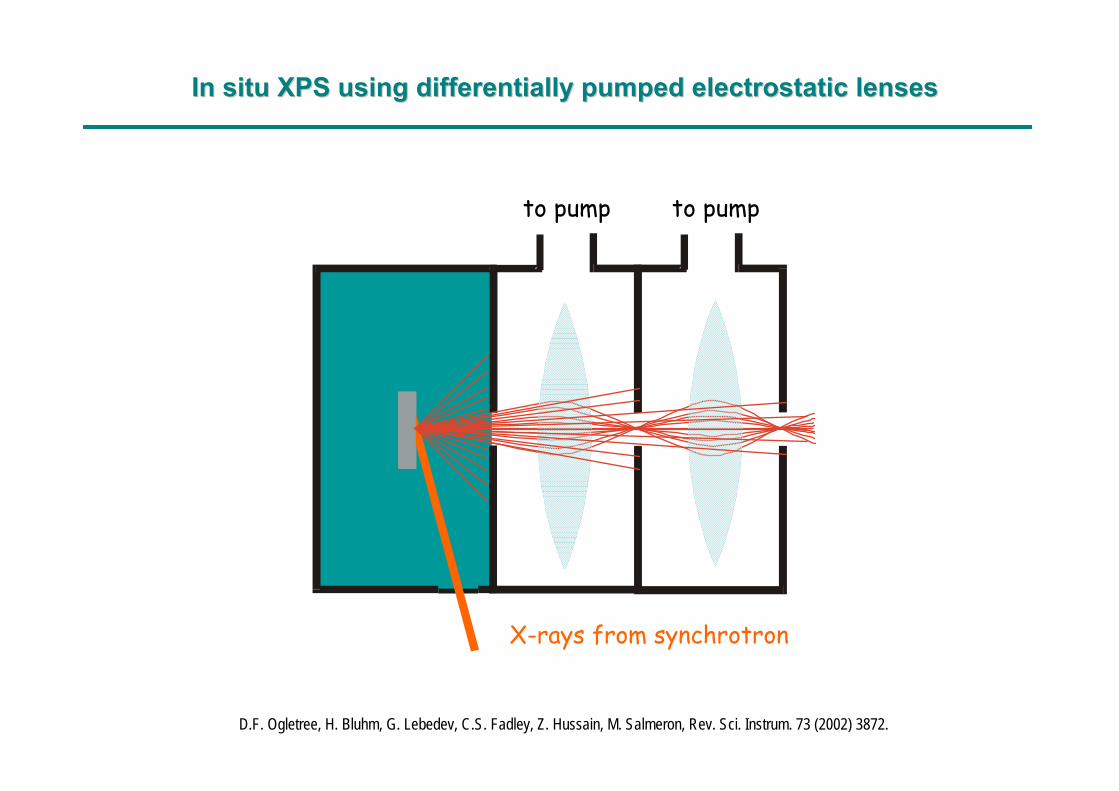
In situ XPS using differentially pumped electrostatic lensesIn situ XPS using differentially pumped electrostatic lenses
D.F. Ogletree, H. Bluhm, G. Lebedev, C.S. Fadley, Z. Hussain, M. Salmeron, Rev. Sci. Instrum. 73 (2002) 3872.
to pump to pump
X-rays from synchrotron
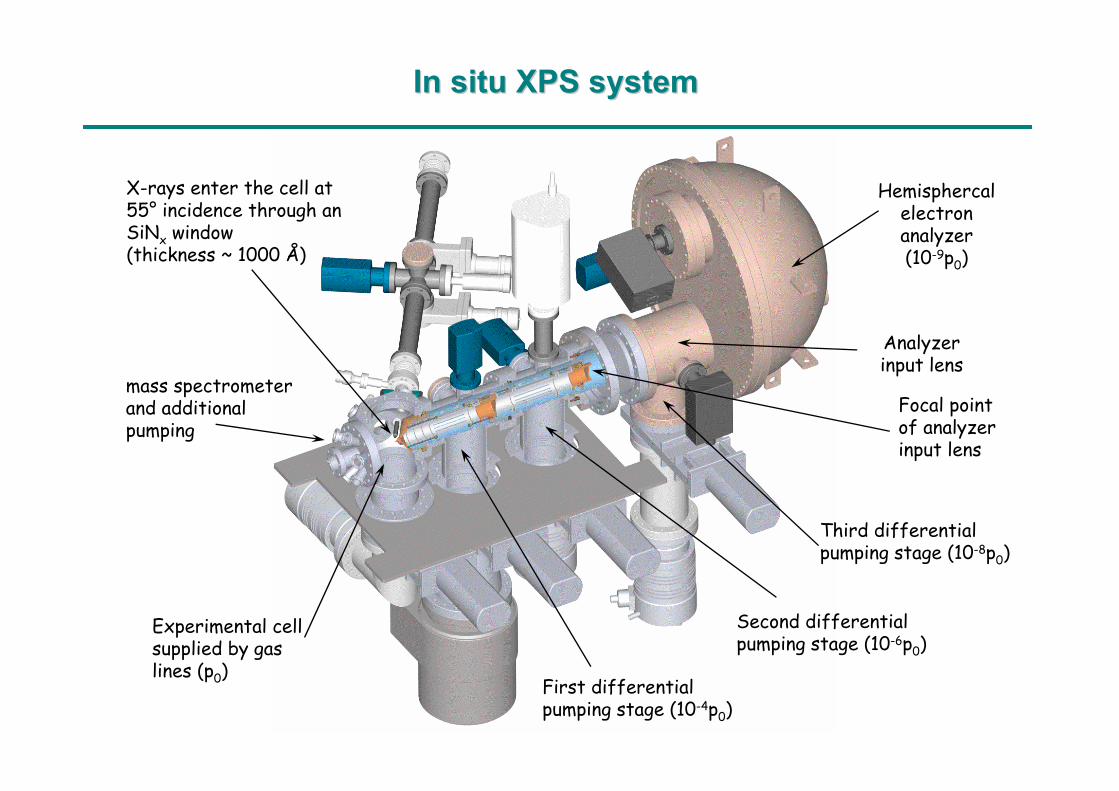
In situ XPS systemIn situ XPS system
Experimental cellsupplied by gas lines (p0)
X-rays enter the cell at 55° incidence through an SiNx window(thickness ~ 1000 Å)
Analyzerinput lens
Focal point of analyzerinput lens
First differentialpumping stage (10-4p0)
Second differentialpumping stage (10-6p0)
Third differentialpumping stage (10-8p0)
Hemisphercalelectronanalyzer(10-9p0)
mass spectrometerand additional pumping
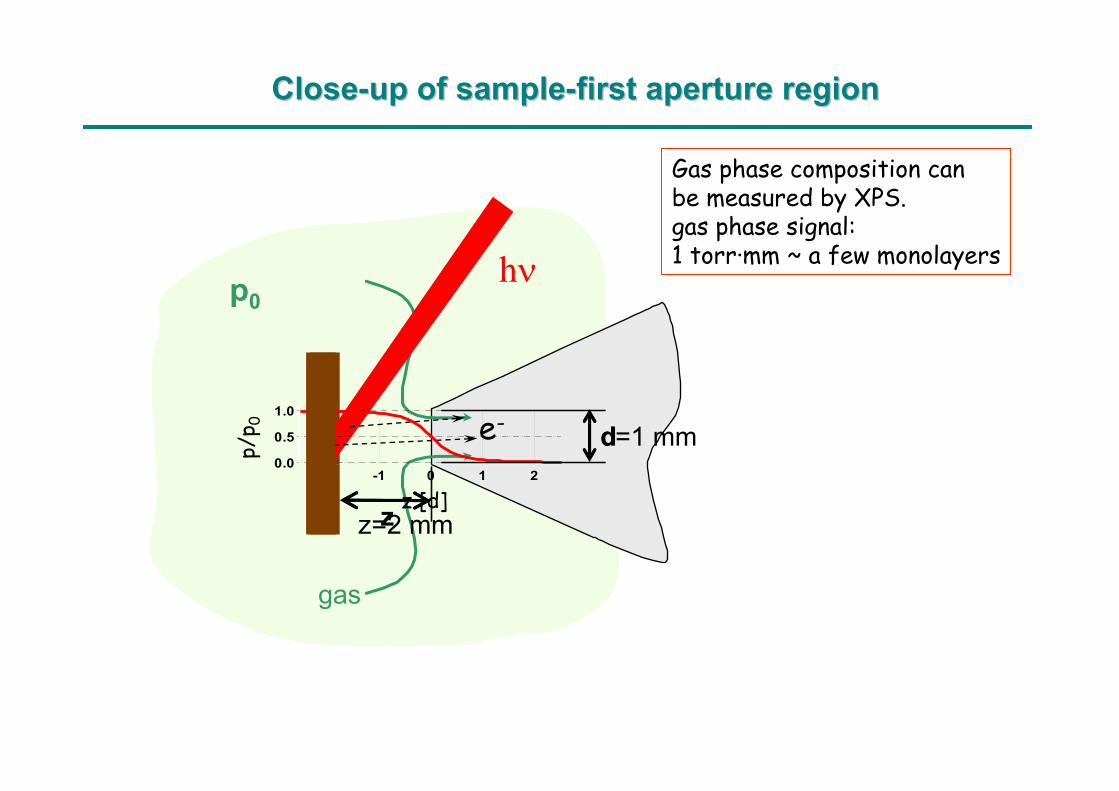
Gas phase composition canbe measured by XPS.gas phase signal: 1 torr·mm ~ a few monolayers
CloseClose--up of sampleup of sample--first aperture regionfirst aperture region
gas
z
d
hν
e-
p0
1.0
0.5
0.0-2 -1 0 1 2
z [d]
p/p 0
z=2 mm
d=1 mm

Gas Flow systemGas Flow system
gas1
gasn
LV /MFCn n
Vg
QMS
TPMS
PTRMS
air
BP TPPTP1
DS1
A0 A1
SCh
LVQMS
LVP
LVm1
LVm2
VP
VSCh
LV /MFC1 1
QMS
1 bar1 bar
1010--66 mbarmbar1010--66 mbarmbar
Gas Phase analysisGas Phase analysis
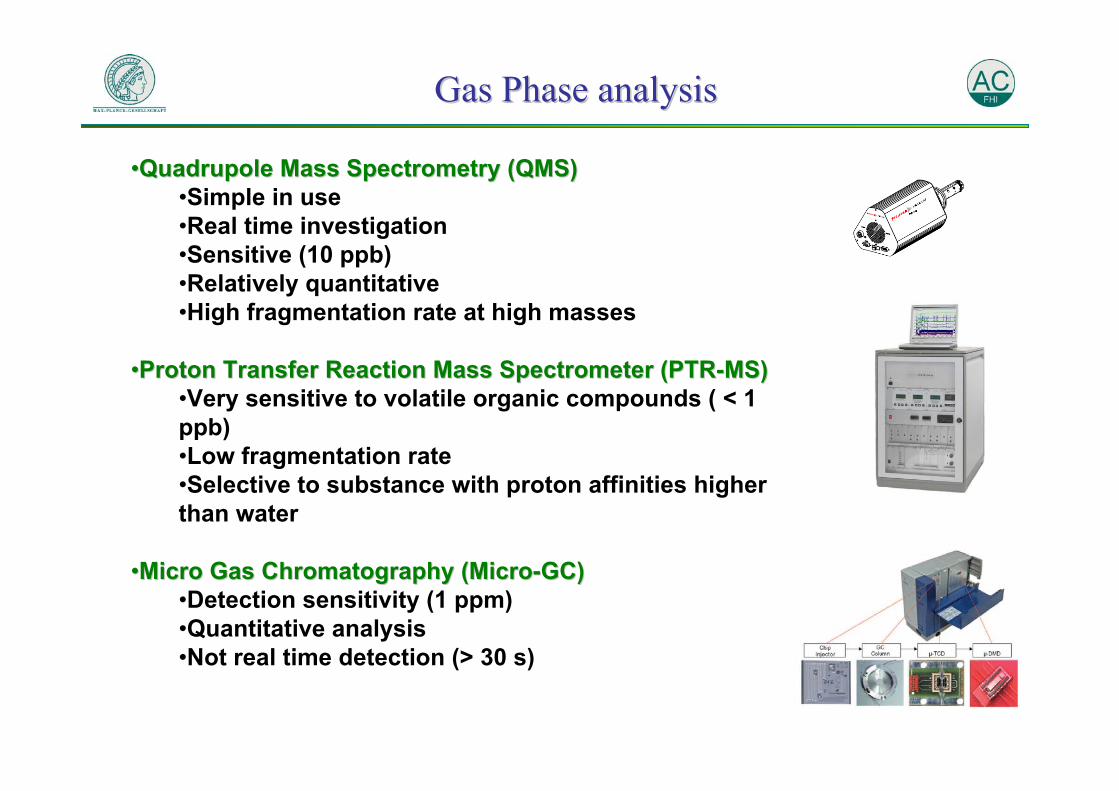
••Quadrupole Mass Spectrometry (QMS)Quadrupole Mass Spectrometry (QMS)•Simple in use•Real time investigation•Sensitive (10 ppb)•Relatively quantitative•High fragmentation rate at high masses
••Proton Transfer Reaction Mass Spectrometer (PTRProton Transfer Reaction Mass Spectrometer (PTR--MS)MS)•Very sensitive to volatile organic compounds ( < 1 ppb)•Low fragmentation rate•Selective to substance with proton affinities higher than water
••Micro Gas Chromatography (MicroMicro Gas Chromatography (Micro--GC)GC)•Detection sensitivity (1 ppm)•Quantitative analysis•Not real time detection (> 30 s)
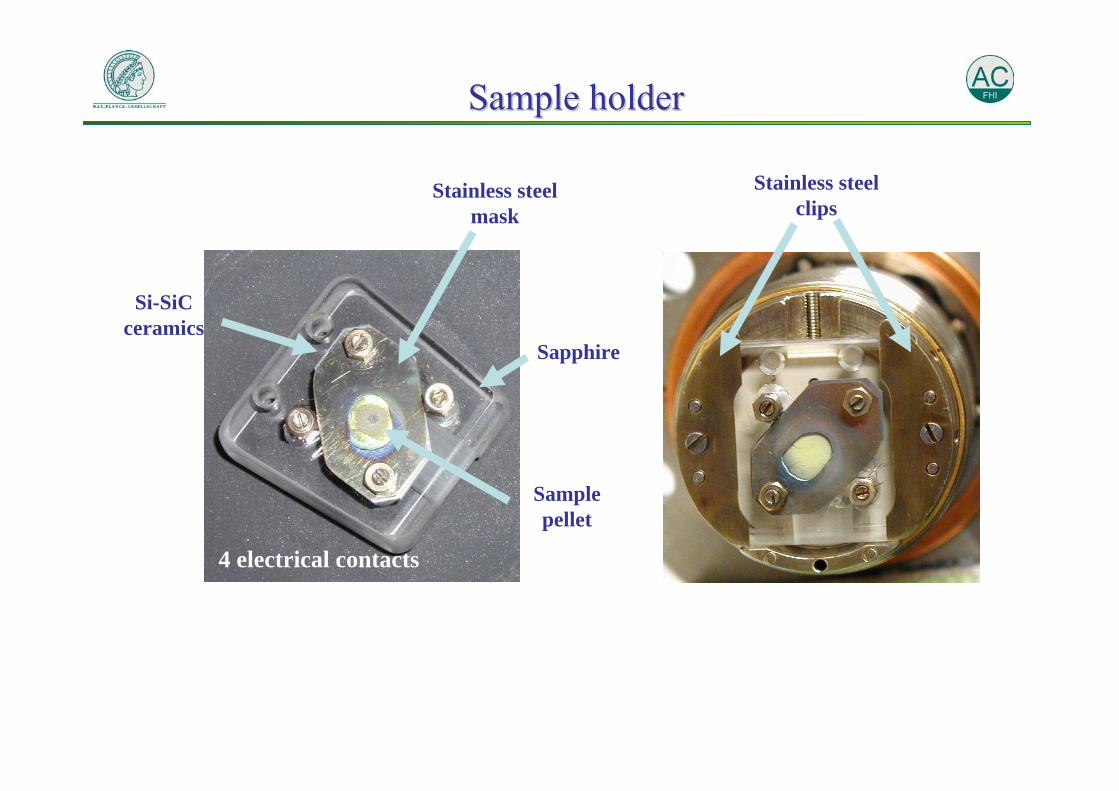
Sample holderSample holder
Sapphire
Stainless steel mask
Si-SiCceramics
Sample pellet
Stainless steel clips
4 electrical contacts
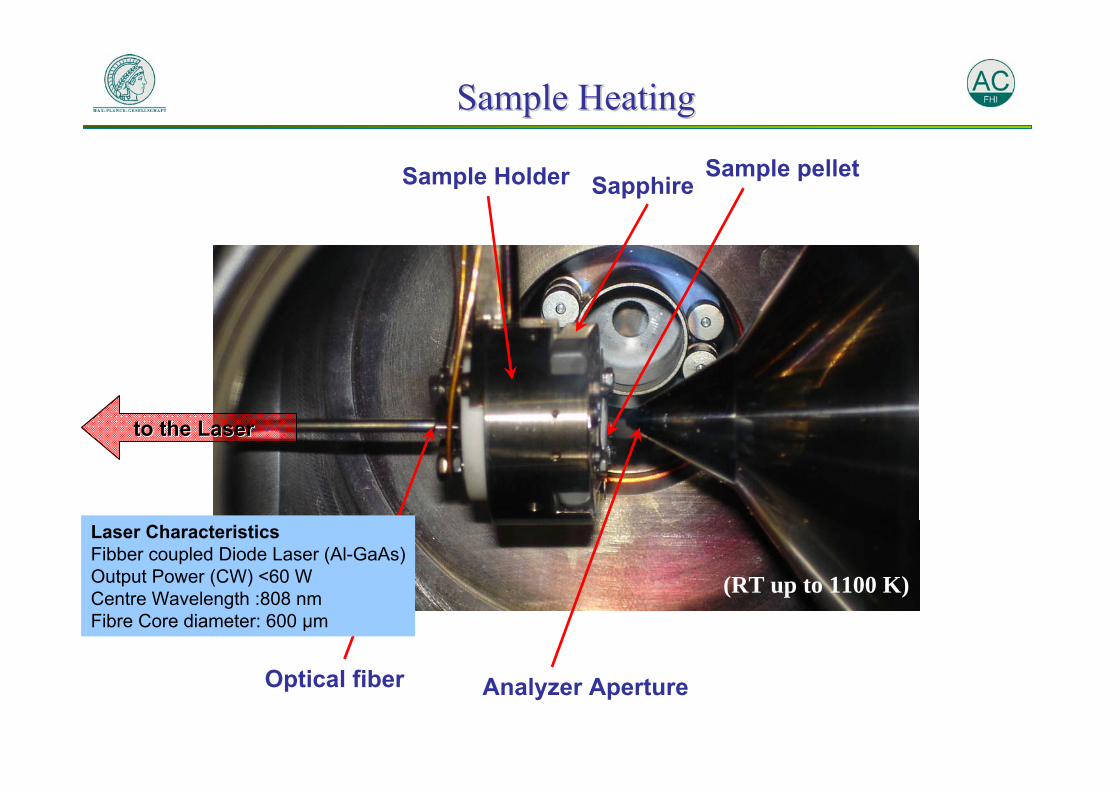
Sample HeatingSample Heating
to the Laser to the Laser
Laser CharacteristicsFibber coupled Diode Laser (Al-GaAs)Output Power (CW) <60 WCentre Wavelength :808 nmFibre Core diameter: 600 μm
Optical fiber Analyzer Aperture
Sample pelletSapphireSample Holder
(RT up to 1100 K)
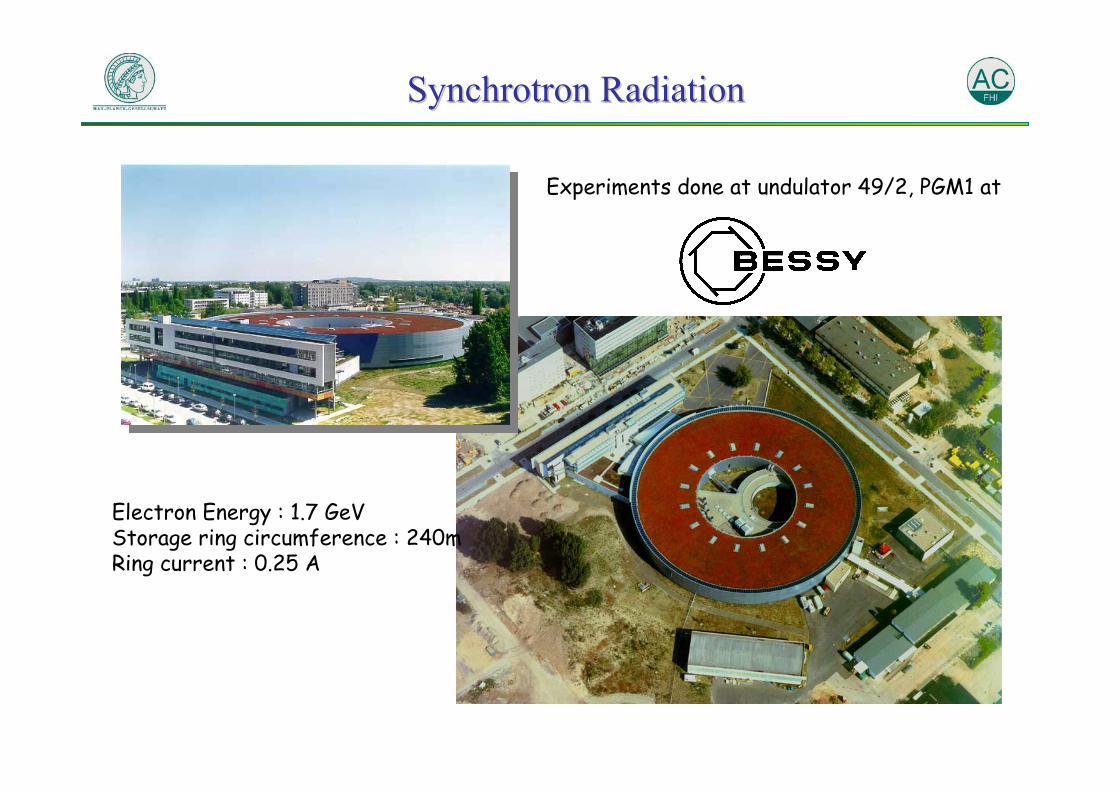
Experiments done at undulator 49/2, PGM1 at
Electron Energy : 1.7 GeVStorage ring circumference : 240mRing current : 0.25 A
Synchrotron RadiationSynchrotron Radiation
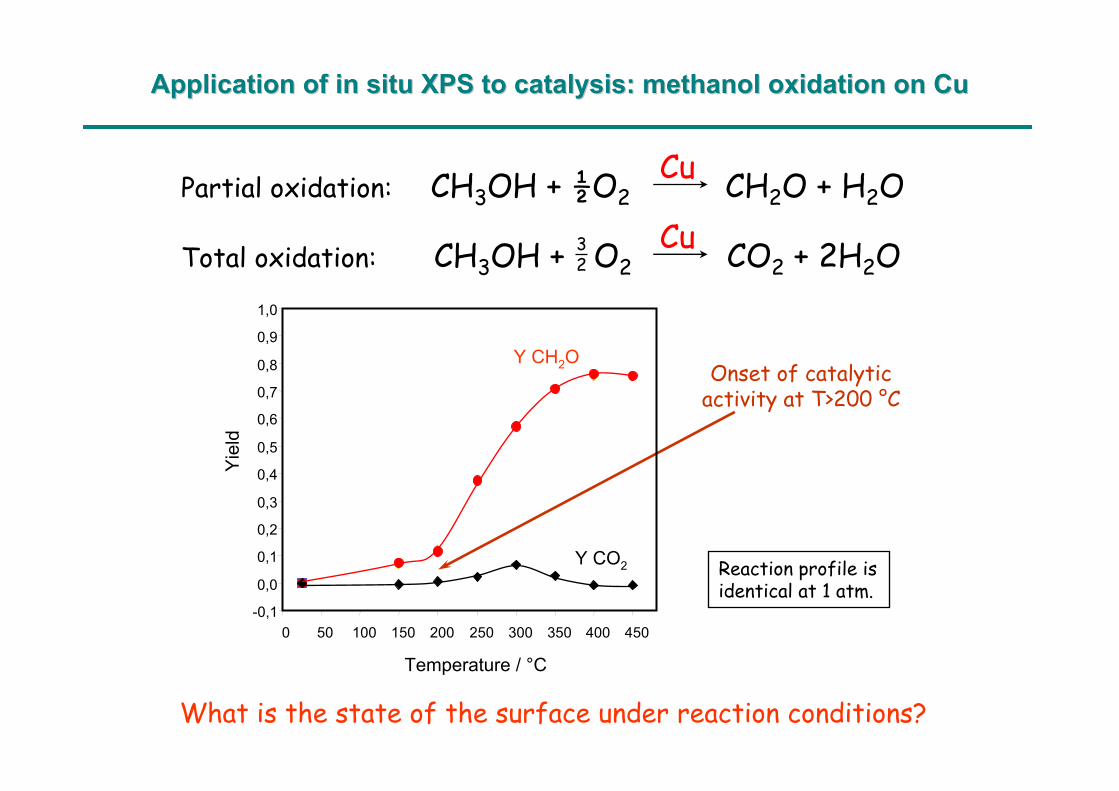
Partial oxidation: CH3OH + ½O2 CH2O + H2O
Total oxidation: CH3OH + O2 CO2 + 2H2O
Cu
Cu32
What is the state of the surface under reaction conditions?
Application of in situ XPS to catalysis: methanol oxidation on CApplication of in situ XPS to catalysis: methanol oxidation on Cuu
Reaction profile isidentical at 1 atm.
Onset of catalyticactivity at T>200 °C
-0,1
0,0
0,1
0,2
0,3
0,4
0,5
0,6
0,7
0,8
0,9
1,0
0 50 100 150 200 250 300 350 400 450
Temperature / °C
Yie
ld
Y CH2O
Y CO2
CO + H O2 2
CH O+ H2 2O
O+ O
CH OH3
CH OH3
CH OH3
CO+ H2
CH O+ H2 2
O2
Cu 0
Oxsurf
Oxbulk
Subox
Ovol
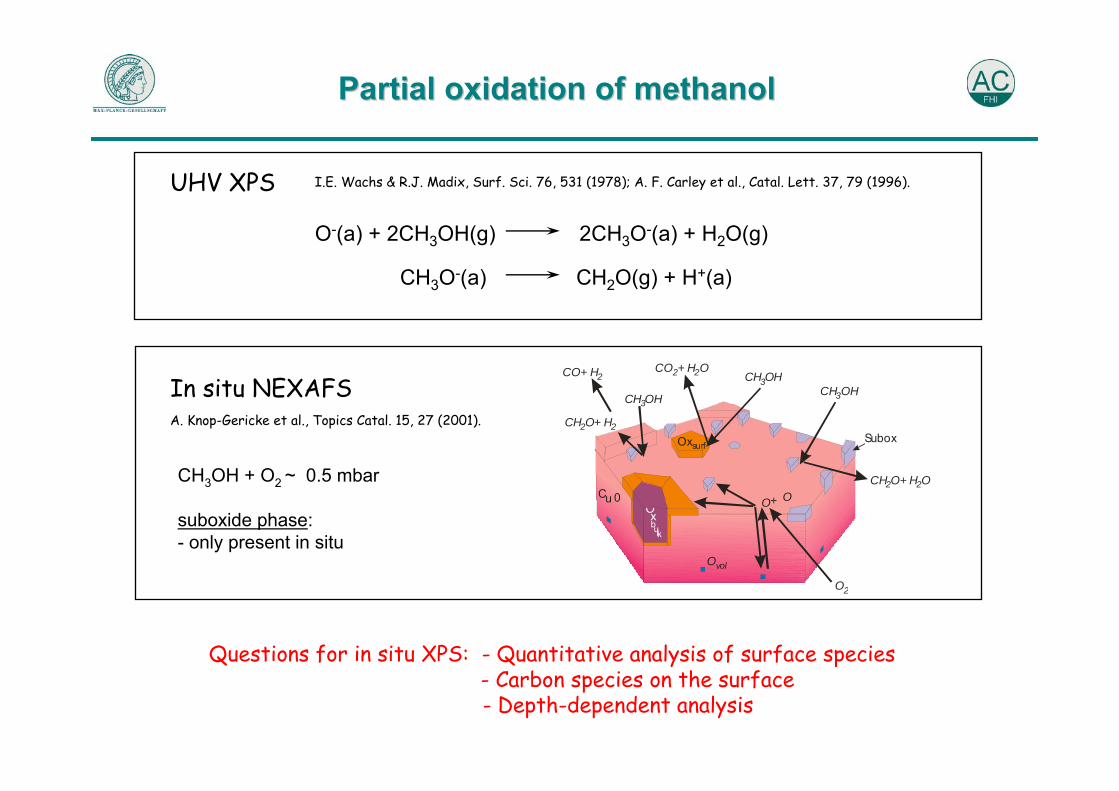
A. Knop-Gericke et al., Topics Catal. 15, 27 (2001).
In situ NEXAFS
I.E. Wachs & R.J. Madix, Surf. Sci. 76, 531 (1978); A. F. Carley et al., Catal. Lett. 37, 79 (1996).UHV XPS
O-(a) + 2CH3OH(g) 2CH3O-(a) + H2O(g)
CH3O-(a) CH2O(g) + H+(a)
Questions for in situ XPS: - Quantitative analysis of surface species- Carbon species on the surface- Depth-dependent analysis
CH3OH + O2 ~ 0.5 mbar
suboxide phase: - only present in situ
Partial oxidation of methanolPartial oxidation of methanol
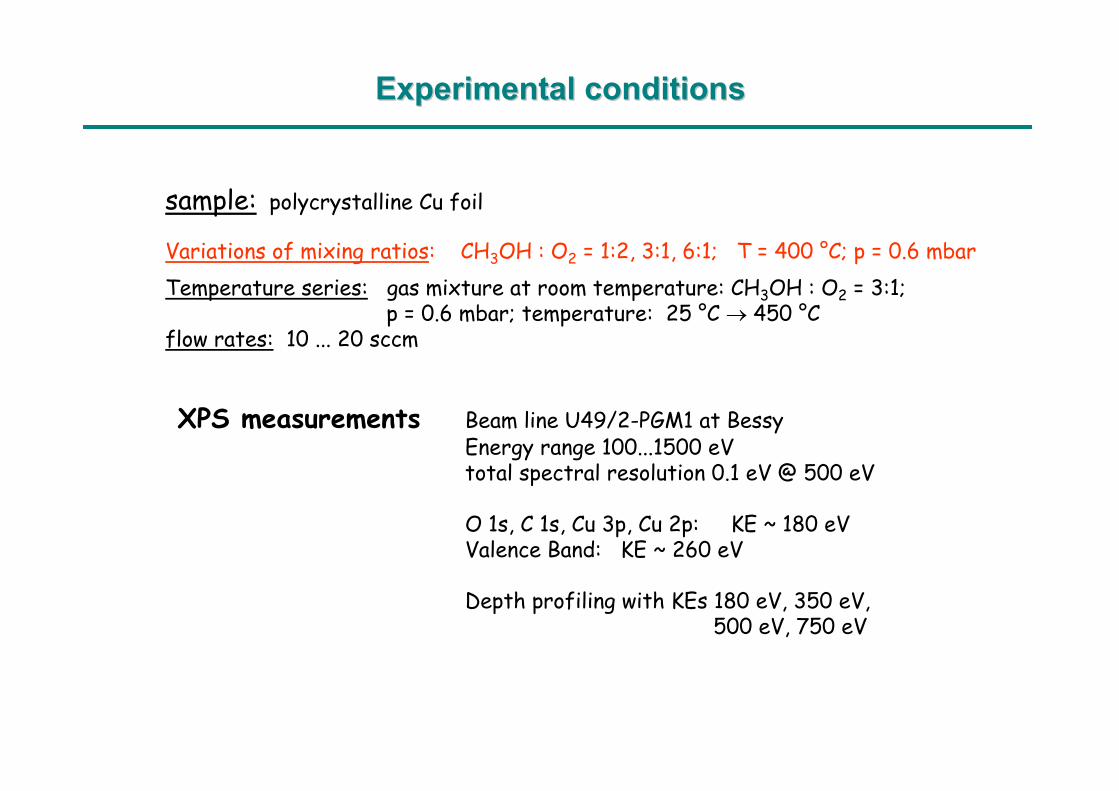
Experimental conditionsExperimental conditions
sample: polycrystalline Cu foil
Variations of mixing ratios: CH3OH : O2 = 1:2, 3:1, 6:1; T = 400 °C; p = 0.6 mbarTemperature series: gas mixture at room temperature: CH3OH : O2 = 3:1;
p = 0.6 mbar; temperature: 25 °C → 450 °Cflow rates: 10 ... 20 sccm
XPS measurements Beam line U49/2-PGM1 at BessyEnergy range 100...1500 eVtotal spectral resolution 0.1 eV @ 500 eV
O 1s, C 1s, Cu 3p, Cu 2p: KE ~ 180 eVValence Band: KE ~ 260 eV
Depth profiling with KEs 180 eV, 350 eV,500 eV, 750 eV
8 6 4 2 0 -2Binding energy (eV)
VB
Δ ~ 2 eV
160
140
120
100
80
60
40
20
0
Nor
mal
ized
cou
nt ra
te (c
ps/m
A)
542 540 538 536 534 532 530 528 526
Binding energy (eV)
CH
3OH
(g)
CH
2O (g
)H
2O (g
)
CO
2(g
)
O2 (g) Cu2O
?
?
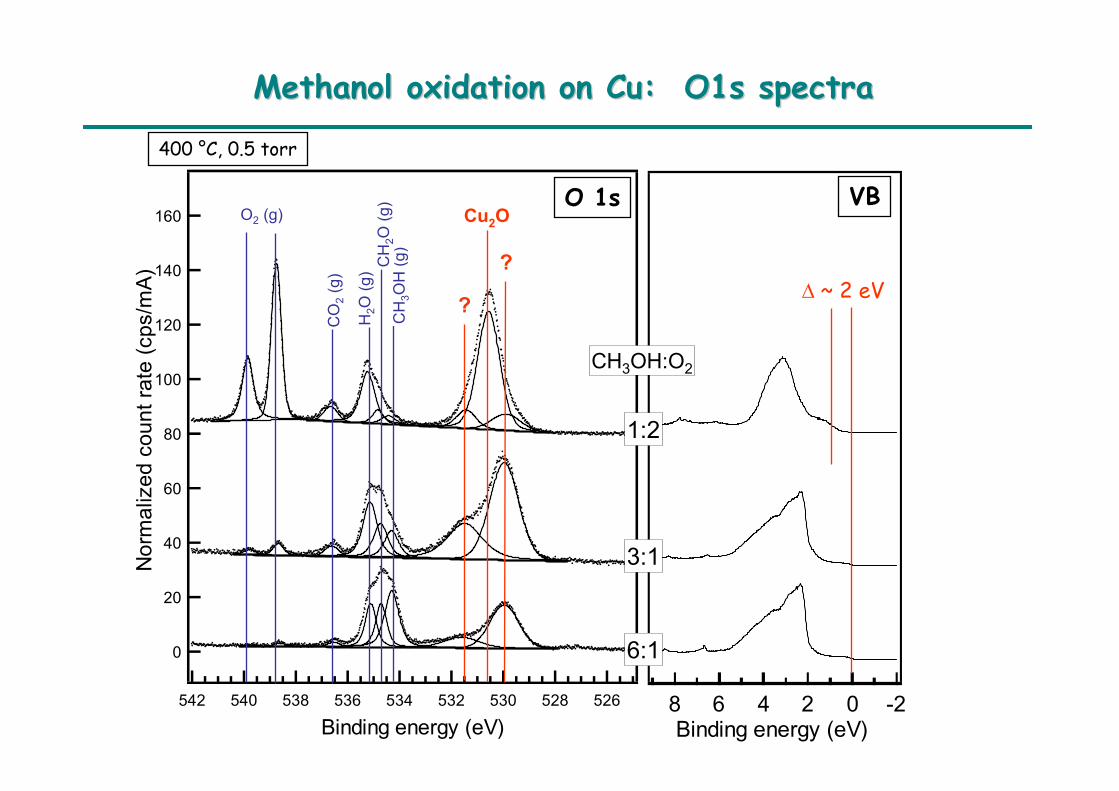
Methanol oxidation on Cu: O1s spectraMethanol oxidation on Cu: O1s spectra
400 °C, 0.5 torr
CH3OH:O2
1:2
3:1
6:1
O 1s
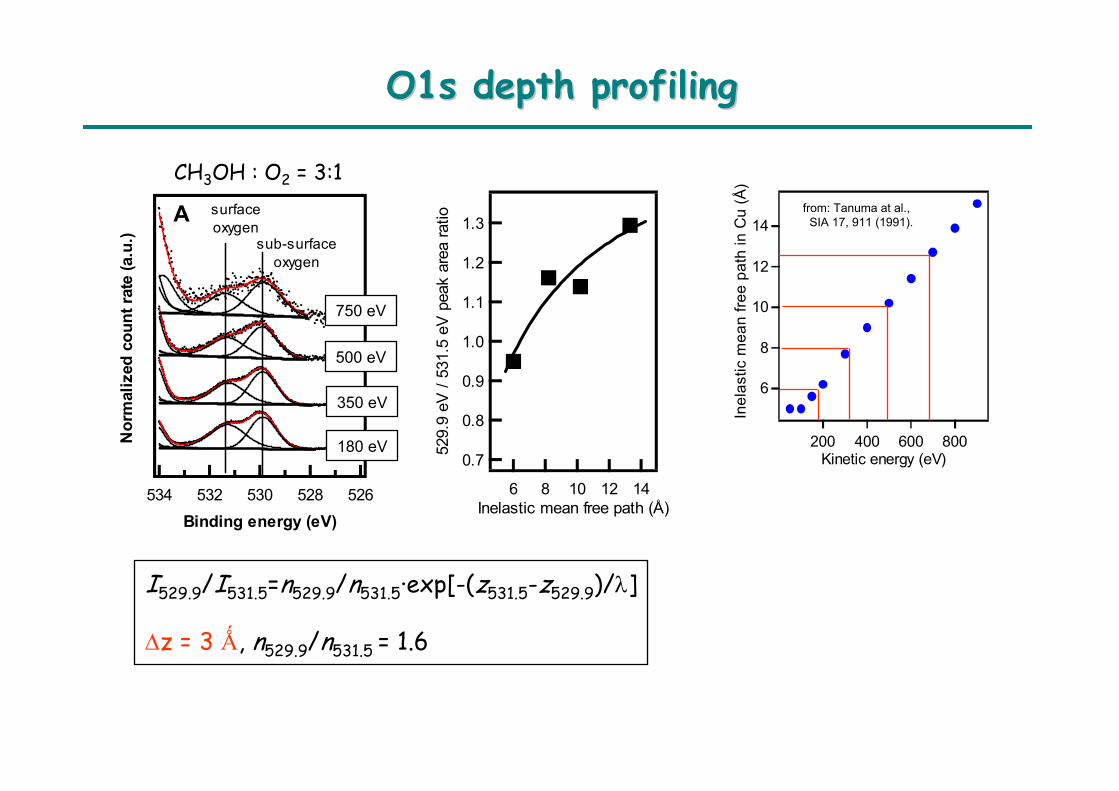
O1s depth profilingO1s depth profiling
1.3
1.2
1.1
1.0
0.9
0.8
0.7529.
9 eV
/ 53
1.5
eV p
eak
area
ratio
14121086Inelastic mean free path (Å)
I529.9/I531.5=n529.9/n531.5·exp[-(z531.5-z529.9)/λ]
Δz = 3 Ǻ, n529.9/n531.5 = 1.6
14
12
10
8
6
Inel
astic
mea
n fre
e pa
th in
Cu
(Å)
800600400200Kinetic energy (eV)
from: Tanuma at al., SIA 17, 911 (1991).
CH3OH : O2 = 3:1
Nor
mal
ized
cou
nt ra
te (a
.u.)
534 532 530 528 526Binding energy (eV)
sub-surfaceoxygen
surfaceoxygen
A
180 eV
350 eV
500 eV
750 eV
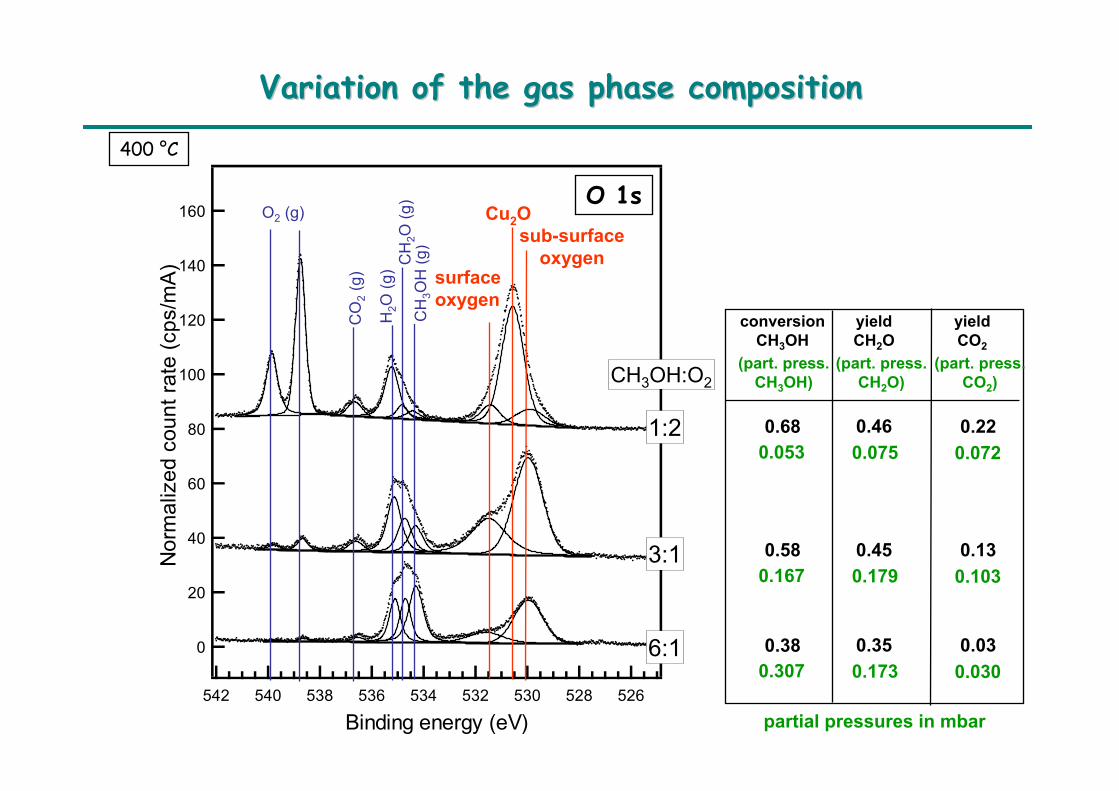
Variation of the gas phase compositionVariation of the gas phase composition
160
140
120
100
80
60
40
20
0
Nor
mal
ized
cou
nt ra
te (c
ps/m
A)
542 540 538 536 534 532 530 528 526
Binding energy (eV)
CH
3OH
(g)
CH
2O (g
)H
2O (g
)
CO
2(g
)
O2 (g) Cu2Osub-surface
oxygensurfaceoxygen
400 °C
CH3OH:O2
1:2
3:1
6:1
O 1s
conversionCH3OH
yieldCH2O
yieldCO2
0.68
0.58
0.38
0.46
0.45
0.35 0.03
0.13
0.22
(part. press.CH3OH)
(part. press.CH2O)
(part. press.CO2)
0.030
0.103
0.072
0.173
0.179
0.075
0.307
0.167
0.053
partial pressures in mbar
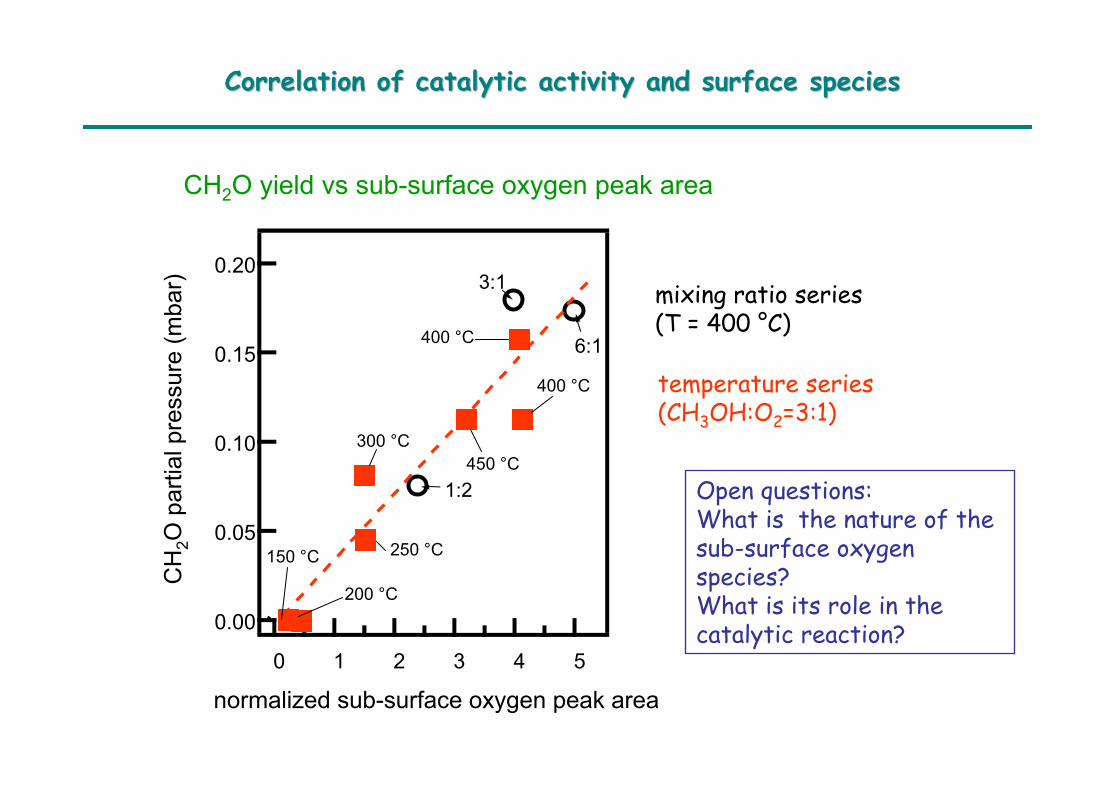
Correlation of catalytic activity and surface speciesCorrelation of catalytic activity and surface species
CH2O yield vs sub-surface oxygen peak area
0.20
0.15
0.10
0.05
0.00
543210
normalized sub-surface oxygen peak area
1:2
3:1
6:1
CH
2O p
artia
l pre
ssur
e(m
bar) mixing ratio series
(T = 400 °C)
250 °C
300 °C
400 °C
450 °C
400 °C
150 °C
200 °C
temperature series(CH3OH:O2=3:1)
Open questions: What is the nature of thesub-surface oxygenspecies?What is its role in thecatalytic reaction?
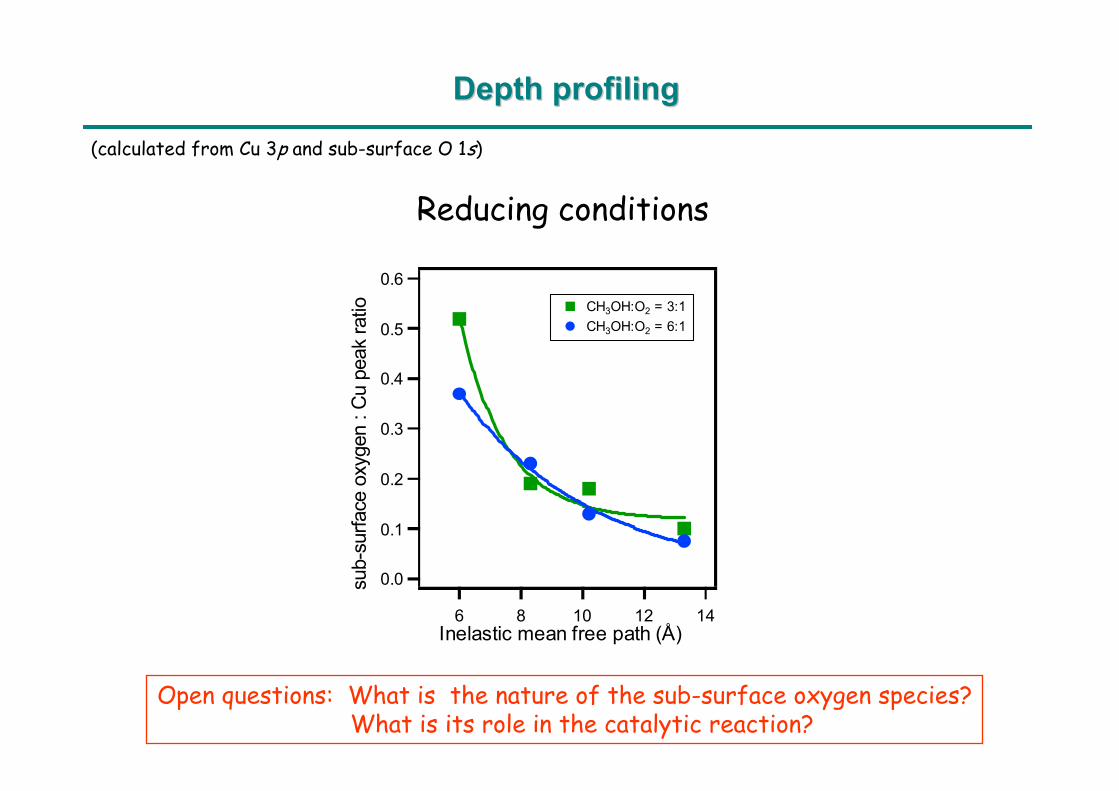
Depth profilingDepth profiling
0.6
0.5
0.4
0.3
0.2
0.1
0.0sub-
surfa
ce o
xyge
n : C
u pe
ak ra
tio
14121086Inelastic mean free path (Å)
CH3OH:O2 = 3:1CH3OH:O2 = 6:1
(calculated from Cu 3p and sub-surface O 1s)
Reducing conditions
Open questions: What is the nature of the sub-surface oxygen species?What is its role in the catalytic reaction?
160
140
120
100
80
60
40
20
0
Nor
mal
ized
cou
nt ra
te (c
ps/m
A)
542 540 538 536 534 532 530 528 526
Binding energy (eV)
CH
3OH
(g)
CH
2O (g
)H
2O (g
)
CO
2(g
)
O2 (g) Cu2O
?
?
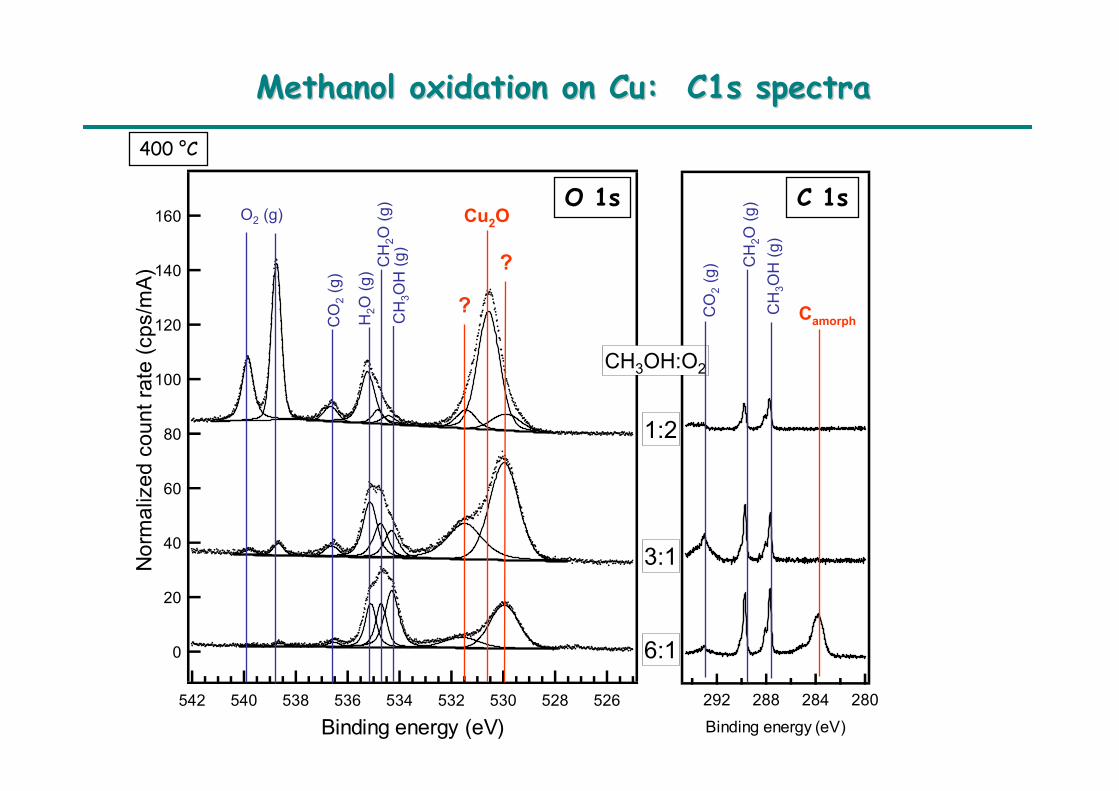
Methanol oxidation on Cu: C1s spectraMethanol oxidation on Cu: C1s spectra
O 1s
292 288 284 280Binding energy (eV)
CH3OH:O2
1:2
3:1
6:1
CO
2(g
)
CH
3OH
(g)
CH
2O (g
)
Camorph
C 1s
400 °C
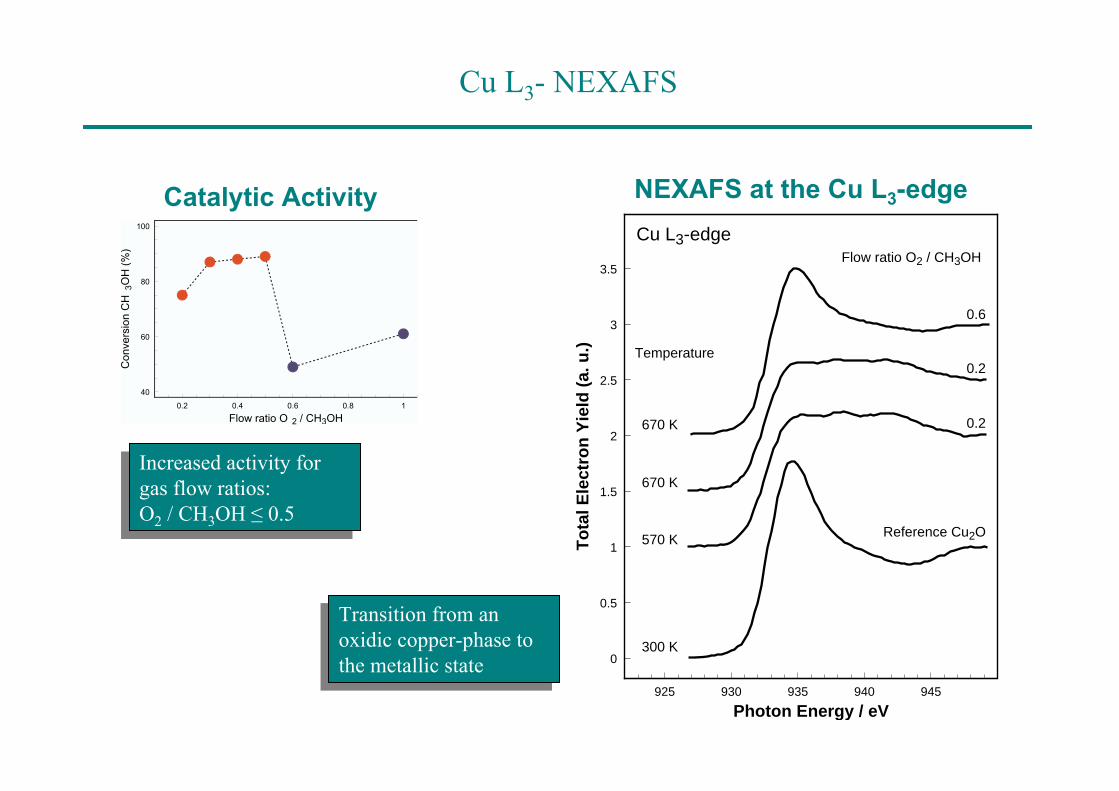
Cu L3- NEXAFS
Increased activity forgas flow ratios:O2 / CH3OH ≤ 0.5
Increased activity forgas flow ratios:O2 / CH3OH ≤ 0.5
0.2 0.4 0.6 0.8 1
Flow ratio O 2 / CH3OH
40
60
80
100
Con
vers
ion
CH
3OH
(%)
925 930 935 940 945
Photon Energy / eV
0
0.5
1
1.5
2
2.5
3
3.5
To
tal E
lect
ron
Yie
ld (
a. u
.)
Flow ratio O2 / CH3OH
0.6
0.2
0.2
Reference Cu2O
300 K
570 K
670 K
670 K
Temperature
Cu L3-edge
Catalytic Activity NEXAFS at the Cu L3-edge
Transition from an oxidic copper-phase to the metallic state
Transition from an oxidic copper-phase to the metallic state
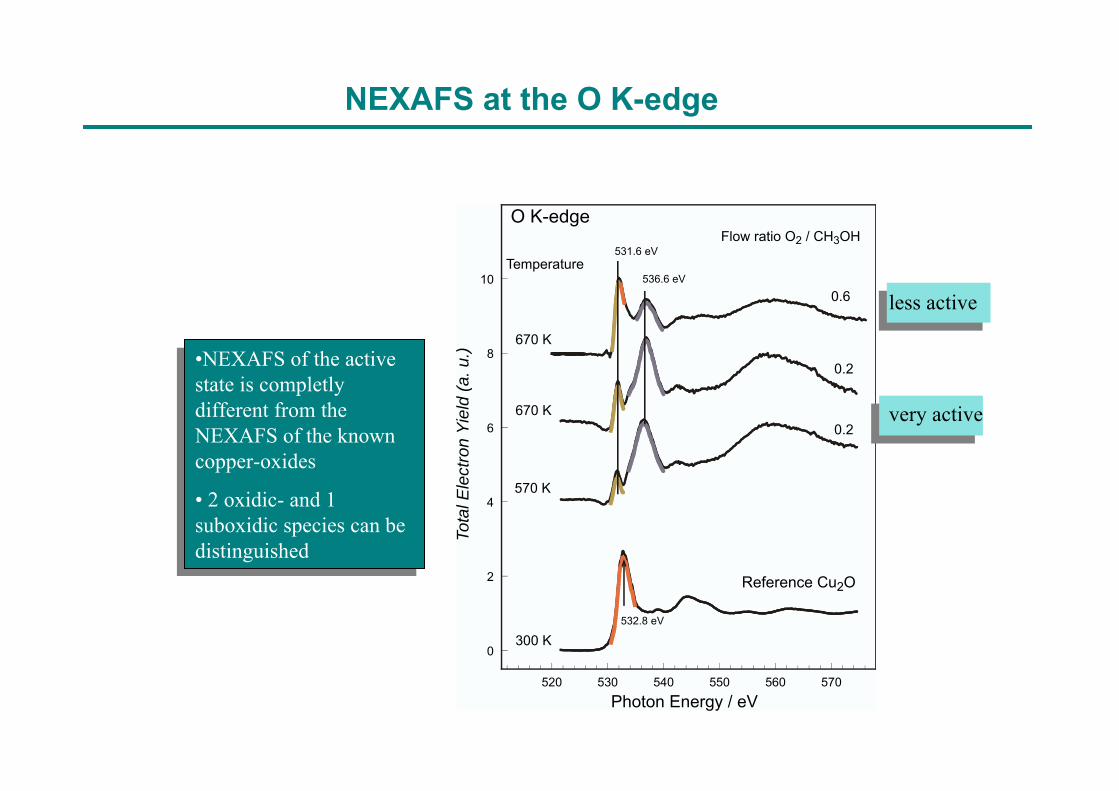
•NEXAFS of the activestate is completlydifferent from theNEXAFS of the knowncopper-oxides
• 2 oxidic- and 1 suboxidic species can bedistinguished
•NEXAFS of the activestate is completlydifferent from theNEXAFS of the knowncopper-oxides
• 2 oxidic- and 1 suboxidic species can bedistinguished
520 530 540 550 560 570
Photon Energy / eV
0
2
4
6
8
10
Tota
l Ele
ctro
n Yi
eld
(a. u
.)
O K-edge
Reference Cu2O
300 K
570 K
670 K
Temperature
532.8 eV
531.6 eV
536.6 eV
Flow ratio O2 / CH3OH
670 K
0.6
0.2
0.2
NEXAFS at the O K-edge
less active
very active
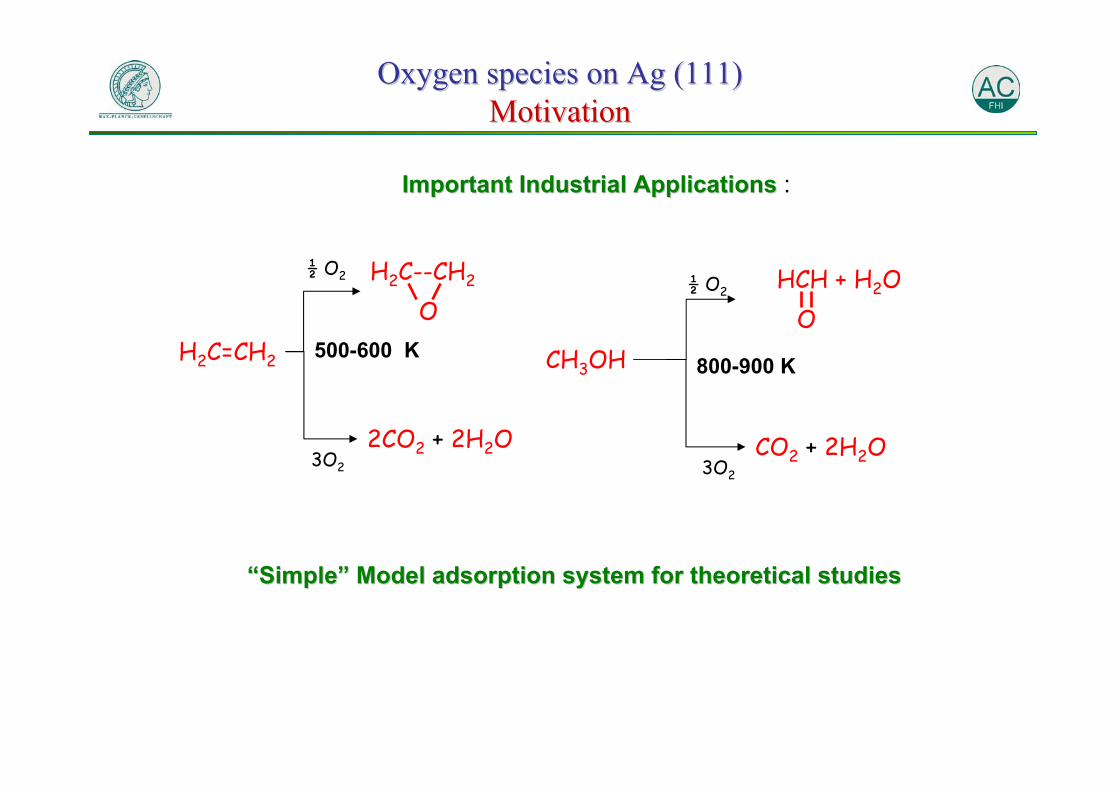
Oxygen species on Ag (111)Oxygen species on Ag (111)MotivationMotivation
Important Industrial Applications Important Industrial Applications :
H2C=CH2
H2C--CH2
O
2CO2 + 2H2O
½ O2
3O2
500-600 K
3O2
CH3OH
CO2 + 2H2O
HCH + H2OO
800-900 K
½ O2
““SimpleSimple”” Model adsorption system for theoretical studiesModel adsorption system for theoretical studies
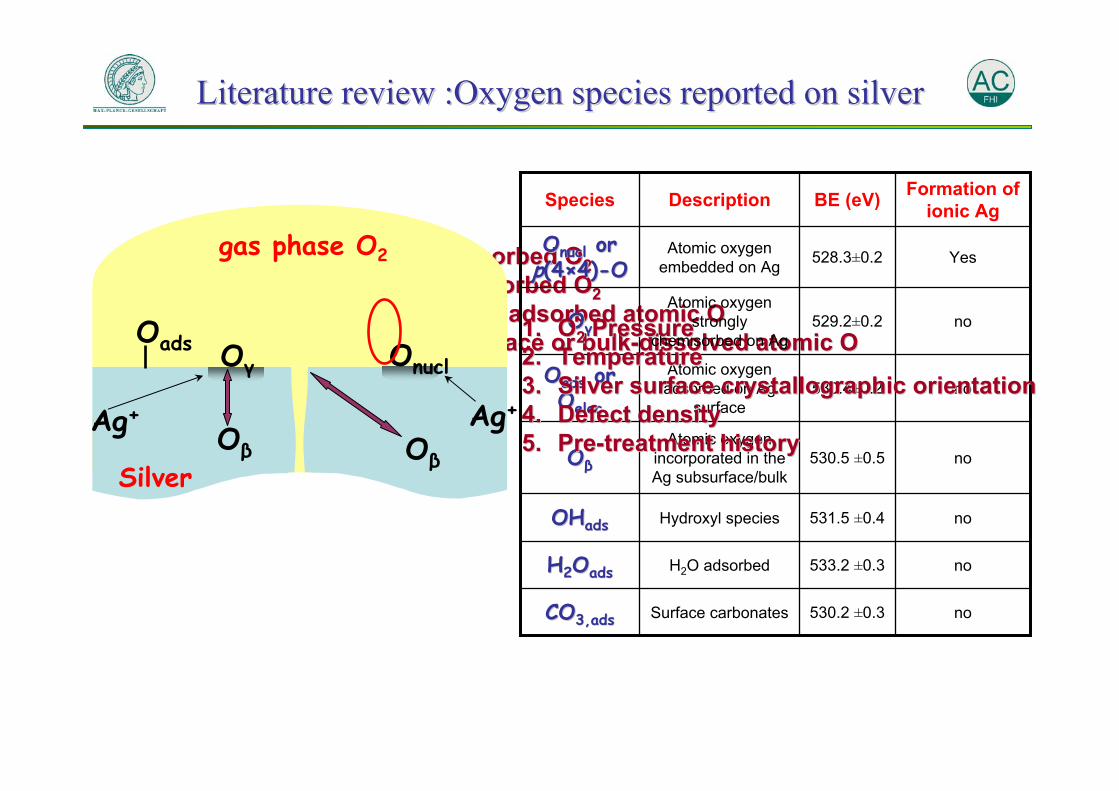
1.1. Physisorbed OPhysisorbed O222.2. Chemisorbed OChemisorbed O223.3. Surface adsorbed atomic OSurface adsorbed atomic O4.4. Subsurface or bulkSubsurface or bulk--dissolved atomic Odissolved atomic O
Literature review :Oxygen species reported on silverLiterature review :Oxygen species reported on silver
no529.2±0.2Atomic oxygen
strongly chemisorbed on Ag
OOγγ
no530.4±0.2Atomic oxygen adsorbed on Ag
surface
OOadsads or or OOelecelec
COCO3,ads3,ads
HH22OOadsads
OHOHadsads
OOββ
OOnuclnucl or or pp(4(4××4)4)--OO
Species
no530.2 ±0.3Surface carbonates
no533.2 ±0.3H2O adsorbed
no531.5 ±0.4Hydroxyl species
no530.5 ±0.5Atomic oxygen
incorporated in the Ag subsurface/bulk
Yes528.3±0.2Atomic oxygen embedded on Ag
Formation of ionic AgBE (eV)Description
1.1. OO22 Pressure Pressure 2.2. TemperatureTemperature3.3. Silver surface crystallographic orientationSilver surface crystallographic orientation4.4. Defect densityDefect density5.5. PrePre--treatment historytreatment historyOβ
Oads
Oβ
Ag+Ag+
Oγ Onucl
Silver
gas phase O2
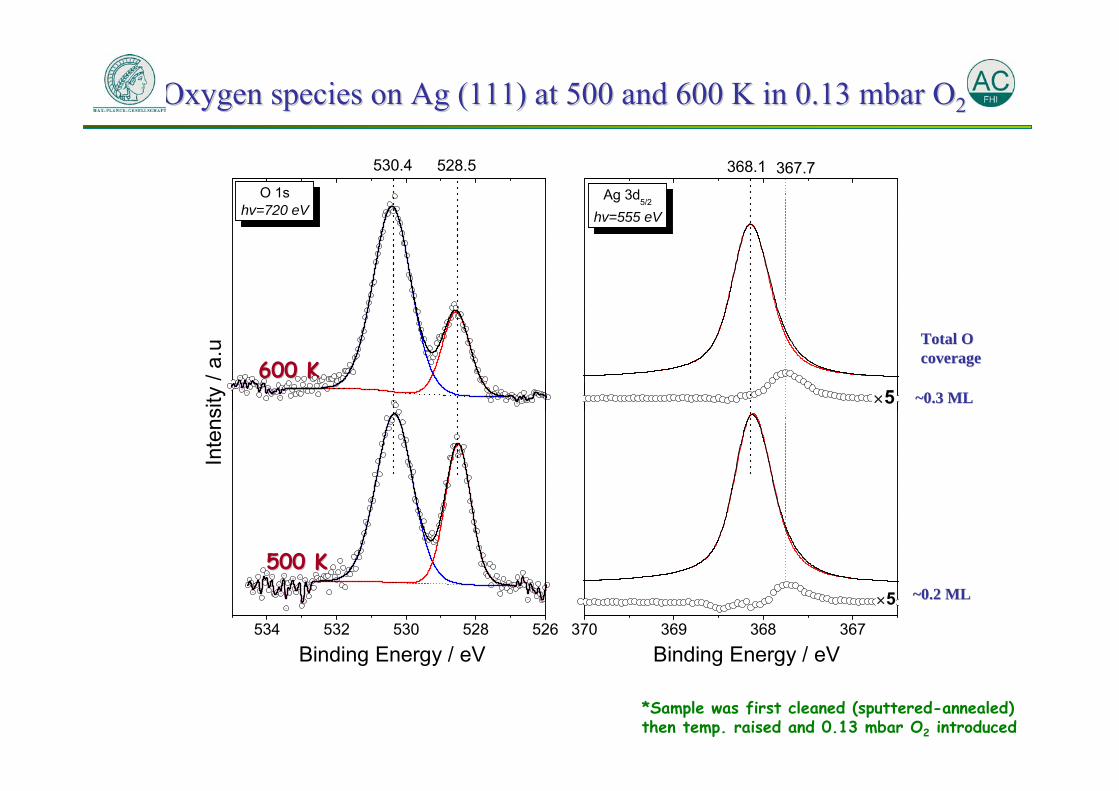
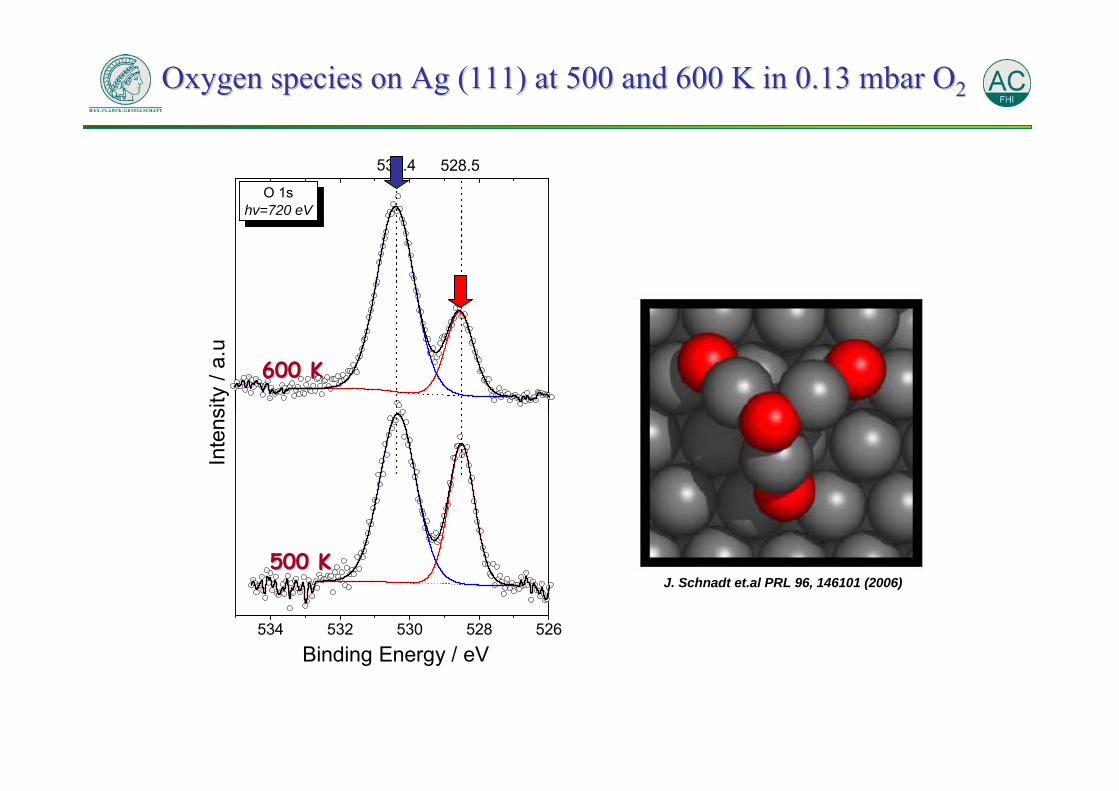
Oxygen species on Ag (111) at 500 and 600 K in 0.13 mbar OOxygen species on Ag (111) at 500 and 600 K in 0.13 mbar O22
500 K500 K
600 K600 K
534 532 530 528 526 370 369 368 367
367.7368.1528.5
Binding Energy / eVBinding Energy / eV
530.4
Ag 3d5/2
hv=555 eV
O 1shv=720 eV
Inte
nsity
/ a.
u
×5
×5
*Sample was first cleaned (sputtered-annealed) then temp. raised and 0.13 mbar O2 introduced
~0.3 ML~0.3 ML
~0.2 ML~0.2 ML
Total O Total O coveragecoverage
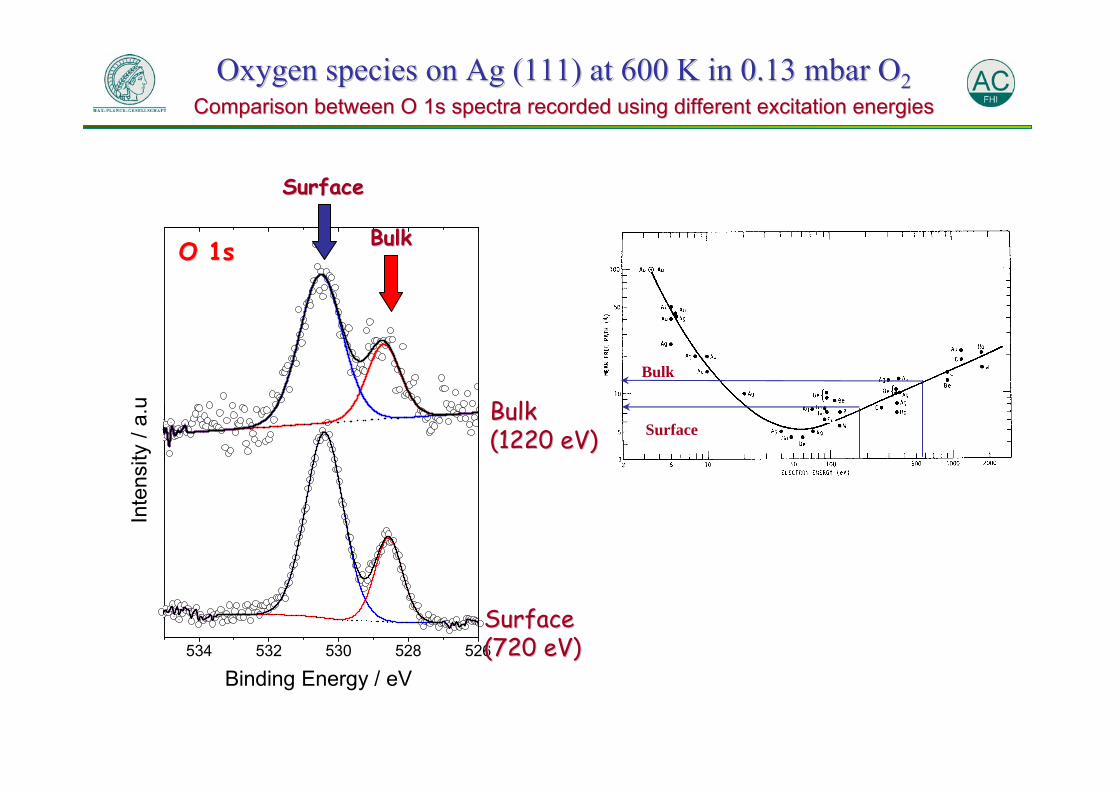
Oxygen species on Ag (111) at 600 K in 0.13 mbar OOxygen species on Ag (111) at 600 K in 0.13 mbar O22Comparison between O 1s spectra recorded using different excitatComparison between O 1s spectra recorded using different excitation energiesion energies
Surface
Bulk
534 532 530 528 526
Inte
nsity
/ a.
u
Binding Energy / eV
Bulk Bulk (1220 eV)(1220 eV)
Surface Surface (720 eV)(720 eV)
O 1sO 1s
SurfaceSurface
BulkBulk
369 368 367
600 K
410 K
Ag 3d hv=555 eV
Inte
nsity
/ a.
u
Binding Energy / eV
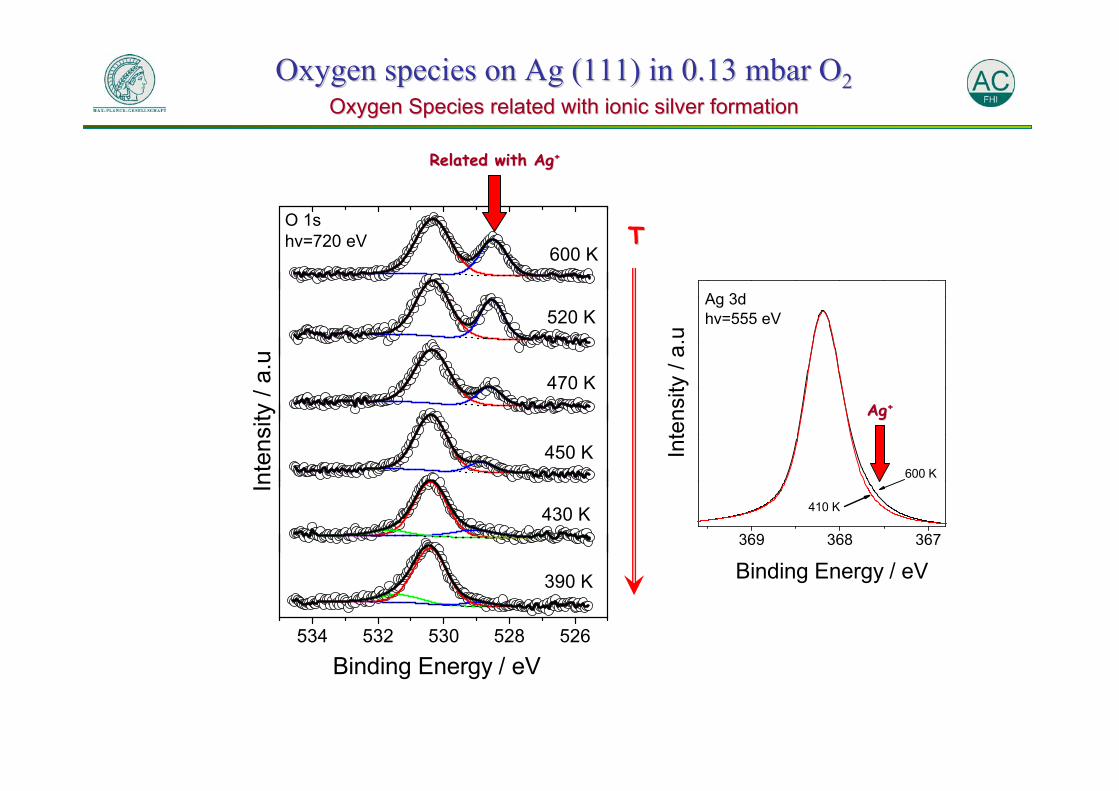
Oxygen species on Ag (111) in 0.13 mbar OOxygen species on Ag (111) in 0.13 mbar O22Oxygen Species related with ionic silver formationOxygen Species related with ionic silver formation
534 532 530 528 526
Binding Energy / eV
Inte
nsity
/ a.
u
390 K
430 K
450 K
470 K
520 K
600 K
O 1s hv=720 eV
TT
Related with AgRelated with Ag++
AgAg++
Oxygen species on Ag (111) at 500 and 600 K in 0.13 mbar OOxygen species on Ag (111) at 500 and 600 K in 0.13 mbar O22
500 K500 K
600 K600 K
534 532 530 528 526 370 369 368 367
367.7368.1528.5
Binding Energy / eVBinding Energy / eV
530.4
Ag 3d5/2
hv=555 eV
O 1shv=720 eV
Inte
nsity
/ a.
u
×5
×5Oads
Ag+
Onucl
Silver
gas phase O2
OadsOads
Ag+
Onucl
Ag+
Onucl
Silver
gas phase O2
J. Schnadt et.al PRL 96, 146101 (2006)
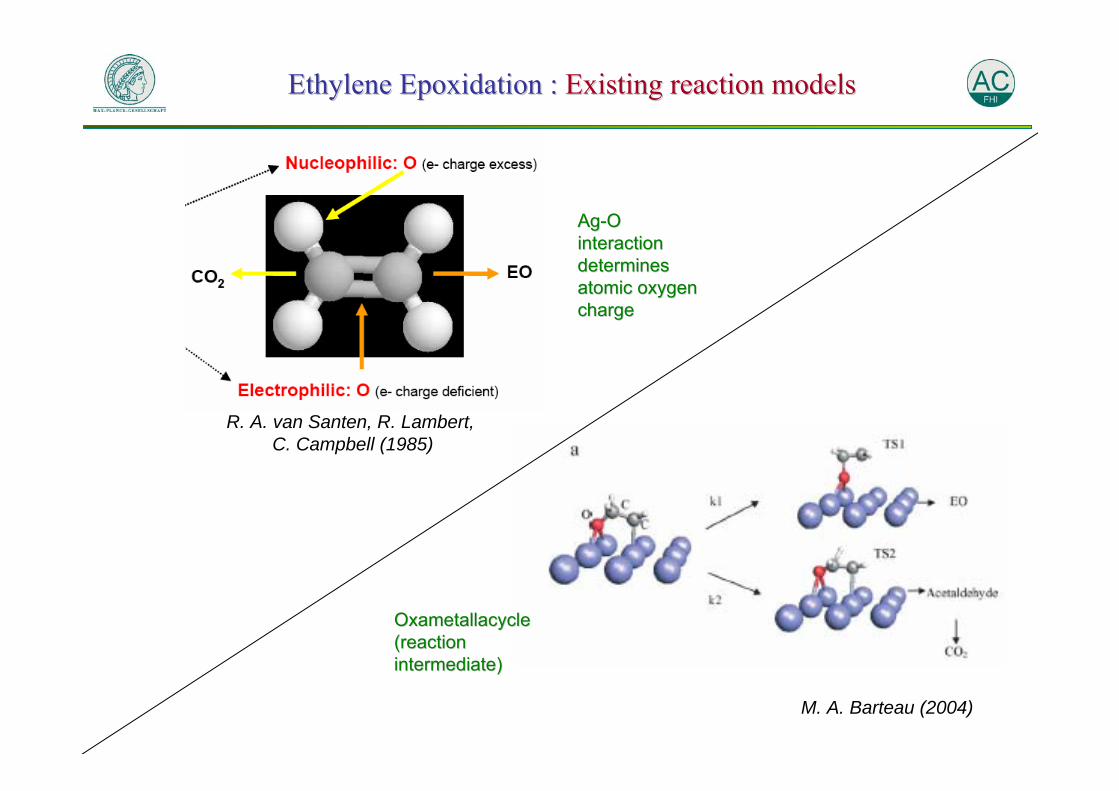
Ethylene Epoxidation : Ethylene Epoxidation : Existing reaction modelsExisting reaction models
R. A. van Santen, R. Lambert, C. Campbell (1985)
M. A. Barteau (2004)
AgAg--O O interaction interaction determines determines atomic oxygen atomic oxygen chargecharge
OxametallacycleOxametallacycle(reaction (reaction intermediate)intermediate)
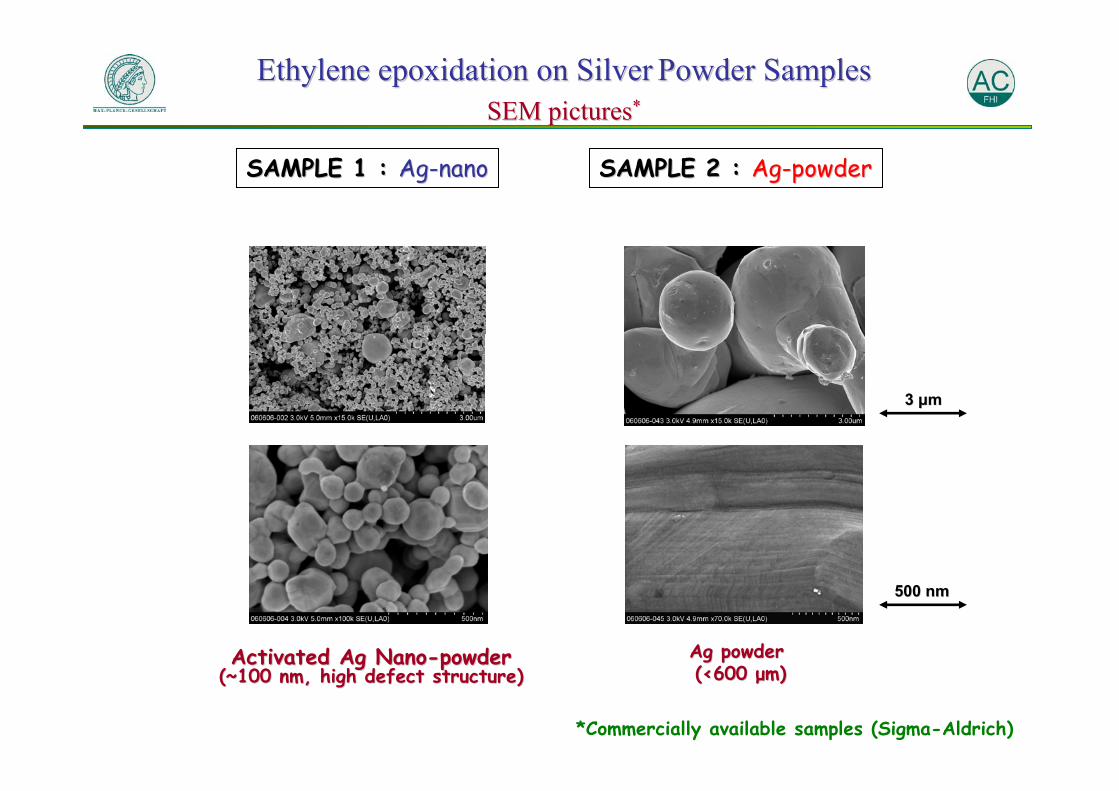
Ethylene epoxidation on SilverEthylene epoxidation on Silver Powder Samples Powder Samples SEM picturesSEM pictures**
*Commercially available samples (Sigma-Aldrich)
Activated Ag Activated Ag NanoNano--powder powder (~100 nm, high defect structure)(~100 nm, high defect structure)
SAMPLE 1 : SAMPLE 1 : AgAg--nanonano
Ag powder Ag powder (<600(<600 μμm)m)
3 3 μμmm
500 500 nmnm
SAMPLE 2 : SAMPLE 2 : AgAg--powderpowder
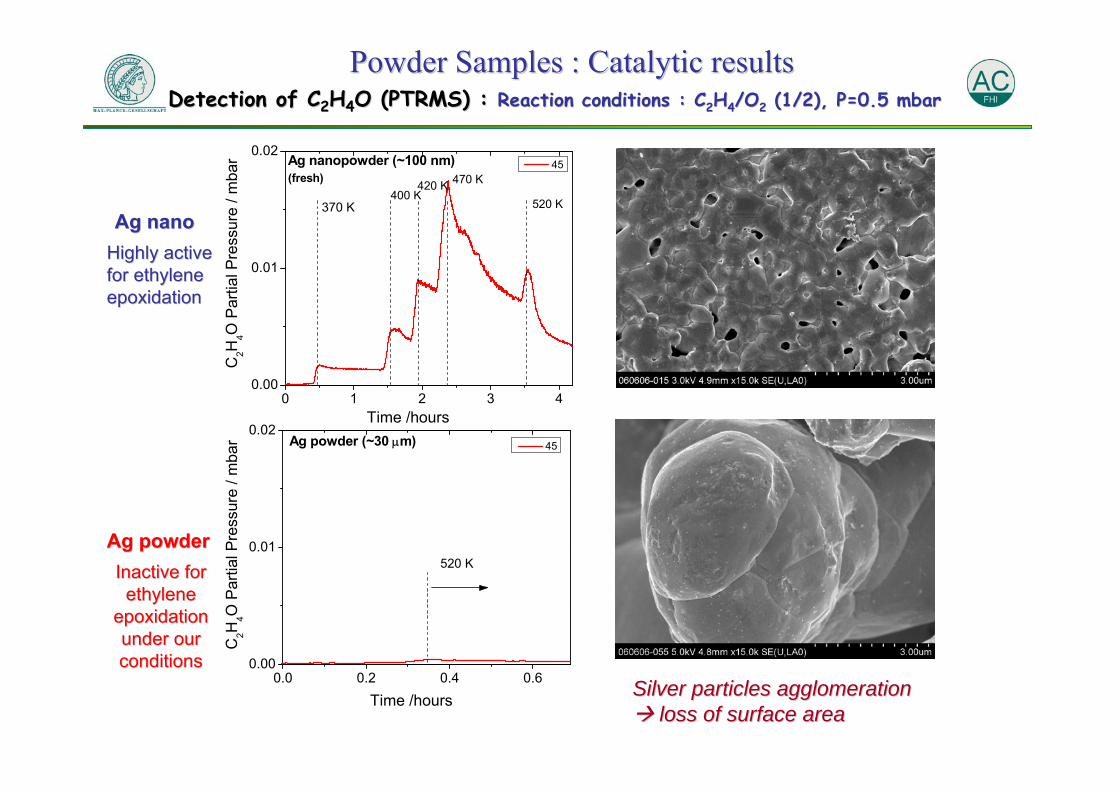
0 1 2 3 40.00
0.01
0.02
520 K
470 K420 K400 K
370 K
Ag nanopowder (~100 nm)(fresh)
C2H
4O P
artia
l Pre
ssur
e / m
bar
Time /hours
45
0.0 0.2 0.4 0.60.00
0.01
0.02 45
Time /hours
C2H
4O P
artia
l Pre
ssur
e / m
bar
520 K
Ag powder (~30 μm)
Powder Samples : Catalytic resultsPowder Samples : Catalytic resultsDetection of CDetection of C22HH44O (PTRMS) : O (PTRMS) : Reaction conditions : Reaction conditions : CC22HH44/O/O22 (1/2), P=0.5 mbar(1/2), P=0.5 mbar
Ag Ag nanonano
Ag powderAg powder
Silver particles agglomeration Silver particles agglomeration loss of surface arealoss of surface area
Highly active Highly active for ethylene for ethylene epoxidationepoxidation
Inactive for Inactive for ethylene ethylene
epoxidationepoxidationunder our under our conditionsconditions
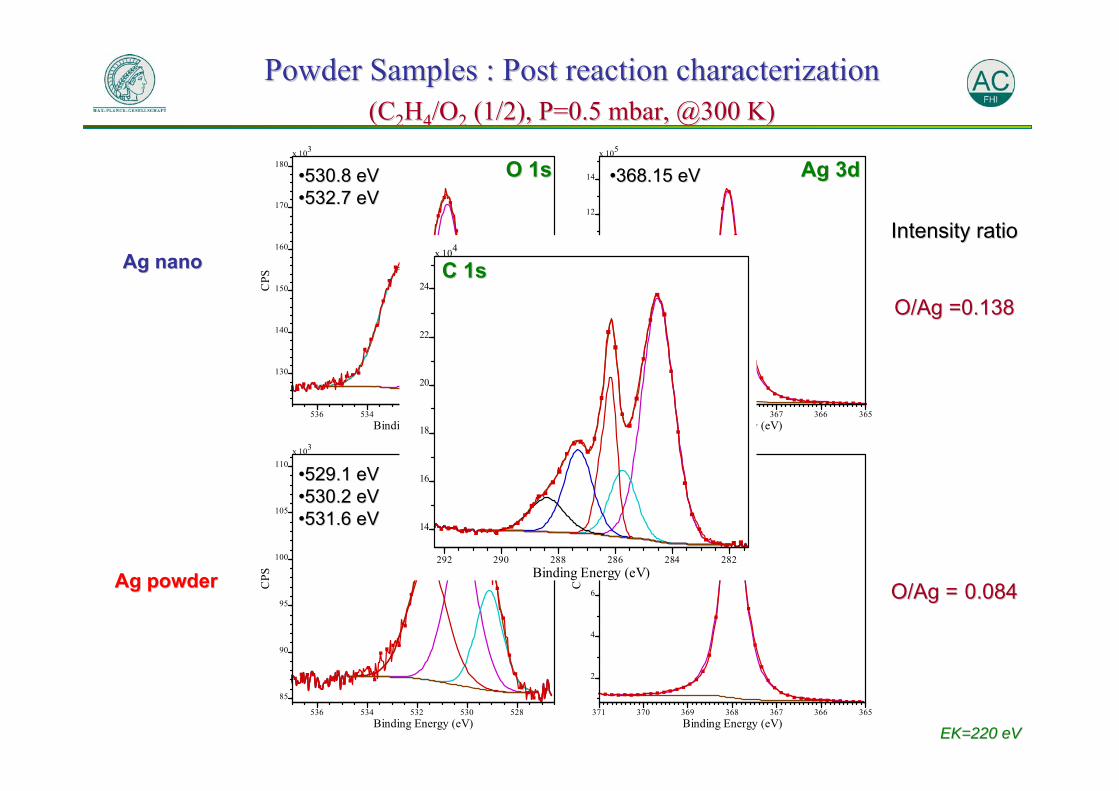
Powder Samples : Post reaction characterizationPowder Samples : Post reaction characterization(C(C22HH44/O/O22 (1/2), P=0.5 mbar, @300 K)(1/2), P=0.5 mbar, @300 K)
Ag Ag nanonano
Ag powderAg powder
x 103
85
90
95
100
105
110
CPS
536 534 532 530 528Binding Energy (eV)
x 105
2
4
6
8
10
12
CPS
371 370 369 368 367 366 365Binding Energy (eV)
x 103
130
140
150
160
170
180
CPS
536 534 532 530 528Binding Energy (eV)
x 105
2
4
6
8
10
12
14
CPS
371 370 369 368 367 366 365Binding Energy (eV)
O 1sO 1s Ag 3dAg 3d••530.8 eV530.8 eV••532.7 eV532.7 eV
••529.1 eV529.1 eV••530.2 eV530.2 eV••531.6 eV531.6 eV
••368.15 eV368.15 eV
••368.15 eV368.15 eV
x 104
14
16
18
20
22
24
292 290 288 286 284 282Binding Energy (eV)
C 1sC 1s
EK=220 eVEK=220 eV
Intensity ratioIntensity ratio
O/Ag =0.138O/Ag =0.138
O/Ag =O/Ag = 0.0840.084
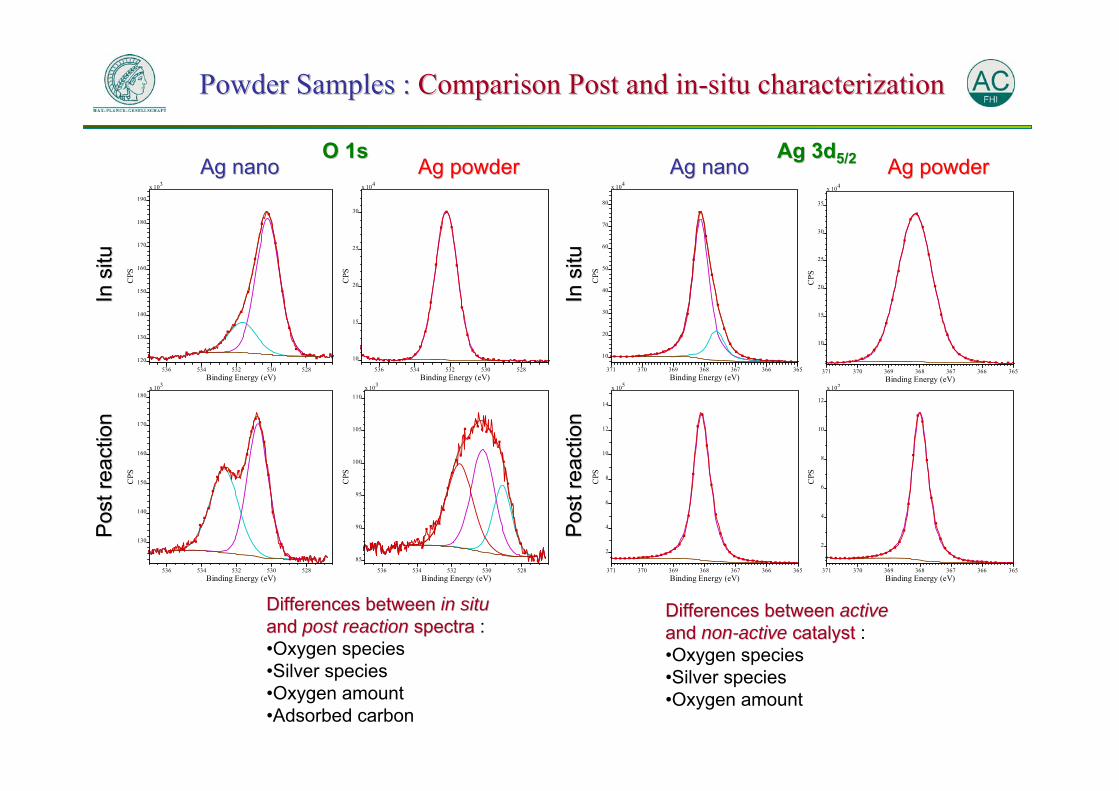
Powder Samples : Powder Samples : Comparison Post and inComparison Post and in--situ characterizationsitu characterization
O 1sO 1s
x 103
130
140
150
160
170
180
CPS
536 534 532 530 528Binding Energy (eV)
x 103
85
90
95
100
105
110
CPS
536 534 532 530 528Binding Energy (eV)
x 103
120
130
140
150
160
170
180
190
CPS
536 534 532 530 528Binding Energy (eV)
x 104
10
15
20
25
30
CPS
536 534 532 530 528Binding Energy (eV)
Ag powderAg powderAg Ag nanonano
In s
ituIn
situ
Pos
t rea
ctio
nP
ost r
eact
ion
x 105
2
4
6
8
10
12
14
CPS
371 370 369 368 367 366 365Binding Energy (eV)
x 105
2
4
6
8
10
12
CPS
371 370 369 368 367 366 365Binding Energy (eV)
x 104
10
20
30
40
50
60
70
80
CPS
371 370 369 368 367 366 365Binding Energy (eV)
x 104
10
15
20
25
30
35
CPS
371 370 369 368 367 366 365Binding Energy (eV)
Ag 3dAg 3d5/25/2 Ag powderAg powderAg Ag nanonano
In s
ituIn
situ
Pos
t rea
ctio
nP
ost r
eact
ion
Differences between Differences between in situin situand and post reactionpost reaction spectraspectra :•Oxygen species•Silver species•Oxygen amount•Adsorbed carbon
Differences between Differences between active active and and nonnon--active active catalystcatalyst :•Oxygen species•Silver species•Oxygen amount
Ag9O
Powder Samples : In situ reaction characterizationPowder Samples : In situ reaction characterization(Reaction conditions : C(Reaction conditions : C22HH44/O/O22 (1/2), P=0.5 mbar, @520 K)(1/2), P=0.5 mbar, @520 K)
Ag Ag nanonano
Ag powderAg powder
x 104
10
15
20
25
30
CPS
536 534 532 530 528Binding Energy (eV)
x 104
10
15
20
25
30
35
CPS
371 370 369 368 367 366 365Binding Energy (eV)
x 103
120
130
140
150
160
170
180
190
CPS
536 534 532 530 528Binding Energy (eV)
x 104
10
20
30
40
50
60
70
80
CPS
371 370 369 368 367 366 365Binding Energy (eV)
O 1sO 1s Ag 3dAg 3d••530.2 eV530.2 eV••531.7 eV531.7 eV
••532.2 eV532.2 eV
••368.15 eV368.15 eV••367.65 eV367.65 eV
••368.15 eV368.15 eV
x 103
64
66
68
70
72
74
76
78
290 289 288 287 286 285 284 283 282Binding Energy (eV)
C 1sC 1s
Intensity ratioIntensity ratio
O/Ag =0.21O/Ag =0.21
O/Ag =O/Ag = 0.850.85
100 200 300 400 500 600 700
10
20
30
40
50
60
70
80
90
%
Inte
nsity
Photoelectron Kinetic Energy / eV
368.15 eV 367.65 eV
100 200 300 400 500 600 70010
20
60
70
80
90
% In
tens
ity
Photoelectron Kinetic Energy / eV
530.2 eV 531.7 eV
Location of ionic SilverLocation of ionic Silver
Location of oxygenLocation of oxygen
SurfaceSurface
Less surfaceLess surface
Less surfaceLess surface
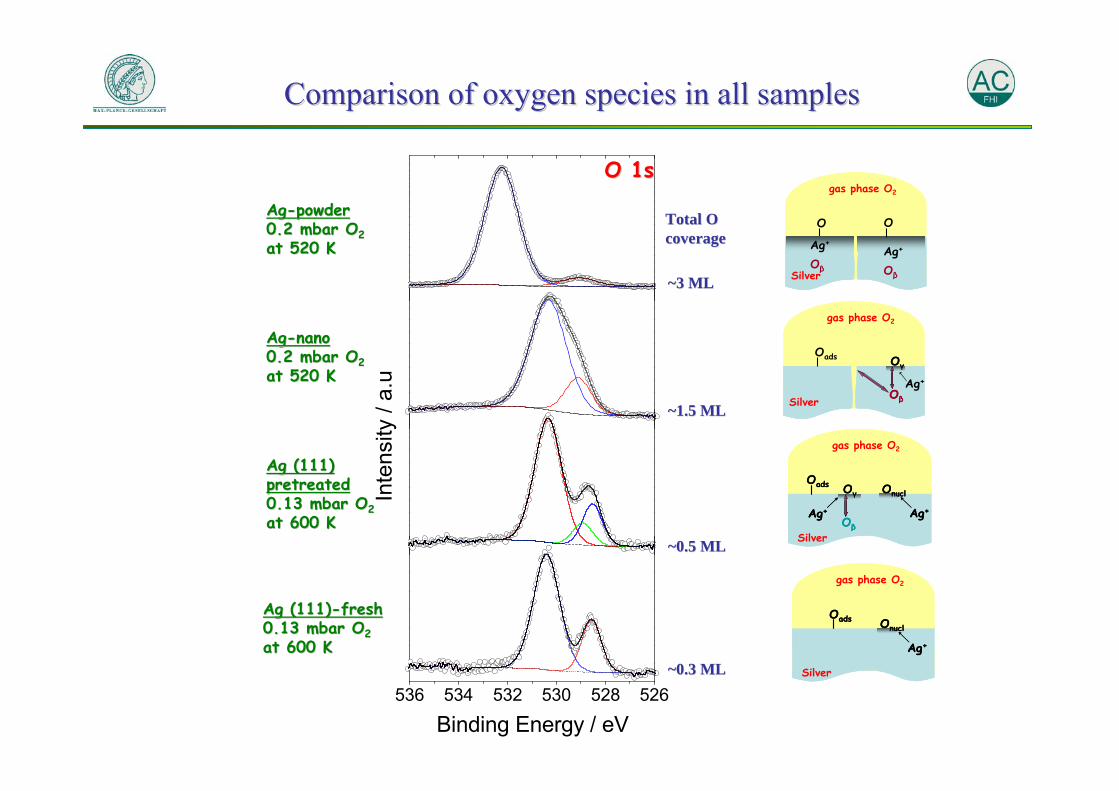
Comparison of oxygen species in all samplesComparison of oxygen species in all samples
536 534 532 530 528 526
Inte
nsity
/ a.
u
Binding Energy / eV
AgAg--powderpowder0.2 mbar O0.2 mbar O2 2 at 520 Kat 520 K
AgAg--nanonano0.2 mbar O0.2 mbar O2 2 at 520 Kat 520 K
Ag (111)Ag (111)pretreatedpretreated0.13 mbar O0.13 mbar O2 2 at 600 Kat 600 K
Ag (111)Ag (111)--freshfresh0.13 mbar O0.13 mbar O2 2 at 600 Kat 600 K
O 1sO 1s
Oads
Ag+
Onucl
Silver
gas phase O2
OadsOads
Ag+
Onucl
Ag+
Onucl
Silver
gas phase O2
Oads
Ag+
Onucl
Silver
gas phase O2
Oβ
Oγ
Ag+
OadsOads
Ag+
Onucl
Ag+
Onucl
Silver
gas phase O2
Oβ
Oγ
Oβ
Oγ
Ag+Ag+
Oads
Ag+
Oβ
Oγ
Silver
gas phase O2
Oads
Ag+
Oβ
Oγ
Oβ
Oγ
Silver
gas phase O2
O
OβSilver
gas phase O2
Ag+
Oβ
Ag+
OO
OβSilver
gas phase O2
Ag+
Oβ
Ag+
O
~0.3 ML~0.3 ML
~0.5 ML~0.5 ML
Total O Total O coveragecoverage
~1.5 ML~1.5 ML
~3 ML~3 ML
Dr. Axel Knop-Gericke
Dr. Michael Hävecker
Peter Schnörch
Dr. Detre Teschner
Dr. Elaine VassDr. Spiros Zafeiratos
Dr. Zoltan Hlavathy