Embed Size (px)
Citation preview
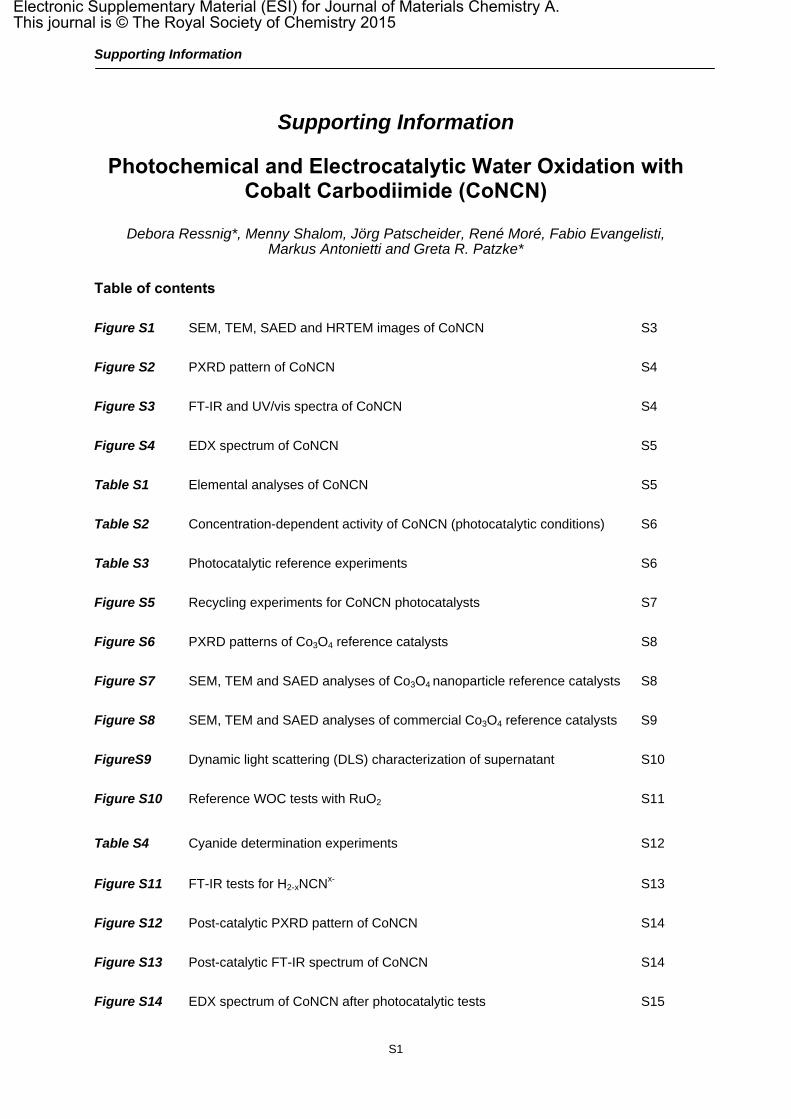
Supporting Information
S1
Supporting Information
Photochemical and Electrocatalytic Water Oxidation with Cobalt Carbodiimide (CoNCN)
Debora Ressnig*, Menny Shalom, Jörg Patscheider, René Moré, Fabio Evangelisti, Markus Antonietti and Greta R. Patzke*
Table of contents
Figure S1 SEM, TEM, SAED and HRTEM images of CoNCN S3
Figure S2 PXRD pattern of CoNCN S4
Figure S3 FT-IR and UV/vis spectra of CoNCN S4
Figure S4 EDX spectrum of CoNCN S5
Table S1 Elemental analyses of CoNCN S5
Table S2 Concentration-dependent activity of CoNCN (photocatalytic conditions) S6
Table S3 Photocatalytic reference experiments S6
Figure S5 Recycling experiments for CoNCN photocatalysts S7
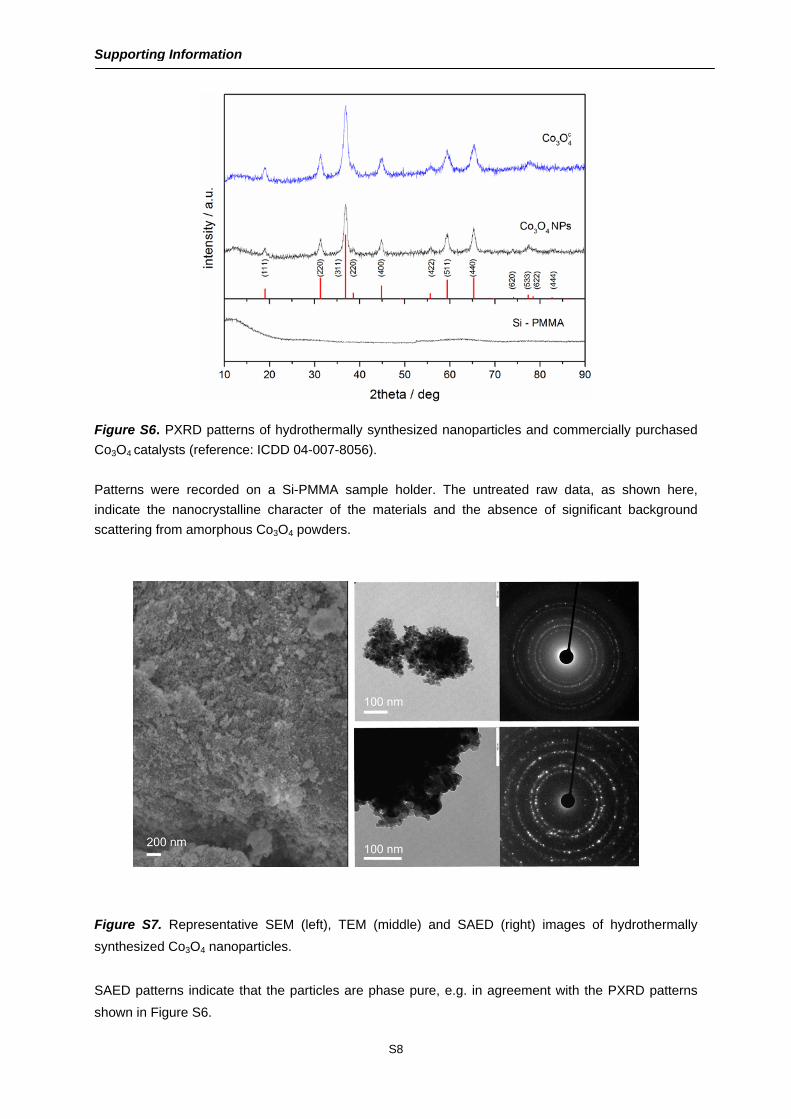
Figure S6 PXRD patterns of Co3O4 reference catalysts S8
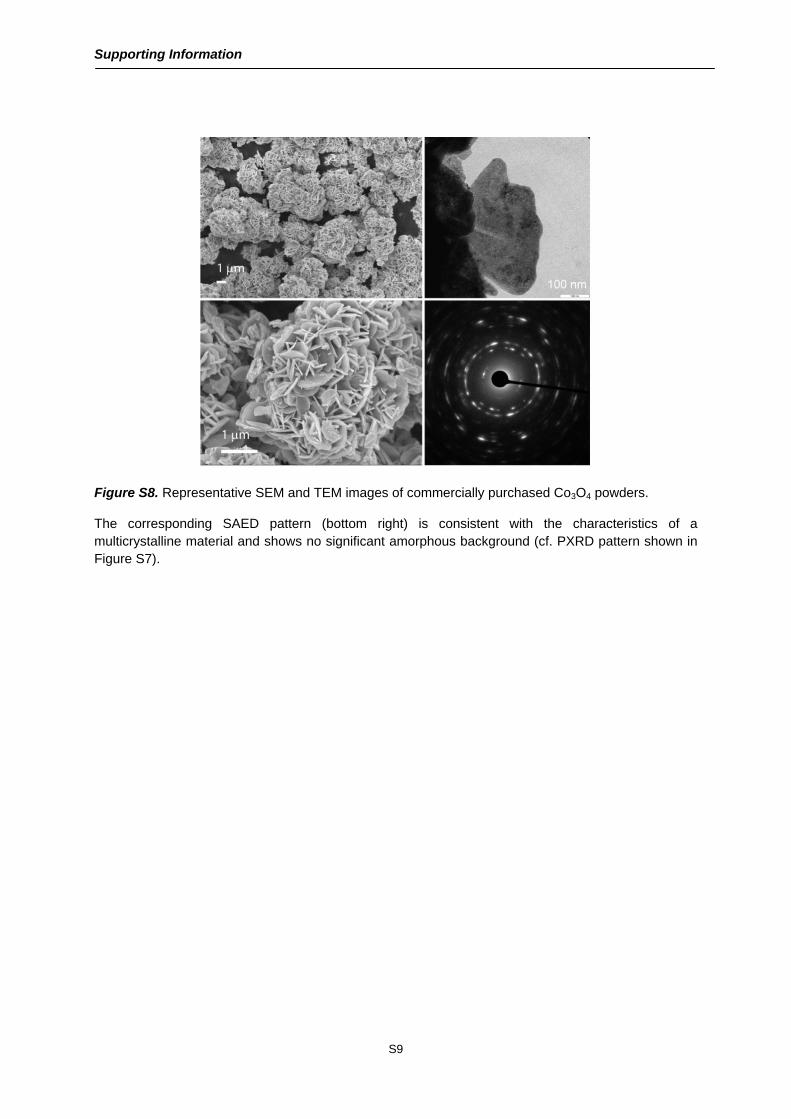
Figure S7 SEM, TEM and SAED analyses of Co3O4 nanoparticle reference catalysts S8
Figure S8 SEM, TEM and SAED analyses of commercial Co3O4 reference catalysts S9
FigureS9 Dynamic light scattering (DLS) characterization of supernatant S10
Figure S10 Reference WOC tests with RuO2 S11
Table S4 Cyanide determination experiments S12
Figure S11 FT-IR tests for H2-xNCNx- S13
Figure S12 Post-catalytic PXRD pattern of CoNCN S14
Figure S13 Post-catalytic FT-IR spectrum of CoNCN S14
Figure S14 EDX spectrum of CoNCN after photocatalytic tests S15
Electronic Supplementary Material (ESI) for Journal of Materials Chemistry A.This journal is © The Royal Society of Chemistry 2015
Supporting Information
S2
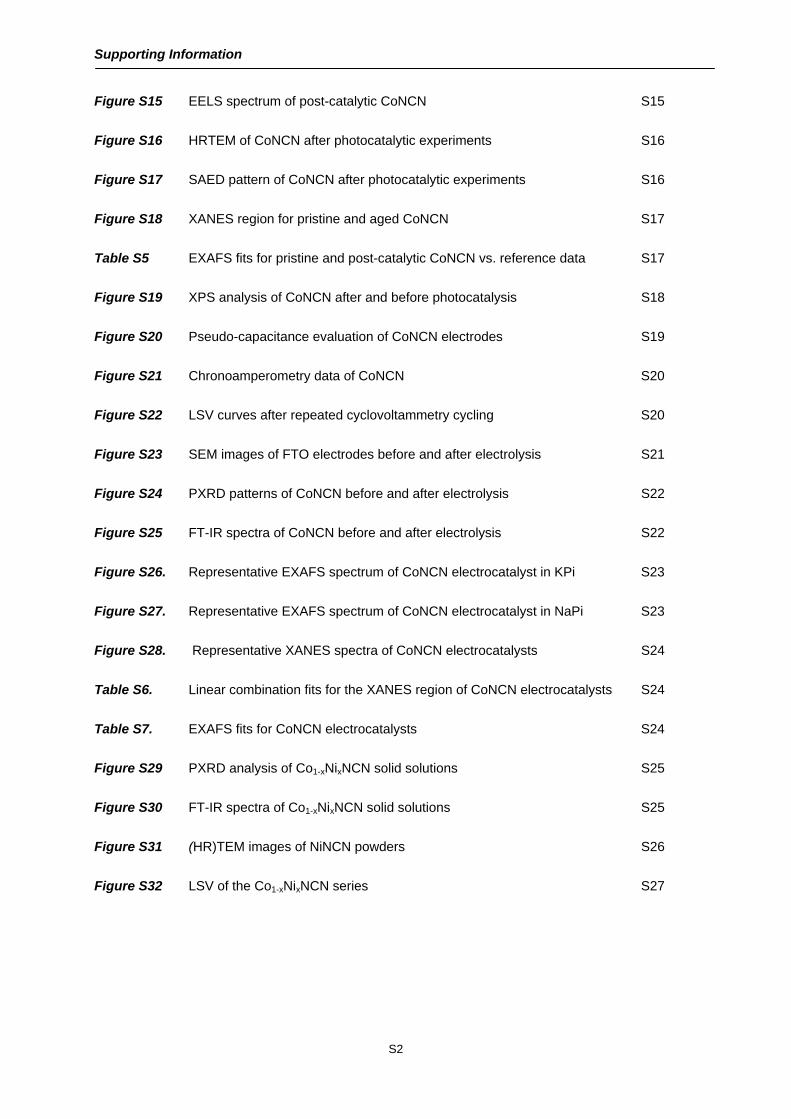
Figure S15 EELS spectrum of post-catalytic CoNCN S15
Figure S16 HRTEM of CoNCN after photocatalytic experiments S16
Figure S17 SAED pattern of CoNCN after photocatalytic experiments S16
Figure S18 XANES region for pristine and aged CoNCN S17
Table S5 EXAFS fits for pristine and post-catalytic CoNCN vs. reference data S17
Figure S19 XPS analysis of CoNCN after and before photocatalysis S18
Figure S20 Pseudo-capacitance evaluation of CoNCN electrodes S19
Figure S21 Chronoamperometry data of CoNCN S20
Figure S22 LSV curves after repeated cyclovoltammetry cycling S20
Figure S23 SEM images of FTO electrodes before and after electrolysis S21
Figure S24 PXRD patterns of CoNCN before and after electrolysis S22
Figure S25 FT-IR spectra of CoNCN before and after electrolysis S22
Figure S26. Representative EXAFS spectrum of CoNCN electrocatalyst in KPi S23
Figure S27. Representative EXAFS spectrum of CoNCN electrocatalyst in NaPi S23
Figure S28. Representative XANES spectra of CoNCN electrocatalysts S24
Table S6. Linear combination fits for the XANES region of CoNCN electrocatalysts S24
Table S7. EXAFS fits for CoNCN electrocatalysts S24
Figure S29 PXRD analysis of Co1-xNixNCN solid solutions S25
Figure S30 FT-IR spectra of Co1-xNixNCN solid solutions S25
Figure S31 (HR)TEM images of NiNCN powders S26
Figure S32 LSV of the Co1-xNixNCN series S27
Supporting Information
S3
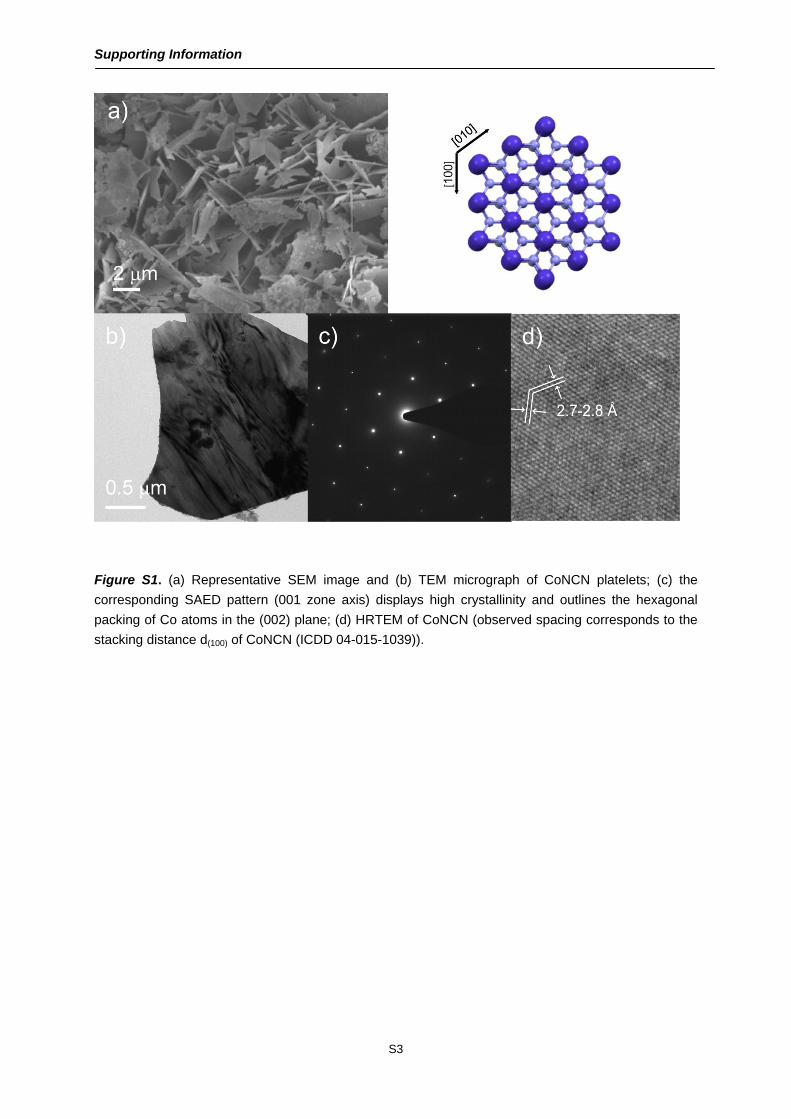
Figure S1. (a) Representative SEM image and (b) TEM micrograph of CoNCN platelets; (c) the
corresponding SAED pattern (001 zone axis) displays high crystallinity and outlines the hexagonal
packing of Co atoms in the (002) plane; (d) HRTEM of CoNCN (observed spacing corresponds to the
stacking distance d(100) of CoNCN (ICDD 04-015-1039)).
Supporting Information
S4
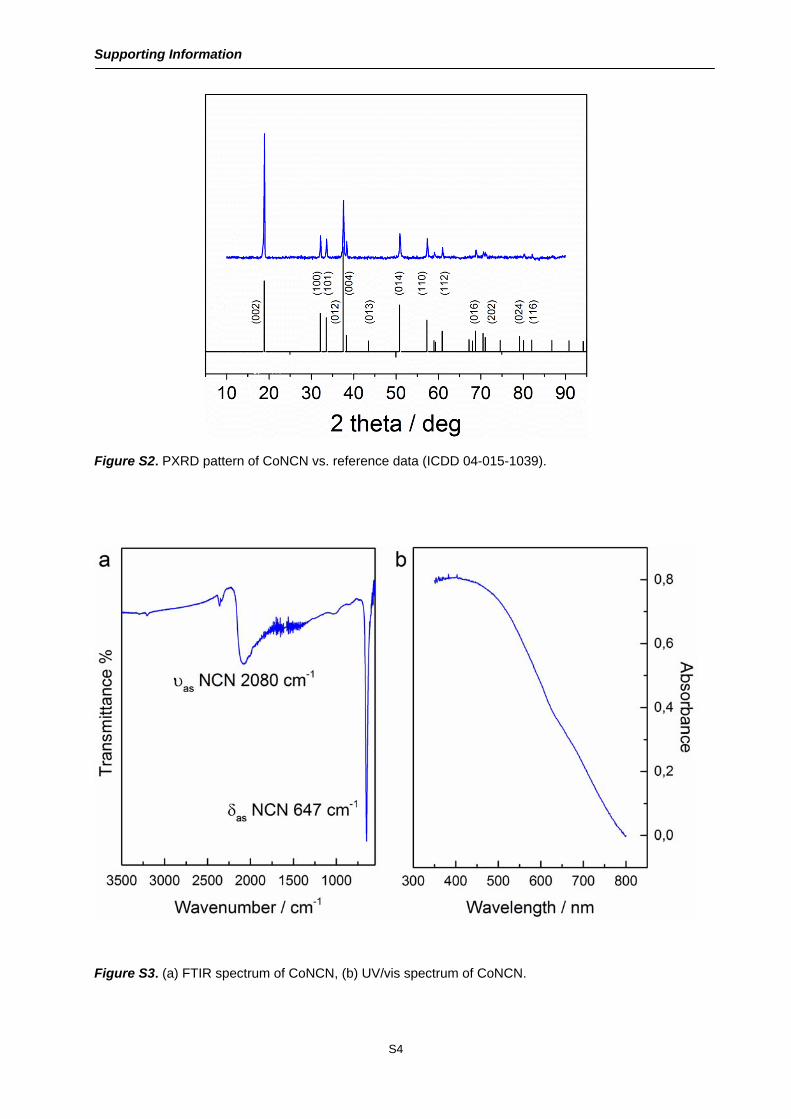
Figure S2. PXRD pattern of CoNCN vs. reference data (ICDD 04-015-1039).
Figure S3. (a) FTIR spectrum of CoNCN, (b) UV/vis spectrum of CoNCN.

Supporting Information
S5
Figure S4. Representative EDX spectrum of CoNCN deposited on a copper grid.
Table S1. Elemental analysis data of CoNCN.
CoNCN N C H
Determined 30 12 <1
Calculated 28 12 -
Supporting Information
S6
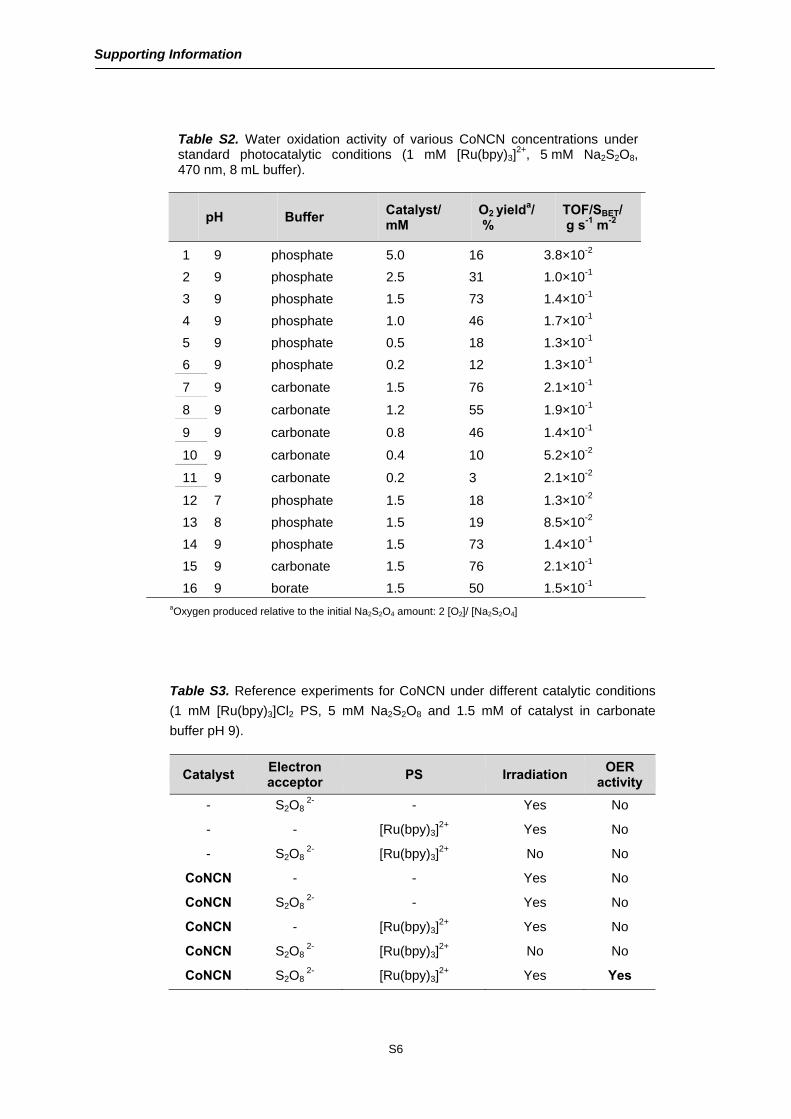
Table S2. Water oxidation activity of various CoNCN concentrations under standard photocatalytic conditions (1 mM [Ru(bpy)3]
2+, 5 mM Na2S2O8, 470 nm, 8 mL buffer).
pH Buffer Catalyst/ mM
O2 yielda/ %
TOF/SBET/ g s-1 m-2
1 9 phosphate 5.0 16 3.8×10⁻²
2 9 phosphate 2.5 31 1.0×10⁻¹
3 9 phosphate 1.5 73 1.4×10⁻¹
4 9 phosphate 1.0 46 1.7×10⁻¹
5 9 phosphate 0.5 18 1.3×10⁻¹
6 9 phosphate 0.2 12 1.3×10⁻¹
7 9 carbonate 1.5 76 2.1×10⁻¹
8 9 carbonate 1.2 55 1.9×10⁻¹
9 9 carbonate 0.8 46 1.4×10⁻¹
10 9 carbonate 0.4 10 5.2×10⁻²
11 9 carbonate 0.2 3 2.1×10⁻²
12 7 phosphate 1.5 18 1.3×10⁻²
13 8 phosphate 1.5 19 8.5×10⁻²
14 9 phosphate 1.5 73 1.4×10⁻¹
15 9 carbonate 1.5 76 2.1×10⁻¹
16 9 borate 1.5 50 1.5×10⁻¹
aOxygen produced relative to the initial Na2S2O4 amount: 2 [O2]/ [Na2S2O4]
Table S3. Reference experiments for CoNCN under different catalytic conditions
(1 mM [Ru(bpy)3]Cl2 PS, 5 mM Na2S2O8 and 1.5 mM of catalyst in carbonate
buffer pH 9).
Catalyst Electron acceptor
PS Irradiation OER
activity
- S2O8 2- - Yes No
- - [Ru(bpy)3]2+ Yes No
- S2O8 2- [Ru(bpy)3]
2+ No No
CoNCN - - Yes No
CoNCN S2O8 2- - Yes No
CoNCN - [Ru(bpy)3]2+ Yes No
CoNCN S2O8 2- [Ru(bpy)3]
2+ No No
CoNCN S2O8 2- [Ru(bpy)3]
2+ Yes Yes
Supporting Information
S7
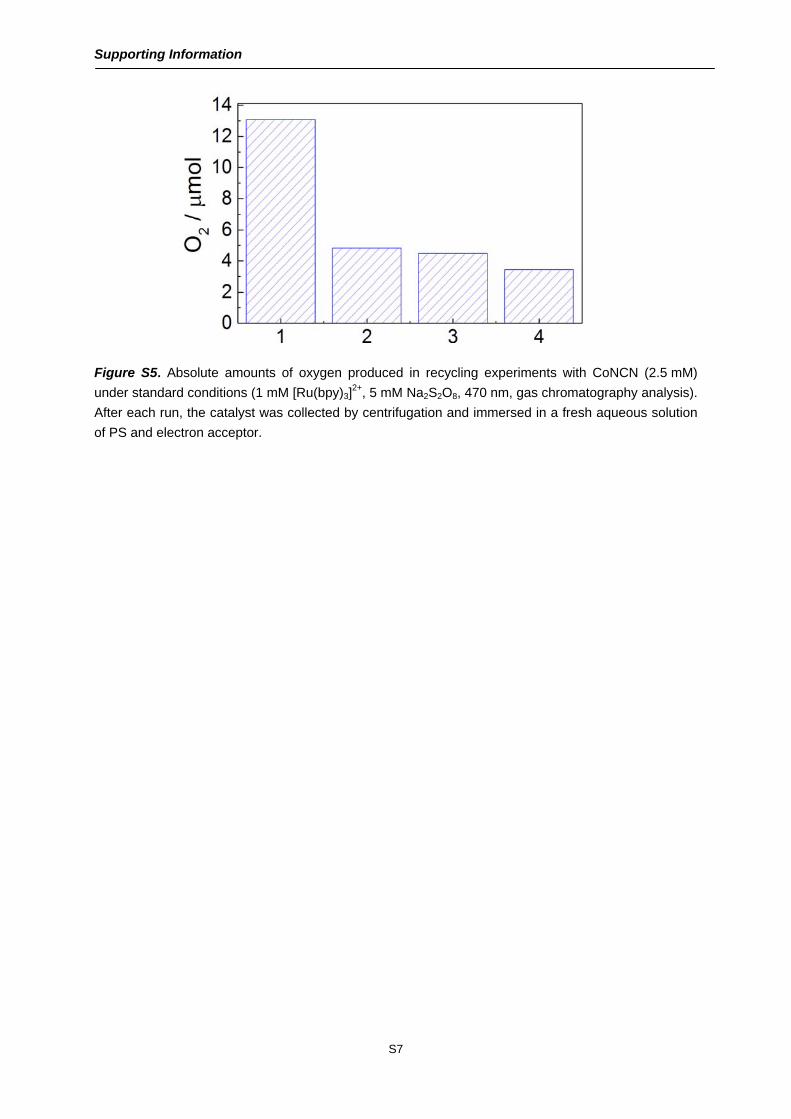
Figure S5. Absolute amounts of oxygen produced in recycling experiments with CoNCN (2.5 mM)
under standard conditions (1 mM [Ru(bpy)3]2+, 5 mM Na2S2O8, 470 nm, gas chromatography analysis).
After each run, the catalyst was collected by centrifugation and immersed in a fresh aqueous solution
of PS and electron acceptor.
Support
Figure S
Co3O4 ca
Patterns
indicate
scatterin
Figure S
synthesi
SAED p
shown in
ting Informa
S6. PXRD p
atalysts (refe
s were recor
the nanocry
ng from amor
S7. Represe
zed Co3O4 n
atterns indic
n Figure S6.
ation
atterns of hy
erence: ICDD
rded on a S
ystalline cha
rphous Co3O
entative SEM
nanoparticles
cate that the
ydrothermally
D 04-007-805
Si-PMMA sa
aracter of th
O4 powders.
M (left), TEM
s.
particles are
S8
y synthesize
56).
ample holder
he materials
M (middle) a
e phase pur
ed nanopartic
r. The untre
and the ab
and SAED
e, e.g. in ag
cles and com
eated raw d
bsence of si
(right) image
greement wit
mmercially p
ata, as sho
gnificant bac
es of hydro
h the PXRD
urchased
wn here,
ckground
thermally
D patterns
Supporting Information
S9
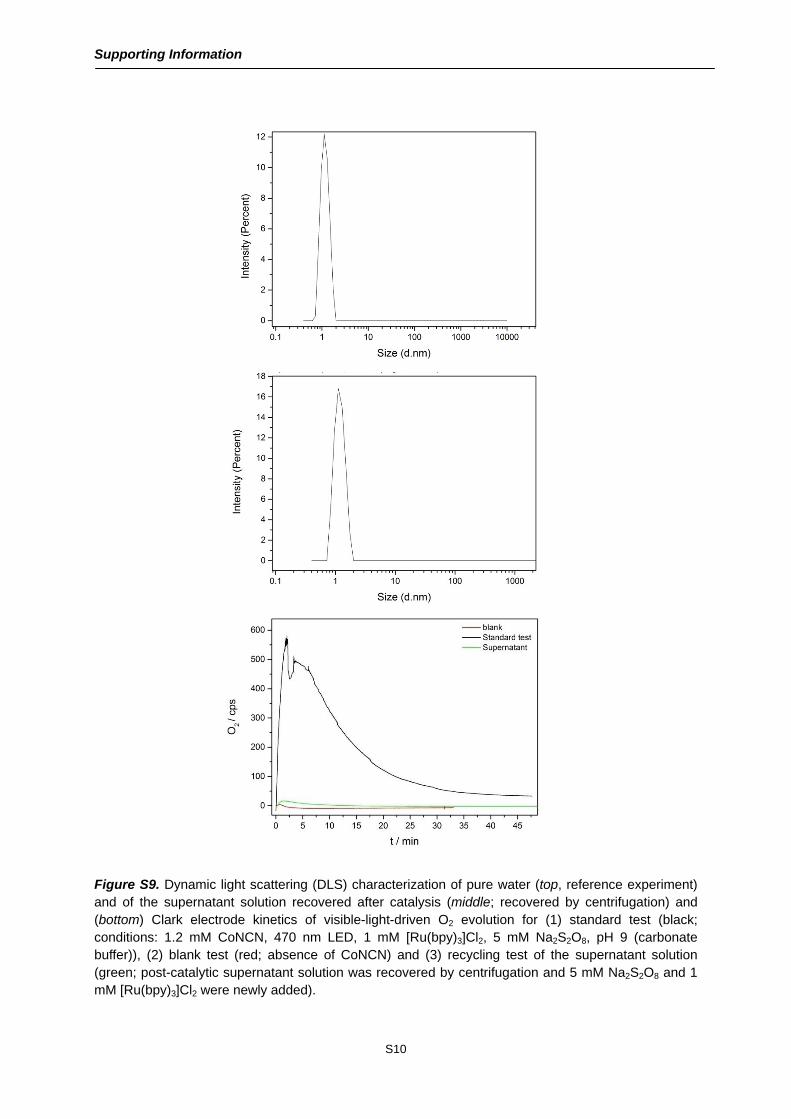
Figure S8. Representative SEM and TEM images of commercially purchased Co3O4 powders.
The corresponding SAED pattern (bottom right) is consistent with the characteristics of a multicrystalline material and shows no significant amorphous background (cf. PXRD pattern shown in Figure S7).
Supporting Information
S10
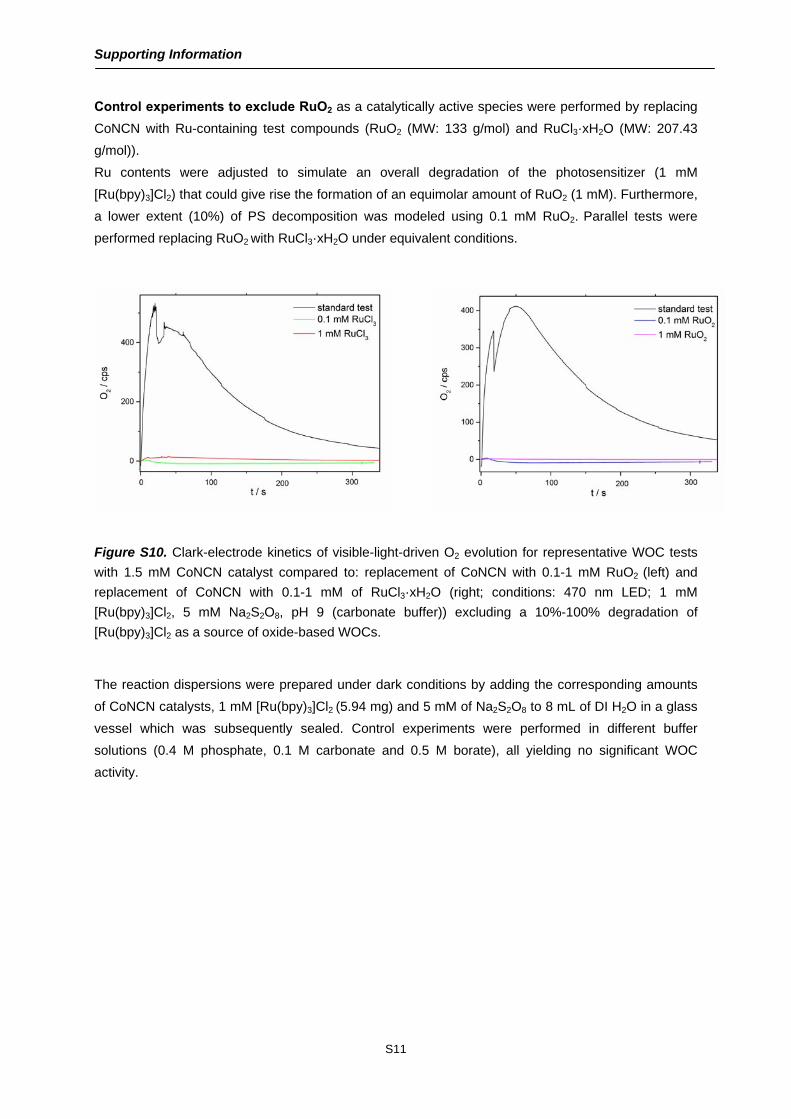
Figure S9. Dynamic light scattering (DLS) characterization of pure water (top, reference experiment) and of the supernatant solution recovered after catalysis (middle; recovered by centrifugation) and (bottom) Clark electrode kinetics of visible-light-driven O2 evolution for (1) standard test (black; conditions: 1.2 mM CoNCN, 470 nm LED, 1 mM [Ru(bpy)3]Cl2, 5 mM Na2S2O8, pH 9 (carbonate buffer)), (2) blank test (red; absence of CoNCN) and (3) recycling test of the supernatant solution (green; post-catalytic supernatant solution was recovered by centrifugation and 5 mM Na2S2O8 and 1 mM [Ru(bpy)3]Cl2 were newly added).
Supporting Information
S11
Control experiments to exclude RuO2 as a catalytically active species were performed by replacing
CoNCN with Ru-containing test compounds (RuO2 (MW: 133 g/mol) and RuCl3·xH2O (MW: 207.43
g/mol)).
Ru contents were adjusted to simulate an overall degradation of the photosensitizer (1 mM
[Ru(bpy)3]Cl2) that could give rise the formation of an equimolar amount of RuO2 (1 mM). Furthermore,
a lower extent (10%) of PS decomposition was modeled using 0.1 mM RuO2. Parallel tests were
performed replacing RuO2 with RuCl3·xH2O under equivalent conditions.
Figure S10. Clark-electrode kinetics of visible-light-driven O2 evolution for representative WOC tests
with 1.5 mM CoNCN catalyst compared to: replacement of CoNCN with 0.1-1 mM RuO2 (left) and
replacement of CoNCN with 0.1-1 mM of RuCl3·xH2O (right; conditions: 470 nm LED; 1 mM
[Ru(bpy)3]Cl2, 5 mM Na2S2O8, pH 9 (carbonate buffer)) excluding a 10%-100% degradation of
[Ru(bpy)3]Cl2 as a source of oxide-based WOCs.
The reaction dispersions were prepared under dark conditions by adding the corresponding amounts
of CoNCN catalysts, 1 mM [Ru(bpy)3]Cl2 (5.94 mg) and 5 mM of Na2S2O8 to 8 mL of DI H2O in a glass
vessel which was subsequently sealed. Control experiments were performed in different buffer
solutions (0.4 M phosphate, 0.1 M carbonate and 0.5 M borate), all yielding no significant WOC
activity.
Supporting Information
S12
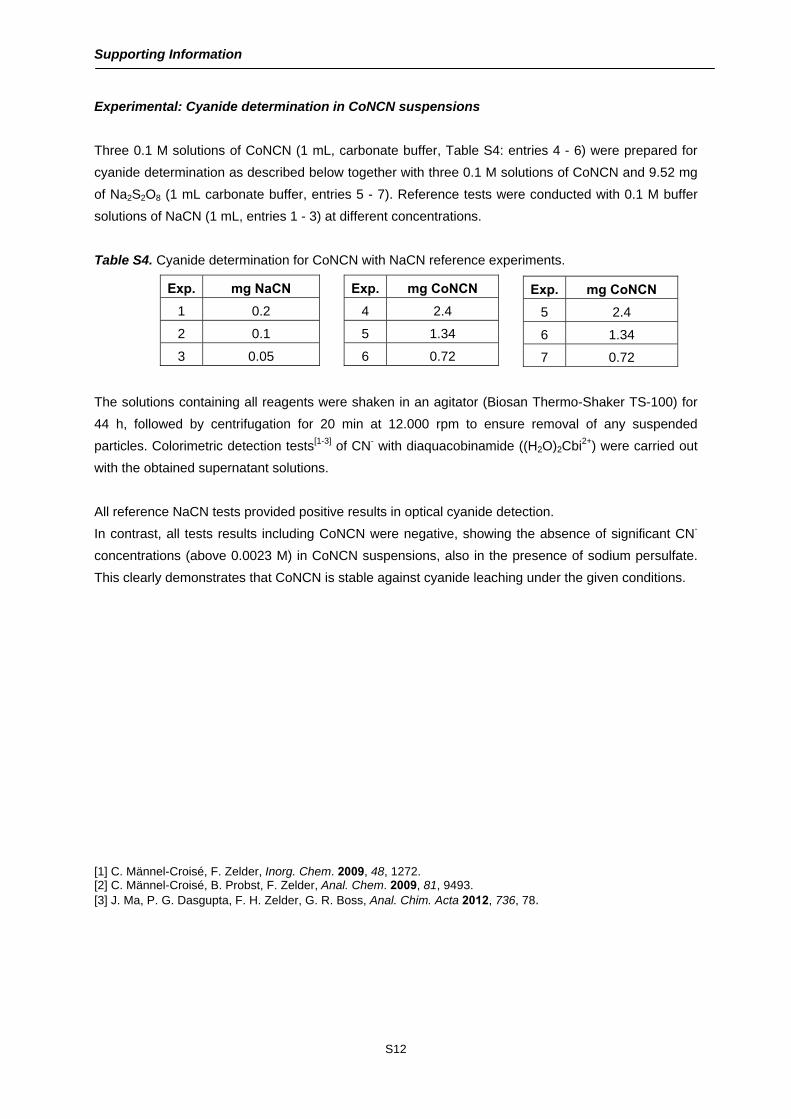
Experimental: Cyanide determination in CoNCN suspensions
Three 0.1 M solutions of CoNCN (1 mL, carbonate buffer, Table S4: entries 4 - 6) were prepared for
cyanide determination as described below together with three 0.1 M solutions of CoNCN and 9.52 mg
of Na2S2O8 (1 mL carbonate buffer, entries 5 - 7). Reference tests were conducted with 0.1 M buffer
solutions of NaCN (1 mL, entries 1 - 3) at different concentrations.
Table S4. Cyanide determination for CoNCN with NaCN reference experiments.
The solutions containing all reagents were shaken in an agitator (Biosan Thermo-Shaker TS-100) for
44 h, followed by centrifugation for 20 min at 12.000 rpm to ensure removal of any suspended
particles. Colorimetric detection tests[1-3] of CN- with diaquacobinamide ((H2O)2Cbi2+) were carried out
with the obtained supernatant solutions.
All reference NaCN tests provided positive results in optical cyanide detection.
In contrast, all tests results including CoNCN were negative, showing the absence of significant CN-
concentrations (above 0.0023 M) in CoNCN suspensions, also in the presence of sodium persulfate.
This clearly demonstrates that CoNCN is stable against cyanide leaching under the given conditions.
[1] C. Männel-Croisé, F. Zelder, Inorg. Chem. 2009, 48, 1272. [2] C. Männel-Croisé, B. Probst, F. Zelder, Anal. Chem. 2009, 81, 9493. [3] J. Ma, P. G. Dasgupta, F. H. Zelder, G. R. Boss, Anal. Chim. Acta 2012, 736, 78.
Exp. mg NaCN
1 0.2
2 0.1
3 0.05
Exp. mg CoNCN
4 2.4
5 1.34
6 0.72
Exp. mg CoNCN
5 2.4
6 1.34
7 0.72
Supporting Information
S13
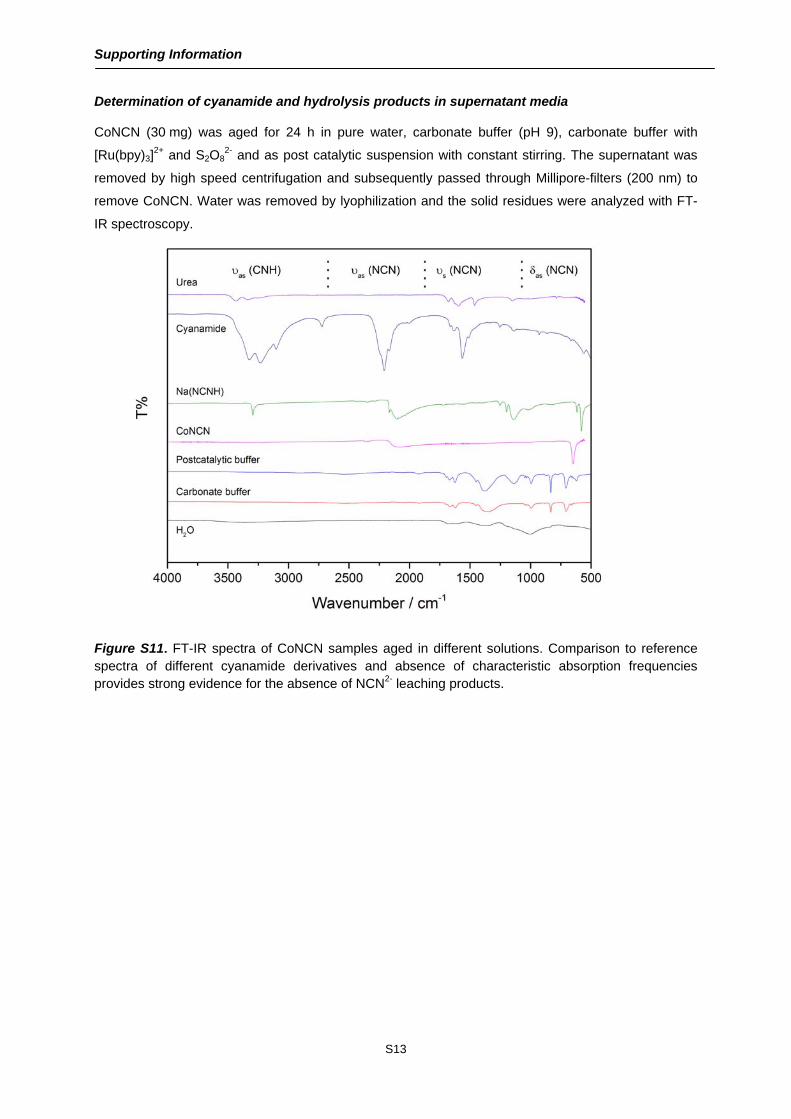
Determination of cyanamide and hydrolysis products in supernatant media
CoNCN (30 mg) was aged for 24 h in pure water, carbonate buffer (pH 9), carbonate buffer with
[Ru(bpy)3]2+ and S2O8
2- and as post catalytic suspension with constant stirring. The supernatant was
removed by high speed centrifugation and subsequently passed through Millipore-filters (200 nm) to
remove CoNCN. Water was removed by lyophilization and the solid residues were analyzed with FT-
IR spectroscopy.
Figure S11. FT-IR spectra of CoNCN samples aged in different solutions. Comparison to reference spectra of different cyanamide derivatives and absence of characteristic absorption frequencies provides strong evidence for the absence of NCN2- leaching products.

Supporting Information
S14
Figure S12. PXRD patterns of CoNCN before (black) and after photocatalysis (blue) in carbonate
buffer at pH 9 (reference pattern: ICDD 04-015-1039).
Figure S13. FT-IR spectra of CoNCN before (black) and after photocatalysis (red) in carbonate buffer
(pH 9). The broad band between 1600 cm-1 and 1200 cm-1 corresponds to the side product melem.
Support
Figure S
recorded
Figure S
at pH 9 w
[4] O. Lich
ting Informa
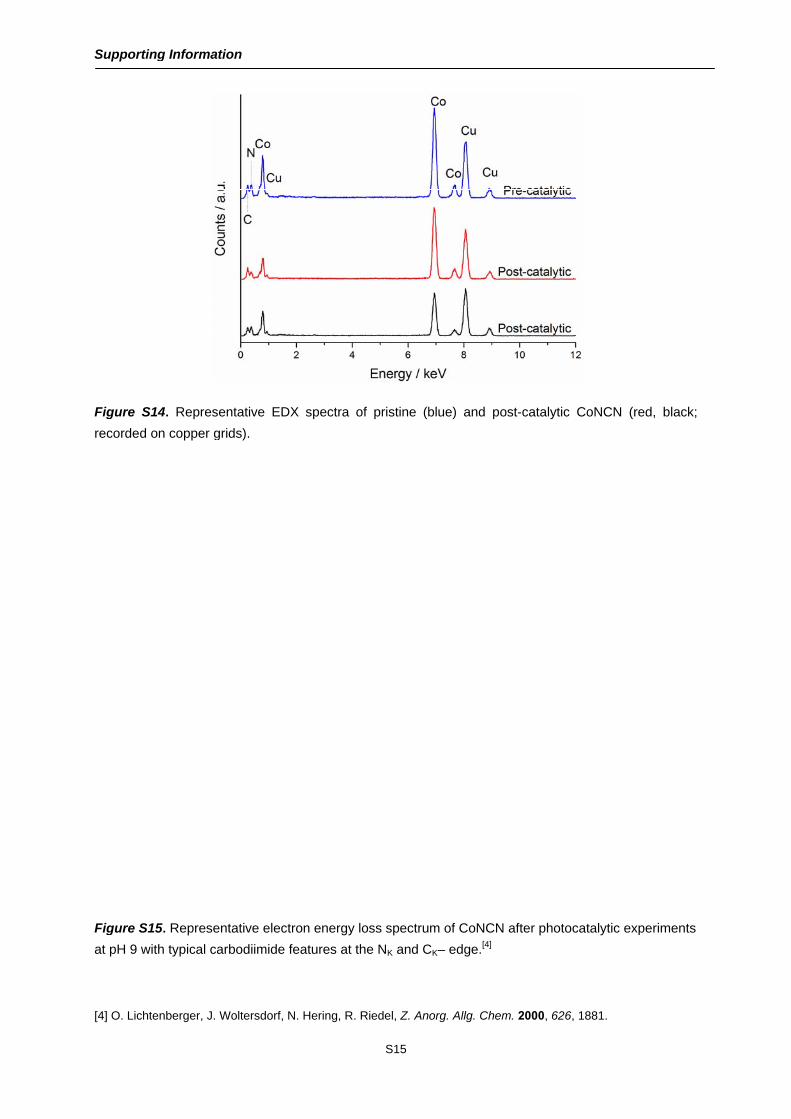
S14. Repres
d on copper g
S15. Represe
with typical c
htenberger, J.
ation
sentative ED
grids).
entative elec
carbodiimide
. Woltersdorf,
DX spectra o
ctron energy
features at t
N. Hering, R.
S15
of pristine (b
loss spectru
the NK and C
Riedel, Z. An
blue) and po
m of CoNCN
CK– edge.[4]
org. Allg. Che
ost-catalytic
N after photo
em. 2000, 626
CoNCN (re
catalytic exp
, 1881.
ed, black;
periments
Support
Figure S
carbonat
Figure S
ting Informa
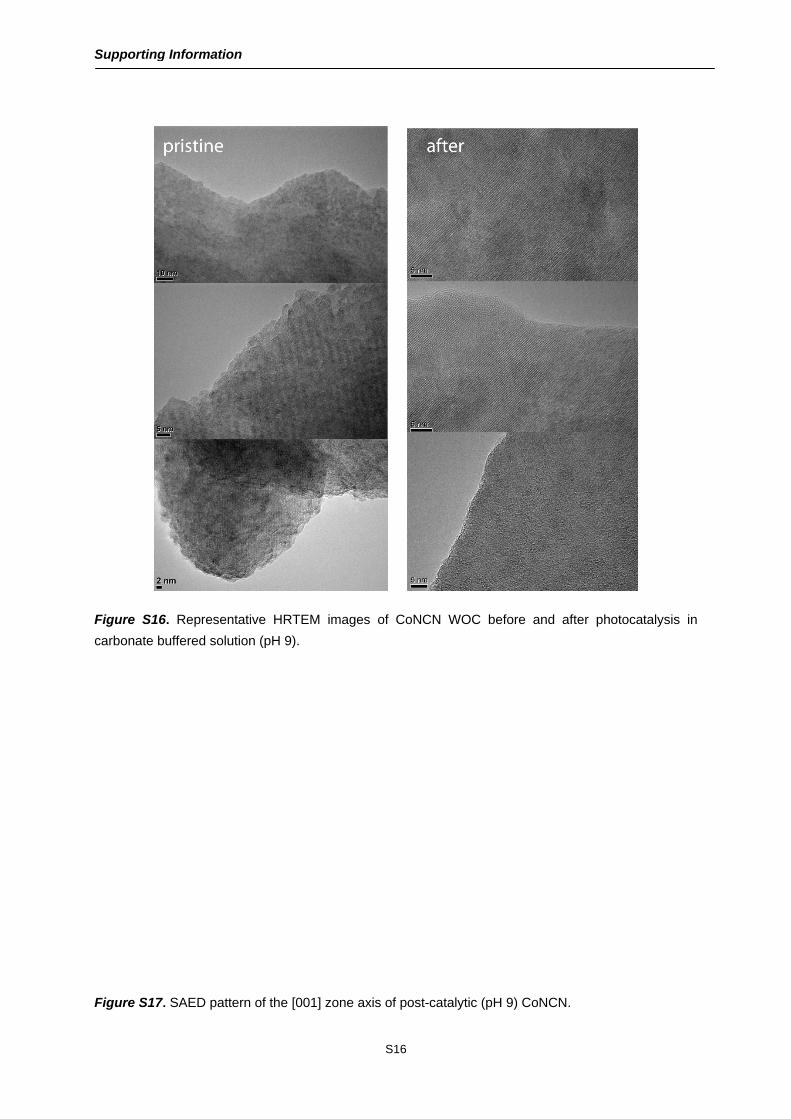
S16. Repres
te buffered s
S17. SAED p
ation
sentative HR
solution (pH 9
pattern of the
RTEM image
9).
e [001] zone
S16
es of CoNC
axis of post-
CN WOC be
catalytic (pH
efore and af
H 9) CoNCN.
fter photocattalysis in
Supporting Information
S17
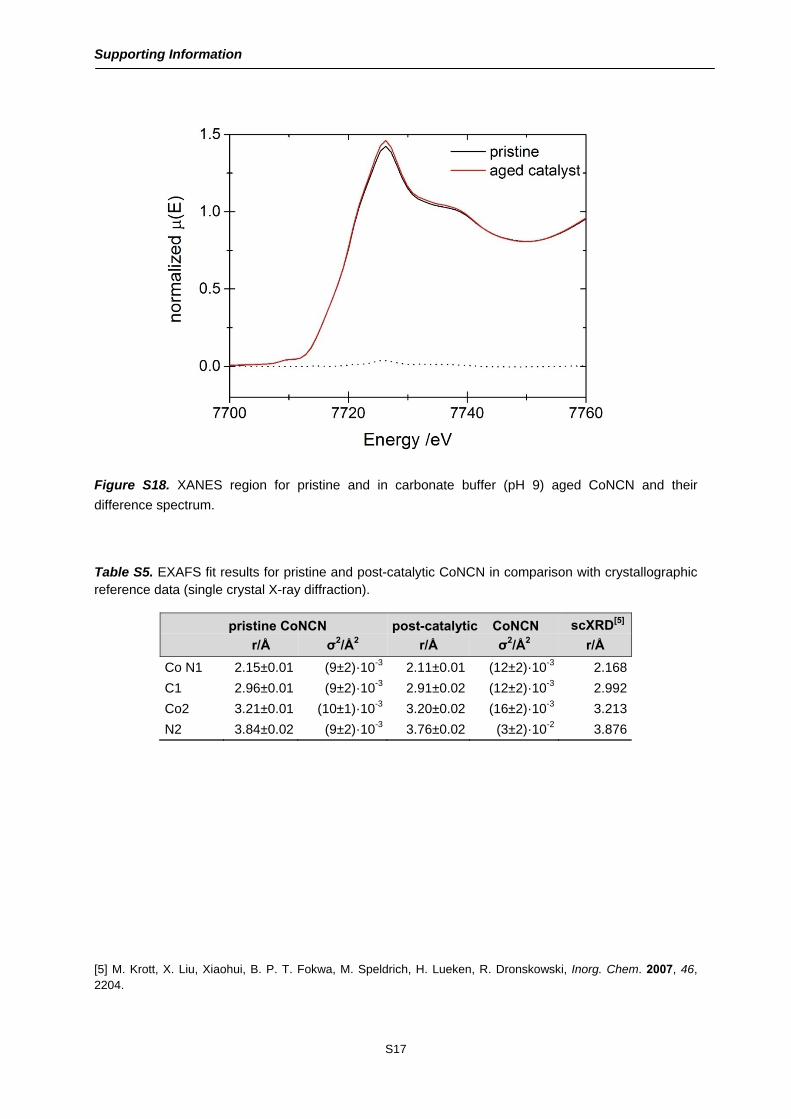
Figure S18. XANES region for pristine and in carbonate buffer (pH 9) aged CoNCN and their
difference spectrum.
Table S5. EXAFS fit results for pristine and post-catalytic CoNCN in comparison with crystallographic reference data (single crystal X-ray diffraction).
pristine CoNCN post-catalytic CoNCN scXRD[5]
r/Å σ2/Å2 r/Å σ2/Å2 r/Å
Co N1 2.15±0.01 (9±2)·10-3 2.11±0.01 (12±2)·10-3 2.168
C1 2.96±0.01 (9±2)·10-3 2.91±0.02 (12±2)·10-3 2.992
Co2 3.21±0.01 (10±1)·10-3 3.20±0.02 (16±2)·10-3 3.213
N2 3.84±0.02 (9±2)·10-3 3.76±0.02 (3±2)·10-2 3.876
[5] M. Krott, X. Liu, Xiaohui, B. P. T. Fokwa, M. Speldrich, H. Lueken, R. Dronskowski, Inorg. Chem. 2007, 46, 2204.
Supporting Information
S18
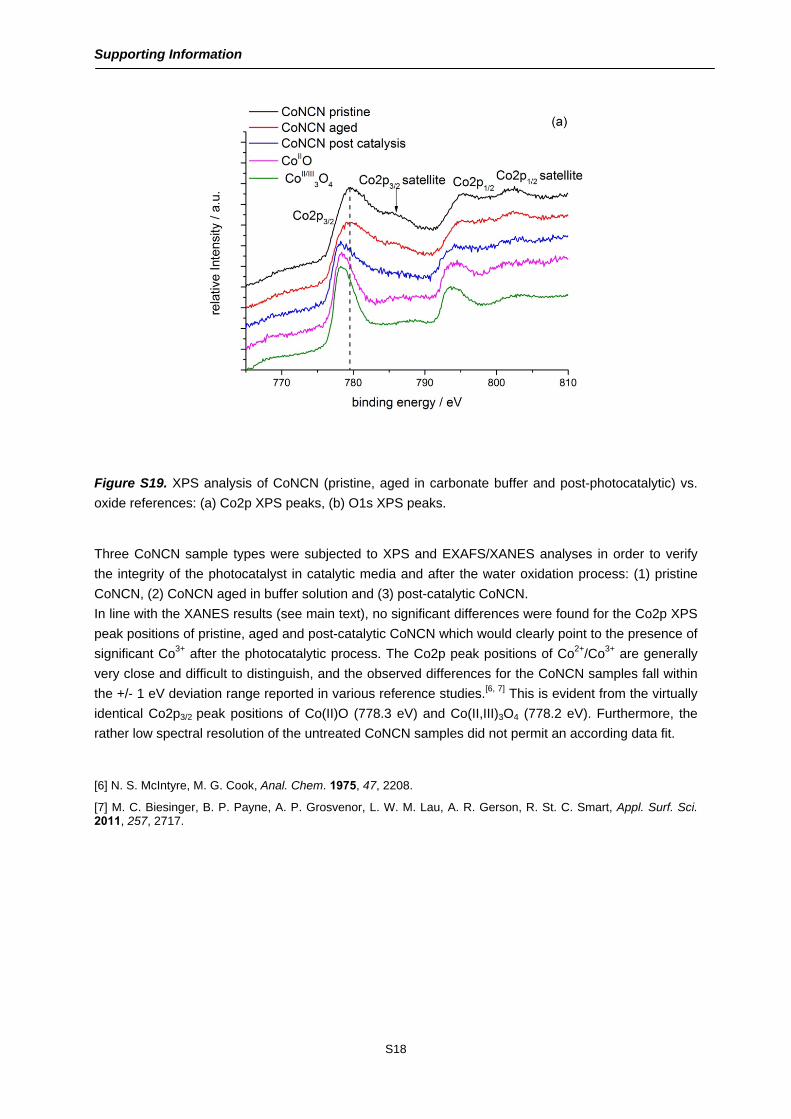
Figure S19. XPS analysis of CoNCN (pristine, aged in carbonate buffer and post-photocatalytic) vs.
oxide references: (a) Co2p XPS peaks, (b) O1s XPS peaks.
Three CoNCN sample types were subjected to XPS and EXAFS/XANES analyses in order to verify
the integrity of the photocatalyst in catalytic media and after the water oxidation process: (1) pristine
CoNCN, (2) CoNCN aged in buffer solution and (3) post-catalytic CoNCN.
In line with the XANES results (see main text), no significant differences were found for the Co2p XPS
peak positions of pristine, aged and post-catalytic CoNCN which would clearly point to the presence of
significant Co3+ after the photocatalytic process. The Co2p peak positions of Co2+/Co3+ are generally
very close and difficult to distinguish, and the observed differences for the CoNCN samples fall within
the +/- 1 eV deviation range reported in various reference studies.[6, 7] This is evident from the virtually
identical Co2p3/2 peak positions of Co(II)O (778.3 eV) and Co(II,III)3O4 (778.2 eV). Furthermore, the
rather low spectral resolution of the untreated CoNCN samples did not permit an according data fit.
[6] N. S. McIntyre, M. G. Cook, Anal. Chem. 1975, 47, 2208.
[7] M. C. Biesinger, B. P. Payne, A. P. Grosvenor, L. W. M. Lau, A. R. Gerson, R. St. C. Smart, Appl. Surf. Sci. 2011, 257, 2717.
Supporting Information
S19
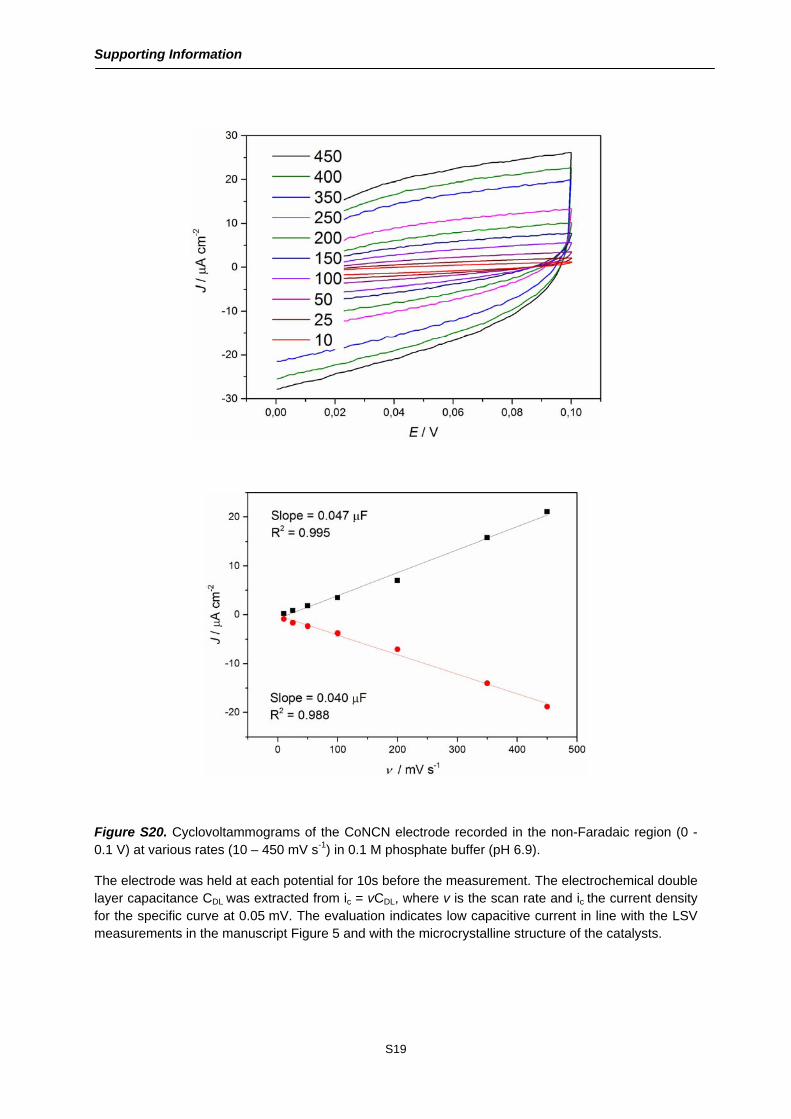
Figure S20. Cyclovoltammograms of the CoNCN electrode recorded in the non-Faradaic region (0 - 0.1 V) at various rates (10 – 450 mV s-1) in 0.1 M phosphate buffer (pH 6.9).
The electrode was held at each potential for 10s before the measurement. The electrochemical double layer capacitance CDL was extracted from ic = vCDL, where v is the scan rate and ic the current density for the specific curve at 0.05 mV. The evaluation indicates low capacitive current in line with the LSV measurements in the manuscript Figure 5 and with the microcrystalline structure of the catalysts.
Support
Figure S
were co
buffer (p
Figure 2and 100scan ratdeposite
ting Informa
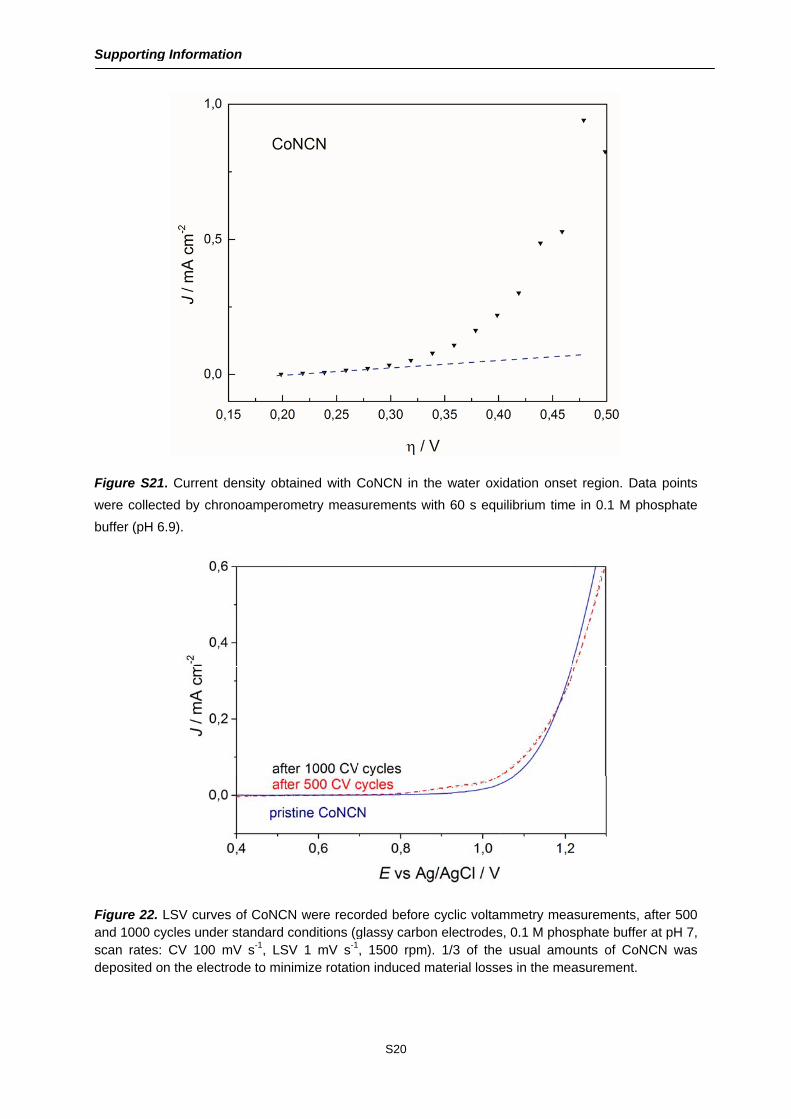
S21. Current
llected by ch
pH 6.9).
22. LSV curv0 cycles undtes: CV 100ed on the ele
ation
t density obt
hronoampero
ves of CoNCder standard 0 mV s-1, LSctrode to min
tained with C
ometry meas
CN were recoconditions (g
SV 1 mV s-1
nimize rotatio
S20
CoNCN in th
surements w
orded beforeglassy carbo, 1500 rpm)on induced m
he water oxi
with 60 s equ
e cyclic voltamon electrodes). 1/3 of thematerial losse
idation onse
uilibrium time
mmetry meas, 0.1 M phose usual amoes in the mea
et region. Da
e in 0.1 M p
asurements, sphate buffe
ounts of CoNasurement.
ata points
hosphate
after 500 r at pH 7,
NCN was
Support
Figure S
ting Informa
S23. Represe
ation
entative SEMM images of
S21
FTO glass electrodes beefore and afteer the stabilitty tests.
Supporting Information
S22
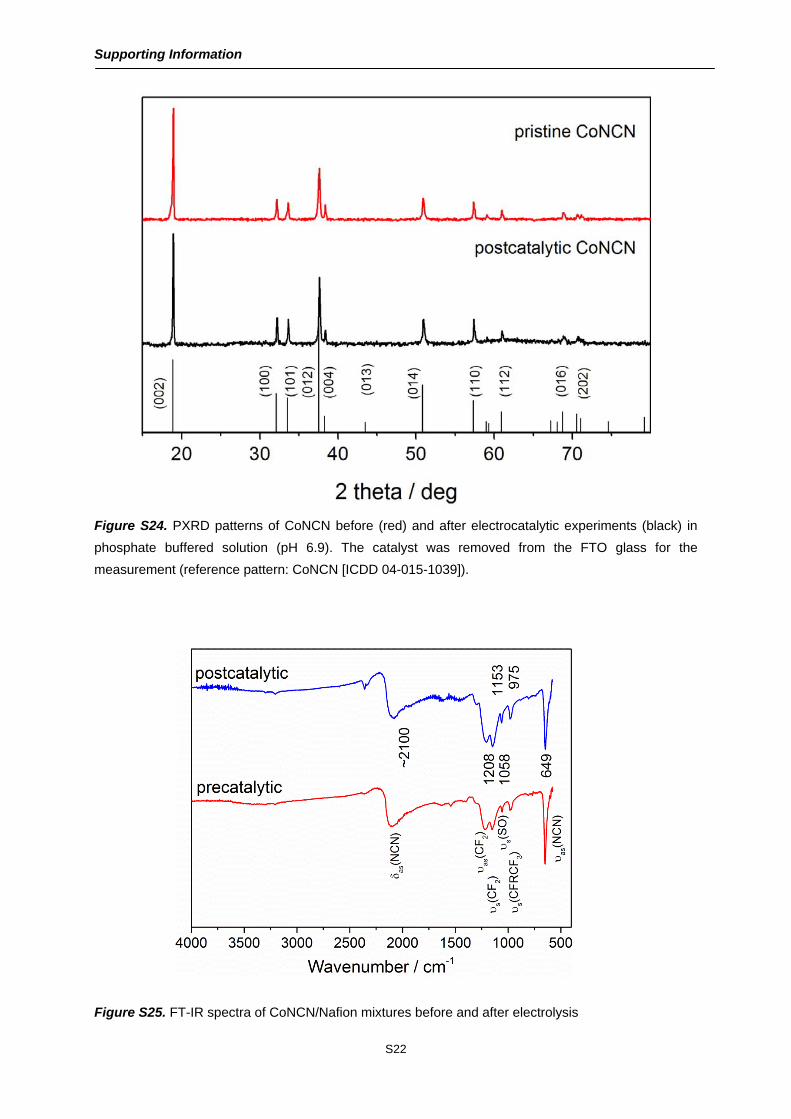
Figure S24. PXRD patterns of CoNCN before (red) and after electrocatalytic experiments (black) in
phosphate buffered solution (pH 6.9). The catalyst was removed from the FTO glass for the
measurement (reference pattern: CoNCN [ICDD 04-015-1039]).
Figure S25. FT-IR spectra of CoNCN/Nafion mixtures before and after electrolysis
Supporting Information
S23
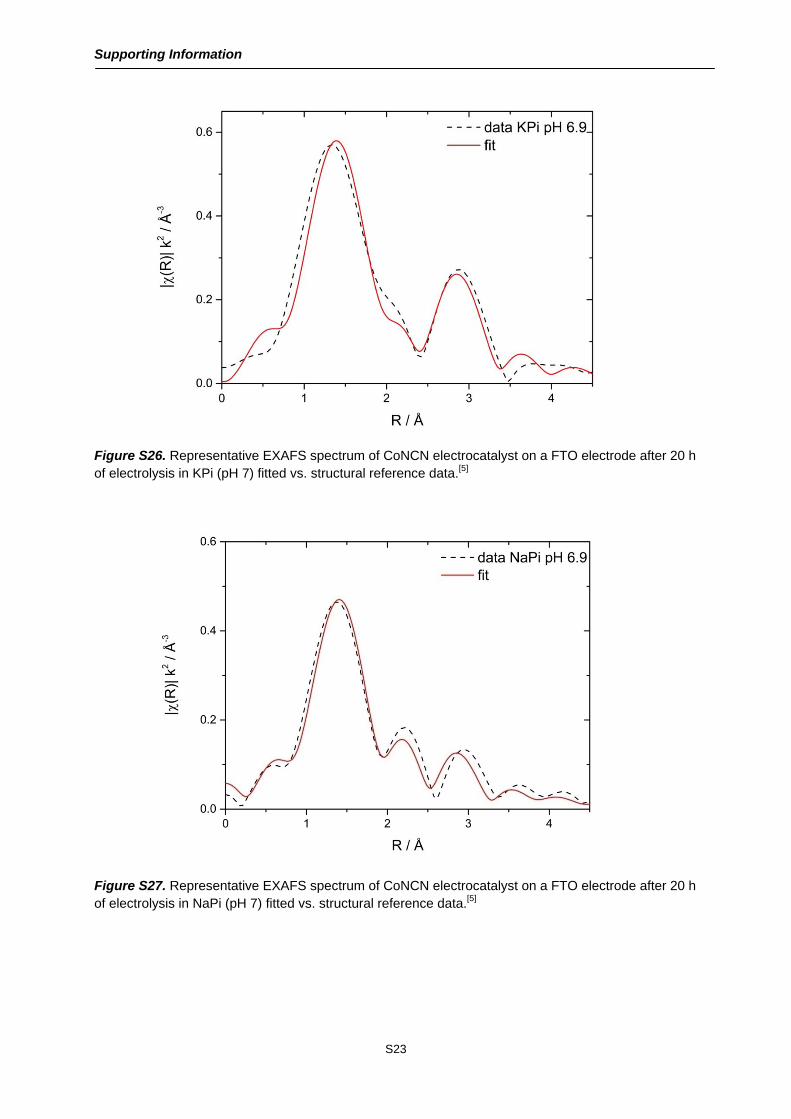
Figure S26. Representative EXAFS spectrum of CoNCN electrocatalyst on a FTO electrode after 20 h of electrolysis in KPi (pH 7) fitted vs. structural reference data.[5]
Figure S27. Representative EXAFS spectrum of CoNCN electrocatalyst on a FTO electrode after 20 h of electrolysis in NaPi (pH 7) fitted vs. structural reference data.[5]
Supporting Information
S24
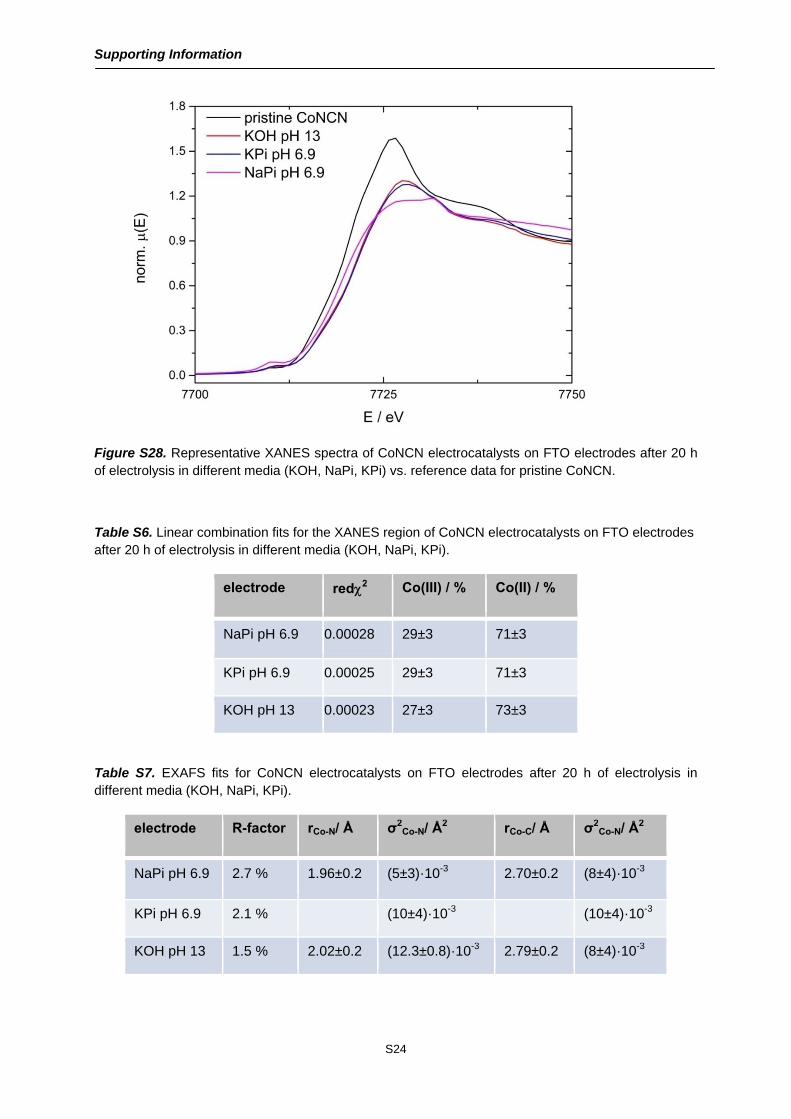
Figure S28. Representative XANES spectra of CoNCN electrocatalysts on FTO electrodes after 20 h of electrolysis in different media (KOH, NaPi, KPi) vs. reference data for pristine CoNCN.
Table S6. Linear combination fits for the XANES region of CoNCN electrocatalysts on FTO electrodes after 20 h of electrolysis in different media (KOH, NaPi, KPi).
electrode red2 Co(III) / % Co(II) / %
NaPi pH 6.9 0.00028 29±3 71±3
KPi pH 6.9 0.00025 29±3 71±3
KOH pH 13 0.00023 27±3 73±3
Table S7. EXAFS fits for CoNCN electrocatalysts on FTO electrodes after 20 h of electrolysis in different media (KOH, NaPi, KPi).
electrode R-factor rCo-N/ Å σ2Co-N/ Å2 rCo-C/ Å σ2
Co-N/ Å2
NaPi pH 6.9 2.7 % 1.96±0.2 (5±3)·10-3 2.70±0.2 (8±4)·10-3
KPi pH 6.9 2.1 % (10±4)·10-3 (10±4)·10-3
KOH pH 13 1.5 % 2.02±0.2 (12.3±0.8)·10-3 2.79±0.2 (8±4)·10-3
Supporting Information
S25
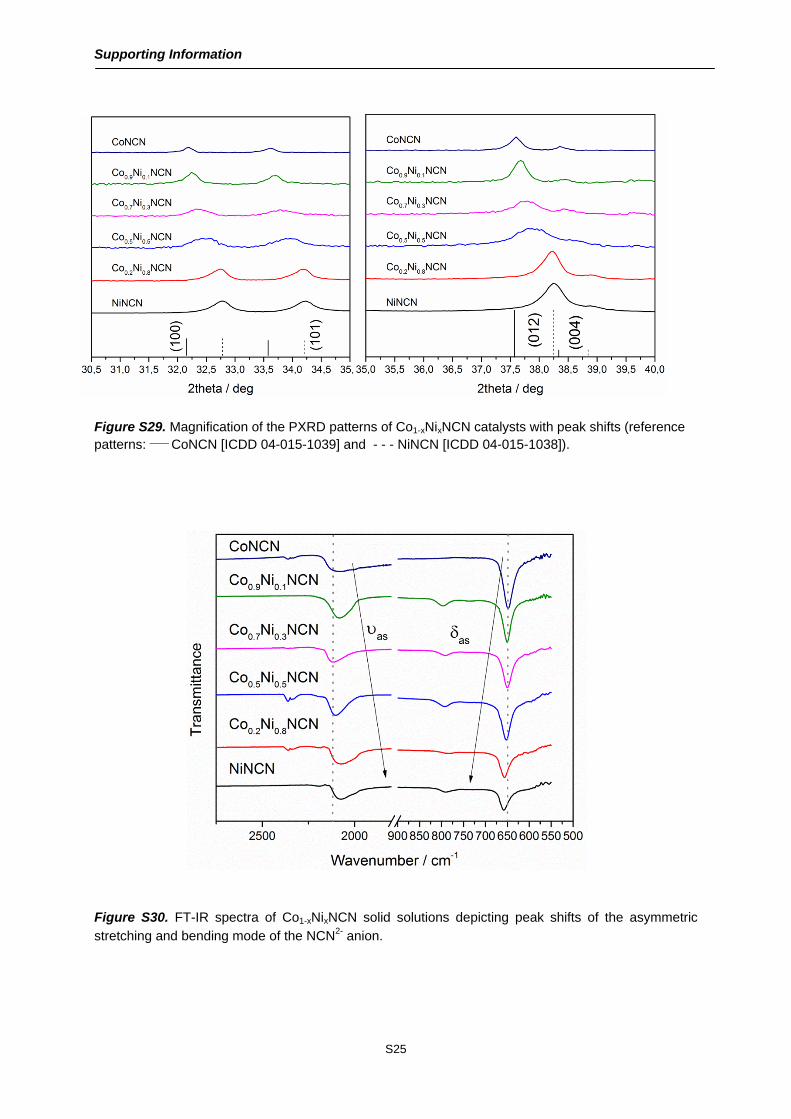
Figure S29. Magnification of the PXRD patterns of Co1-xNixNCN catalysts with peak shifts (reference patterns: ____ CoNCN [ICDD 04-015-1039] and - - - NiNCN [ICDD 04-015-1038]).
Figure S30. FT-IR spectra of Co1-xNixNCN solid solutions depicting peak shifts of the asymmetric
stretching and bending mode of the NCN2- anion.
Supporting Information
S26
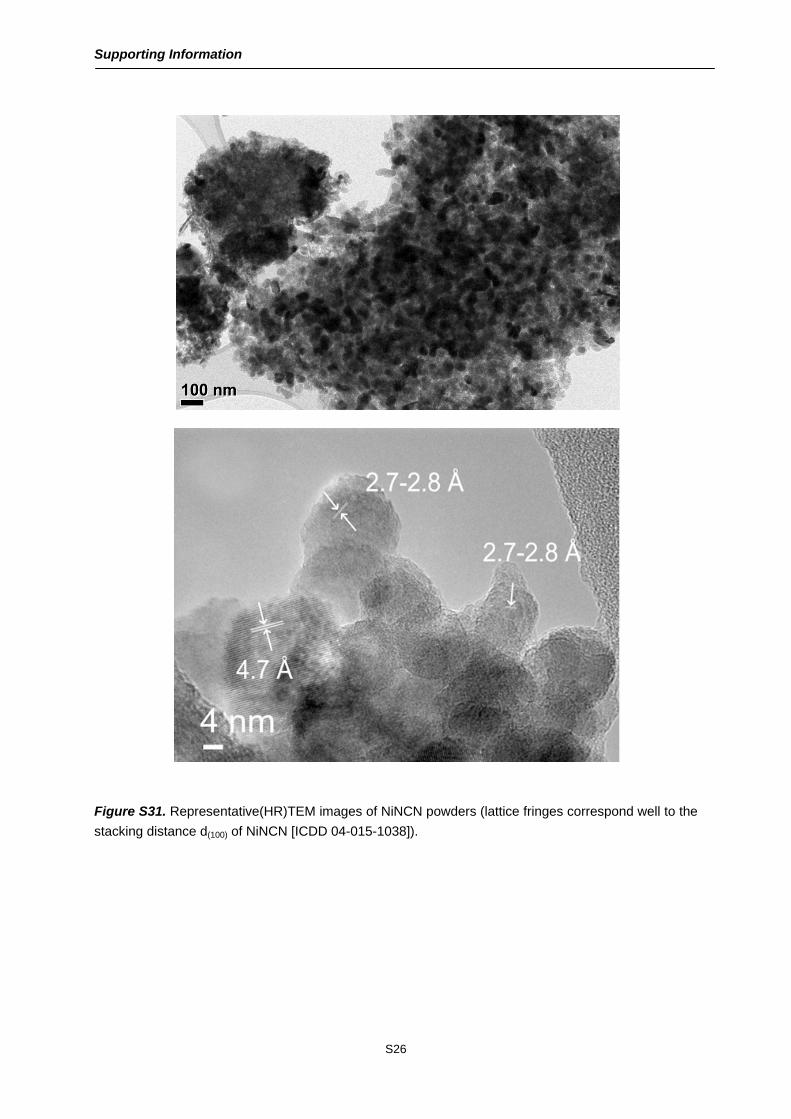
Figure S31. Representative(HR)TEM images of NiNCN powders (lattice fringes correspond well to the
stacking distance d(100) of NiNCN [ICDD 04-015-1038]).
Supporting Information
S27
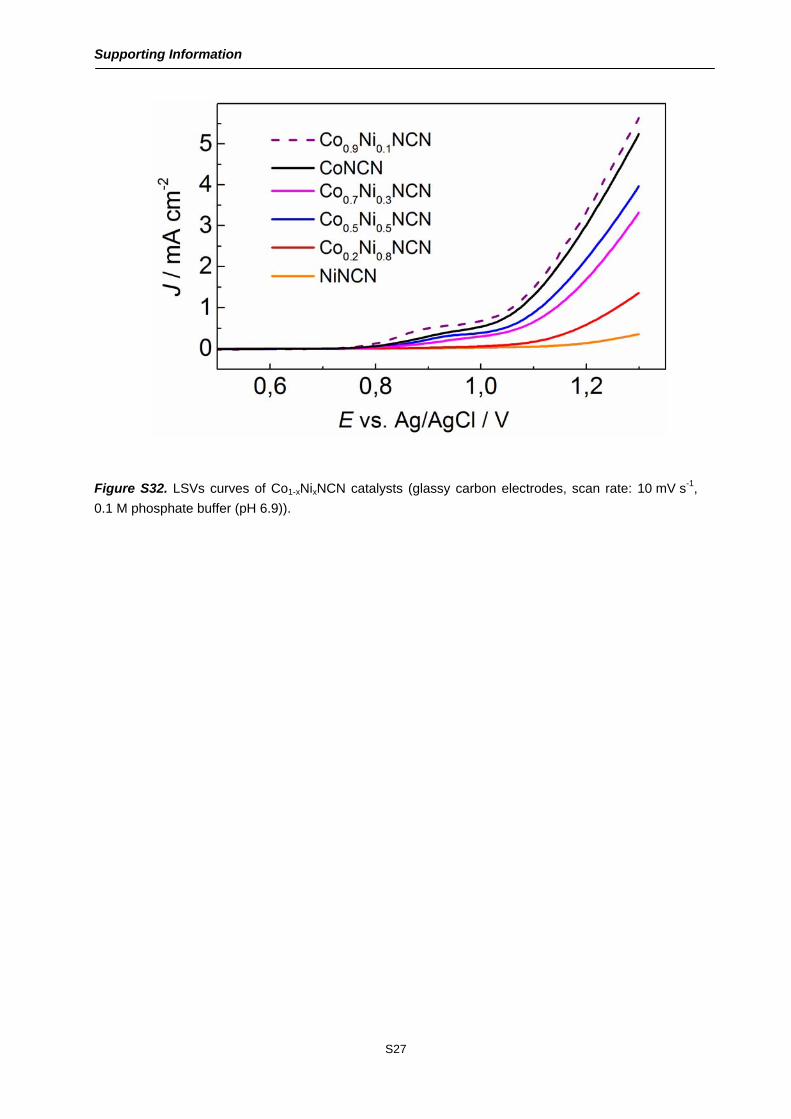
Figure S32. LSVs curves of Co1-xNixNCN catalysts (glassy carbon electrodes, scan rate: 10 mV s-1,
0.1 M phosphate buffer (pH 6.9)).