Embed Size (px)
Citation preview

A Functional Example of Analyzing Co-occurrence and Sequence of Variables
Step-by-step techniques in SPSSWhitney I. Mattson 09/15/2010

What is in this Document
How to look at proportions of a behavior
How to look at proportion of co-occurrence
How to look at simple patterns of transition
Using a rate per minute measure SPSS syntax for the functions
described

The Example file
Contains Repeated rows for each
subject Each row corresponds
to the same unit of time Multiple variables from
a 1 to 5 scale▪ Missing values represent
no occurrence These methods are
Most applicable to files in a similar format
Tools here can be adapted to other cases

How to look at proportions of a behavior
The more traditional way: Split your file by a
break variable, here idSORT CASES BY id.SPLIT FILE LAYERED BY id.
Run FrequenciesFREQUENCIES VARIABLES=AU1 /ORDER=ANALYSIS.
This works well▪ But is limited in what it
can tell us

How to look at proportions of a behavior An aggregation
approach: In Data > Aggregate …
▪ Set your break variable (the same as the split file)
▪ Create two summaries of each variable ▪ Weighted N▪ Weighted Missing Values
▪ Create a new dataset with only the aggregated variables

How to look at proportions of a behavior The new file contains
A row for each subject The numerator and
denominator for our proportion
The proportion can be calculated with a compute statement
More time consuming Needed for more complex
proportion scores Proportions can be
analyzed
DATASET DECLARE Agg.AGGREGATE /OUTFILE='Agg' /BREAK=id /AU1_n=N(AU1) /AU1_nmiss=NMISS(AU1).
COMPUTE AU1_prop=AU1_n / (AU1_n + AU1_nmiss).EXECUTE.

How to look at proportion of co-occurrence
Back to the base file Compute a value when
variables co-occur▪ Here when there is one valid
case of variable AU1 and variable AU4
Aggregate again ▪ Add in summaries of the new
variable▪ Weighted N▪ Weighted Missing Values
Compute the proportion of time these two variables co-occur
IF (NVALID(AU1)>0 & NVALID(AU4)>0) AU1_AU4=1.EXECUTE.
DATASET DECLARE Agg.AGGREGATE /OUTFILE='Agg' /BREAK=id /AU1_n=N(AU1) /AU1_nmiss=NMISS(AU1) /AU4_n=N(AU4) /AU4_nmiss=NMISS(AU4) /AU1_AU4_n=N(AU1_AU4) /AU1_AU4_nmiss=NMISS(AU1_AU4).
COMPUTE AU1_AU4_prop=AU1_AU4_n / (AU1_AU4_n + AU1_AU4_nmiss).EXECUTE.

How to look at proportion of co-occurrence We now have a
proportion of the session that AU1 and AU4 co-occur
Using these same functions with different denominators yields other proportions
For example If you instead computed
AU1 and AU4 co-occurrence over AU4 cases
Proportion of time during AU4 when AU1 co-occurred
COMPUTE AU1_AU4_during_AU4_prop=AU1_AU4_n / (AU4_n).EXECUTE.

How to look at simple patterns of transition
Proportions are helpful in looking at characteristics of behavior broadly
However, we miss the evolution of sequence and co-occurrence throughout time
Time-series or lag analysis can tell us how often certain behaviors transition to certain other behaviors.

How to look at simple patterns of transition
Using the lag function to get values in previous rows
lag ( variable name ) Returns the last row’s value for the
specified variable Can be used in compute statements
to compare changes in variables

How to look at simple patterns of transition Here we use a lag
function to assess a transition When AU11 moves
to AU11 & AU14▪ This gives us the
frequency that AU14 occurs when AU11 is already there
IF (NVALID(AU11)>0 & NVALID(lag(AU11))>0 & NVALID(lag(AU14))<1 & NVALID(AU14)>0) AU11_to_AU11_AU14=1.EXECUTE.

How to look at simple patterns of transition
In addition to obtaining a straight frequency you can also use this transition variable to Assess a proportion of a specific
transition out of all transitions Summarize several of these variables
into a composite variable of transitions Plug these variables into more complex
equations
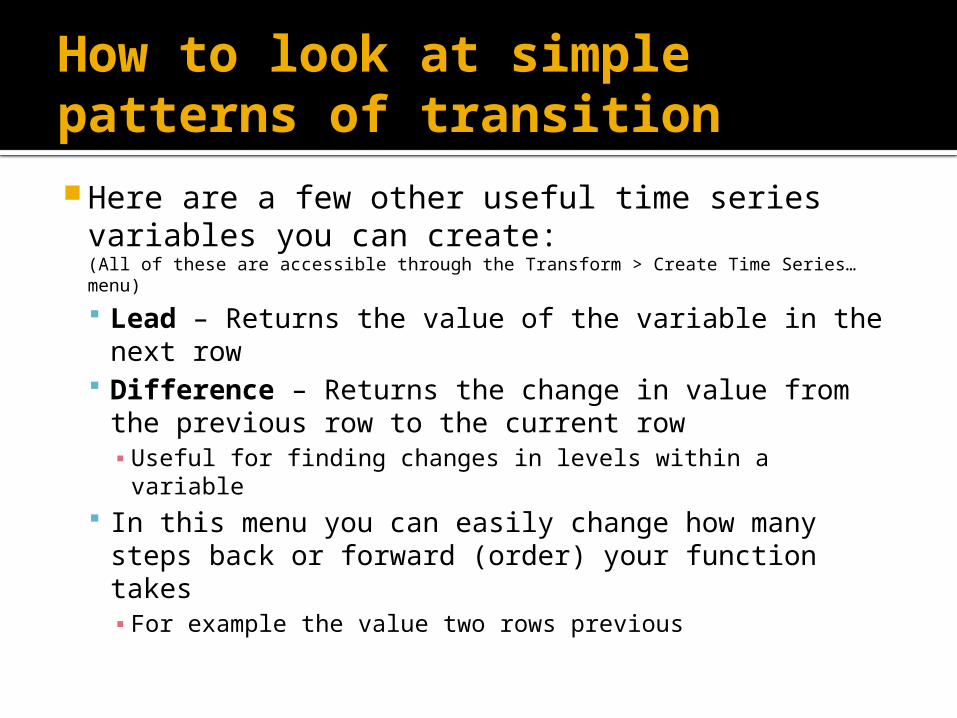
How to look at simple patterns of transition Here are a few other useful time series
variables you can create:(All of these are accessible through the Transform > Create Time Series… menu)
Lead – Returns the value of the variable in the next row
Difference – Returns the change in value from the previous row to the current row▪ Useful for finding changes in levels within a variable
In this menu you can easily change how many steps back or forward (order) your function takes▪ For example the value two rows previous

Using a rate per minute measure
Creating a rate per minute measure can Help tell you how often a behavior
occurs▪ While controlling for variation in session
duration Can be used to summarize changes
during meaningful epochs of time▪ For example, when Stimulus A is presented,
do subjects increase their onset of Behavior X

Using a rate per minute measure
Calculating a rate per minute Create a transition
(lag) variable for behavior onset
Use Aggregation to create:▪ Frequency of onset
variable▪ A duration of session
variable
IF (NVALID(AU1)>0 & NVALID(lag(AU1))<1) AU1_onset=1.EXECUTE.
DATASET DECLARE Agg.AGGREGATE /OUTFILE='Agg' /BREAK=id /AU11_onset_n=N(AU1_onset) /frame_n=N(frame).

Using a rate per minute measure
The new aggregated dataset allows Calculation of a
rate per minute variable
(30 for the number of frames per second,
60 for the number of seconds in a minute) Comparison across
subjects in rate per minute
COMPUTE AU11_RPM=AU11_onset_n / (frame_n / (30*60)).EXECUTE.

Using a rate per minute measure
You can also use this same method for different epochs of time Just add more break variables
For example, I create variable Stim_1 that signifies when I present a stimuli
I then aggregate by ID and this new variable…
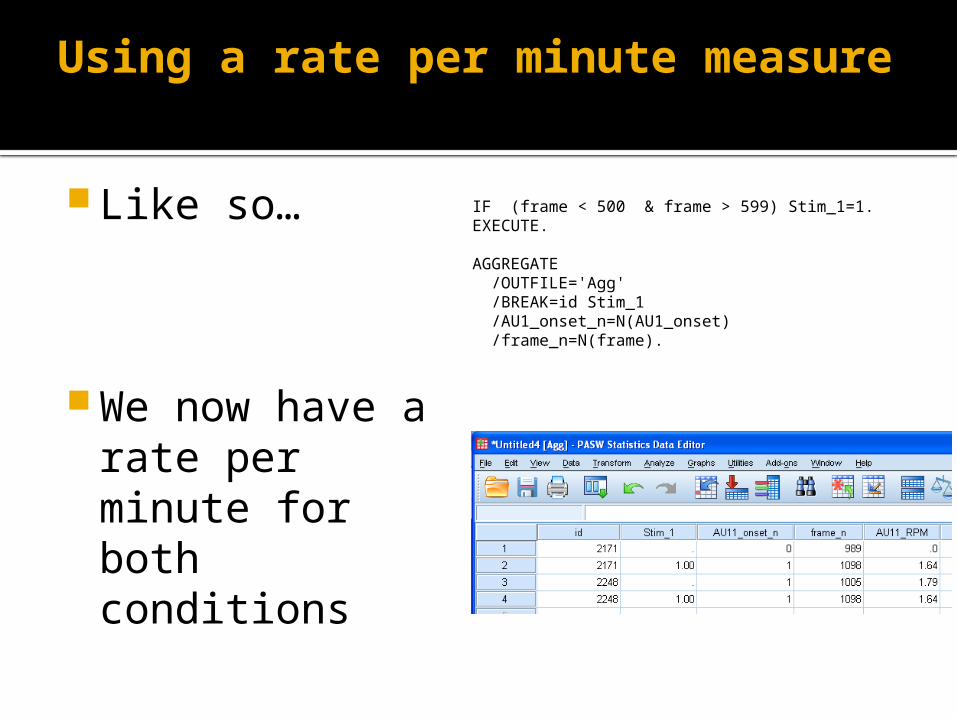
Using a rate per minute measure
Like so…
We now have a rate per minute for both conditions
IF (frame < 500 & frame > 599) Stim_1=1.EXECUTE.
AGGREGATE /OUTFILE='Agg' /BREAK=id Stim_1 /AU1_onset_n=N(AU1_onset) /frame_n=N(frame).

Further analysis and combining techniques
Based on the aggregated datasets presented here you can Analyze group differences in
▪ Proportions of behavior▪ Proportions of behavior co-occurrence▪ Number of transitions▪ Rate per minute across meaningful periods of
time

Further analysis and combining techniques
Based on these variable creation techniques you can Combine methods to produce variables
which assess more complex questions For example:
▪ Is the proportion of Variable A during Variable B higher after Event X?
▪ Is the rate of transition per minute from Variable A to Variable B more frequent when Variable C co-occurs?

Final notes
As with any set of analyses, ensure that the particular variable you are calculating in a meaningful construct
Thank you for your interest!