Embed Size (px)
Citation preview
www.elsevier.com/locate/ynimg
NeuroImage 27 (2005) 279 – 290
Spatial extent of oxygen metabolism and hemodynamic changes
during functional activation of the rat somatosensory cortex
Andrew K. Dunn,* Anna Devor, Anders M. Dale, and David A. Boas
Martinos Center for Biomedical Imaging, Massachusetts General Hospital, Harvard Medical School, 149 13th Street, Charlestown, MA 02129, USA
Received 3 September 2004; revised 16 February 2005; accepted 5 April 2005
Available online 31 May 2005
The spatial extent of the changes in oxy-hemoglobin (HbO), deoxy-
hemoglobin (HbR), total hemoglobin concentration (HbT), cerebral
blood flow (CBF), and the cerebral metabolic rate of oxygen
(CMRO2) in response to forepaw and whisker stimulation were
compared in the rat somatosensory cortex using a combination of
multi-wavelength reflectance imaging and laser speckle contrast
imaging of cerebral blood flow. The spatial extents of the response
of each hemodynamic parameter and CMRO2 were found to be
comparable at the time of peak response, and at early times following
stimulation onset, the spatial extent of the change in HbR was smaller
than that of HbO, HbT, CBF, and CMRO2. In addition, a slight
spatial dependence was found in the power law coefficient relating
changes in CBF and HbT. Although the CMRO2 response is a
metabolic measure and thus expected to have a more localized
response than the hemodynamic parameters, the results presented
here suggest that this may not be the case in general, possibly due to
the increased sensitivity of optical imaging techniques to superficial
cortical layers where the lateral extent of the metabolic and neuronal
activation is larger compared to that in layer IV. In addition, we
found that the measured spatial extent of the CMRO2 changes was
insensitive to assumptions made in the calculation of the CMRO2
changes such as baseline hemoglobin concentrations, vascular
weighting constants, and wavelength dependence of tissue scattering.
Multi-parameter full field imaging of the functional response provides
a more complete picture of the hemodynamic response to functional
activation including the spatial and temporal estimation of CMRO2
changes.
D 2005 Elsevier Inc. All rights reserved.
Keywords: Hemodynamic changes; Hemoglobin; Oxygen metabolism
Introduction
The relationship between the hemodynamic and metabolic
responses has been the subject of great interest since the PET
measurements by Fox and Raichle (Fox and Raichle, 1986; Fox
1053-8119/$ - see front matter D 2005 Elsevier Inc. All rights reserved.
doi:10.1016/j.neuroimage.2005.04.024
* Corresponding author. Fax: +1 617 726 7422.
E-mail address: [email protected] (A.K. Dunn).
Available online on ScienceDirect (www.sciencedirect.com).
et al., 1988) who found that focal increases in cerebral blood
flow (CBF) were roughly 6 times greater than that in the cerebral
rate of metabolic oxygen (CMRO2). Much of this interest has
been driven recently by the fact that the BOLD fMRI signal is
dependent on the changes in CBF, cerebral blood volume (CBV),
and CMRO2. Therefore, in order to fully understand the origins
of the BOLD signal, the individual dynamics and relationships
between the changes in each of the hemodynamic and metabolic
parameters must be better understood.
Despite the recent interest in imaging CMRO2 changes during
brain activation, the spatial extent of the CMRO2 changes has not
been investigated in detail. Deoxyglucose autoradiographic anal-
ysis of glucose metabolism changes in response to functional
activation in rats (McCasland and Woolsey, 1988) and monkeys
(Tootell et al., 1988) has revealed that the metabolic changes are
well localized to the functional architecture of the cortex in layer
IV. However, mapping techniques based on hemodynamic
changes, such as optical imaging of intrinsic signals and fMRI,
typically reveal less localized responses due to vascular overspill
phenomenon (Brett-Green et al., 2001; Erinjeri and Woolsey, 2002;
Grinvald et al., 1994; Tootell et al., 1997). In this paper, we sought
to investigate whether the CMRO2 changes in the rat somatosen-
sory cortex were more localized than the accompanying hemody-
namic changes using combined laser speckle contrast imaging of
CBF and multi-wavelength reflectance imaging of HbO, HbR, and
HbT.
Due to limitations of the various functional brain imaging
techniques such as fMRI, PET, and optical imaging, simultaneous
measurement of all of the parameters necessary for calculation of
CMRO2 changes has been challenging. To overcome these
limitations, various assumptions and models about the relation-
ships between hemodynamic and metabolic parameters have been
proposed (Buxton et al., 1998; Hyder et al., 1998; Jones et al.,
2001; Mandeville et al., 1999). In particular, for fMRI and optical
imaging, the relationship between CBF and CBV is often
assumed since these parameters are not typically measured
simultaneously.
Recently, both optical (Culver et al., 2003; Durduran et al.,
2004b; Jones et al., 2001, 2002; Mayhew et al., 2001) and fMRI
techniques (Hoge et al., 1999; Kida et al., 2000; Lu et al., 2003)
A.K. Dunn et al. / NeuroImage 27 (2005) 279–290280
have been developed that enable simultaneous measurements of
multiple hemodynamic measures in order to reduce the reliance
on model assumptions in the determination of CMRO2 changes.
Despite these methodological advances, the spatial extent of the
stimulus-induced CMRO2 changes has not been investigated in
detail due to limitations in the spatial resolution of these
techniques. For example, by combining laser Doppler flowmetry
measurements of CBF with reflectance spectroscopy to determine
the changes in oxyhemoblobin (HbO), deoxyhemoglobin (HbR),
and total hemoglobin concentrations (HbT), the temporal dynam-
ics of CMRO2 changes were investigated at a single spatial
location during functional activation in rats (Jones et al., 2001,
2002; Mayhew et al., 2001; Sheth et al., 2004a). Another
approach to measure CMRO2 changes was to simultaneously
measure CBF using laser Doppler flowmetry and microvascular
oxygen tension using oxygen-dependent phosphorescence
quenching during forepaw stimulation in rats (Ances et al.,
2001). Although these studies provided detailed information
about the temporal dynamics of the CMRO2 changes, it was
not possible to examine the spatial dynamics of the CMRO2
changes since these were point measurements at a single spatial
location.
To obtain information about the spatial response to func-
tional stimulation, optical imaging of intrinsic signals is
commonly used. This method has provided numerous insights
into the functional organization of the cortex (Grinvald et al.,
1986; Masino and Frostig, 1996; Masino et al., 1993; Ts’o et
al., 1990) by mapping the changes in cortical reflectance arising
from the hemodynamic changes that accompany functional
stimulation. The majority of these studies have been based on
qualitative mapping at a single wavelength, and while they have
provided valuable insight into many aspects of cortical function,
the techniques used in these studies have been unable to reveal
quantitative spatial information about the individual hemody-
namic (HbO, HbR, HbT) and metabolic (CMRO2) components
that underlie the measured signals. This is due to the fact that
images at multiple wavelengths must be combined to quantify
hemoglobin concentrations, and most intrinsic optical imaging is
done at only a single wavelength band. Acquisition of this
spectroscopic information has been achieved only by sacrificing
spatial information (Malonek and Grinvald, 1996; Mayhew et
al., 2000), which has precluded full field imaging of HbO,
HbR, and HbT. While a few studies have utilized intrinsic
optical imaging at more than one wavelength (Ba et al., 2002;
Sheth et al., 2003, 2004b), the spectral information was
acquired in separate trials and was not combined with a
physical model of light propagation through tissue to quantify
the spatiotemporal changes in hemoglobin concentrations and
oxygenation.
Recently, we have developed a spectroscopic imaging
method that enables full field imaging of reflectance changes
at multiple wavelengths by rapid switching of the illumination
wavelength using a continuously rotating filter wheel (Dunn et
al., 2003). This technique allows quantitative imaging of the
concentration changes in HbO, HbR, and HbT with the same
spatial and temporal resolution as traditional intrinsic optical
imaging. We have used this instrument to study the relationship
between the hemodynamic changes and electrical activity during
whisker stimulation in rats by combining the imaging technique
with simultaneous electrophysiology recordings (Devor et al.,
2003, 2005).
Traditionally, the CBF response to functional activation has
been studied using laser Doppler flowmetry, which only provides
information about the CBF changes at a single spatial location.
Scanning laser Doppler has also been used to provide images of
activation-induced changes in CBF (Ances et al., 1999) but is
limited in both its spatial and temporal resolutions. More recently,
laser speckle contrast imaging of CBF (Dunn et al., 2001) has been
used for imaging the CBF response under a number of
physiological conditions in animal models (Ayata et al., 2004;
Bolay et al., 2002; Dunn et al., 2003; Durduran et al., 2004a;
Kharlamov et al., 2004). Laser speckle contrast imaging enables
high spatiotemporal resolution imaging of blood flow changes
using relatively simple instrumentation by analyzing the alterations
in the laser speckle pattern caused by the motion of the blood cells
(Briers et al., 1999).
In this paper, we examined whether the spatial extent of
CMRO2 changes during forepaw and whisker stimulation is
more localized than the changes in CBF, HbO, HbR, and HbT
using a combination of multi-wavelength reflectance imaging
and laser speckle contrast imaging of CBF. No significant
differences in the spatial extent of the stimulus-induced changes
were found between CMRO2 and the hemodynamic parameters,
suggesting that CMRO2 changes are not necessarily more
localized than the hemodynamic measures. In addition, the
spatial extent of the CMRO2 response was insensitive to
methodological considerations such as the assumed values for
baseline hemoglobin concentrations, vascular weighting con-
stants in the calculation of CMRO2 changes, and wavelength
dependence of tissue scattering.
Materials and methods
Animal preparation
All experimental procedures were approved by the MGH
Subcommittee on Research Animal Care. Male Sprague–Dawley
rats (250–350 g, n = 6) were initially anesthetized with 2%
halothane. A tracheotomy was performed to allow artificial
ventilation, and cannulas were inserted in the femoral artery
and vein. Following surgery, the animals were artificially
ventilated with 1.5% halothane, 70% N2O and 30% O2. Body
temperature was maintained at 37-C with a heating blanket and
arterial blood pressure was continuously recorded (100–130 mm
Hg) and blood gas and expired CO2 were monitored ( pO2 =
130–180, pCO2 = 35–45). The skull over the somatosensory
cortex was thinned with a dental burr until transparent (¨100
Am). A well was formed around the thinned portion of the skull
using petroleum jelly, and was filled with mineral oil. A glass
coverslip was placed over the oil-filled well to create a cranial
window for optimal image quality. Subsequently, halothane was
discontinued, and anesthesia was maintained with 50 mg/kg bolus
of a-chloralose followed by continuous intravenous infusion at
40 mg/kg/h.
Imaging instrument
A schematic illustration of the imaging instrument is
illustrated in Fig. 1. The details of the instrument have been
described elsewhere (Dunn et al., 2003) and a brief description
is provided here. Spectral imaging is achieved by illuminating

Fig. 1. (a) Schematic of instrument used for multi-wavelength and laser
speckle contrast imaging. (b) Extinction spectra of HbO and HbR
illustrating the center wavelengths of the six filters used in the multi-
spectral imaging. (c) Differential pathlength factor, Da computed from
Monte Carlo simulations.
A.K. Dunn et al. / NeuroImage 27 (2005) 279–290 281
the cortex with different bands of wavelengths and acquiring
images at each illumination band sequentially. Light from a
xenon arc lamp passes through 10-nm-wide bandpass filters and
is coupled into a 12-mm-diameter fiber optic bundle (Edmund
Scientific) for illumination of the cortex. Six different bandpass
filters are placed on a six-position filter wheel (Thorlabs), which
is mounted on a DC motor. The center wavelength of the filters
ranges between 560 and 610 nm at 10-nm intervals as indicated
in Fig. 1 which shows the center wavelength of each filter
superimposed on the extinction spectra of HbO and HbR.
The motor rotates continuously at 3–5 revolutions/s and an
image is acquired by the CCD (Coolsnap fx, Roper Scientific,
1300 � 1030 pixels) as each filter passes by the lamp, resulting in
an image acquisition rate of 18–30 Hz as described previously
(Dunn et al., 2003). The optical magnification was 0.75–1.0�, and
the CCD pixels were binned (3 � 3) such that the final image size
was approximately 300 � 300 pixels. For speckle contrast imaging
of CBF, a laser diode (785 nm, 70 mW) was used to illuminate the
cortex, and raw speckle images were acquired at 20–30 Hz at an
exposure time of 5 ms. No pixel binning was used for the speckle
images, since binning would lead to a reduction in speckle contrast.
The linear polarizer was adjusted to minimize specular reflections
from the surface of the oil well. Since the whisker and forepaw
representations lie on the lateral convexity of the cortex, it was
necessary to orient the optical axis of the camera normal to the
surface of this portion of the cortex. This was achieved by tilting
the stereotaxic frame at an angle of 10–15- and also tilting the
camera to further minimize any deviations from normal.
Stimulation paradigm
All stimulation experiments were done in a block-design fashion
with 30 s between stimuli, and both forepaw and whisker stimulation
trials were run on each of the 6 animals. Each stimulus block consisted
of 1 s of baseline image collection followed by 10 s of stimulation.
During forepaw stimulation, electrical pulses of 1 mAwere applied for
300 As at 3 Hz using a stimulus isolation unit. During whisker
stimulation, a single whisker was deflected by a computer-controlled
piezoelectric transducer at 8Hz. Thewhiskerwas displaced upward and
allowed a free return to the resting position.
Spectral image analysis
The image set at each wavelength was averaged across trials
and the averaged data were converted to changes in HbO and HbR
at each pixel using the modified Beer Lambert relationship,
DA k; tð Þ ¼ eHbO kð ÞDCHbO tð Þ þ eHbR kð ÞDCHbR tð Þð ÞD kð Þ ð1Þ
where DA(k,t) = log(Ro/R(t)) is the attenuation at each wavelength,
Ro and R(t) are the measured reflectance intensities at baseline and
some time t, DCHbO and DCHbR are the changes in concentrations
of HbO and HbR, respectively, and (HbO and (HbR are the molar
extinction coefficients. Eq. (1) was solved for DCHbO and DCHbR
using a least-squares approach. The differential pathlength factor,
D(k), accounts for the fact that each wavelength travels slightly
different pathlengths through the tissue due to the wavelength
dependence of scattering and absorption in the tissue, and was
estimated using the approach of Kohl et al. (2000) through Monte
Carlo simulations of light propagation in tissue. To simulate the
experimental geometry, photons in a 10-mm-diameter diverging
beam (NA = 0.05) were launched into a tissue with uniform
scattering properties. Photons exiting the tissue were considered
detected if their exit position and direction would result in that
photon being imaged onto a single CCD pixel. The wavelength-
dependent reflectance, R(la(k)) was calculated from the detected
photon pathlengths to determine D(k) (Kohl et al., 2000). Baselinescattering properties were ls = 100 cm�1 and g = 0.9 and were
assumed to be constant over the wavelength range considered.
Hemoglobin was assumed to be the only chromophores of interest
and the baseline absorption coefficient was defined as la(k) =
(HbO(k)CoHbO + (HbR(k)Co
HbR, where CoHbO and Co
HbR are the
A.K. Dunn et al. / NeuroImage 27 (2005) 279–290282
assumed baseline concentrations of oxy- and deoxy-hemoglobin.
The computed values of the pathlength factor at each wavelength
are plotted in Fig. 1c for baseline concentrations of 60 AM and 40
AM for HbO and HbR, respectively (Jones et al., 2002; Mayhew et
al., 2000). These baseline values were assumed for all of the results
presented here unless noted otherwise. The influence of these
assumed baseline values on the spatial extent of the CMRO2
changes was also investigated by varying CoHbO and Co
HbR over the
range of 20–200 AM, as described below.
Speckle contrast image analysis
Images of CBF changes were determined by calculating the
changes in the speckle contrast in a series of laser speckle
images. The speckle contrast is defined as the ratio of the
standard deviation to the mean pixel intensities, r/<I> within a
localized region of the image (Briers, 2001). Each raw speckle
image was converted to a speckle contrast image using a sliding
window of 7 � 7 pixels in order to balance the tradeoff
between adequate estimates of the speckle contrast and spatial
resolution (Briers, 2001). Speckle contrast images were averaged
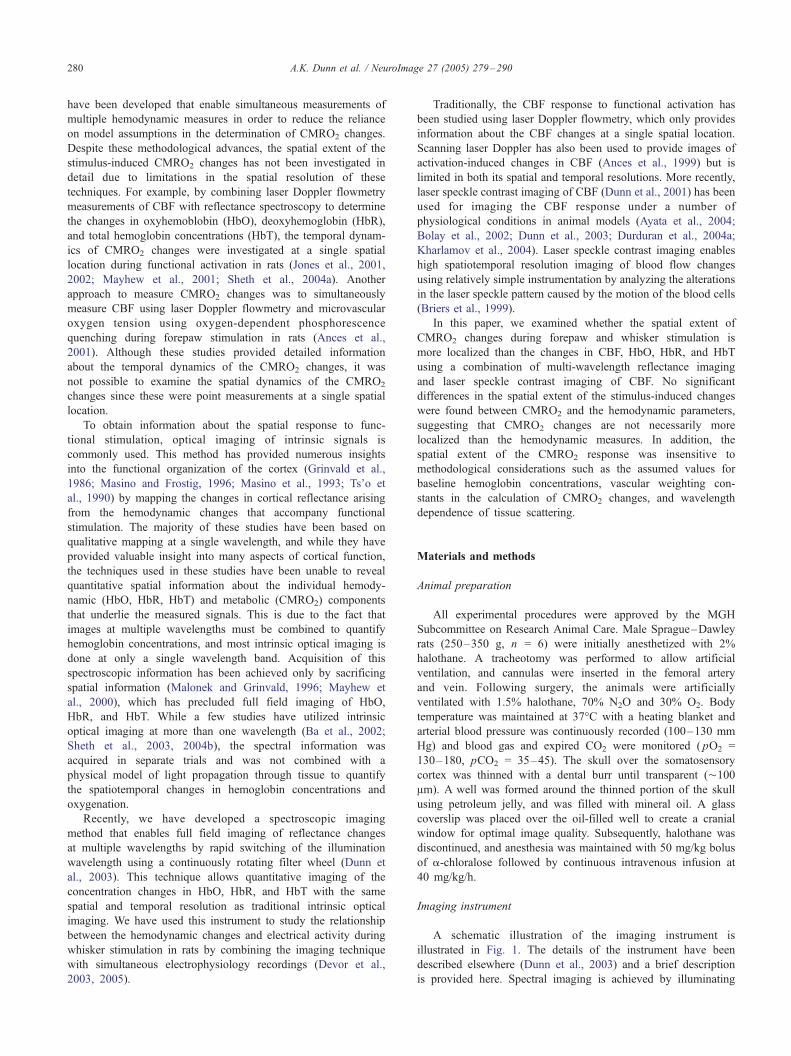
Fig. 2. Example images and timecourses of the relative reflectance changes (R(t)/
scale bar in the first image corresponds to 1 mm, and the bar in the plot corresponds
s window beginning 2 s after stimulus onset (3 < t < 5) (A = anterior, L = latera
across trials and the averaged set was converted to relative
blood flow (1 + DCBF/CBFo) by converting each speckle
contrast value to an intensity autocorrelation decay time (Briers,
2001), which was assumed to be inversely proportional to blood
flow (Bonner and Nossal, 1981), and dividing by baseline, as
described elsewhere (Dunn et al., 2001).
Calculation of CMRO2 changes
The changes in CMRO2 were calculated from the images of
CBF, total hemoglobin, and deoxy-hemoglobin using the
relationship (Jones et al., 2001; Mayhew et al., 2000)
1þ rCMRO2 ¼ 1þ DCBF
CBFo
��1þ cr
DHbR
HbRo
��
� 1þ ctDHbT
HbTo
�� �1
ð2Þ
where the subscript Fo_ indicates baseline values. The parameters crand ct are vascular weighting constants which take into account thatthe measured changes in hemoglobin are a combination of venous
Ro) at the six wavelengths in response to 10 s of forepaw stimulation. The
to the stimulus. The images show the relative reflectance averaged over a 2-
l).

Fig. 3. Timecourses and images of HbO, HbR, and HbT changes (% change from baseline) computed from the multi-wavelength data shown in Fig. 2. The
mean residual of the least-squares fit to Eq. (1) is shown in the lower plot. Scale bar in HbO image = 1 mm, A = anterior, L = lateral.
Fig. 4. Comparison of the percent changes in HbT in response to forepaw
(left) and whisker (right) stimulation. Scale bar = 1 mm.
A.K. Dunn et al. / NeuroImage 27 (2005) 279–290 283
and arterial quantities. This relationship is derived from the standard
definition (Hyder, 2004)
CMRO2 ¼ CBF I OEF ð3Þ
where OEF is the oxygen extraction fraction. OEF is given by the
fractional difference between the arterial and venous oxygen
saturation, SA and SV, respectively.
OEF ¼ SA � SV
SA: ð4Þ
Under the assumption that SA = 1, this equation simplifies as
OEF ,HbRV
HbTV
: ð5Þ
where HbRV and HbTV indicate the deoxy- and total hemoglobin
concentration in the venules. This model assumes that oxygen
extraction is taking place upstream of the venules in the capillaries
and arterioles, and that no oxygen extraction is occurring in the
venules. Combining Eqs. (3) and (5) and considering changes in
each parameter, we arrive at Eq. (2) with the definitions
cr ¼DHbRV
HbRV;o
�DHbR
HbRo
: ð6Þ
and
ct ¼DHbTV
HbTV;o
�DHbT
HbTo
ð7Þ
Our optical measurements average the hemoglobin changes
over the arteriole, capillary, and venule compartments and do not
provide a direct measure of the changes in the venule compartment.
This requires that the cr and ct be assumed. We test a range of
assumed values from 0.5 to 2.
Results
Multispectral imaging of HbO, HbR, and HbT
The spatial changes in reflected light intensity at each of the six
wavelengths due to forepaw stimulation are shown in Fig. 2 for one
animal averaged over 40 trials. Each image shows the ratio of the
A.K. Dunn et al. / NeuroImage 27 (2005) 279–290284
reflectance at each wavelength band, averaged over a 2-s interval
starting 2 s after stimulation onset, to the average baseline
reflectance prior to stimulation. The observed response differs
with wavelength, and at wavelengths of 560, 570, 580, and 590
nm, a decrease in reflectance is observed, while at wavelengths of
600 and 610 nm, there is an increase in reflectance. The
timecourse of the changes in reflectance at each wavelength,
averaged over a 1.75 � 1.75 mm region of interest centered on
the activation (Fig. 2) illustrates the spectral differences in the
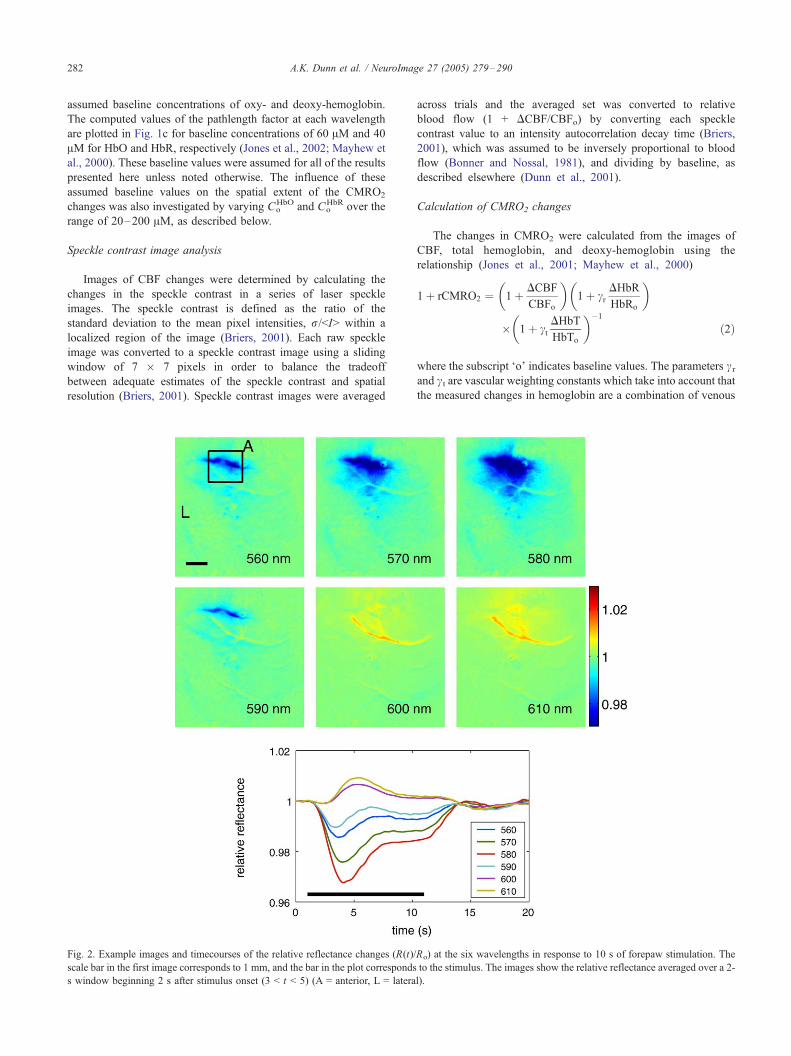
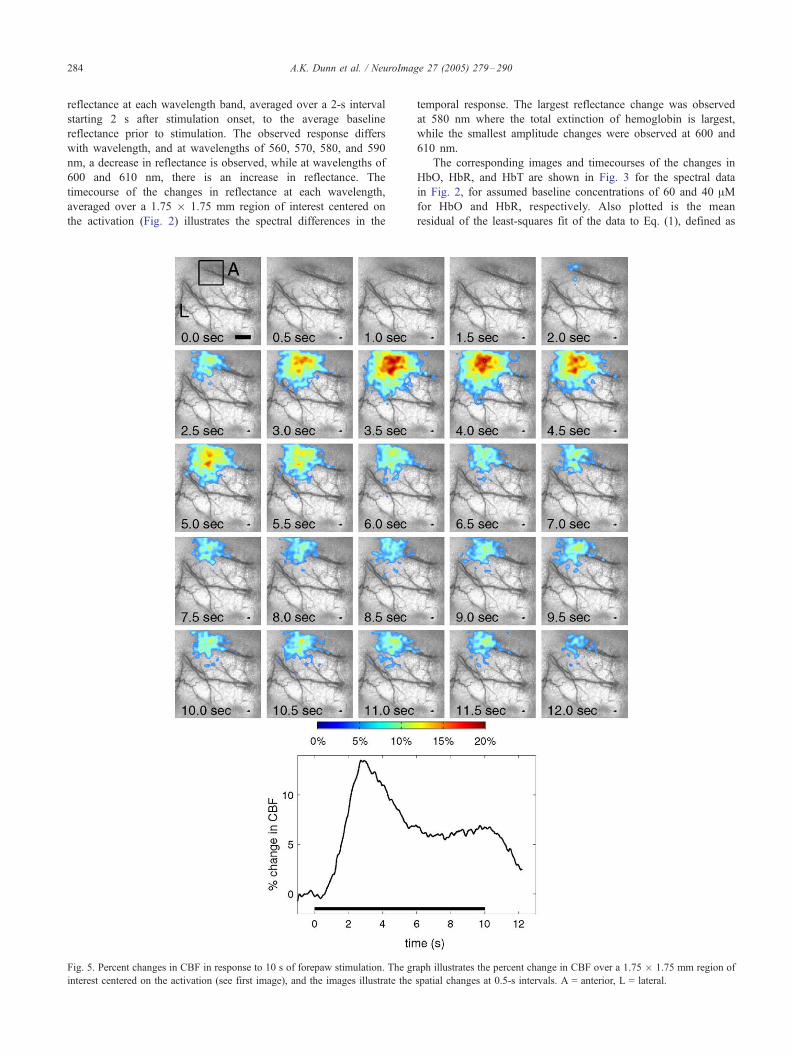
Fig. 5. Percent changes in CBF in response to 10 s of forepaw stimulation. The gr
interest centered on the activation (see first image), and the images illustrate the
temporal response. The largest reflectance change was observed
at 580 nm where the total extinction of hemoglobin is largest,
while the smallest amplitude changes were observed at 600 and
610 nm.
The corresponding images and timecourses of the changes in
HbO, HbR, and HbT are shown in Fig. 3 for the spectral data
in Fig. 2, for assumed baseline concentrations of 60 and 40 AMfor HbO and HbR, respectively. Also plotted is the mean
residual of the least-squares fit of the data to Eq. (1), defined as
aph illustrates the percent change in CBF over a 1.75 � 1.75 mm region of
spatial changes at 0.5-s intervals. A = anterior, L = lateral.
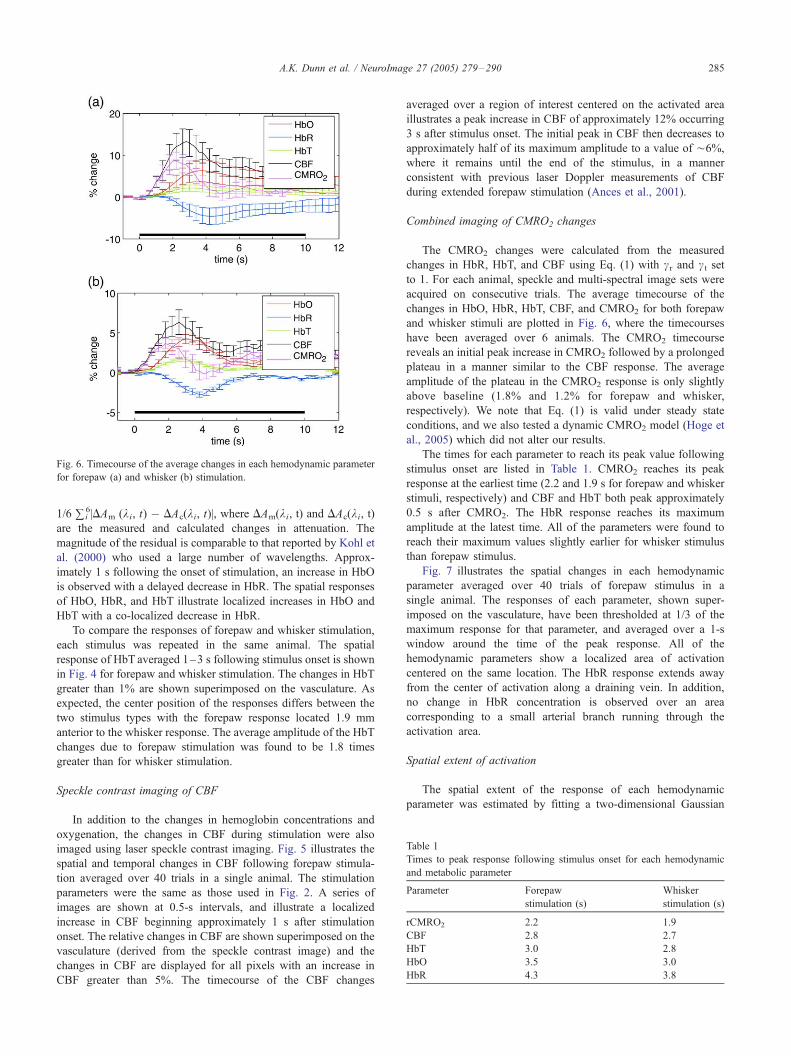
Fig. 6. Timecourse of the average changes in each hemodynamic parameter
for forepaw (a) and whisker (b) stimulation.
Table 1
Times to peak response following stimulus onset for each hemodynamic
and metabolic parameter
Parameter Forepaw
stimulation (s)
Whisker
stimulation (s)
rCMRO2 2.2 1.9
CBF 2.8 2.7
HbT 3.0 2.8
HbO 3.5 3.0
HbR 4.3 3.8
A.K. Dunn et al. / NeuroImage 27 (2005) 279–290 285
1/6 ~ i6kDAm (ki, t) � DAc(ki, t)k, where DAm(ki, t) and DAc(ki, t)
are the measured and calculated changes in attenuation. The
magnitude of the residual is comparable to that reported by Kohl et
al. (2000) who used a large number of wavelengths. Approx-
imately 1 s following the onset of stimulation, an increase in HbO
is observed with a delayed decrease in HbR. The spatial responses
of HbO, HbR, and HbT illustrate localized increases in HbO and
HbT with a co-localized decrease in HbR.
To compare the responses of forepaw and whisker stimulation,
each stimulus was repeated in the same animal. The spatial
response of HbT averaged 1–3 s following stimulus onset is shown
in Fig. 4 for forepaw and whisker stimulation. The changes in HbT
greater than 1% are shown superimposed on the vasculature. As
expected, the center position of the responses differs between the
two stimulus types with the forepaw response located 1.9 mm
anterior to the whisker response. The average amplitude of the HbT
changes due to forepaw stimulation was found to be 1.8 times
greater than for whisker stimulation.
Speckle contrast imaging of CBF
In addition to the changes in hemoglobin concentrations and
oxygenation, the changes in CBF during stimulation were also
imaged using laser speckle contrast imaging. Fig. 5 illustrates the
spatial and temporal changes in CBF following forepaw stimula-
tion averaged over 40 trials in a single animal. The stimulation
parameters were the same as those used in Fig. 2. A series of
images are shown at 0.5-s intervals, and illustrate a localized
increase in CBF beginning approximately 1 s after stimulation
onset. The relative changes in CBF are shown superimposed on the
vasculature (derived from the speckle contrast image) and the
changes in CBF are displayed for all pixels with an increase in
CBF greater than 5%. The timecourse of the CBF changes
averaged over a region of interest centered on the activated area
illustrates a peak increase in CBF of approximately 12% occurring
3 s after stimulus onset. The initial peak in CBF then decreases to
approximately half of its maximum amplitude to a value of ¨6%,
where it remains until the end of the stimulus, in a manner
consistent with previous laser Doppler measurements of CBF
during extended forepaw stimulation (Ances et al., 2001).
Combined imaging of CMRO2 changes
The CMRO2 changes were calculated from the measured
changes in HbR, HbT, and CBF using Eq. (1) with cr and ct setto 1. For each animal, speckle and multi-spectral image sets were
acquired on consecutive trials. The average timecourse of the
changes in HbO, HbR, HbT, CBF, and CMRO2 for both forepaw
and whisker stimuli are plotted in Fig. 6, where the timecourses
have been averaged over 6 animals. The CMRO2 timecourse
reveals an initial peak increase in CMRO2 followed by a prolonged
plateau in a manner similar to the CBF response. The average
amplitude of the plateau in the CMRO2 response is only slightly
above baseline (1.8% and 1.2% for forepaw and whisker,
respectively). We note that Eq. (1) is valid under steady state
conditions, and we also tested a dynamic CMRO2 model (Hoge et
al., 2005) which did not alter our results.
The times for each parameter to reach its peak value following
stimulus onset are listed in Table 1. CMRO2 reaches its peak
response at the earliest time (2.2 and 1.9 s for forepaw and whisker
stimuli, respectively) and CBF and HbT both peak approximately
0.5 s after CMRO2. The HbR response reaches its maximum
amplitude at the latest time. All of the parameters were found to
reach their maximum values slightly earlier for whisker stimulus
than forepaw stimulus.
Fig. 7 illustrates the spatial changes in each hemodynamic
parameter averaged over 40 trials of forepaw stimulus in a
single animal. The responses of each parameter, shown super-
imposed on the vasculature, have been thresholded at 1/3 of the
maximum response for that parameter, and averaged over a 1-s
window around the time of the peak response. All of the
hemodynamic parameters show a localized area of activation
centered on the same location. The HbR response extends away
from the center of activation along a draining vein. In addition,
no change in HbR concentration is observed over an area
corresponding to a small arterial branch running through the
activation area.
Spatial extent of activation
The spatial extent of the response of each hemodynamic
parameter was estimated by fitting a two-dimensional Gaussian
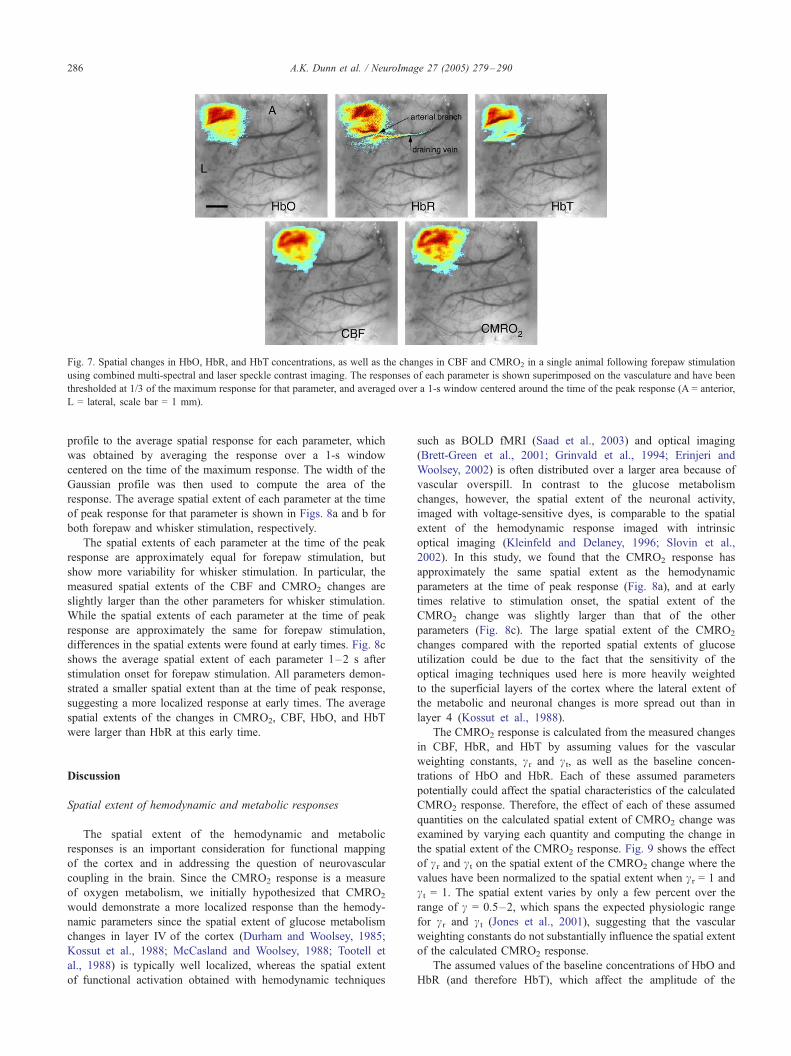
Fig. 7. Spatial changes in HbO, HbR, and HbT concentrations, as well as the changes in CBF and CMRO2 in a single animal following forepaw stimulation
using combined multi-spectral and laser speckle contrast imaging. The responses of each parameter is shown superimposed on the vasculature and have been
thresholded at 1/3 of the maximum response for that parameter, and averaged over a 1-s window centered around the time of the peak response (A = anterior,
L = lateral, scale bar = 1 mm).
A.K. Dunn et al. / NeuroImage 27 (2005) 279–290286
profile to the average spatial response for each parameter, which
was obtained by averaging the response over a 1-s window
centered on the time of the maximum response. The width of the
Gaussian profile was then used to compute the area of the
response. The average spatial extent of each parameter at the time
of peak response for that parameter is shown in Figs. 8a and b for
both forepaw and whisker stimulation, respectively.
The spatial extents of each parameter at the time of the peak
response are approximately equal for forepaw stimulation, but
show more variability for whisker stimulation. In particular, the
measured spatial extents of the CBF and CMRO2 changes are
slightly larger than the other parameters for whisker stimulation.
While the spatial extents of each parameter at the time of peak
response are approximately the same for forepaw stimulation,
differences in the spatial extents were found at early times. Fig. 8c
shows the average spatial extent of each parameter 1–2 s after
stimulation onset for forepaw stimulation. All parameters demon-
strated a smaller spatial extent than at the time of peak response,
suggesting a more localized response at early times. The average
spatial extents of the changes in CMRO2, CBF, HbO, and HbT
were larger than HbR at this early time.
Discussion
Spatial extent of hemodynamic and metabolic responses
The spatial extent of the hemodynamic and metabolic
responses is an important consideration for functional mapping
of the cortex and in addressing the question of neurovascular
coupling in the brain. Since the CMRO2 response is a measure
of oxygen metabolism, we initially hypothesized that CMRO2
would demonstrate a more localized response than the hemody-
namic parameters since the spatial extent of glucose metabolism
changes in layer IV of the cortex (Durham and Woolsey, 1985;
Kossut et al., 1988; McCasland and Woolsey, 1988; Tootell et
al., 1988) is typically well localized, whereas the spatial extent
of functional activation obtained with hemodynamic techniques
such as BOLD fMRI (Saad et al., 2003) and optical imaging
(Brett-Green et al., 2001; Grinvald et al., 1994; Erinjeri and
Woolsey, 2002) is often distributed over a larger area because of
vascular overspill. In contrast to the glucose metabolism
changes, however, the spatial extent of the neuronal activity,
imaged with voltage-sensitive dyes, is comparable to the spatial
extent of the hemodynamic response imaged with intrinsic
optical imaging (Kleinfeld and Delaney, 1996; Slovin et al.,
2002). In this study, we found that the CMRO2 response has
approximately the same spatial extent as the hemodynamic
parameters at the time of peak response (Fig. 8a), and at early
times relative to stimulation onset, the spatial extent of the
CMRO2 change was slightly larger than that of the other
parameters (Fig. 8c). The large spatial extent of the CMRO2
changes compared with the reported spatial extents of glucose
utilization could be due to the fact that the sensitivity of the
optical imaging techniques used here is more heavily weighted
to the superficial layers of the cortex where the lateral extent of
the metabolic and neuronal changes is more spread out than in
layer 4 (Kossut et al., 1988).
The CMRO2 response is calculated from the measured changes
in CBF, HbR, and HbT by assuming values for the vascular
weighting constants, cr and ct, as well as the baseline concen-
trations of HbO and HbR. Each of these assumed parameters
potentially could affect the spatial characteristics of the calculated
CMRO2 response. Therefore, the effect of each of these assumed
quantities on the calculated spatial extent of CMRO2 change was
examined by varying each quantity and computing the change in
the spatial extent of the CMRO2 response. Fig. 9 shows the effect
of cr and ct on the spatial extent of the CMRO2 change where the
values have been normalized to the spatial extent when cr = 1 and
ct = 1. The spatial extent varies by only a few percent over the
range of c = 0.5–2, which spans the expected physiologic range
for cr and ct (Jones et al., 2001), suggesting that the vascular
weighting constants do not substantially influence the spatial extent
of the calculated CMRO2 response.
The assumed values of the baseline concentrations of HbO and
HbR (and therefore HbT), which affect the amplitude of the
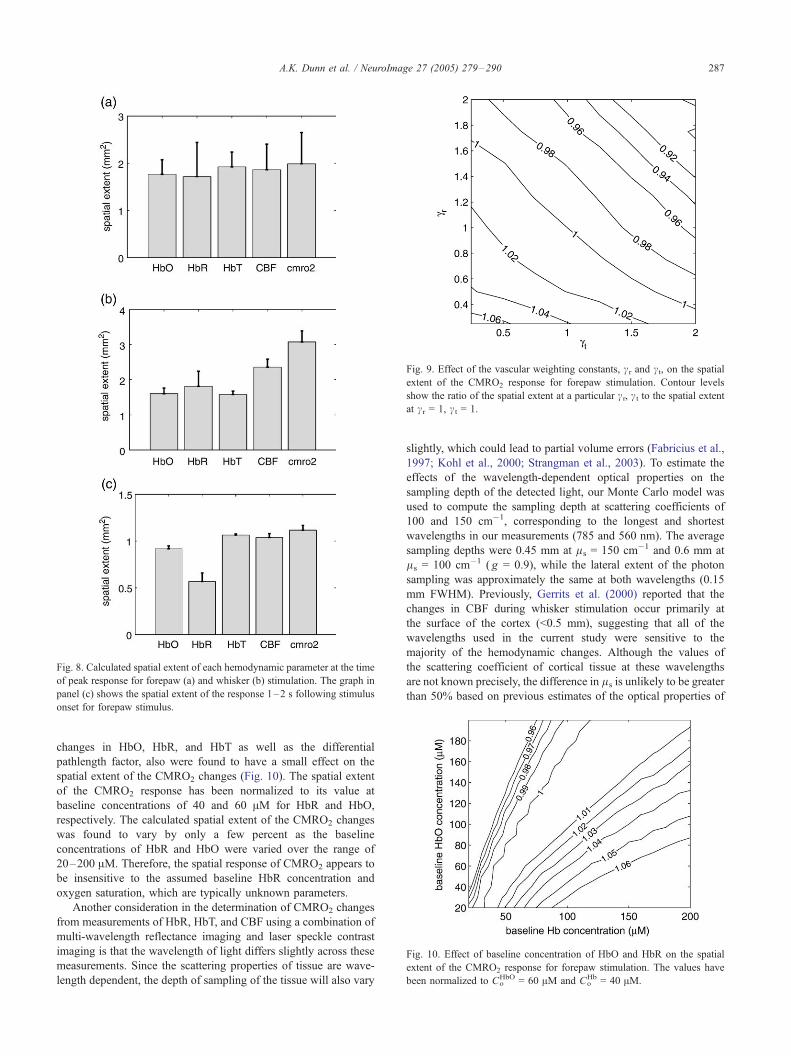
Fig. 8. Calculated spatial extent of each hemodynamic parameter at the time
of peak response for forepaw (a) and whisker (b) stimulation. The graph in
panel (c) shows the spatial extent of the response 1–2 s following stimulus
onset for forepaw stimulus.
Fig. 9. Effect of the vascular weighting constants, cr and c t, on the spatial
extent of the CMRO2 response for forepaw stimulation. Contour levels
show the ratio of the spatial extent at a particular cr, c t to the spatial extent
at cr = 1, c t = 1.
Fig. 10. Effect of baseline concentration of HbO and HbR on the spatial
extent of the CMRO2 response for forepaw stimulation. The values have
been normalized to CoHbO = 60 AM and Co
Hb = 40 AM.
A.K. Dunn et al. / NeuroImage 27 (2005) 279–290 287
changes in HbO, HbR, and HbT as well as the differential
pathlength factor, also were found to have a small effect on the
spatial extent of the CMRO2 changes (Fig. 10). The spatial extent
of the CMRO2 response has been normalized to its value at
baseline concentrations of 40 and 60 AM for HbR and HbO,
respectively. The calculated spatial extent of the CMRO2 changes
was found to vary by only a few percent as the baseline
concentrations of HbR and HbO were varied over the range of
20–200 AM. Therefore, the spatial response of CMRO2 appears to
be insensitive to the assumed baseline HbR concentration and
oxygen saturation, which are typically unknown parameters.
Another consideration in the determination of CMRO2 changes
from measurements of HbR, HbT, and CBF using a combination of
multi-wavelength reflectance imaging and laser speckle contrast
imaging is that the wavelength of light differs slightly across these
measurements. Since the scattering properties of tissue are wave-
length dependent, the depth of sampling of the tissue will also vary
slightly, which could lead to partial volume errors (Fabricius et al.,
1997; Kohl et al., 2000; Strangman et al., 2003). To estimate the
effects of the wavelength-dependent optical properties on the
sampling depth of the detected light, our Monte Carlo model was
used to compute the sampling depth at scattering coefficients of
100 and 150 cm�1, corresponding to the longest and shortest
wavelengths in our measurements (785 and 560 nm). The average
sampling depths were 0.45 mm at ls = 150 cm�1 and 0.6 mm at
ls = 100 cm�1 ( g = 0.9), while the lateral extent of the photon
sampling was approximately the same at both wavelengths (0.15
mm FWHM). Previously, Gerrits et al. (2000) reported that the
changes in CBF during whisker stimulation occur primarily at
the surface of the cortex (<0.5 mm), suggesting that all of the
wavelengths used in the current study were sensitive to the
majority of the hemodynamic changes. Although the values of
the scattering coefficient of cortical tissue at these wavelengths
are not known precisely, the difference in ls is unlikely to be greater
than 50% based on previous estimates of the optical properties of

Fig. 11. Spatial variation in / (CBV = CBF/) during forepaw stimulation.
/ was calculated in a series of concentric rings centered on the activation,
and the average value of / is plotted vs. distance from the center of
activation.
A.K. Dunn et al. / NeuroImage 27 (2005) 279–290288
cortical tissue (Bevilacqua et al., 1999; Matcher et al., 1997). These
previous estimates were limited to near-infrared wavelengths, but
extrapolation of both of these reports to the wavelength range of
560–785 nm by assuming a wavelength dependence of Ak�b (A =
91, b = 0.34) (Graaff et al., 1992) suggests that the difference in
scattering coefficient is less than 20% over this range, which would
result in a smaller difference in the sampling depth of the CBF and
multi-wavelength measurements. Therefore, our estimate of the
differences in sampling depths (0.45 vs. 0.6 mm) represents a worst-
case scenario. In addition, the variation in sampling depth in our
measurements due to the wavelength dependence of tissue
scattering is likely to be less severe than the sampling depth
variations that arise in simultaneous laser Doppler flowmetry and
optical spectroscopy measurements of CMRO2 (Jones et al., 2001;
Mayhew et al., 2001) due to the different illumination and detection
geometries of LDF and optical spectroscopy.
Temporal characteristics of hemodynamic and metabolic response
The temporal characteristics of the measured hemodynamic
responses are consistent with previous measurements during both
forepaw and whisker stimulation in rats. For example, the time to
peak amplitude of the measured response of each parameter in Fig.
6 is consistent with the measurements of Jones et al. (2001), who
used concurrent slit spectroscopy to determine the temporal
response of HbO, HbR, and HbT, and point measurements of
CBF using laser Doppler flowmetry. The timecourses of the CBF
changes are also consistent with those of Ances et al. (2001) for
forepaw stimulation, where an initial peak in CBF was observed,
followed by a prolonged secondary plateau of lower amplitude.
The CMRO2 timecourse shows a similar trend with an initial
peak and a secondary plateau, although the amplitude of the
secondary plateau relative to the peak response is smaller than that
of CBF. For forepaw stimulation, for example, the secondary
plateau of CBF is approximately 0.5 times the peak CBF response
while the secondary plateau in CMRO2 is only 0.2 times its peak
value. The relative amplitudes of the secondary plateaus of the CBF
and CMRO2 changes are very similar to those reported by Ances
et al. (2001), who calculated CMRO2 changes from measurements
of CBF using laser Doppler flowmetry and oxygen tension
measurements. These results indicate that CBF and CMRO2
changes are closely related during the early stages of the stimulus
but have a different relationship during the latter part of a
prolonged stimulus, suggesting that a strict coupling relationship
between flow and oxygen consumption may not exist at all times.
The existence of an early increase in oxygen consumption, or
the Finitial dip_, has been controversial. While some studies have
reported an initial rise in HbR concentrations, others have reported
no such early changes in either HbR or CMRO2 (Kohl et al.,
2000; Sheth et al., 2004a). We found no observable early changes
in either HbR or CMRO2 that preceded a flow change for either
forepaw or whisker stimulation in an average of 40 individual
trials. However, since the amplitude of the initial dip may be very
small, a very high contrast to noise ratio may be required to detect
the early changes. Indeed, we observed an initial dip in our
previous studies that utilized an event-related presentation of brief
stimuli, and a large number of stimulus presentation trials (Devor
et al., 2003, 2005).
Another parameter commonly used to assess the coupling
between CBF and CMRO2 is the ratio of the changes of each
parameter, i.e., the flow consumption ratio DCBF/DCMRO2.
Various studies have determined this ratio to be in the range of
2–5 (Ances et al., 2001; Davis et al., 1998; Fox et al., 1988). We
have found this ratio to be 1.5 and 2.0 for the peak response to
forepaw and whisker stimulation, respectively, and these values are
close to those reported in studies involving rodents (Ances et al.,
2001; Davis et al., 1998; Fox et al., 1988). Importantly, we note
that the flow consumption ratio can vary in time as the ratio
increases to 4.5 and 2.5, respectively, during the plateau phase.
These values are consistent with those reported by Ances et al.,
who found values of 1.0 and 2.93 for the peak and plateau phases
of forepaw stimulation (Ances et al., 2001).
Flow/volume relationship
The relationship between the changes in CBF and CBV is often
assumed to follow the Grubb relation (Buxton and Frank, 1997;
Grubb et al., 1974), CBV = CBF/, where the coefficient / has
been found to be in the range of 0.18–0.38 (Jones et al., 2001,
2002; Mandeville et al., 1999; Sheth et al., 2004b). We determined
/ to be 0.25 T 0.03 for forepaw stimulation and 0.20 T 0.03 for
whisker stimulation, when averaged over the time 4 < t < 8 s
within a 2-mm region of interest centered on the response. These
values are somewhat lower than those found by Grubb et al. (1974)
in monkeys, although they are consistent with previous measure-
ments of stimulation-induced changes in rodents (Jones et al.,
2001, 2002; Mandeville et al., 1999; Sheth et al., 2004a).
To examine whether a spatial dependence exists on the
relationship between CBF and CBV, / was calculated within a
series of concentric rings centered on the activation and averaged
over the same time interval (4–8 s). Fig. 11 illustrates that a slight
spatial dependence exists, and / is greatest near the center of
activation, and decreases at distances further away from the center.
Beyond approximately 1 mm from the center of activation, /begins to increase perhaps due to noise as the amplitudes of the
changes in both HbT and CBF are significantly smaller. This initial
decrease in / with increasing distance from the center of activation
may indicate that arterial dilation occurs primarily in the center of
the activation such that the amplitude of the HbT changes relative
to the CBF changes is greater near the center of activation,
although the spatial extents of both HbT and CBF likely exceed the
spatial extent of the neuronal activity. These results illustrate one of
the advantages of obtaining the full spatiotemporal dynamics of
both blood flow and blood oxygenation.
A.K. Dunn et al. / NeuroImage 27 (2005) 279–290 289
Conclusions
Developing a better understanding of the spatiotemporal
characteristics of the hemodynamic and CMRO2 response to
functional activation is important for furthering our understanding
of the complex neurovascular coupling relationships. In this study,
laser speckle contrast imaging of CBF was combined with multi-
wavelength optical reflectance imaging to compare the spatial
extents of the hemodynamic and oxygen metabolism changes due to
forepaw and whisker stimulation in rats. The spatial extents of the
responses of each hemodynamic parameter and CMRO2 at the time
of peak response were found to be comparable. This result suggests
that although the CMRO2 response is a metabolic measure, it does
not necessarily have a smaller spatial extent than the purely
hemodynamic measures of HbO, Hb, HbT, and CBF. However,
since the CMRO2 response has different temporal dynamics than the
purely hemodynamic measures, it reveals unique information about
the response to functional activation and full field imaging of HbO,
HbR, HbT, CBF, and CMRO2 changes provides a more complete
picture of the hemodynamic response.
Acknowledgments
The authors acknowledge support from the National Institutes
of Health (NS41291, NS050150, and EB000790) and the Whitaker
Foundation.
References
Ances, B.M., Greenberg, J.H., et al., 1999. Laser doppler imaging of
activation–flow coupling in the rat somatosensory cortex. Neuroimage
10 (6), 716–723.
Ances, B.M., Wilson, D.F., et al., 2001. Dynamic changes in cerebral
blood flow, O2 tension, and calculated cerebral metabolic rate of O2
during functional activation using oxygen phosphorescence quench-
ing. J. Cereb. Blood Flow Metab. 21 (5), 511–516.
Ayata, C., Dunn, A.K., et al., 2004. Laser speckle flowmetry for the study
of cerebrovascular physiology in normal and ischemic mouse cortex.
J. Cereb. Blood Flow Metab. 24 (7), 744–755.
Ba, A.M., Guiou, M., et al., 2002. Multiwavelength optical intrinsic signal
imaging of cortical spreading depression. J. Neurophysiol. 88 (5),
2726–2735.
Bevilacqua, F., Piguet, D., et al., 1999. In vivo local determination of tissue
optical properties: applications to human brain. Appl. Opt. 38 (22),
4939–4950.
Bolay, H., Reuter, U., et al., 2002. Intrinsic brain activity triggers trigeminal
meningeal afferents in a migraine model. Nat. Med. 8 (2), 136–142.
Bonner, R., Nossal, R., 1981. Model for laser Doppler measurements of
blood flow in tissue. Appl. Opt. 20, 2097–2107.
Brett-Green, B.A., Chen-Bee, C.H., et al., 2001. Comparing the functional
representations of central and border whiskers in rat primary somato-
sensory cortex. J. Neurosci. 21 (24), 9944–9954.
Briers, J.D., 2001. Laser Doppler, speckle and related techniques for blood
perfusion mapping and imaging. Physiol. Meas. 22 (4), R35–R66.
Briers, J.D., Richards, G., et al., 1999. Capillary blood flow monitoring
using laser speckle contrast analysis. J. Biomed. Opt. 4, 164–175.
Buxton, R.B., Frank, L.R., 1997. A model for the coupling between
cerebral blood flow and oxygen metabolism during neural stimulation.
J. Cereb. Blood Flow Metab. 17 (1), 64–72.
Buxton, R.B., Wong, E.C., et al., 1998. Dynamics of blood flow and
oxygenation changes during brain activation: the balloon model. Magn.
Reson. Med. 39 (6), 855–864.
Culver, J.P., Durduran, T., et al., 2003. Diffuse optical tomography of
cerebral blood flow, oxygenation, and metabolism in rat during focal
ischemia. J. Cereb. Blood Flow Metab. 23 (8), 911–924.
Davis, T.L., Kwong, K.K., et al., 1998. Calibrated functional MRI: mapping
the dynamics of oxidative metabolism. Proc. Natl. Acad. Sci. U. S. A.
95, 1834–1839.
Devor, A., Dunn, A.K., et al., 2003. Coupling of total hemoglobin
concentration, oxygenation, and neural activity in rat somatosensory
cortex. Neuron 39 (2), 353–359.
Devor, A., Ulbert, I., et al., 2005. Coupling of the cortical hemodynamic
response to cortical and thalamic neuronal activity. Proc. Natl. Acad.
Sci. U.S.A. 102 (10), 3822–3827.
Dunn, A.K., Bolay, H., et al., 2001. Dynamic imaging of cerebral blood
flow using laser speckle. J. Cereb. Blood Flow Metab. 21 (3), 195–201.
Dunn, A.K., Devor, A., et al., 2003. Simultaneous imaging of total cerebral
hemoglobin concentration, oxygenation, and blood flow during func-
tional activation. Opt. Lett. 28, 28–30.
Durduran, T., Burnett, M.G., et al., 2004a. Spatiotemporal quantification of
cerebral blood flow during functional activation in rat somatosensory
cortex using laser-speckle flowmetry. J. Cereb. Blood Flow Metab. 24
(5), 518–525.
Durduran, T., Yu, G., et al., 2004b. Diffuse optical measurement of blood
flow, blood oxygenation, and metabolism in a human brain during
sensorimotor cortex activation. Opt. Lett. 29 (15), 1766–1768.
Durham, D., Woolsey, T.A., 1985. Functional organization in cortical
barrels of normal and vibrissae-damaged mice: a (3H) 2-deoxyglucose
study. J. Comp. Neurol. 235 (1), 97–110.
Erinjeri, J.P., Woolsey, T.A., 2002. Spatial integration of vascular changes
with neural activity in mouse cortex. J. Cereb. Blood Flow Metab. 22
(3), 353–360.
Fabricius, M., Akgoren, N., et al., 1997. Laminar analysis of cerebral
blood flow in cortex of rats by laser-Doppler flowmetry: a pilot study.
J. Cereb. Blood Flow Metab. 17 (12), 1326–1336.
Fox, P.T., Raichle, M.E., 1986. Focal physiological uncoupling of
cerebral blood flow and oxidative metabolism during somatosensory
stimulation in human subjects. Proc. Natl. Acad. Sci. U. S. A. 83 (4),
1140–1144.
Fox, P.T., Raichle, M.E., et al., 1988. Nonoxidative glucose consumption
during focal physiologic neural activity. Science 241 (4864), 462–464.
Gerrits, R.J., Raczynski, C., et al., 2000. Regional cerebral blood flow
responses to variable frequency whisker stimulation: an autoradio-
graphic analysis. Brain Res. 864 (2), 205–212.
Graaff, R., Aarnoose, J.G., et al., 1992. Reduced light-scattering properties
for mixtures of spherical particles: a simple approximation derived from
Mie calculations. Appl. Opt. 31, 1370–1376.
Grinvald, A., Lieke, E., et al., 1986. Functional architecture of cortex
revealed by optical imaging of intrinsic signals. Nature 324, 361–364.
Grinvald, A., Lieke, E.E., et al., 1994. Cortical point-spread function and
long-range lateral interactions revealed by real-time optical imaging of
macaque monkey primary visual cortex. J. Neurosci. 14 (5 Pt. 1),
2545–2568.
Grubb, R.L. Jr., Raichle, M.E., et al., 1974. The effects of changes in
PaCO2 on cerebral blood volume, blood flow, and vascular mean transit
time. Stroke 5 (5), 630–639.
Hoge, R.D., Atkinson, J., et al., 1999. Linear coupling between cerebral
blood flow and oxygen consumption in activated human cortex. Proc.
Natl. Acad. Sci. U. S. A. 96 (16), 9403–9408.
Hoge, R.D., Franceschini, M.A., et al., 2005. Simultaneous recording of
task-induced changes in blood oxygenation, volume, and flow using
diffuse optical imaging and arterial spin-labeling MRI. NeuroImage 25
(3), 701–707.
Hyder, F., 2004. Neuroimaging with calibrated FMRI. Stroke 35 (11
Suppl. 1), 2635–2641.
Hyder, F., Shulman, R.G., et al., 1998. A model for the regulation of
cerebral oxygen delivery. J. Appl. Physiol. 85 (2), 554–564.
Jones, M., Berwick, J., et al., 2001. Concurrent optical imaging spectro-
scopy and laser-Doppler flowmetry: the relationship between blood
A.K. Dunn et al. / NeuroImage 27 (2005) 279–290290
flow, oxygenation, and volume in rodent barrel cortex. Neuroimage 13
(6 Pt. 1), 1002–1015.
Jones, M., Berwick, J., et al., 2002. Changes in blood flow, oxygenation,
and volume following extended stimulation of rodent barrel cortex.
Neuroimage 15 (3), 474–487.
Kharlamov, A., Brown, B.R., et al., 2004. Heterogeneous response of
cerebral blood flow to hypotension demonstrated by laser speckle
imaging flowmetry in rats. Neurosci. Lett. 368 (2), 151–156.
Kida, I., Kennan, R.P., et al., 2000. High-resolution CMR(O2) mapping
in rat cortex: a multiparametric approach to calibration of BOLD
image contrast at 7 Tesla. J. Cereb. Blood Flow Metab. 20 (5),
847–860.
Kleinfeld, D., Delaney, K.R., 1996. Distributed representation of vibrissa
movement in the upper layers of somatosensory cortex revealed with
voltage-sensitive dyes. J. Comp. Neurol. 375 (1), 89–108.
Kohl, M., Lindauer, U., et al., 2000. Physical model for the spectroscopic
analysis of cortical intrinsic optical signals. Phys. Med. Biol. 45 (12),
3749–3764.
Kossut, M., Hand, P.J., et al., 1988. Single vibrissal cortical column in SI
cortex of rat and its alterations in neonatal and adult vibrissa-
deafferented animals: a quantitative 2DG study. J. Neurophysiol. 60
(2), 829–852.
Lu, H., Golay, X., et al., 2003. Functional magnetic resonance imaging
based on changes in vascular space occupancy. Magn. Reson. Med. 50
(2), 263–274.
Malonek, D., Grinvald, A., 1996. Interactions between electrical activity and
cortical microcirculation revealed by imaging spectroscopy: implications
for functional brain mapping. Science 272 (5261), 551–554.
Mandeville, J.B., Marota, J.J., et al., 1999. Evidence of a cerebrovascular
postarteriole windkessel with delayed compliance. J. Cereb. Blood Flow
Metab. 19 (6), 679–689.
Masino, S., Frostig, R., 1996. Quantitative long-term imaging of the
functional representation of a whisker in rat barrel cortex. Proc. Natl.
Acad. Sci. U. S. A. 93, 4942–4947.
Masino, S., Kwon, M., et al., 1993. Characterization of functional
organization within rat barrel cortex using intrinsic signal optical
imaging through a thinned skull. Proc. Natl. Acad. Sci. U. S. A. 90,
9998–10002.
Matcher, S.J., Cope, M., et al., 1997. In vivo measurements of the
wavelength dependence of tissue-scattering coefficients between 760
and 900 nm measured with time-resolved spectroscopy. Appl. Opt. 36
(1), 386–396.
Mayhew, J., Johnston, D., et al., 2000. Spectroscopic analysis of neural
activity in brain: increased oxygen consumption following activation of
barrel cortex. Neuroimage 12 (6), 664–675.
Mayhew, J., Johnston, D., et al., 2001. Increased oxygen consumption
following activation of brain: theoretical footnotes using spectroscopic
data from barrel cortex. Neuroimage 13 (6 Pt. 1), 975–987.
McCasland, J.S., Woolsey, T.A., 1988. High-resolution 2-deoxyglucose
mapping of functional cortical columns in mouse barrel cortex.
J. Comp. Neurol. 278 (4), 555–569.
Saad, Z.S., Ropella, K.M., et al., 2003. The spatial extent of the BOLD
response. Neuroimage 19 (1), 132–144.
Sheth, S., Nemoto, M., et al., 2003. Evaluation of coupling between optical
intrinsic signals and neuronal activity in rat somatosensory cortex.
Neuroimage 19 (3), 884–894.
Sheth, S.A., Nemoto, M., et al., 2004a. Columnar specificity of micro-
vascular oxygenation and volume responses: implications for functional
brain mapping. J. Neurosci. 24 (3), 634–641.
Sheth, S.A., Nemoto, M., et al., 2004b. Linear and nonlinear relationships
between neuronal activity, oxygen metabolism, and hemodynamic
responses. Neuron 42 (2), 347–355.
Slovin, H., Arieli, A., et al., 2002. Long-term voltage-sensitive dye imaging
reveals cortical dynamics in behaving monkeys. J. Neurophysiol. 88 (6),
3421–3438.
Strangman, G., Franceschini, M.A., et al., 2003. Factors affecting the
accuracy of near-infrared spectroscopy concentration calculations for
focal changes in oxygenation parameters. Neuroimage 18 (4), 865–879.
Tootell, R.B., Switkes, E., et al., 1988. Functional anatomy of
macaque striate cortex: II. Retinotopic organization. J. Neurosci. 8
(5), 1531–1568.
Tootell, R.B., Mendola, J.D., et al., 1997. Functional analysis of V3A and
related areas in human visual cortex. J. Neurosci. 17 (18), 7060–7078.
Ts’o, D.Y., Frostig, R.D., et al., 1990. Functional organization of primate
visual cortex revealed by high resolution optical imaging. Science 249
(4967), 417–420.