Embed Size (px)
Citation preview

SOUTH ESKREPORT
Land Capability Surveyof Tasmania
C J GROSE and R M MORETONDepartment of Primary Industry and Fisheries
Prospect Offices1996
with contributions from J. Finnigan, Salinity Officer, DPIF, Launcestonand W. Chilvers, Soils Officer, DPIF, Stoney Rise.
South Esk Reportand accompanying 1:100 000 scale map
T A S M A N I A
Department ofPrimary Industry and Fisheries

Published by the Department of Primary Industry and Fisheries, Tasmania
with financial assistance from the National Landcare Program
Printed by Printing Authority of Tasmania, Hobart.
© Copyright 1996
ISSN 1036 5249ISBN 0 7246 4276 5
Refer to this report as :Grose C.J. and Moreton R.M. (1996), Land Capability Survey of Tasmania. SouthEsk Report. Department of Primary Industry and Fisheries, Tasmania, Australia.
Accompanies 1:100 000 scale map, titled 'Land Capability Survey of Tasmania.South Esk.' by C J Grose and R M Moreton, Department of Primary Industry andFisheries, Tasmania, 1996.
Contents
Acknowledgments
Summary
1. Introduction 1
2. How to Use this Map and Report 3
2.1 Limitations of Scale 3
2.2 Interpretation of the Land Capability Information 4
2.3 Copyright 5
2.4 Availability of Other Reports and Maps in this Series 5
3. Survey Methodology 7
4. Land Capability Classification 10
4.1 Features of the Tasmanian Land Capability Classification System 11
4.2 Class Definitions 14
5. The South Esk Survey Area 18
5.1 Introduction 18
5.2 Climate 18
5.2.1 Precipitation 19
5.2.2 Evaporation 21
5.2.3 Temperature 21
5.2.4 Wind 23
5.2.5 Growing Season 24
5.3 Geology 25
5.4 Topography and Geomorphology 28
5.5 Soils 31
5.5.1 Upland areas of the Great Western Tiers and Ben Lomond foothills 31
5.5.2 Foothills and lower slopes 31
5.5.3 Launceston Tertiary Basin and dissected terraces 32
5.6 Vegetation 37
5.7 Land Use 38
6. SOIL MANAGEMENT OPTIONS FOR SUSTAINABLE AGRICULTURE 39
6.1 Soil Management Groups 39
7. Soil Salinity in the South Esk Area 41

7.1 Introduction 41
7.1.1 Causes of Salinity 41
7.1.2 The impact of Irrigation Water 41
7.1.3 Management of Salinity 43
8. Land Capability Classes of the South Esk Map 45
8.1 Class 1 and 2 land 45
8.2 Class 3 land 46
8.3 Class 4 land 48
8.4 Class 5 land 55
8.5 Class 6 land 60
8.6 Class 7 land 61
8.7 Exclusion areas 63
9. Discussion 64
References 66
Appendices 69
APPENDIX A. Example of Completed Land Capability Site Cards 70
APPENDIX B. Climatic Data for the South Esk Area 71
APPENDIX C. Capability Classes for Sites within the South Esk Area 72

ACKNOWLEDGMENTS
The authors wish to acknowledge the following groups and individuals who haveassisted with the production of this report:
The farmers and land owners of the South Esk area who gave permission for us tovisit their properties and who provided advice and/or information relating tomanagement and productivity of various agricultural enterprises on the different soiltypes found on their property.
Staff at DPIF who contributed to the production of this report and map especially toPaul Pohlner for assisting with fieldwork, drafting diagrams and digitising; GregPinkard for field checking and proof reading the manuscript; Mark Brown and MarcoGiana in the GIS section for their work in preparing the map and some diagrams forpublication; other personnel who have provided valuable comment in the field andabout the report including Bill Cotching, Bill Chilvers and Mike Temple-Smith.
Kathy Noble for her invaluable contributions to this report through earlierpublications and as a result of several telephone conversations on a wide range oftopics.
The National Landcare Program for jointly funding this project.
SUMMARY
This map and report describes and classifies the land resources occurring on privatelyowned and leased crown land within the area defined by the limits of the South Esk1:100 000 scale topographic map (sheet No. 8314). The area lies just south ofLaunceston and includes many smaller centres such as Longford, Cressy, Conara andpart of Campbell Town. The mapping area extends over 230 721 ha of predominantlyagricultural land.
The land is described and the capability classes defined according to the publishedsystem for Tasmania (Noble 1992a). Capability is based on the ability of the land toproduce sustainable agricultural goods without impairing the long-term, sustainableproductive potential of the land. The system categorises land into seven capabilityclasses with increasing degree of limitation for agricultural production or decreasingrange of crops that can be grown as the system progresses from Class 1 to Class 7.Classes 1 to 4 are considered suitable for cropping activities, Classes 5 to 6 suitablefor pastoral activities only and Class 7 is considered unsuitable for agricultural use.
The land capability boundaries have been determined by a combination of field workand aerial photo interpretation.
The survey area represents a broad down-thrown basin lying between the upliftedhorsts of the Great Western Tiers and The Ben Lomond Hills. The basin has beendissected by a number of river systems and several terrace levels can be identified.The basin comprises predominantly Tertiary sediments with occasional basaltic lavaflows while the main uplifted blocks are of Permian and Triassic sediments capped byJurassic Dolerite. Agricultural activities include cereal cropping in rotation withsheep and beef cattle grazing. The area includes the Cressy-Longford IrrigationScheme where a greater variety of cropping activities occur including potatoes, peas,various horticultural crops and poppies. The use of water pumped from river systemshas further extended the area of land under irrigation. Upland and hill areas arelimited to grazing activities on steep or stony ground.
Table 1 below indicates the extent of the separate land classes identified within theconfines of the survey area. No Class 1 or 2 land was identified and Class 3 landcontributes less than 4% of the area. Class 4 land is the most dominant occupyingover 50 % of the area. Classes 5 and 6 land each occupies slightly less than 15% ofthe area. The major limitations to agricultural use that have been identified are poorsoil conditions (poor internal drainage in duplex soil profiles, occurrence of rocks andstones, shallow effective soil depth), topography and erosion. Climate impacts on therange of crops that can be grown but its significance as a limitation to agriculture isnot as great as other soil and land characteristics.
Current land use within the area is dominated by grazing for sheep and cattle. Mostfarmers are also involved in a limited range of cropping activities including cereals,poppies and potatoes. Some farmers are also involved in more intensive activitiessuch as essential oils and tree nurseries. In the north-west of the study area lies theCressy-Longford irrigation scheme where the agricultural systems are more intensiveand a broader range of crops are grown under irrigation. Within the study area

generally there is a tendency towards an intensification of cropping activitiesresulting in increased pressure on available land resources.
CapabilityClass
Area(Ha)
% land area ofmap sheet
1 0 0.002 0 0.003 8622 3.754 117447 50.91
4+5 5063 2.195 34439 14.92
5+4 2170 0.945+6 8915 3.86
6 34211 14.836+5 67 0.036+7 1478 0.64
7 4409 1.91E 13900 6.02
TOTAL 230721 100
Table 1. Extent of Land Classes and Land Class Complexes on South Esk map.


1
1. INTRODUCTION
This report continues a series of land capability reports published by the Departmentof Primary Industry and Fisheries as part of a 1:100 000 scale land capability surveyof Tasmania's agricultural land first started in 1989. This report and accompanyingmap describes and depicts the land capability of the agricultural land within the SouthEsk map (sheet no 8314).
The land capability project aims to: a) identify and map the extent of different classesof agricultural land in order to provide an effective base for land use planningdecisions; and b) ensure that the long-term productivity of the land is maintained at asustainable level, through the promotion of compatible land uses and managementpractices. It undertakes to achieve these aims through a program of mapping activitiesand associated extension and awareness programs such as Farmwi$e and Best FarmPractice.
The land capability classification system for Tasmania (Noble 1992a) comprises aseven class classification and is based on the capability of the land to support a rangeof agricultural uses on a long-term sustainable basis.
The evaluation system takes into account only the land's capability to supportsustained agricultural production and does not consider suitability for individualcrops, forestry, orchards, vineyards or other non agricultural uses. Being one of aseries some parts of this report have been reproduced from earlier reports by Noble(1991, 1992b, 1993).
As recently as June 1995 Goss et al noted "if Australian Agriculture continuesbusiness as usual, a decline in the condition of natural resources will continue andcontribute to Australia's economic position becoming more precarious." If such aneventuality is to be avoided attention needs to be given to "addressing sustainabilitythrough improved decision making." This can be achieved at all levels from privateland holders to industry and government leaders - but good decisions have to bebased on good information. It is the purpose of this work to provide the necessaryinformation to allow better decision making leading to a reduction in the degradationof Tasmania's agricultural resource.
With ever increasing demands placed on our agricultural land to produce greateryields per unit area, the limitations imposed by extreme climatic conditions and theincreasing uptake of good agricultural land for urban development and subdivision,there is a growing risk of Tasmania's agricultural resource being utilised beyond it'scapability. Inevitably this will lead to the degradation of the soil resource if it is leftunchecked. Thus the conservation of the soil resource is vital for sustainedproductivity and for Tasmania to continue to support a healthy agricultural industry.The basis for soil conservation is the proper management and use of the land, ie.using land within it's capability. However, much of Tasmania's agricultural land haslimitations which restrict the variety of crops that can be grown. The land capabilityclassification system recognises these limitations and uses physical characteristics ofthe land, together with climatic criteria, to evaluate the capability of an area andclassify it accordingly.

2
This report and map evaluates the land capability of private freehold and leasedcrown land only, other areas are considered non agricultural and are mapped asexclusion areas.
PipersTamar
Meander SouthEsk
Figure 1. South Esk Survey Location and Previous Land Capability Surveys in Tasmania
3
2. HOW TO USE THIS MAP AND REPORT
This publication comprises a report and map. It is important that the land capabilitymap be used in conjunction with the accompanying report. By referring to the map,and locating the area of interest, the land capability class assigned to that area can bedetermined. This is indicated on the map by a class number (1 to 7) and an associatedcolour shade.
Definitions of the land capability classes are given on the side legend of the map andin Section 4 of the report. Further detail about each of the land capability classesoccurring on the South Esk map is given in Section 6.
During the course of the survey land sub-classes have been identified within eachland class (see also Section 3). This information is available from the Department ofPrimary Industries, Land and Water Resources Division, Resource AssessmentBranch, for interested users but Sub-Class boundaries have not been included on thepublished map sheet for a variety of reasons outlined in Section 3.
2.1 Limitations of Scale
Special attention needs to be paid to the "limitations" imposed by the scale ofmapping.
It is important that the map be used at the scale at which it is published (1:100 000).The map should not be reproduced at a larger scale (eg. 1:25 000). The landcapability boundaries found on this map are accurate only at the published scale of1:100 000. Errors in interpretation will occur if the map is enlarged. If more detail isrequired, the area of interest should be remapped at a more suitable scale for the enduse, rather than enlarging this map.
Gunn et al (1988) indicate that, at a scale of 1:100 000, the standard minimum areafor a map unit which can be adequately depicted on the map is approximately 64 ha.There appears to be little consistency however, as Landon (1991) suggests a widerange of "minimum areas" are currently in use. For the purposes of this work aminimum map unit size of 0.25 cm, or 25 ha, is used.
In any mapping exercise there are always areas which are physically too small todelineate accurately at a given map scale and in such cases these areas are absorbedinto surrounding units. The map units shown on this map will therefore often containmore than the one land capability class or sub-class. The map units are assigned thedominant land capability class within them but it should be recognised that map unitsmay contain up to 40% of another class. In the majority of cases however, a landcapability map unit may be deemed to be about 80%, and in more uniform areas up to90%, pure.
In some areas, due to the limitations of scale and the complexity of soils andlandscape, and where two classes both occupy between 40 and 60% of the area, aCOMPLEX map unit has been identified (eg. 4+5) and is shown as a striped unit onthe map. The first digit of the map unit label represents the dominant land capability

4
class as does the slightly wider of the two coloured stripes on the map. Furtherdiscussion of this issue and the method of labelling units is to be found in Section 3.
The accuracy of the land capability class boundaries depends on a number of factorsincluding the complexity of the terrain, soils and geology. In some cases the classboundaries may be well defined, such as with abrupt changes in topography.Alternatively, changes may be gradual and more difficult to assess such as with achange in soil depth, some soil types, slope, or extent of rockiness. In these cases theboundary is transitional and therefore can be less precisely plotted on the map.
2.2 Interpretation of the Land Capability Information
The scope and range of applications of the land capability information depends on thescale at which the surveys are carried out. This map has been produced at 1:100 000and is targeted for use at the district or regional planning level.
Larger scale maps such as those at 1:5 000 or 1:10 000 are more suitable for wholefarm planning purposes, to plan farm layouts and identify appropriate land uses, soilconservation and land management practices. A scale of 1:25 000 is more appropriatefor catchment planning though this is dependent on the size of the catchment.
Best use can be made of this map and report by local government, regional and Stateland use planning authorities. The information at this scale is not intended to be usedto make planning decisions at farm level, although the information collected doesprovide a useful base for more detailed studies. The methodology does howeverapply to all scales of mapping and can be utilised equally well by local landowners,local, regional or State planning authorities. More detailed discussion of themethodology is available in Section 3.
Examples of other potential uses of land capability information at 1:100 000 scaleare:
- Identifying areas of prime agricultural land (Classes 1 to 3) for retention foragricultural use
- Rational planning of urban and rural subdivisions- Identifying areas for new crops, enterprises or major developments- Identifying areas for expansion of particular land uses- Planning for new routes for highways, railways, transmission lines, etc.- Identifying areas of land degradation, flooding or areas that may require
special conservation treatment- Identifying areas of potential erosion hazard- Resolving major land use conflicts- Integrated catchment management (depending on catchment size).
Land capability information combined with other resource data, with the aid of a GIS(Geographic Information System), can greatly enhance the accessibility,interpretation and use of this information.
While intended for use by regional and state planning authorities, the informationsupplied in this report is useful at catchment and farmer level as a general indication

5
as to the quality of land that may be found in a particular locality. For example, a newcomer to the area wishing to purchase good quality land for cropping would be betterconcentrating efforts in the Cressy-Longford area, where land of Class 3 has beenidentified, rather than around Campbell Town or Evandale where the land isconsidered class 4 and below. Describing land capability information through thisreport and accompanying map is insufficient to ensure the adoption of sustainableland use practices. Change from practices which may be unsustainable will onlyoccur through increased social awareness and education (a recognition that change isneeded) together with the development of an appropriate implementation framework,including legislative and administrative support, responsible for putting land usepolicies into practice.
The land capability maps and reports do not purport to have legal standing asdocuments in their own right, nor should they attempt to stand alone in planningdecisions without being supported by other relevant land resource, economic, socialor conservation considerations. The information is intended as a guide to planningdevelopment and, where more detailed planning at farm level or for route alignmentis required, further fieldwork needs to be undertaken.
The land capability information for the South Esk map sheet is presented in Section 6of this report and is arranged firstly by class and secondly by geological type onwhich that class occurs. Definitions for the individual capability classes are presentedin Section 4.
2.3 Copyright
The maps, reports and digital information stored on the DPIF databases are copyright,and the data is solely owned by the Department of Primary Industry and Fisheries,Tasmania. Every encouragement is given to individuals who wish to use theinformation contained in this report and accompanying map to assist with their ownproperty management. However, commercial organisations or individuals wishing toreproduce any of this information, by any means, for purposes other than private use,should first seek the permission of the Secretary, Department of Primary Industry andFisheries, Hobart.
2.4 Availability of Other Reports and Maps in this Series
An Index of the land capability maps (based on the Tasmap 1:100 000 Series) isshown on the rear cover of this report. The areas already covered are indicated inFigure 1.
Land Capability Publications currently available :Pipers Report and Accompanying MapTamar Report and Accompanying MapMeander Report and Accompanying MapLand Capability Handbook
Maps and reports are available for purchase by contacting your nearest Department ofPrimary Industry and Fisheries Office or direct from

6
Department of Primary Industry and FisheriesLand and Water Resources DivisionResource Assessment BranchGPO Box 46Kings Meadows, TAS. 7249.

7
3. SURVEY METHODOLOGY
The land capability map is produced through a combination of field work and aerialphoto interpretation. Some limited use has also been made of computer generatedgradient maps using 1:25 000 scale contour information (10 m contour intervals).This information has assisted in the identification of some Class 6 and 7 land inupland areas. In the southern half of the South Esk 1:100 000 scale map considerablereliance has been placed on available soil information (Doyle, 1993) while in thenorthern part, covered by the Longford soil map (Nicolls, 1958), more intensive fieldwork has been undertaken (see also Fig. 2). Extensive field work has been done alongpublic access roads to assess land capability on-site and to check soil type, geologicalboundaries etc. Soils have been examined using a hand held soil auger or byexamination of soil exposures in ditches or road cuttings to determine depth of soilhorizons and other soil properties. Additional fieldwork has been done on selectedproperties throughout the area.
Land capability boundaries have been determined in the field, by using existing soil,geological and climatic data and through interpretation of 1:42 000 scale black andwhite aerial photographs taken during the early to mid 1980s. These boundaries havebeen transferred to 1:50 000 scale topographic base maps (enlargements of 1:100 000scale maps) using an Artiscope Rescaler. Not all map units have been visited.Interpretation of existing land information and the aerial photographs has been usedto predict land capability in many areas. This approach is necessary to reduce thetime required to produce an end product. It is applicable for areas where a goodunderstanding of the relationships between soil, geology, landform etc and landcapability exists. In assessing land capability consideration has been given to a widerange of land factors together with information supplied by farmers and agriculturaladvisers within DPIF.
Within the study area some 300 site observations have been recorded. Siteinformation is stored on a data card and also in a database using EXCEL software.The data card records a variety of site information relevant to evaluating landcapability and records both land capability class and subclass information. Anexample of a completed site card appears in Appendix A. Base maps, with landcapability boundaries appended, have been digitised and information captured andstored in ArcInfo at a scale equivalent to 1:50 000. Final publication scale is at1:100 000. Field checking of land capability evaluation has been undertaken by peerswithin the DPIF who have experience in agriculture, soils and evaluation techniques.
Throughout the fieldwork attempts have been made to identify the type of limitationto agricultural use for each map unit and to determine boundaries between areas withdifferent limitations. Despite the obvious value of including this information on thepublished map this has not been done for a number of reasons. In many parts of theState identification of sub-class boundaries would lead to unnecessary complicationand detail when published at 1:100 000 scale. This is particularly so for existing mapsheets like Pipers and is likely to be the case for the Forth sheet. Considerablereliance is placed on existing soil maps for interpretation of capability sub-classes.However, the units on soil maps are often associations of soils, that is they containmore than one soil type often of differing capability. It is impossible to map such

8
detail at 1:100 000 scale and soil map units are therefore often considered to be fairlyuniform and evaluated accordingly. Where site observations do identify differences insoil and capability attempts have been made to portray this on the map where theunits are of sufficient size.
The inclusion of sub-class boundaries on the final map was given some considerationbut rejected for a variety of reasons: for example, there is a desire to maintain a levelof consistency with earlier, and future, reports; and, given the complexity of subclassboundaries it is unlikely that the intensity of observations undertaken is insufficient todepict these boundaries with the necessary level of accuracy. Sub-class information isavailable from DPIF for those that are interested but it should be recognised that anumber of caveats relating to scale and accuracy apply to the information. Also, sub-class codes are retained in many photographs and text to provide the user withadditional examples of the nature of limitations in some areas and on various soil orlandform types.
In undertaking the land evaluation of the South Esk area the following approach hasbeen taken:- The Land Capability Classification system is designed to evaluate thegeneral agricultural capability of the land and thus no consideration is given to otherpotential land uses. Only private freehold and leased Crown land has been mappedwith all other areas of State Forests, State Reserves, Conservation Areas, NationalParks, Crown Land, Urban areas etc being excluded from the study. These nonagricultural areas are indicated on the map by the letter E. The evaluation procedureis as outlined in Noble (1992).
For 1:100 000 scale surveys the issue of irrigation and it's impact on land capabilityclassification has created much discussion. The extent of the beneficial effects ofirrigation on land capability will vary considerably, depending upon such factors asavailability of water, economics and the skill of the property manager. These factorsall require assessment on an individual property basis, a procedure not appropriate atthis level of mapping. Also, it is beyond the scope of this survey to identify areaswhere irrigation water might be available.
While it is recognised that some areas of the State have the potential to attain animproved land capability ranking through the application of irrigation water (ie. thoseareas with a 'c' limitation due to an inadequate rainfall supply or distribution) this hasnot been considered during this evaluation and land capability has therefore beenassessed assuming no irrigation potential.

9
Photo 1. Field checking land class boundaries.
Figure 2.Distribution of Land Capability Observation Siteson the South Esk Map Sheet.
10
4. LAND CAPABILITY CLASSIFICATION
Land capability classification is an internationally recognised means of landclassification, used to evaluate the capability of land to support a range of land useson a long-term, sustainable basis.
For the Tasmanian classification, agricultural land uses only are considered, and aredefined as broad scale grazing and cropping uses. Land capability ratings for specificland uses are not evaluated, nor is the capability of land for forestry use incorporatedinto the classification system.
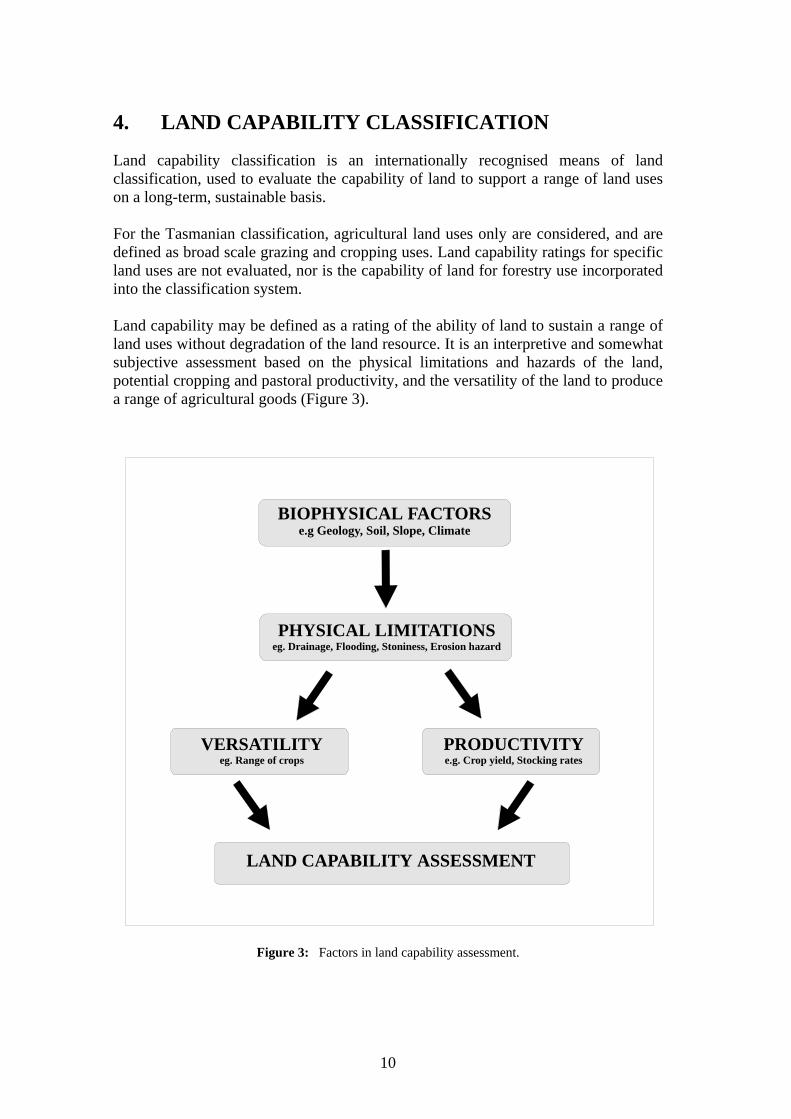
Land capability may be defined as a rating of the ability of land to sustain a range ofland uses without degradation of the land resource. It is an interpretive and somewhatsubjective assessment based on the physical limitations and hazards of the land,potential cropping and pastoral productivity, and the versatility of the land to producea range of agricultural goods (Figure 3).
Figure 3: Factors in land capability assessment.
BIOPHYSICAL FACTORSe.g Geology, Soil, Slope, Climate
PHYSICAL LIMITATIONSeg. Drainage, Flooding, Stoniness, Erosion hazard
VERSATILITYeg. Range of crops
PRODUCTIVITYe.g. Crop yield, Stocking rates
LAND CAPABILITY ASSESSMENT

11
Land capability assessment takes into account the physical nature of the land (e.g.geology, soils, slope) plus other factors (e.g. climate, erosion hazard, landmanagement practices) which determine how that land can be used withoutdestroying its long-term potential for sustainable agricultural production. It also takesinto account limitations that might affect agricultural use, e.g. stoniness, drainage,salinity or flooding. Land capability assessment is therefore based on the permanentbiophysical features of the land (including climate), and does not take into accountthe economics of agricultural production, distance from markets, or social or politicalfactors.
Land capability assessment should not be confused with land suitability assessmentwhich, in addition to the biophysical features, may take into account economic, socialand/or political factors in evaluating the 'best' use of a particular type of land. Landcapability classification gives a grading of land for broad scale agricultural uses,whereas land suitability is applied to more specific, clearly defined land uses, such asland 'suitable' for growing carrots.
The basic principle of land capability brings together both facets of conservation -protection of the land and its potential production. In other words, the balancebetween use of the land and the risk of degradation.
4.1 Features of the Tasmanian Land Capability Classification System
The Tasmanian system of land capability classifies land into seven classes accordingto the land's capability to produce agricultural goods. The system is modelled on theUSDA (United States Department of Agriculture) approach to land capability(Klingbiel and Montgomery, 1961) and is described in full by Noble (1992). Asummary of the system is presented here to assist with the interpretation of the reportand accompanying map. The classification does not attempt to portray specific landuses, or rank the value of any particular agricultural land use above another. Neitherdoes it attempt to give an indication of land values.
The Tasmanian land capability classification system is based on agriculturalproduction (cropping and pastoral productivity). It is based on cultivation of the landfor cropping purposes and not other land use systems which can sustain 'crops' onsteeper land with longer rotations and less risk of erosion (e.g. perennial horticulture,silviculture).
The classification relates primarily to three permanent biophysical features of thelandscape - soil, slope and climate - and their interactions. These three factors have amajor influence in determining the capability of the land to produce agriculturalgoods. Other factors which must be taken into account include rock type, erosionhazard, range of crops that can be grown, management practices, soil conservationtreatment, risk of flooding and past land use history.
Three levels are defined within the Tasmanian land capability classification:
- The land capability Class - which gives an indication of the general degree oflimitation to use

12
- Sub-class - which identifies the dominant kind of limitation
- and the Unit - which groups land with similar management and conservationrequirements, potential productivity, etc.
The land capability system can be used and applied at various scales by mapping tothe class, subclass and unit levels. The level at which the mapping is undertaken andpresented depends on the purpose and scale of the survey. The levels of the landcapability classification system are shown in Figure 4.
Figure 4: Levels of the land capability classification system. (Adapted from: National Water and Soil Conservation Organisation, 1979, Our Land Resources. (NWASCO), Wellington, New Zealand.)
The classification system comprises seven classes ranked in order of increasingdegree of limitation, and in decreasing order of versatility, for agricultural use. Thesystem is hierarchical. Class 1 land is identified as the best land and can produce awider variety of crops and pastures at higher levels of production with lower costs, orwith less risk of damage to the land, than any of the other classes of land. Class 2 landis similarly superior to Classes 3 to 7, and so on.
1 2 3 4 5 6 7Class
Subclass
Unit
erosion (e) wetness (w) soils (s) climate (c)
1 2 3 etc
Degree of limitation
Dominant kind of limitation
Similar management and conservation requirements, etc
13
Each land class can be subdivided into one of four sub-classes depending on thenature of the dominant limitation or hazard to the use of that land. Limitations may bedefined as physical factors or constraints which affect the versatility of the land anddetermine its capability for long-term sustainable agricultural production. Somelimitations are able to be removed or modified through normal management practicesor other means. Where such improvements are considered feasible, both physicallyand economically, land may be classified higher than it's current condition mightindicate. Such improvements do not include the use of irrigation water but mayinclude drainage or stone picking.
The limitation classes identified are erosion (e), wetness (w), soils (s) and climate (c).Examples of different kinds of limitations are: erosion hazard, slope, climate,flooding, stoniness, rock outcrops, salinity, poor soil structure, poor internal drainage,low fertility and low soil moisture holding capacity. There may be one or a number oflimitations present at any one site, and it is the overall degree of limitation presentthat determines the capability class.
Each subclass may be further subdivided to unit level. Land capability units are areasof land with similar management and conservation requirements or differences inproductivity which may not be significant at higher levels within the classificationsystem. Thus an area identified as class 4e may be further subdivided into 4e1 (class4e land subject to wind erosion) and 4e2 (class 4e land subject to water erosion).
The system assesses the versatility of the land to produce a range of agriculturalgoods that are considered typical for Tasmania, and not just those that are specific orsuited to localised areas. For example, small scale intensive activities like soft fruitorchards and floriculture are not considered when evaluating the versatility of anarea. Opportunities for silviculture is another activity that the system does notconsider. The main agricultural land uses that are considered when evaluating landinclude cereals, poppies, broad scale vegetable production (potatoes, peas, beans,onions etc), pyrethrum and essential oils plus dairy, beef, lamb and wool production.
The system considers degradation of the soil resource and does not take into accountthe possible effects of agricultural land use on water quality, aesthetics, wildlife, etc.
The classification, in particular at the unit level, takes into account the managementstrategies and soil conservation requirements the land may need in order to maintain alevel of production without long-term degradation. However, the availability ofirrigation water is not taken into consideration when evaluating the capability of theland (see Section 3).
As with most land classification systems certain assumptions are necessary. Theseinclude:
(a) The land capability classification is an interpretive classification basedon the permanent biophysical characteristics of the land.
(b) A moderately high level of management is being applied to the land.
(c) Appropriate soil conservation measures have been applied.

14
(d) Where it is reasonable and feasible for an individual farmer to removeor modify physical limitations (e.g. high water tables, stoniness, lowfertility) the land is assessed assuming the improvements have beenmade.
(e) Land capability assessments of an area can be changed by majorschemes that permanently change the nature and extent of thelimitations (e.g. drainage or flood control schemes).
(f) The land capability classification is not a productivity rating forspecific crops, although the ratio of inputs to outputs may help todetermine the land capability class.
(g) Land capability does not take into account economic, social or politicalfactors and is not influenced by such factors as location, distance frommarkets, land ownership, or skill of individual farmers.
(h) Present and past uses of the land (or similar land elsewhere) are guidesto potential, in that they can indicate the limits of the capability of theland. Present land use and vegetation cover are not always goodindicators of land capability class. The system of land capability isaimed at assessing the potential sustainable productivity of land ratherthan current productivity.
(i) Assessments are based on the capability of the land for sustainedagricultural productivity, since use of the land beyond its capabilitycan lead to land degradation and permanent damage.
(j) Irrigation, or the feasibility of irrigation, is not considered whenevaluating land capability.
(k) The system is consistent across the State.
It is important to remember that the land capability of an area can change as result ofimproved farming practices, changes in crop variety, technical innovations or just abetter understanding of the relationships between soils, farming and the naturalenvironment. The information in this report has a limited lifespan and care should begiven to its interpretation in future years. Farming practices that today are onlyavailable for the advanced or innovative farmer may become common practice in thefuture.
4.2 Class Definitions
The following class definitions apply. The criteria used to define the classes arebased on observation and experience only, and not on experimental work. Figure 5outlines the main features of the classification classes. Classes 1-4 only areconsidered capable of supporting cropping activities on a sustainable basis; classes 5and 6 are suitable for grazing activities only although pasture improvement may be

15
possible on class 5 land (class 6 land remaining as native pasture); class 7 land isunsuitable for any form of sustainable agricultural activity.
CLASS LIMITATIONS CHOICE OF CROPS
CONSERVATIONPRACTICES
1 nil any none
2 slight slightly reduced minor
3 moderate reduced major
4 severe restricted
5slight
tosevere
- major+
6 severe -
carefulmanagement
7very severe
toextreme
-
Figure 5: Features of land capability classes.
Also, there is a range of land that can occur in any one capability class. Thus it isoften possible, for example, to identify good and poor quality Class 4 land. While theintensity of mapping required to acheive this is not feasible when mapping landclasses at 1:100 000 scale it would be possible to map such differences at the unitlevel.
CLASS 1
Multiple use land with only minor limitations to intensive cropping and grazing. Itoccurs on flat land with deep, well drained soils, and in a climate that favours a widevariety of crops. It is capable of being cropped eight to nine years out of ten in arotation with pasture or equivalent without risk of damage to the soil resource or lossof production.

16
CLASS 2
Land suitable for intensive cropping and grazing. Limitations to use are slight, andthese can be readily overcome by management and minor conservation practices.Limitations present increase the risk of damage to the soil resource through overcultivation or the risk of yield loss is such that the length of the cropping phase isreduced to five to eight years out of ten in a rotation with pasture or equivalent during'normal' years.
CLASS 3
Land suitable for cropping and intensive grazing. Limitations are such that eithercultivation for cropping should be limited to two to five successive crops in a rotationwith pasture or equivalent to prevent damage to the soil resource, or the risk of cropfailure or yield reduction with average climatic conditions is such that significantlosses can be expected 5-7 years out of ten. Soil conservation practices and soundmanagement are needed to overcome the moderate limitations to cropping use. Therange of crops able to be grown is generally more restricted than on Class 1 or 2 land.
CLASS 4
Land marginally suitable for cropping because of severe limitations which restrict therange of crops that can be grown, and/or make major conservation treatment andcareful management necessary. Cropping rotations should be restricted to one to twoyears out of ten in a rotation with pasture or equivalent to avoid damage to the soilresource or are limited by severe climatic conditions such that there is a very highrisk of crop failure or yield decline in most years. This land is well suited to intensivegrazing.
CLASS 5
Land with slight to moderate limitations to pastoral use. This land is unsuitable forcropping, although some areas on easier slopes may be cultivated for pastureestablishment or renewal. The effects of limitations on the grazing potential may bereduced by applying appropriate soil conservation measures and land managementpractices.
CLASS 6
Land marginally suitable for grazing because of severe limitations. This land has lowlevels of production, high risk of erosion, low natural fertility or other limitations thatseverely restrict agricultural use.
CLASS 7
Land with very severe to extreme limitations which make it unsuitable foragricultural use.
17
E - Exclusion Areas
Land that is not private freehold or leased crown land and has not therefore beenconsidered during the evaluation.
Note on Class DefinitionsThe length of cropping phase given for classes 1-4 is intended as a general guideonly. Past experience has shown that there is some confusion and concern regardingthe figures given. While some land will just not support production beyond theintensity recommended (due to the risk of erosion or soil structure decline, forexample), other areas are limited by the risk of loss occasioned by such factors asadverse climatic conditions or flooding.
For example, some parts of the survey area are subject to a significant flood risk. Dueto rainfall patterns in recent years it has been possible to cultivate these areas moreintensively than might 'normally' be achieved. By cultivating these areas farmers areaccepting a high risk of failure or damage to crops from flooding and whether or nota crop is planted in any particular year is dependent, in part, on just how much risk anindividual farmer is prepared to accept. In other areas the soils are such thatsignificant periods of cultivation without a break can lead to severe structure decline,hindering germination, water infiltration, soil aeration and increasing the likelihoodof erosion.
Also, the classification system takes into account the variety of crops that can begrown (see also page 14 for examples of crops considered). Thus Class 4 land mightincorporate areas where a relatively wide range of crops could be grown but the riskof damage to the resource is such that cropping should only be undertaken one or twoyears out of ten. Conversely, other areas may support a more limited range of cropsbut production may be sustainable over a longer period.
It should be noted that capability classes have not been defined on the basis ofproductivity. This is partly due to problems in comparing the relative value ofdifferent agricultural practices and partly due to the lack of data regarding just what issustainable for each land class. As well, within any particular land class, there islikely to exist a range of land and, at a more detailed level of mapping, it may bepossible to distinguish, for example, between good Class 4 land and poor Class 4land.

18
5. THE SOUTH ESK SURVEY AREA
5.1 Introduction
This is the fourth in a series of land capability reports for Tasmania and covers thearea defined by the South Esk 1:100 000 scale topographic map (sheet no 8314). Theinformation printed here and in the accompanying map is intended for use at aregional planning level and is inappropriate for farm scale planning. However, thesystem and the methodology can be applied at any level (see Section 2).
The study area lies in the Northern Midlands region of Tasmania, immediately southof Launceston (see also Figure 1). It includes the local centres of Hadspen, Longford,Perth and Evandale in the north-west; Cressy in the West, Campbell Town in theSouth East, Epping Forest and Conara on the Midlands Highway and Blessington inthe north east. The total area is some 2 400 km2 which includes part of theLaunceston Tertiary Basin and upland areas in the north-east and south-west.
Land use throughout the area is principally agricultural, being mainly grazing forsheep and cattle but with some extensive areas of cereal production. Better qualitysoils in the north-west are used more intensively. The study area includes the CressyLongford irrigation area which, with its reliable supply of water, is used moreintensively than other areas and grows a wider variety of crops, including poppies,potatoes and other vegetables, on soil types that without irrigation would normally beconfined to cereals and pasture. An exclusion area is identified in the south-west ofthe map sheet being mainly State forest. Small, scattered exclusion areas occur acrossthe map sheet most of which are connected with the Hydro Electric Commission(HEC).
5.2 Climate
The climate for the South Esk map sheet is dry temperate, (Doyle 1993). Within thisbroad climatic type the area experiences a range of climatic conditions relating tovariations in topography across the map sheet. Two main climatic zones areidentified; areas above 500 m which experience cool temperatures and moderaterainfall; and warmer, drier areas occurring below the 500 m contour.
The upland areas of Millers Bluff, O'Connors Peak, parts of the Blessington area andThe Great Western Tiers, experience heavier rainfall and much lower averagetemperatures throughout the year compared to lower altitude areas, particularly inwinter. Agricultural production is limited in these areas due to out of season frostsand shorter growing season, as well as topographic and soil conditions. Rainfall in thehills and higher catchments can result in flooding of the lowland areas particularly inwinter and spring.
The main agricultural areas occur at low altitudes and include the local centres ofCressy, Longford, Perth, Epping Forest and Campbell Town. These areas have amore favourable climate although rainfall becomes increasingly more limiting towardthe drier south east. A winter dominated rainfall pattern exists with warmertemperatures throughout the year compared to that of the elevated areas.

19
5.2.1 Precipitation
Figure 6 shows the average annual rainfall for the region redrawn from data collatedby the Hydro Electric Commission in 1986.
Figure 6. Rainfall isohyet diagramfor the South Esk area.
(Isohyets in mm/annum)
The influence of topography isclearly evident with upland regions receiving greater rainfall than lower lying areas.A weak rain shadow effect is discernible on the lee side of the Great Western Tiers.
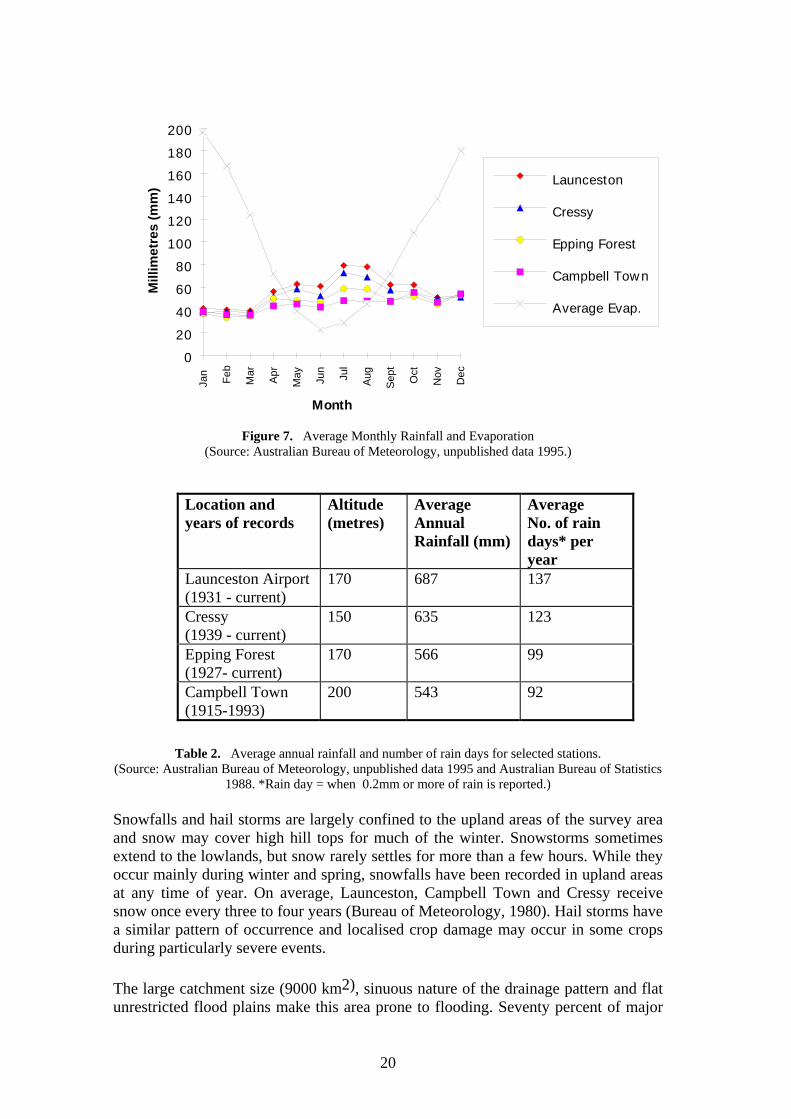
Rainfall within the map sheet is winter and spring dominated with July and Augustbeing the wettest months of the year. Fig. 7 shows average monthly rainfall andevaporation figures for selected meteorological stations within the survey area.
The number of recorded rainfall days and average annual rainfall decreases fromnorth to south and there is also a distinct rainfall trough in low lying areas betweenthe Great Western Tiers and the Ben Lomond Plateau.
While the data in Fig 7 and Table 2 represent average values, the occurrence of lowerannual rainfall in these areas is not uncommon. The recorded rainfall for LauncestonAirport and Campbell Town in the dry year of 1987 for example was only 480mmand 392mm respectively compared to an annual average of 687mm and 543mm(Australian Bureau of Statistics 1988 & Australian Bureau of Meteorology 1995). Atsuch times crop and stock losses can be expected. While periods of low rainfall arenot common, they occur sufficiently often to be an issue of some concern to farmersin comparatively low rainfall areas such as the Northern Midlands area.
20
Figure 7. Average Monthly Rainfall and Evaporation(Source: Australian Bureau of Meteorology, unpublished data 1995.)
Table 2. Average annual rainfall and number of rain days for selected stations.(Source: Australian Bureau of Meteorology, unpublished data 1995 and Australian Bureau of Statistics
1988. *Rain day = when 0.2mm or more of rain is reported.)
Snowfalls and hail storms are largely confined to the upland areas of the survey areaand snow may cover high hill tops for much of the winter. Snowstorms sometimesextend to the lowlands, but snow rarely settles for more than a few hours. While theyoccur mainly during winter and spring, snowfalls have been recorded in upland areasat any time of year. On average, Launceston, Campbell Town and Cressy receivesnow once every three to four years (Bureau of Meteorology, 1980). Hail storms havea similar pattern of occurrence and localised crop damage may occur in some cropsduring particularly severe events.
The large catchment size (9000 km2), sinuous nature of the drainage pattern and flatunrestricted flood plains make this area prone to flooding. Seventy percent of major
Month
Mill
imet
res
(mm
)
0
20
40
60
80
100
120
140
160
180
200
Jan
Feb
Mar
Apr
May Jun
Jul
Aug
Sept
Oct
Nov Dec
Launceston
Cressy
Epping Forest
Campbell Tow n
Average Evap.
Location andyears of records
Altitude(metres)
AverageAnnualRainfall (mm)
AverageNo. of raindays* peryear
Launceston Airport(1931 - current)
170 687 137
Cressy(1939 - current)
150 635 123
Epping Forest(1927- current)
170 566 99
Campbell Town(1915-1993)
200 543 92

21
floods occur in autumn and winter, 21% in spring and 9% occur in summer (Bureauof Meteorology, 1980). "Nuisance" flooding occurs in low lying areas and drainagecourses throughout the year, and are often a result of heavy rain storms higher in thecatchment. Damage caused by flooding to agricultural crops is dependant on thetiming of the event and the duration that crops are inundated. Little information isavailable on crop damage by flooding except that in some areas it is of significantconcern. Levee banks have been constructed in some areas to reduce the impact uponagricultural land and townships with some degree of success.
The South Esk River and its tributaries are all subject to flooding and do so mostyears. Inundation mostly occurs on agricultural land although in severe floods partsof rural townships such as Longford can be affected. Such floods are normally ofonly short duration and limited depth and extent but can cause significant damage ifthey occur at a sensitive time of year.
5.2.2 Evaporation
Evaporation data from within the Launceston Basin indicate the evaporation from anopen water surface exceeds precipitation over eight months of the year (see Fig 7).Evaporation data presented has been derived from the monthly averages for threesites within the survey area, Cressy Research Station, Campbell Town andLaunceston Airport, and is representative of lowland areas only.
The evaporation data has been used to calculate effective rainfall using Prescott'sformula (see following Section on Growing Season). Effective rainfall data for theSouth Esk area (see Appendix B) indicates a period from January through to Marchwhen insufficient rainfall occurs. The formula is designed to estimate effectiverainfall for areas under cereal crops in southern Australia and care is thereforerequired when applying it within Tasmania or to areas under crops other than cereals.However, with the lack of a suitable alternative, the figures present a rough guide tosoil moisture conditions.
Winter rainfall in excess of evaporation often results in localised waterlogging andinundation and also impacts upon length of growing season, plant health andtrafficability of the ground.
5.2.3 Temperature
Average temperatures indicate a distinct seasonality with average maximumtemperature in summer peaking just under 25°C in January and February whileaverage minimums of just over 0°C are recorded in June. The range betweenmaximum and minimum temperatures is smallest in the winter but rarely fluctuatesoutside the 10-15° range (see Fig. 9).
Figure 9 also indicates that, although the differences are only slight, southern parts ofthe survey area are likely to experience slightly higher summer maximumtemperatures and lower winter minimum temperatures than more northern areas.There is no data for upland areas but average temperatures will be significantly lowerand risk of frosts higher than areas within the Launceston Basin.

22
Photo 2. Flooding on the South Esk River near Belle View Road.(Grid Ref. E 531450, N 5378850)
Figure 8. Average dates for (A) first occurrence and (B) last occurrence of air frost in Tasmania(after Langford, 1965)

23
Month
0
5
10
15
20
25
Jan Feb Mar Apr May Jun Jul Aug Sept Oct Nov Dec
Launceston
Cressy
Campbell Town
Figure 9. Mean Monthly Maximum and Minimum Temperatures for the South Esk Area(Source: Australian Bureau of Meteorology, unpublished data 1995)
Low temperatures leading to the formation of frost have been recorded in all parts ofthe survey area. At Cressy nearly 100 frosts occur a year, the majority during theperiod May to October although frosts have been recorded in all months of the year,(Bureau of Meteorology, 1993). Local factors such as terrain and air movement resultin localisation of frosts and will affect their frequency and severity. Inland valleyfloors are the most prone to severe frosting. Figure 8 indicates the average dates offirst and last occurrences of air frosts in Tasmania. However, while frost risk is afactor in considering the variety of crops that might be grown and potential plantingand harvest dates, it is a factor which is of secondary importance to other limitationssuch as erosion risk, flooding or soil type.
Local experience has identified an increasing prevalence of frost within theLaunceston Basin with increasing proximity to the Western Tiers. This is a result ofcold air from higher altitudes spilling over the Tiers and collecting at lower elevationsand displacing warmer air upwards. Such localised air movements have resulted in aslightly higher incidence of frost in some areas than might be otherwise expected.Although the severity of this event is probably insufficient to warrant the downgrading of any land it's significance should not be underestimated by property ownersbelow the Tiers.
5.2.4 Wind
The prevailing wind for the State is mainly westerly however this is channelledthrough the Launceston Tertiary Basin by the topography to result in a predominantlynortherly and north westerly air stream within the survey area. Wind strengths aregreatest and most persistent in late winter and early spring (Bureau of Meteorology,1980,1993). In summer northern areas can experience easterly to south-easterly windsin the morning with a north-westerly sea breeze dominating in the afternoon. Furtherinland the effect of the sea breeze is less intense and more variable wind strengthsand directions occur.
24
5.2.5 Growing Season
The length of growing season in the South Esk area is controlled by temperature(particularly frost occurrence) and effective rainfall. While climate in itself isnowhere considered more limiting than other factors of erosion, wetness and soilsexcept at higher altitudes, it can impact locally on the length of growing season andthe variety of crops that can be grown safely. However, little information is availableregarding the length of growing season in different parts of Tasmania and thefollowing information is interpretive using indicators and methodologies usedelsewhere in Australia to estimate the length of growing season within the surveyarea.
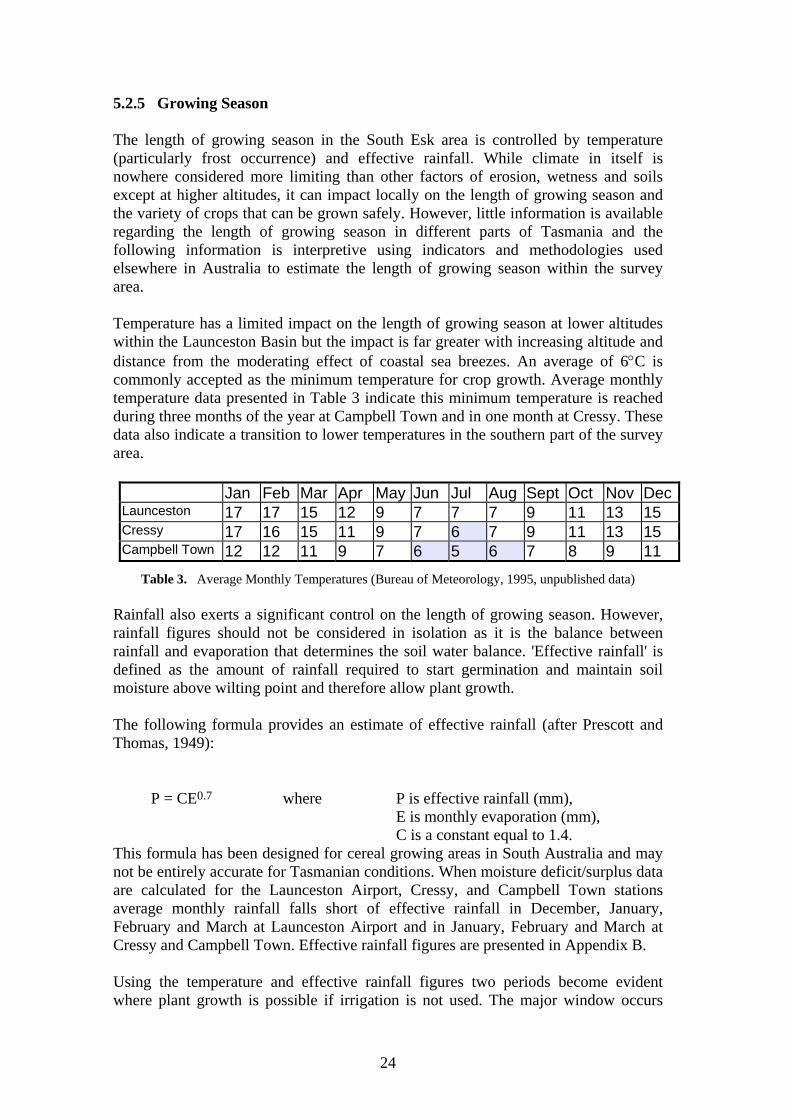
Temperature has a limited impact on the length of growing season at lower altitudeswithin the Launceston Basin but the impact is far greater with increasing altitude anddistance from the moderating effect of coastal sea breezes. An average of 6°C iscommonly accepted as the minimum temperature for crop growth. Average monthlytemperature data presented in Table 3 indicate this minimum temperature is reachedduring three months of the year at Campbell Town and in one month at Cressy. Thesedata also indicate a transition to lower temperatures in the southern part of the surveyarea.
Table 3. Average Monthly Temperatures (Bureau of Meteorology, 1995, unpublished data)
Rainfall also exerts a significant control on the length of growing season. However,rainfall figures should not be considered in isolation as it is the balance betweenrainfall and evaporation that determines the soil water balance. 'Effective rainfall' isdefined as the amount of rainfall required to start germination and maintain soilmoisture above wilting point and therefore allow plant growth.
The following formula provides an estimate of effective rainfall (after Prescott andThomas, 1949):
P = CE0.7 where P is effective rainfall (mm),E is monthly evaporation (mm),C is a constant equal to 1.4.
This formula has been designed for cereal growing areas in South Australia and maynot be entirely accurate for Tasmanian conditions. When moisture deficit/surplus dataare calculated for the Launceston Airport, Cressy, and Campbell Town stationsaverage monthly rainfall falls short of effective rainfall in December, January,February and March at Launceston Airport and in January, February and March atCressy and Campbell Town. Effective rainfall figures are presented in Appendix B.
Using the temperature and effective rainfall figures two periods become evidentwhere plant growth is possible if irrigation is not used. The major window occurs
Jan Feb Mar Apr May Jun Jul Aug Sept Oct Nov DecLaunceston 17 17 15 12 9 7 7 7 9 11 13 15Cressy 17 16 15 11 9 7 6 7 9 11 13 15Campbell Town 12 12 11 9 7 6 5 6 7 8 9 11

25
between September and late December with a second, more minor window ofopportunity, in April and May. These figures are supported by the planting strategy ofmost farmers who may sow winter cereals in April/May that will be grazed during thewinter and then allowed to mature in the following spring/summer together with aspring sowing in September/October for summer crops.
In many areas, low summer rainfall during December to March necessitates the use ofirrigation, if the soils are under intensive use, to avoid crop losses or yield reductionparticularly for those crops with high water requirement or on soils with low waterholding capacities. Growers who do not have access to irrigation water will berestricted to a narrower range of crops and be confined to a shorter cropping seasonthan those who can irrigate.
The growing periods identified above are generally sufficient for the majority ofcrops grown in the South Esk region. However hot dry summers and severe winterconditions can further shorten the growing season as well as influence the range ofcrops that may be grown.
5.3 Geology
The South Esk survey area is covered by two geological maps, 'Lake River' 1:50 000(Matthews, 1974) in the south and 'Longford' 1:63 360 (Blake, 1959) in the north.
This area is part of a wider region that has undergone a complex and diversegeological evolution. As discussed in Section 5.4 the present day topography haslargely been determined by a variety of geological events. The more important ofthese events include the intrusion of dolerite magmas into older sediments, a periodof faulting and folding and the occurrence of basaltic lava flows. Geomorphicprocesses have also occurred to further shape the landscape through erosion anddeposition. Figure 10 outlines the geology of the survey area in relation totopography.
The survey area is dominated by the Launceston Tertiary Basin (Johnstone, 1875)formed as a result of normal faulting during the early Tertiary period (approx. 65million yrs BP) and subsequent partial infilling of the basin by material eroded fromthe surrounding uplifted blocks. Dolerite ridges and scattered basaltic lava flows aretoday a prominent feature of the basin. To the north-east and south-west the basin isbordered by the Ben Lomond Plateau and the Great Western Tiers respectively.
The geology of the Launceston Tertiary Basin comprises unconsolidated clays, sandsand gravels. These materials have been interpreted as lake and river sediments(Matthews, 1974), which have been deposited during the mid to late Tertiary periodafter being eroded from the surrounding uplifted areas. As the lake waters drainedfrom the basin, river systems cut through the landscape to form a series of flatterraces. These are discussed in Section 5.5.3 and may be seen at Cressy, Longfordand other parts of the basin.
Quaternary alluvium occurs along major river courses, including those of the currentSouth Esk, Macquarie, Lake and Elizabeth rivers. Inundation and over-bank flow
26
over many thousands of years has led to a significant build up of these deposits whichare locally important for agriculture.
Overlying some of the alluvial sediments and older terrace levels, are scattereddeposits of windblown (aeolian) sands originating from the basin's lake and glacialsediments. These deposits may be seen as gentle rolling hummocks and crescentdunes often on the lee or eastern side of alluvial depressions. Examples may be seenon the footslopes of Mt Augusta, around Diprose Lagoon and on many alluvialplains. Often these sediments occur in association with other rock types or as a thindeposit overlying other sediments.
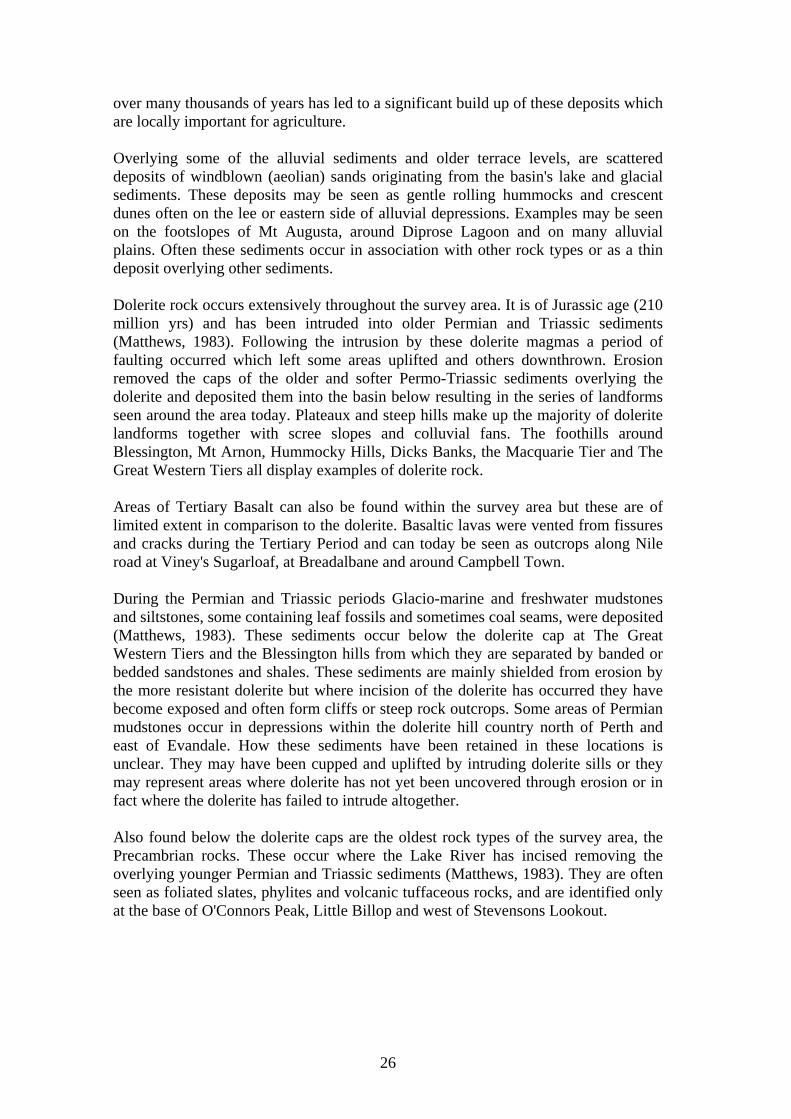
Dolerite rock occurs extensively throughout the survey area. It is of Jurassic age (210million yrs) and has been intruded into older Permian and Triassic sediments(Matthews, 1983). Following the intrusion by these dolerite magmas a period offaulting occurred which left some areas uplifted and others downthrown. Erosionremoved the caps of the older and softer Permo-Triassic sediments overlying thedolerite and deposited them into the basin below resulting in the series of landformsseen around the area today. Plateaux and steep hills make up the majority of doleritelandforms together with scree slopes and colluvial fans. The foothills aroundBlessington, Mt Arnon, Hummocky Hills, Dicks Banks, the Macquarie Tier and TheGreat Western Tiers all display examples of dolerite rock.
Areas of Tertiary Basalt can also be found within the survey area but these are oflimited extent in comparison to the dolerite. Basaltic lavas were vented from fissuresand cracks during the Tertiary Period and can today be seen as outcrops along Nileroad at Viney's Sugarloaf, at Breadalbane and around Campbell Town.
During the Permian and Triassic periods Glacio-marine and freshwater mudstonesand siltstones, some containing leaf fossils and sometimes coal seams, were deposited(Matthews, 1983). These sediments occur below the dolerite cap at The GreatWestern Tiers and the Blessington hills from which they are separated by banded orbedded sandstones and shales. These sediments are mainly shielded from erosion bythe more resistant dolerite but where incision of the dolerite has occurred they havebecome exposed and often form cliffs or steep rock outcrops. Some areas of Permianmudstones occur in depressions within the dolerite hill country north of Perth andeast of Evandale. How these sediments have been retained in these locations isunclear. They may have been cupped and uplifted by intruding dolerite sills or theymay represent areas where dolerite has not yet been uncovered through erosion or infact where the dolerite has failed to intrude altogether.
Also found below the dolerite caps are the oldest rock types of the survey area, thePrecambrian rocks. These occur where the Lake River has incised removing theoverlying younger Permian and Triassic sediments (Matthews, 1983). They are oftenseen as foliated slates, phylites and volcanic tuffaceous rocks, and are identified onlyat the base of O'Connors Peak, Little Billop and west of Stevensons Lookout.

27
Figure 10. Digital elevation model and dominant geological types, South Esk Survey area.

28
5.4 Topography and Geomorphology
The topography of the area is dominated by the broad open expanse of the north-west - south-east aligned Launceston Tertiary Basin, the upland areas of the Great Western Tiers andCentral Plateau in the south-west and the lower ranges of the Ben Lomond Plateau in thenorth-east. These geomorphological features are clearly visible on the digital elevation modelpresented in Figure 10.
The Launceston Basin forms a down thrown graben between the uplifted horsts of the CentralPlateau and Ben Lomond Plateau. The basin, a result of regional extension of the earth's crustand block faulting during the Tertiary period (Carey, 1947; Matthews, 1974 and 1983)comprises Tertiary sediments incised by streams and rivers creating a system of relict landsurfaces, terraces and flood plains. These sediments are predominantly lacustrine in origin andcover extensive areas of the survey area.
In the south-west of the survey area, Macquarie Tier and Jacobs Sugar Loaf rise to over 500m and form the foothills of the Great Western Tiers which themselves rise to over 1200 mwithin the study area at Millers Bluff. Outcrops of Permian and Triassic sediments can befound below the dolerite capping of the Tiers and alluvial fan deposits are common in thisarea. As well, the Permian sediments are prone to slumping and minor landslips are oftenobserved where Permian rocks occur at or near the surface. Despite the suggestion of Nicolls(1958) to the contrary, extensive glaciation is not believed to have occurred within theLaunceston Basin since Tertiary times. However, glaciation was extensive on the CentralPlateau and remnants of glacial deposits, nowhere extensive, can be found along the marginsof the Launceston basin (Hannan, 1993).
Around Campbell Town are a series of undulating low hills rising to 328 m (Mt Augusta) butmore generally at 200-250 m and formed predominantly of outcrops of dolerite and basaltlava flows. North of the Tiers a ridge of resistant dolerite (Hummocky Hills and Dicks Banks)rises to 478 m. In the north-east corner of the map dolerite capped hills form the foothills ofthe Ben Lomond Plateau with altitudes reaching 699 m at Castle Hill. A further outcrop ofdolerite is to be found at Mt Arnon (314 m), to the north of Longford, which is associatedwith other dolerite hills immediately north of the survey area and forms the northern marginof the Launceston basin.
As discussed above, the basin sediments comprise Tertiary clays, sands and gravels whichhave become eroded and incised to form a sequence of erosion surfaces and river terraces.The terraces grade with distance up stream and have approximately the same grade as theexisting river systems. This lends further evidence to the suggestion that the terraces havealluvial origins - the implication being that river gradients have not changed appreciably inthis area for many millions of years. To the north of Evandale the old lake bed sediments havebeen deeply dissected by Rose Rivulet and its tributaries. Again a series of minor terraces canbe identified in the area reflecting fluctuating sea levels. Minor landslips are a feature of manyof the steeper valley sides and landslip processes continue to be active in the area and are animportant consideration in the evaluation of land capability in the area.
The Brickendon Terrace is found at the next level down from the Woodstock. Like theWoodstock it is graded to a stream profile, cuts across Tertiary Basin sediments andincorporates much reworked material, particularly waterworn quartz gravels. Both theWoodstock and Brickendon Terraces have undergone varying degrees of laterisation duringlate Tertiary or early Quaternary times and ironstone gravels are a common featureparticularly of the Woodstock terrace.
29
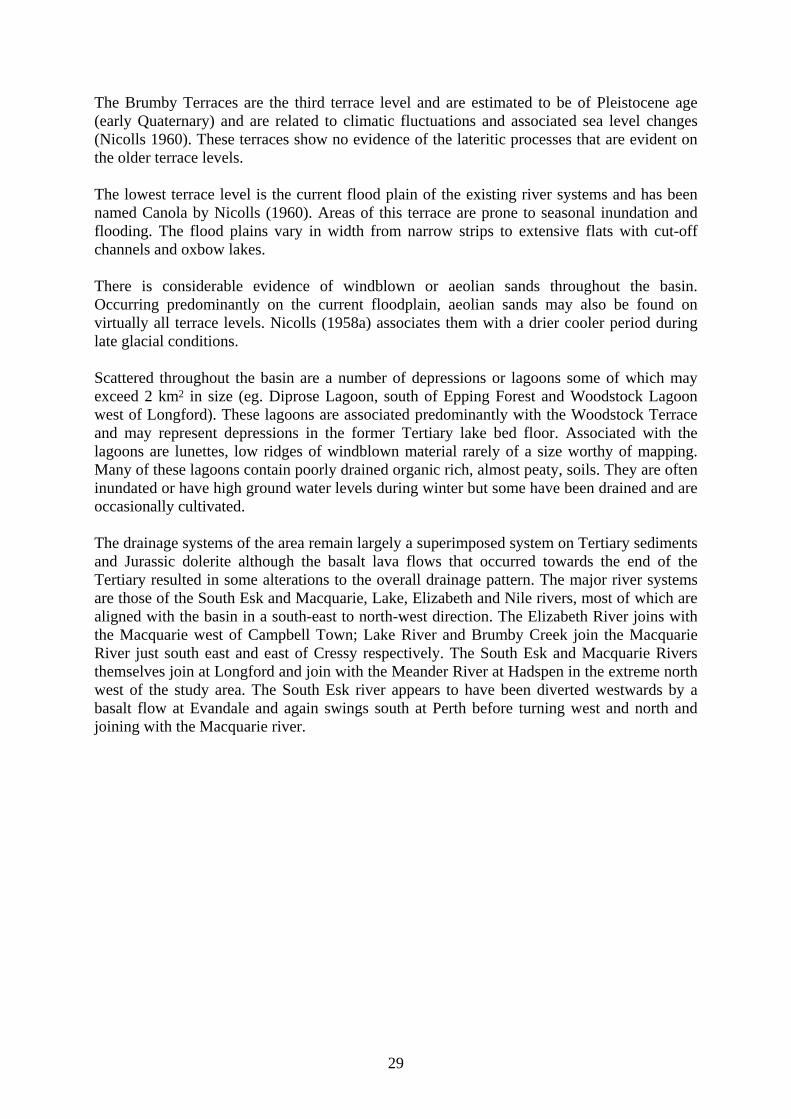
The Brumby Terraces are the third terrace level and are estimated to be of Pleistocene age(early Quaternary) and are related to climatic fluctuations and associated sea level changes(Nicolls 1960). These terraces show no evidence of the lateritic processes that are evident onthe older terrace levels.
The lowest terrace level is the current flood plain of the existing river systems and has beennamed Canola by Nicolls (1960). Areas of this terrace are prone to seasonal inundation andflooding. The flood plains vary in width from narrow strips to extensive flats with cut-offchannels and oxbow lakes.
There is considerable evidence of windblown or aeolian sands throughout the basin.Occurring predominantly on the current floodplain, aeolian sands may also be found onvirtually all terrace levels. Nicolls (1958a) associates them with a drier cooler period duringlate glacial conditions.
Scattered throughout the basin are a number of depressions or lagoons some of which mayexceed 2 km2 in size (eg. Diprose Lagoon, south of Epping Forest and Woodstock Lagoonwest of Longford). These lagoons are associated predominantly with the Woodstock Terraceand may represent depressions in the former Tertiary lake bed floor. Associated with thelagoons are lunettes, low ridges of windblown material rarely of a size worthy of mapping.Many of these lagoons contain poorly drained organic rich, almost peaty, soils. They are ofteninundated or have high ground water levels during winter but some have been drained and areoccasionally cultivated.
The drainage systems of the area remain largely a superimposed system on Tertiary sedimentsand Jurassic dolerite although the basalt lava flows that occurred towards the end of theTertiary resulted in some alterations to the overall drainage pattern. The major river systemsare those of the South Esk and Macquarie, Lake, Elizabeth and Nile rivers, most of which arealigned with the basin in a south-east to north-west direction. The Elizabeth River joins withthe Macquarie west of Campbell Town; Lake River and Brumby Creek join the MacquarieRiver just south east and east of Cressy respectively. The South Esk and Macquarie Riversthemselves join at Longford and join with the Meander River at Hadspen in the extreme northwest of the study area. The South Esk river appears to have been diverted westwards by abasalt flow at Evandale and again swings south at Perth before turning west and north andjoining with the Macquarie river.

30
Photo 3. View of Terrace flats and Ben Lomond Foothills from Pleasant BanksTown of Evandale in middle distance. (Grid Ref. E 519100, N 5395600)
Photo 4. Brumby Terrace rising to the Brickendon Terrace in middle distance.(Grid Ref. E 518100, N 5394000)

31
To the North of Evandale the old lake bed sediments have been deeply dissected by RoseRivulet and its tributaries. Again a series of minor terraces can be identified in the areareflecting fluctuating sea levels. Minor landslips are a feature of many of the steeper valleysides and landslip processes continue to be active and are an important consideration in theevaluation of land capability in the area.
5.5 Soils
The soils of the South Esk 1:100 000 map area have been previously described by Nicolls(1958b) and Doyle (1993). Also, an area covering Macquarie Estates, south of the junction ofLake and Macquarie rivers was mapped by CSIRO (Hubble, 1947, unpublished) and theCressy Longford area by Stephens et al (1942). The soil maps that accompany the morerecent reports (Nicolls and Doyle) have been relied upon heavily during the preparation ofthis land capability report and many land capability boundaries coincide with soil boundaries.Map units in these publications correspond to soil associations - that is, they are complexunits containing several soil types that generally occur in a regular pattern and containing asingle, defined, dominant (>60%) soil type. However, neither publication discusses the moreminor soil types in a great detail and, as the capability of some minor soil types can varysignificantly from the dominant soil type, this will lead to some local discrepancies in landcapability evaluation.
The soils of the area show considerable complexity - a result not only of the generalcomplexity of the parent materials but also of the soil forming processes involved.Identification of different soil types may be assisted by relating soil type to the landform inwhich it occurs. Three major landform categories can be identified within the study area andthe soils associated with each are described below.
5.5.1 Upland areas of the Great Western Tiers and Ben Lomond foothills
This region includes the Great Western Tiers and the higher areas of the Ben Lomondfoothills. Significant parts of this region lie within forest reserves and thus outside the scopeof this report. Remaining areas are dominated by soils developed on dolerite, scree slopes andsolifluction material. The major limitations for land use are shallow, stony soils, steep terrainand cool, wet climate. The soils in these areas are mapped as Deddington by Nicolls,particularly hill areas around Deddington and Blessington; and as M1 and Eastfield soils inthe Great Western Tiers by Doyle. Soil profiles tend to be relatively leached, are very variablein depth and contain rocks and stones varying from the occasional 'floater' to profilesdominated by large rocks. Soil depth varies from very shallow with extensive areas of surfacerock to deeper profiles which could have some agricultural value. The majority of these soilsremain under forest or occasional pasture. The soil types occupy upland areas throughout themap sheet, particularly Hummocky Hills, Great Western Tiers, Jacobs Sugar Loaf and theDeddington/Blessington area..
5.5.2 Foothills and lower slopes
This region includes the lower footslopes of the Great Western Tiers, including Little Billop,O'Connors Peak, lower slopes below Millers Bluff, Jacobs Sugarloaf and the Macquarie Tier,Temple Hill, Castle Bar and The Retreat. Soils of the region are a mixture of gradational andduplex profiles developed on dolerite, Permian and Triassic sediments and includeDeddington and Eastfield associations, MEa, M2, Millers, Quamby, Blessington and Glenassociations. Small outcrops of Arnon association have been mapped by Nicolls on theLongford sheet to the north of Perth and some 8 km east of Evandale.
32
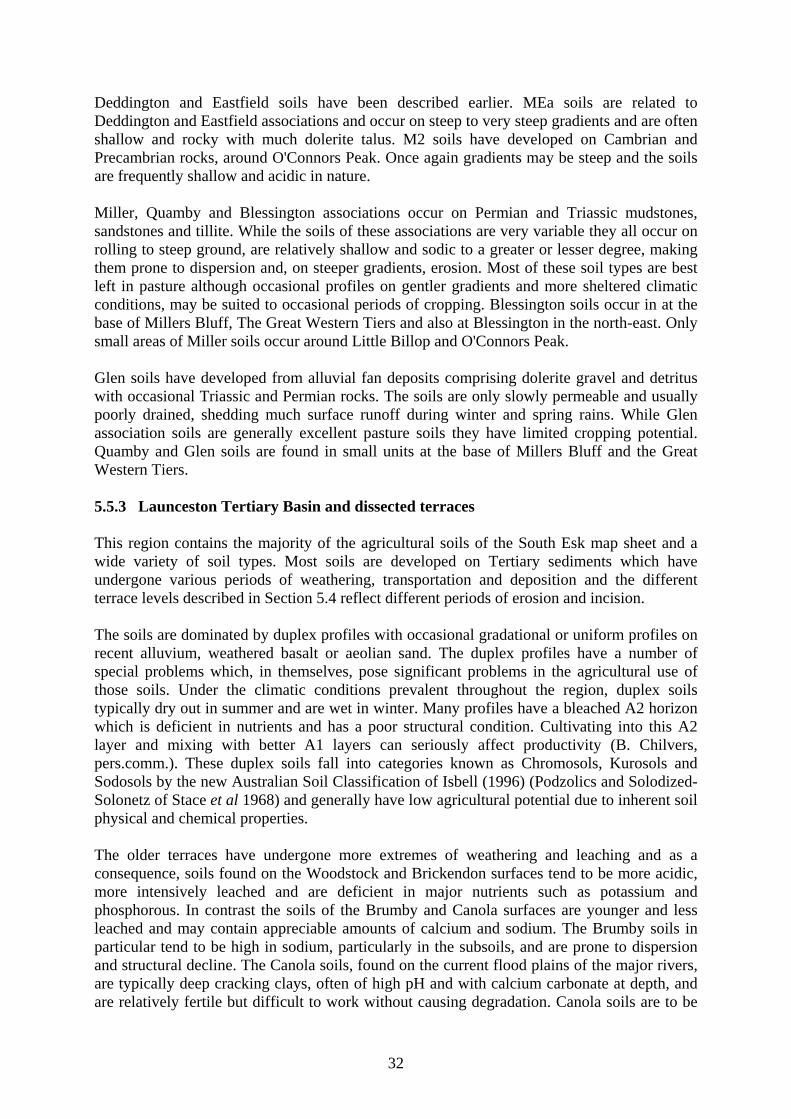
Deddington and Eastfield soils have been described earlier. MEa soils are related toDeddington and Eastfield associations and occur on steep to very steep gradients and are oftenshallow and rocky with much dolerite talus. M2 soils have developed on Cambrian andPrecambrian rocks, around O'Connors Peak. Once again gradients may be steep and the soilsare frequently shallow and acidic in nature.
Miller, Quamby and Blessington associations occur on Permian and Triassic mudstones,sandstones and tillite. While the soils of these associations are very variable they all occur onrolling to steep ground, are relatively shallow and sodic to a greater or lesser degree, makingthem prone to dispersion and, on steeper gradients, erosion. Most of these soil types are bestleft in pasture although occasional profiles on gentler gradients and more sheltered climaticconditions, may be suited to occasional periods of cropping. Blessington soils occur in at thebase of Millers Bluff, The Great Western Tiers and also at Blessington in the north-east. Onlysmall areas of Miller soils occur around Little Billop and O'Connors Peak.
Glen soils have developed from alluvial fan deposits comprising dolerite gravel and detrituswith occasional Triassic and Permian rocks. The soils are only slowly permeable and usuallypoorly drained, shedding much surface runoff during winter and spring rains. While Glenassociation soils are generally excellent pasture soils they have limited cropping potential.Quamby and Glen soils are found in small units at the base of Millers Bluff and the GreatWestern Tiers.
5.5.3 Launceston Tertiary Basin and dissected terraces
This region contains the majority of the agricultural soils of the South Esk map sheet and awide variety of soil types. Most soils are developed on Tertiary sediments which haveundergone various periods of weathering, transportation and deposition and the differentterrace levels described in Section 5.4 reflect different periods of erosion and incision.
The soils are dominated by duplex profiles with occasional gradational or uniform profiles onrecent alluvium, weathered basalt or aeolian sand. The duplex profiles have a number ofspecial problems which, in themselves, pose significant problems in the agricultural use ofthose soils. Under the climatic conditions prevalent throughout the region, duplex soilstypically dry out in summer and are wet in winter. Many profiles have a bleached A2 horizonwhich is deficient in nutrients and has a poor structural condition. Cultivating into this A2layer and mixing with better A1 layers can seriously affect productivity (B. Chilvers,pers.comm.). These duplex soils fall into categories known as Chromosols, Kurosols andSodosols by the new Australian Soil Classification of Isbell (1996) (Podzolics and Solodized-Solonetz of Stace et al 1968) and generally have low agricultural potential due to inherent soilphysical and chemical properties.
The older terraces have undergone more extremes of weathering and leaching and as aconsequence, soils found on the Woodstock and Brickendon surfaces tend to be more acidic,more intensively leached and are deficient in major nutrients such as potassium andphosphorous. In contrast the soils of the Brumby and Canola surfaces are younger and lessleached and may contain appreciable amounts of calcium and sodium. The Brumby soils inparticular tend to be high in sodium, particularly in the subsoils, and are prone to dispersionand structural decline. The Canola soils, found on the current flood plains of the major rivers,are typically deep cracking clays, often of high pH and with calcium carbonate at depth, andare relatively fertile but difficult to work without causing degradation. Canola soils are to be

33
found along the current flood plain of most of the major rivers and extensive areas of Brumbyoccur along Poatina Road and at Symmons Plains.
Nile Association soils are similar to those of the Brumby Association with which they arecontiguous. Within the survey area the soils are confined to the terraces of the Nile River andare of limited extent. Nile soils differ from Brumby soils in that they contain varying amountsof waterworn dolerite stones and gravel.
Soils on the Woodstock and Brickendon surfaces have undergone variable intensities oflaterisation whereby there has been significant leaching of iron and aluminium from the uppersoil horizons and a corresponding accumulation lower in the profile usually in the form of"ironstone" gravels. In some areas these gravels may form a discontinuous cemented sheetwhich is a hindrance to root penetration and reduces moisture availability. Laterisation hasalso occurred on basalt and dolerite rock types but subsequent erosion has resulted in onlyremnants remaining. These soils belong to the Kurosols, Chromosols and Sodosols of theIsbell classification (lateritic podzols of Stace). Areas of Woodstock and Brickendon soilsoccur throughout the survey area. An extensive area of Woodstock can be found along theMidlands Highway from Epping Forest to Conara and a similar area of Brickendon occursbetween the Lake river and the Midland Highway.
Other soil types identified in association with the terraces include the Newham, occurring ongentle gradients between the Brickendon and the Brumby; and Macquarie which is found onthe Brickendon surface but differs from the Brickendon soils in the greater proportion offerruginous gravels. Newham soils occur in generally small areas scattered throughout thewestern half of the survey area. Macquarie soils are found in association with Brickendonsoils along Macquarie and Barton roads.
Windblown sands have been identified on all terrace levels and where they are greater thanabout 75 cm deep have been classified as Panshanger sands. These soils have severe erosionproblems, even on relatively gentle gradients where wind may be the main erosive agent.Elsewhere windblown sands may form a shallow cover over other soil types making themmore prone to erosion. Eroded dune remnants have been classified as Tara soils where sandyor loamy topsoils of aeolian origin overlie heavier sub soils. These soils may also be at riskfrom erosion but also have many problems associated with other duplex soils. Panshangersoils are found throughout the survey area but particularly along Mount Joy road and ValleyField road where they are found in association with Bloomfield, Eastfield, Canola andBrumby soils.

34
Figure 11. Stylised south-west cross-section from west of Nile to Blessington area.

35
Figure 12. Stylised south-north cross-section from Little Billop to west of Longford.

36
Figure 13. Stylised west-east cross-section from Macquarie Tier to Campbell Town

37
The Cressy soils and associated Kinburn soils are classified as Ferrosols andDermosols by the Isbell system (lateritic podzolics by Stace). The soils of theassociations are somewhat variable in appearance but the majority are gradationalreddish brown to grey brown friable clays with a reasonable developed structure.Kinburn soils, due to their lower position in the landscape, are normally poorlydrained. Both profiles may contain variable amounts of ironstone shale or gravels.Cressy soils are found at the margins of the Woodstock terrace and are some of thebest soils in the area. The Cressy soils have been favourably compared to otherferrosols of the north-west areas but are less resilient and more susceptible tostructural decline if over cultivated. These soils have been used intensively in postwar periods and many have been significantly degraded as a result. Extensive areas ofCressy soils are to be found south and west of Cressy, with Kinburn soils inintervening drainage lines.
To the north of Evandale and around White Hills is an area defined by Nicolls asbeing Relbia Association. This association appears to contain an even wider range ofsoil types than is reasonable for a reconnaissance soil map. Relbia association soilsoccur on a range of terrace levels and boulders of massive laterite may occur at anylevel. Soils similar to the Brumby, Woodstock and Panshanger soils have all beenmapped within the Relbia Association. At higher altitudes within the association soilsresembling the Cressy soils have been identified. Landslips are a feature of Relbiasoils on many steeper valley sides.
In some southern and eastern parts of the survey area remnants of basalt lava flowsoccur. The soils that have developed here, Breadalbane and Campbell Town soils,tend to be more fertile and less acidic than elsewhere and have been generallyclassified as Dermosols, Chromosols or Ferrosols (brown and red earths by Stace).However, these soils are generally considered to be inferior to Ferrosols identified inmore northern parts of the State and also have severe climatic limitations foragricultural development. Examples of these soil types are most prevalent aroundCampbell Town in the south-east of the survey area.
Stylised cross sections through the survey area are presented as Figs 11, 12 and 13.While providing an incite to the landforms of the survey area the diagrams alsoindicate the relationships between geology, soil, landform and capability.
5.6 Vegetation
The vegetation of the study area has been described by Kirkpatrick and Dickinson(1984) and a summary only is presented here.
Remnant vegetation is confined to upland areas of the Central Plateau and GreatWestern Tiers in the south-east and the foot hills of Ben Lomond in the north-west.Much of this land is owned or leased by Forestry Tasmania or private forestryconcerns and is farmed for woodchips and other timber products.
Other small areas of forest occur on privately owned land in lower lying areas,particularly where the soils are more acid and nutrient poor. Such areas occur oftenon Woodstock soils around Epping Forest and Conara.

38
Kirkpatrick and Dickinson identify the dominant tree species as E. viminalis, E.ovata (Black or Swamp Gum), E. pauciflora and E. amygdalina. The forests arerelatively open in nature with an understorey of shrubs, tussock or pasture. At higherelevations dry sclerophyll forest continues to dominate but with E. delagatensis. E.dalrympeana and E. rodwayi taking dominance. Small areas of wet sclerophyll forestwith E. obliqua also occur.
5.7 Land Use
The majority of lowland areas have been extensively cleared for agriculture and landuse is dominated by grazing for sheep, fat lamb production and cattle on improvedpastures. Natural pasture remains on hilly areas or areas of shallow or stony soils oras ground cover in some open forest areas. These latter areas are used for roughgrazing with very low stocking rates despite often having a very high proportion ofsurface stone or rock. Timber extraction, either for firewood or on a more commercialbasis, is an additional enterprise in some of these areas. Cereal cropping is undertakenon most properties on an occasional basis in rotation with pasture or a legume. Otheragricultural activities include deer and goat farming and the cropping of oats turnipsand peas as fodder crops with additional cash cropping of oats, wheat, malting barley,peas and triticale on a regular basis.
Within the Cressy-Longford area irrigation water is available from hydro electricsupplies. This water has been channelled through a number of open ditches to manyareas north of Cressy and west of Longford (see also Fig. 6. for irrigation schemeboundary). This reliable source of water has led to many farmers using their landmore intensively, particularly where Cressy soils occur, and the area has seenincreased production of potatoes poppies, peas, beans and a wide range ofhorticultural crops. The impact of these activities on the various soil types is cause forconcern as little is known as to how the soils will respond to this more intensivecultivation. In other areas, irrigation water is being pumped straight from rivers andapplied to duplex soils. Chilvers (pers. comm.) has expressed much concern regardingthe application of irrigation to duplex soils due to the drainage and sodicity problemsoften associated with them. Top level management is required to prevent degradationof these soils under irrigation.
Also, the approach in the past has been to transfer farming systems from other areasof the State which have quite different soils to these generally more fragile areas.While such techniques may have been appropriate for soils like the Ferrososls theyare often inappropriate for the Chromosols and Kurosols soils found within the SouthEsk survey area with the result that soil degradation has occurred. As general farmerand community awareness increases many of these techniques are being replaced bymore suitable ones.

39
6. SOIL MANAGEMENT OPTIONS FOR SUSTAINABLEAGRICULTURE
by Bill Chilvers, Soil Management Officer, DPIF
Occurring within the survey area are a wide range of soil types the distribution andcomplexity of which are beyond the focus of this report. However, each soil type hasdifferent properties and consequently is suitable for different forms of land use. Alsoeach soil type has different management requirements if it is to be used in asustainable manner and without degradation. Fortunately it is possible to identifyeach soil type in the area with one of the soil management groups listed below. Thefollowing information is provided to assist farmers with the management of thesesoils but further information should be sort from Chilvers (1996).
6.1 Soil Management Groups
Black cracking clay soils
The major characteristic of these soils is their self mulching ability (the formation of asurface tilth comprising 0.5-1.0 cm aggregates created by repeated cycles ofshrink/swell activity). The key to long term successful management lies in promotingand using the self mulch seedbed rather than forcing the seedbed by intensive tillage.Tillage and stocking at high moisture contents on these soils rapidly destroys the selfmulching characteristic and forms clods with very high soil strength. Stocking ofwinter forage crops, most commonly oats, is highly detrimental to the structure ofthese soils. Growing a dryland cereal in between years of irrigated crops will promotedeep cracking and self mulching structural rejuvenation.
These soils often occur on current flood plains and are often difficult to work beingeither too wet or too dry. Drainage is critical in avoiding wet tillage operations. Installbroad, shallow surface drains that use the topography by linking hollows andfollowing drainage lines. Alluvial black cracking clays may be suited to molechannels and subsurface drainage where cropping is more intensive.
Cressy Clay Loams and Kinburn Association Soils
These soils are less well drained and structurally less resilient than the Krasnozemsoils of the NW Coast. Structural decline, seen as clods and hardpans, is a majorchallenge as cropping becomes more intensive. Wet tillage, stocking winter foragecrops and wet harvests are key things to avoid. Ensure all tillage operations arecarried out at the friable moisture content.
These soils, particularly the Kinburn occurring along drainage lines, are suitable forsubsurface and mole drainage. However, most drainage can be achieved with surfacedrains. Some Cressy soils have highly permeable gravel layers at depth, making deepsurface ditches very effective.

40
Duplex soils (sandy loam over clay)
These are the most common soils in the Midlands region and comprise soils with anabrupt texture change - sand over clay loam or sandy loam over clay for example.Paddock variability, wind erosion, waterlogging in the hollows and decline of organicmatter levels are the major challenges of these soils under cropping. Direct drillingand/or shallow topworking with tines and discs are the best management options. Thechisel plough and s-tine are good implements. Mouldboard plough only where thereis no risk of wind erosion. Do not plough shallow duplex soils. Gradual mixing ofsubsoil with the topsoil has been a common practice to deepen topsoils. However, thesubsoil is of very low fertility, highly acidic, and structurally unstable whichdramatically lowers the quality of your topsoil if mixed with it. The weak structure ofduplex soils is easily destroyed by overworking. Powered implements should beavoided if possible, or used shallowly with great care. Deep ripping into the palesubsoil layer or underlying clay is not recommended. The unstable structure and poorfertility of these layers mean benefits are very short lived and in some cases tunnelerosion can be initiated.
Drainage options are very limited for these soils. Broad, shallow surface drains thatlink hollows and use the topography will be most effective. Think carefully aboutplanting layout to promote drainage down slope. Do not plant irrigated crops,especially potatoes, through these hollows. Subsurface drains following hollows ordrainage lines are an option where cropping is more intensive. Mole drains are notappropriate and carry a high risk of failure.
Deep sands
The prevention of wind erosion is the key to managing these soils under cropping.Never mouldboard plough sandy soils. Direct drilling is an essential tool forsustainable cropping of these soils. Establish shelter belts and use cover cropswherever possible. Shallow topworking with tines and discs, ensuring at least a 30%cover of coarse organic material remains on the surface, should be the most intensivetillage these soils receive.

41
7. SOIL SALINITY IN THE SOUTH ESK MAP SHEETby Julie Finnigan Salinity Officer, DPIF
7.1 Introduction
The occurrence of salt affected land in Tasmania is not as widespread as in manymainland states but it is of significant concern to some farmers including those inparts of the South Esk area. Soil salinity is a serious form of land degradationaffecting millions of hectares of agricultural land Australia wide and about 20 000 haacross Tasmania (Grice 1995, Working Party on Dryland Salting in Tasmania 1982).
Naturally occurring saline soils are located in several coastal areas of the state.However, man induced salinity, often referred to as secondary salinity, dominates ininland agricultural areas of Tasmania. This form of salinity is widely considered adirect result of land clearing which leads to reduced water uptake by vegetation andincreased recharge to the groundwater system, causing a rise of possibly salinegroundwater levels. Within the South Esk survey area there are many examples ofsoil salinity including Chintah Rd near the junction with Powranna Rd, Maitland Rdnorth-west of Cressy, Cressy Rd at Woodlands Corner, and Macquarie Rd near thejunction with Delmont Rd. While these areas are often too small to map at 1:100 000scale it is appropriate to include some discussion on this important issue here.
7.1.1 Causes of Salinity
Salts are a natural component of many soils and result from the physical and chemicalweathering of rocks and sediments, and also through deposition by wind and in rain.The salts most commonly found affecting soils in Tasmania are sodium chloride(common table salt), magnesium chloride and calcium chloride (Hoare pers.comm.).These salts have accumulated in our soils over a great period of time mainly throughdeposition in rainfall (Walker 1995).
Prior to European settlement, the occurrence of salt in the ground had reached a pointof stable equilibrium with the natural environment. Since then however, widespreadland clearing and the introduction of agricultural practices has created major changesto our delicate ecosystem. Such changes have resulted in significant alterations to thenatural water balance, leading to noticeable rises in groundwater levels. Asgroundwater rises it has the potential to mobilise and carry soluble salts present in thesoil profile towards the ground surface. Once rising groundwater reaches a criticaldepth of approximately 3 meters, capillary rise and evaporation can occur, leading tothe concentration of salts at the soil surface. This concentration of salts affects thegrowth and productivity of plants, and often leads to erosion and other serious formsof land degradation through the dispersive effects of the salt.
7.1.2 The impact of Irrigation Water
While scattered areas of saline land have been identified throughout much of theSouth Esk survey area they are typically isolated occurrences and of very limitedextent. With the increased use of irrigation water, either by direct pumping from themajor river systems or within the Cressy-Longford Irrigation Scheme, there exists

42
increased potential for recharge to the groundwater system by excess irrigation water.Areas using flood irrigation have the greatest recharge potential and thus are possiblyat greatest from salinity. However, any area where irrigation has become a normalpart of farming practice is at risk (Walker 1995).
The Cressy-Longford Irrigation Scheme itself covers 10,200 hectares of agriculturalland located in the north-west of the South Esk map sheet. Salinity assessment withinthis scheme has identified that 12.1% of the total scheme area has soils affected bysalinity within a depth of 6 m of the ground surface (Finnigan 1995). Occurrences ofsurface soil salinity do occur but are generally small in area, and typically located indrainage lines and topographic lows.
Where mid slope seepages occur, for example where the flow of groundwater isobstructed and diverted by an impermeable subsurface layer, evaporation can lead toa surface build-up of salt. Soil types identified as most prone to this problem includethe Brumby soils on the lower river terraces, while other areas of salinity have alsobeen identified on Newham and Brickendon soils. Modern flood plains tend to exhibitvariable salinity levels due to periodical flushing of salts from the soils during timesof flood. According to Nulsen (1995), careful management of our soils, appropriatedrainage and efficient irrigation practices are essential to maintain groundwaterlevels, and therefore salt stored in the soil profile, at a safe depth (below 3 m).
Photo 5. The occurrence of salt in drainage lines is evident in some parts of the survey area,Macquarie Road. (Grid Ref. E 515800, N 5370900)
43
Within the Cressy-Longford Scheme the majority of soils identified as saline (basedon apparent conductivity levels) fall within the Low-Moderate category, rangingbetween 1 and 1.5 dS/m. Thirty percent of soils are classed as High, falling between1.5 and 2.0 dS/m, and less than 1% of soils are classed as Severe, possessingconductivity levels in excess of 2.0 dS/m. For comparative purposes, sea water has aconductivity level of 54.7 dS/m. Soils moderately affected by salinity may not showany surface evidence, but may produce significantly reduced yields.
Areas of surface salting are easily identified by the presence of salt tolerant 'indicatorspecies'. In areas of Low to Moderate soil salinity, yellowing of foliage, tree declineand reductions in plant growth and vigour (most noticeable under croppingconditions) are common. In areas of High soil salinity the presence of Buck's HornPlantain (Plantago coronopus) and Sea Barley Grass (Hordeum marinum) are mostcommon. Coastal Sand Spurrey (Spergularia media), Australian Salt Grass andAnnual Beard Grass are also known to occur. In areas of Severe salting, WaterButtons (Cotula coronopifolia) are commonly found, combined with the presence ofbare patches of soil showing dampness in winter and crusting in summer.
The occurrence of salinity in other areas of the South Esk Map Sheet appear to followsimilar patterns and processes to those discussed in the Cressy/Longford IrrigationScheme. Visible evidence of salting can be seen along a number of sections of theMidland Highway, and further west in the Macquarie Settlement. These saline areaswere evident more than 50 years ago, occurring typically as dryland salinity. In morerecent years however, small scale irrigation has been introduced to these areas,resulting in noticeable minor increases in the extent and severity of salinity. Salinestream flow has also been identified north of Evandale in the tributaries of RoseRivulet. As well, many dams within the Cressy-Longford Irrigation Scheme haverecorded quite high conductivity levels (up to 18 dS/m), although this may varysignificantly according to seasonal fluctuations.
The Resource Assessment Branch of the Department of Primary Industry andFisheries is currently conducting soil and water salinity studies in various parts of theState including the Cressy-Longford area and Northern Midlands. This assessmentwork has provided us with a good general understanding of the salinity levels andprocesses occurring within the study areas. However, it has also highlighted what wedon't know, and the areas in which future research and monitoring should be directed.Given the relatively short period of assessment it is very difficult to determine trendsin the extent and severity of salinity. It is possible that with increased irrigation andlittle thought behind adequate drainage or appropriate irrigation scheduling, thatsalinity problems could increase.
7.1.3 Management of Salinity
Australian research into salinity first began in the 1950's, and has since covered allareas of assessment and management at both local and national scales (Ockerby1995). As a result of this work, the implementation of management practices in selectmainland areas has now enabled the productive use of once unproductive saline land.There are many techniques and management practices that can be applied to helpcontrol and improve salt affected soils and water. Firstly, discharge areas displayingthe symptoms of high salt levels should be fenced off from all stock, or at least

44
stocked at much lighter rates. This helps to minimise the impact of stress on anyexisting plant cover, and reduces the levels of soil compaction which prevents thesuccessful establishment and growth of plants. Remnant vegetation stands should bemaintained and, where possible, deep rooted trees and shrubs planted in strategic midand upper slope areas. This tree cover ultimately helps to reduce groundwaterrecharge by intercepting and utilising rainfall before it can access the groundwater.Tree establishment also provides other benefits such as shelter for stock andminimising the impact of wind erosion.
Sowing deep rooted perennial pastures and high water using winter crops in mid andupper slope positions also helps to utilise rainfall and decrease accessions to thegroundwater. Recommended perennial pastures include Cocksfoot (Dactylisglomerata), Phalaris (Phalaris aquatica) and Lucerne (Medicago sativa). Oats,Barley and Tama Rye Grass are recommended winter crops which are high waterusing. In highly saline discharge areas salt tolerant grasses and clovers can also beplanted. Tall Wheat Grass (Agropyron elongatum) and Puccinellia (Puccinelliaciliata) are suited to areas of severe salinity, and Tall Fescue (Festuca arundinacea)and Strawberry Clover (Trifolium fragiferum), are well suited to areas of moderatesalinity.
The installation of appropriate drainage is essential in order to divert or removeexcess water from waterlogged sites. Poorly drained soils are usually less productivedue to decreases in oxygen, nitrogen and other soluble plant foods. The accumulationof salts in the soil surface compounds this problem. Adequate drainage can thereforealleviate this problem and help to leach salts from the soil surface. Extended fallowperiods should also be avoided if possible. With lack of vegetative ground cover,groundwater accession is increased and higher levels of evaporation occur resulting inincreased levels of salinity. Once again the need for accurate irrigation scheduling isessential to the successful management of salinity, combined with local knowledge ofgroundwater conditions on your property. Sprinkler irrigation is far less wasteful ofwater than flood irrigation and it should be recognised that some soils are just notsuited to irrigation.
Although these management options have been trialed and proven beneficial invarious states on the mainland, little management has yet been applied in Tasmania.Essentially the reason for this is that we still need to know much more about theprocesses controlling salinity at local, catchment and regional scales before successfulmanagement practices can be applied. The Department of Primary Industry andFisheries, jointly funded by the National Landcare Program, is continuing with soiland water salinity assessment and monitoring in Tasmania with the aim of improvingour knowledge of the processes that control the spread of salinity. Future research,combined with improved community education and participation, will hopefullyincrease the awareness of farmers and the public in general to this issue and helpprevent further degradation of our the soils by salt.

45
8. LAND CAPABILITY CLASSES ON THE SOUTH ESKMAP
The following sections of this report describe the different classes of land that havebeen identified during the course of the survey. General information on the nature ofthe land, soil type and geology are given together with an assessment of the majorlimiting factor and any other information that is considered relevant. Additionalinformation, including a summary of land capability sites recorded, is presented in thevarious appendices.
In undertaking the field mapping considerable reliance has been placed on theavailable soil information and location of soil boundaries. This applies particularly tothe southern half of the map where far fewer observation sites have been recorded asis indicated by Fig. 2 (page 9). It should be noted that soils have been mapped asassociations (ie. a complex of more than one soil type) but map units have frequentlybeen considered to be uniform when evaluated for land capability.
Throughout the text references are made to subclass codes. While sub-classes do notappear on the map they are used in the text to give the reader further informationrelating to the nature of limitations in some areas. Also, for each class of land asimple diagram is presented indicating the distribution of that land class across themap together with the hectares each occupies. These figures include areas of complexmap units. When determining the extent of a particular land class it should beremembered that these complexes represent a ratio of the two land classes identifiedin the range 60-40 to 50-50 (ie Class 4+5 represents an area of 50-60% Class 4 landplus 40-50% Class 5 land).
Table 1, presented at the beginning of this report, summarises the extent of each ofthe land classes identified within the survey area.
8.1 CLASS 1 AND 2 LAND
No Class 1 and 2 land has been identified in the South Esk survey area. Poor soilconditions and low fertility, moderate to high erosion risk and areas of undulating tosteep terrain restrict land to Class 3 and below.

46
8.2 CLASS 3 LAND
Class 3 8 663 ha
Class 3 Land on Unconsolidated Tertiary Sediments
Areas of Class 3 land on unconsolidated sediments areconfined to north-western parts of the survey area. It occurson gently inclined erosion surfaces west of the Lake andSouth Esk Rivers, around Armstrongs Lane, BishopsbourneRoad, Saundridge Road, Green Rises Road and generallyadjacent to the Cressy Main Road. A small area of Class 3land is identified near White Hills. Class 3 land representsthe best land to be found on the South Esk map sheet and issuitable for a more intensive cropping cycle than other landin the area.
Class 3 land is associated with Cressy Shaley Clay Loams, except at White Hillswhere it is found on some soils of the Relbia Association. Topography is typicallyvery gently sloping to undulating and often associated with eroded remnants of theWoodstock Terrace to the west and north of Cressy. Slopes rarely exceed 10-12% andsoil erosion is not a significant problem. The soils generally are slowly permeableand, where topography is almost level, open ditches will help remove surface water.The major limitation to agricultural production on Class 3 land within the South Eskarea is the risk of soil structure decline resulting from over intensive use. If the land isover used the soils become prone to surface crusting, subsurface compaction andcloddy soils leading to poor seed bed conditions. Erosion can be a problem on thesedegraded soils on rare instances where gradients exceed about 18%. Rainfall in thisarea is around 700 mm p.a. or below and is at the limit for land to be considered Class3. Overall, however, climate is not considered to be a major limiting factor for Class 3land on the south Esk map.
Historically many areas of Class 3 land have been subject to intensive land use andthere is some evidence that degradation has occurred. The development of irrigationpractices in the area has led to further intensification and significantly improvedyields but also to increased risk of degradation. Careful management is still necessaryto maintain soils in this capability class in the best condition. Compacted, cloddy soilsare to be found in some areas and will require years of attention to return them to aClass 3 condition. Today, a wide range of crops are grown on this land, mostly underirrigation. Cereals, potatoes, poppies, peas plus small areas of other horticulturalcrops are grown in rotation with pasture.

47
Photo 6. Class 3 land. Cressy soils under irrigation at Green Rises Road(Grid Ref. E 504000, N 5386700)
Photo 7. Class 4 land on basaltic soils north of Campbell Town.(Grid Ref. E 539500, N 5360000)

48
8.3 CLASS 4 LAND
Class 4 117 320 haClass 4+5 5 063 haClass 5+4 2 170 ha
Class 4 land is the dominant land class found on the SouthEsk map. It is widespread through central areas where itoccurs on the Tertiary sediments of the Launceston Basin.Limitations range from poor soil conditions to wetness anderosion. Besides the Tertiary sediments, Class 4 land can befound on a wide range of other parent materials includingbasalt, dolerite and alluvium.
Class 4 Land on Basalt
Scattered outcrops of basaltic lava occur in northern and eastern parts of the surveyarea. Specifically, Class 4 land on Basalt has been identified at Breadalbane nearLaunceston Airport, on Nile Road south of Nile; between Epping Forest and SouthEsk River; and extensive areas between Conara and Campbell Town.
Class 4 land on basalt is associated with deeper phases of the Campbell Town andBreadalbane soil associations, both of which have been described in detail by Doyle(1993). Soil depth is variable but a minimum depth of about 70 cm is considerednecessary for land to be considered Class 4. Breadalbane soils often occur withoutcrops of basalt and basalt floaters throughout the profile which affect ease ofcultivation and crop root development.
Class 4 land on basalt occurs in gently undulating to undulating terrain with the basaltoften forming the ridge crest. Gradients are normally in the range 0-15% butoccasional steeper gradients do occur. In some areas minor landslips have occurred.Where excessive stoniness occurs (30-45% of the soil profile or land surface), orwhere the soil is shallow, a soil limitation (s) is identified. Where Campbell Townand Breadalbane soils occur in low lying depressions and severe or extensive mottlingof the subsoil suggests periods of imperfect drainage, a wetness limitation (w) isidentified and where they occur on gradients between 18-32% an erosion (e)limitation applies.
Class 4 on basalt near Campbell Town occurs in an area where rainfall may be as lowas 550 mm and out of season frosts are common. This area is at the climatic limit ofClass 4 land. However, the lack of soil depth and the general stony nature of the soilare still considered the prime limitations for agricultural use. Land use in the area ispredominantly grazing for sheep and cattle with occasional crops of cereals. Smallareas of irrigated crops or pasture may be found using water pumped directly fromElizabeth River.

49
Class 4 Land on Recent Alluvium
Recent alluvium occurs along many of the river valleys throughout the survey area.The main areas of Class 4 land on alluvium include upper parts of the Lake Rivervalley on Connorville Road; Macquarie, Isis and Nile River valleys; and extensiveareas of the South Esk flood plain. Scattered small areas are found in most otherminor stream valleys and have also been mapped in some shallow basins amongstdolerite hills. Parts of these areas are subject to occasional flooding, the frequency,duration and timing of which have important implications for the ability of that landto grow crops (short-term, mid growing season flooding less likely to be damaging toa crop than early or late growing season inundation). These areas would generally beidentified as Class 4w land if mapped at subclass level.
The soils developed on recent alluvium, normally mapped as the Canola Associationand dominated by the Canola soil series, have significant management problems.Typically the soils are very sticky when wet and dry almost overnight to a very hard consistence, thereby providing only a narrow window when they are at a suitablemoisture content for cultivation. Cultivation outside this window can lead to thedevelopment of subsoil compaction and smearing, and a degraded or cloddy topsoilstructure. As well, the soils may exhibit a gilgai micro-relief (a series of small basin-like depressions and intervening rises), a result of the marked shrink-swell propertiesof the clay minerals, and which can cause additionasl cultivation problems. Thesesoils may also be sodic in some areas and prone to dispersion leading to surfacecrusting and gullying even on gentle gradients. Due to their low position in thelandscape, proximity to creeks and to groundwater tables some Canola soils are proneto salinity. When mapped at subclass level these areas would be Class 4s.
Cropping of this Class 4 land is confined to cereal and forage crops. Occasionalpaddocks of peas or poppies are grown but there is a significant risk of crop loss byflooding or poor soil drainage. Surface drains would greatly assist in the removal ofsurface water. Subsurface hydraulic conductivity is likely to be low and subsurfacedrainage may have little impact or be expensive to implement. There is a significantrisk of soil damage or crop loss on this land without very careful management.
Class 4 Land on Unconsolidated Tertiary Sediments.
Class 4 land on Unconsolidated Tertiary Sediments is the most extensive land type inthe area on which agriculture occurs and is also the most varied with respect to soiltype. Class 4 land on Tertiary sediments can be found throughout the central portionof the survey area where it occurs on level to gently inclined land of former riverterraces and on steeper slopes separating the different terrace levels.
A feature common to most of the Class 4 land on these terraces is the duplex natureof the soil types. Duplex soils have an abrupt texture increase at some depth withinthe soil profile and this has important implications for water movement through thesoil profile. Also, most duplex soils have a bleached A2 layer of variable thicknessand depth between the organic rich A1 layer and the underlying, heavier B horizons.This layer is typically moderately acidic, has poor nutrient levels and often structural

50
Photo 8. Class 4w land on recent alluvium showing the effect of seasonal wetness.(Grid Ref. E 514400, N 5404400)
Photo 9. Class 4s land on Tertiary sediments with Class 5s and 6s on dolerite in the background.(Grid Ref. E 508500, N 5368700)

51
problems. These soil characteristics in their own right restrict the land to capabilityClass 4s, if mapped at subclass level, while other land or soil characteristics, such asgradient, topsoil texture and stoniness, result in some land having a poorerclassification or alternative limitation. While climatic considerations are importantthey are not as significant in this area as erosion, wetness or soil characteristics.
As mentioned above, the terrain forms a series of terraces which may merge almostimperceptibly or, more often, be separated by prominent steep terrace faces 5-10metres high. The terraces themselves are level to gently undulating with gradientstypically 5-10%. Steeper gradients may occur along terrace margins. Different terracelevels are most prominent to the east of the Midlands Highway, along the South EskRiver, and at Evandale.
The upper terrace is known as the Woodstock surface and comprises the Woodstocksoil association. Where Class 4 land occurs here it is limited by the duplex nature ofthe soil (which affects soil water movement) and the high proportion of ironstonegravels, which in some areas may be cemented into sheet laterite. These gravels areextremely abrasive on machinery, reduce the available water capacity of the soil andfurther limit productivity. Poor nutrient levels and low pH are also problemsassociated with these soils.
The second terrace level is known as the Brickendon surface. The soils are againduplex in nature and contain variable amounts of waterworn quartz gravels.Management issues are similar to land on the Woodstock terrace. In addition, somesoils may also be slightly sodic and dispersive, prone to crusting and structuraldecline and therefore require particularly careful management. If mapped at subclasslevel such areas would be classified Class 4s. Occasionally, where the land formsminor depressions, wetness and perched water levels can occur above the clay Bhorizon resulting in poor conditions for crop root development. Where such landoccurs it would be mapped as Class 4w at subclass level. In some instances top soilsare particularly shallow and sandy and prone to erosion by wind. These would beclassified as Class 4e at subclass level.
Class 4 land associated with Newham soils occurs on slopes between the Brickendonand the Brumby surfaces. The terrain typically forms gently undulating to rollinglandforms, intersected by many natural drainage lines carrying run-off water from theterraces above. These drainage areas would be classified as 4w. Where appreciableamounts of windblown sand have accumulated, the land is would be identified assubclass 4e to indicate the risk of erosion. Elsewhere, the duplex nature of theNewham soils would generally limit their subclass capability to Class 4s.
In some western areas of the map sheet soils with prominently mottled subsoils,indicating significant periods of waterlogging, occur in depressions and drainagelines. If mapped at subclass level these areas would be considered Class 4w. Theseareas are often adjacent to Class 3 land but are slightly lower lying. Gradients aregentle, generally not exceeding 10% and the soils are typically of the Kinburnassociation.
The Brumby terrace is the lowest terrace level above the existing flood plain of themajor rivers and streams. The topography is essentially level or very gently inclined

52
although some areas may include dune remnants with Panshanger soils. The soils arerelatively stone free but are often highly sodic. The duplex soils and the typicallymoderate to high sodicity encountered limit much of this land to Class 4s if mappedat subclass level. In addition, many parts of the Brumby terrace are often poorlydrained or subject to occasional inundation and where such areas occur the landwould be identified as Class 4w at subclass level.
In the north east of the survey area, particularly to the north and north-east ofEvandale, Class 4 land has been mapped on a variety of terrace levels separate fromothers identified within the Launceston Basin. The topography of the area is deeplydissected with a range of gradients which can reach 30%. The soils containferruginous gravels and variable amounts of boulders or massive laterite. The land onwhich Relbia soils are identified would generally classified 4s if mapped at subclasslevel. On gradients of 10-20% rill and gully erosion can occur on exposed soilsurfaces during the winter and early spring. These areas, which often exhibit signs ofslumping and land slip, would be classified 4e at subclass level. In some areas thesoils are imperfectly to poorly drained and a wetness (w) limitation would beidentified if mapped to subclass level. Many soils in this area are associated with theRelbia Association.
Class 4 land on Tertiary sediments has also been identified associated with a range ofother more minor soil types including Bicton and Macquarie associations. Here,limitations relate primarily to stoniness or rockiness, low soil pH and low nutrientavailability. The associations include duplex soils with ferruginous gravels and weaksodicity (ie prone to dispersion).
Land use is dominated by grazing of sheep and cattle with occasional crops ofcereals, In some areas the land is irrigated and a wider range of crops are grownincluding potatoes, peas and other horticultural crops. In many instances the use ofirrigation water on these duplex soils is resulting in waterlogging as a direct result ofpoor irrigation practices.
Class 4 Land on Windblown Sand
Class 4 land on windblown sand is associated with soils of the Panshanger associationand can be found in small areas throughout much of the Launceston Basin, oftenassociated with other soil types. The sands have been blown from river valleys anddepressions and deposited as sand sheets and dune systems. The soils are low innutrients, have a low water holding capacity and are prone to drought. They do havesome potential for limited cropping activities but great care is needed to protect thesesoils from erosion by wind and water. Land with Panshanger sands would beclassified as Class 4e at subclass level, even on relatively gentle gradients where windis the prime erosion agent.

53
Photo 10. Class 4e land. Landslips - a feature of Relbia Association soilsWhite Hills Road. (Grid Ref. E 522250, N 5400500)
Photo 11. Class 4e land. Panshanger sands prone to severe wind erosion.(Grid Ref. E 533500, N 5379400)

54
Class 4 Land on Sandstones, Mudstones and Tillites
Class 4 land on sandstones, mudstones, and tillites is found in small scattered areasacross the survey area. Class 4 land on Permian sandstone occurs in association withBlessington soils found in the foothills of the Great Western Tiers and around YorkLagoons. The topography is typically rolling to moderately steep (10-32%) and whilesteeper country does occur it is generally of a lower class. With rainfall approaching800 mm, and the fragile nature of the soils, areas of land on steeper gradients areparticularly susceptible to erosion and great care is needed to prevent degradation.
Small areas of Class 4 land are identified on Permian mudstones and have beenmapped in south-western parts of the survey area where gradients are generally 10-18%. At subclass level these areas would be mapped as Class 4s. The soils are of theQuamby association and are typically shallow, acidic and often sodic. On gentlergradients, poor internal drainage and the footslope location would lead to a 4wclassification at subclass level. The moderate gradients and poor physical condition ofthese soils also put them at risk of erosion if not protected by vegetation.
Other Class 4 land on Permian mudstones and siliceous metamorphic rocks is foundin depressions and small basins within the dolerite hill country. North of Perth a basincomprising Arnon soils on Permian mudstones crosses the Midlands Highway fromnorth-west to south-east. Such basins receive much run-off from the surroundingdolerite hills and remain wet for much of the year resulting in poorly and imperfectlydrained soils with only limited capability for cropping. Even better drained land islimited by shallow, stony soils suitable for only occasional cropping. At subclasslevel these areas would be classified as 4ws.
Complexes.
Two complexes (Class 4+5 and Class 5+4) that include Class 4 land have beenidentified. Class 5+4 is described under Section 6.4.
Class 4+5 land is identified where both Class 4 and Class 5 land occur together andthe pattern is such that neither class is mappable as an independent unit. Class 4 is thedominant land class being up to 60% of the unit. Class 4+5 land is identified to theeast of Mt Arnon in the north west, south of Dicks Banks, east of the junction ofDeddington and Nile roads and just north of Campbell Town. They typicallyrepresent areas where rock outcrop and shallow soils occur in association with deepersoils. Rock outcrops are usually of basalt or dolerite protruding throughUnconsolidated Tertiary Sediments. In some instances the distribution of Class 5 landmay be such that cultivation is impractical throughout the unit.
Other Class 4 Land
Scattered areas of Class 4 land have been identified on Eastfield soils which havedeveloped on dolerite. Stoniness or rock outcrop are the main limiting factors (Class4s at subclass level) in such areas. Also, the topography tends to be irregular withminor areas of what would be 4w land at subclass level, associated Canola soils innarrow stream lines which are often too small to map at this scale.
55
Scattered throughout the survey area are a number of lagoons some of which remaindry in most years while others may be inundated during the winter season. Wheredrainage has occurred or is considered a feasible option some of these lagoons havebeen classified as Class 4.
On some river terraces adjacent to the Nile River and associated with Nile soils,variable amounts of dolerite gravel and stones occur which can reach 40% of the soiulprofile. Such high stone contents are very hard on machinery, as well as reducingmoisture holding capacity and nutrient potential of the soil, and this land would beclassified as Class 4s if mapped at subclass level.
8.4 CLASS 5 LAND
Class 5 34 282 haClass 4+5 5 063 haClass 5+4 2 170 haClass 5+6 8 908 haClass 6+5 68 ha
Scattered areas of Class 5 land have been identifiedthroughout the survey area but tend to be more extensivein southern parts and in association with foothills andupland areas.
Class 5 Land on Tertiary Sediments
Class 5 land on Tertiary sediments is identified where stone and gravel contentsexceed 45% of the soil or where shallow soils occur over sheet laterite. Many suchareas are to be found along the Midland Highway but significant areas occurthroughout the survey area. Many of these areas are associated with Woodstock orBrickendon soil types where the natural vegetation remains or has been partiallycleared. Due to the high gravel content many areas have been disturbed for gravelextraction resulting in significant degradation of the upper soil horizons. In manycases little subsequent rehabilitation work has been attempted and these areas remainClass 5 where rehabilitation remains feasible but have been down graded elsewhere.Compared to similar land classified as Class 4, topsoil depths are usually significantlyshallower and soil condition is generally poorer. The majority of this land would bemapped at 5s if mapped at subclass level. Some land has gradients exceeding 25%and, where soils are sandy, would be classified 5e at subclass level.

56
Photo 12. Nile soils are typically of capability Class 4s.(Mills Plains south of Nile)(Grid Ref. E 527700, N 5387700)
Photo 13. Class 4s and 5s land on Eastfield soils over dolerite. Main limitations are stoniness, soildepth and rock outcrop. (Grid Ref. E 540050, N 5404850)
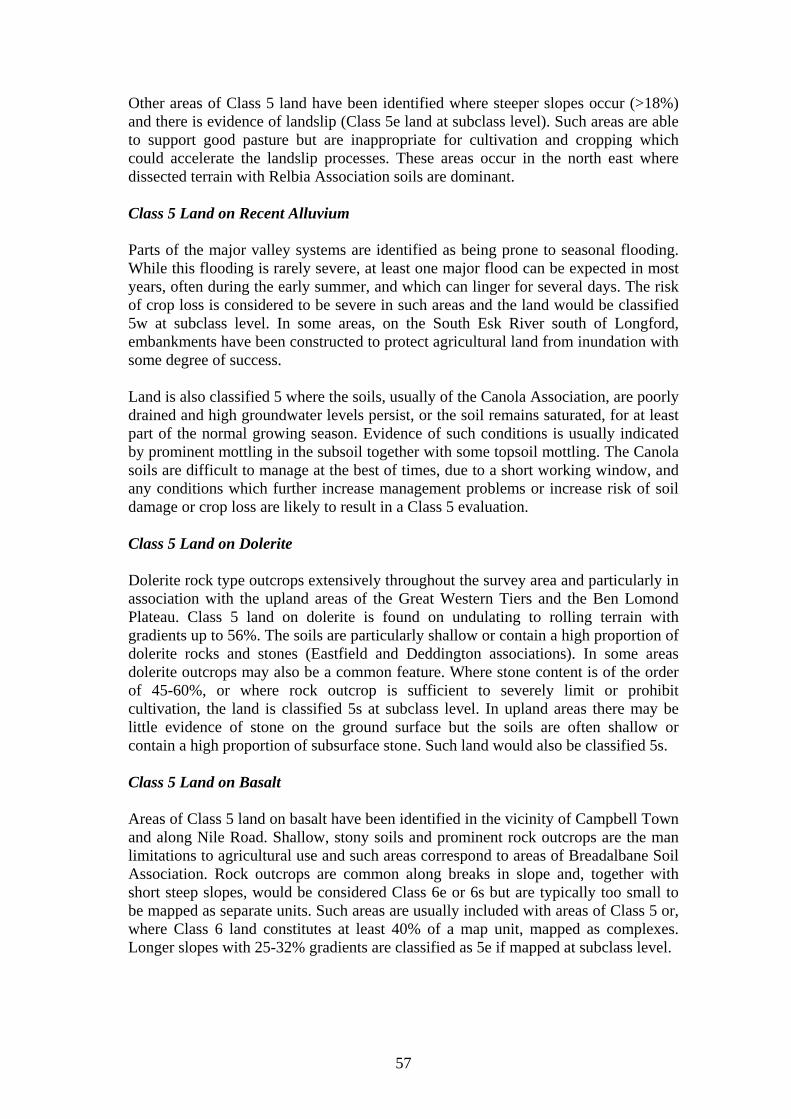
57
Other areas of Class 5 land have been identified where steeper slopes occur (>18%)and there is evidence of landslip (Class 5e land at subclass level). Such areas are ableto support good pasture but are inappropriate for cultivation and cropping whichcould accelerate the landslip processes. These areas occur in the north east wheredissected terrain with Relbia Association soils are dominant.
Class 5 Land on Recent Alluvium
Parts of the major valley systems are identified as being prone to seasonal flooding.While this flooding is rarely severe, at least one major flood can be expected in mostyears, often during the early summer, and which can linger for several days. The riskof crop loss is considered to be severe in such areas and the land would be classified5w at subclass level. In some areas, on the South Esk River south of Longford,embankments have been constructed to protect agricultural land from inundation withsome degree of success.
Land is also classified 5 where the soils, usually of the Canola Association, are poorlydrained and high groundwater levels persist, or the soil remains saturated, for at leastpart of the normal growing season. Evidence of such conditions is usually indicatedby prominent mottling in the subsoil together with some topsoil mottling. The Canolasoils are difficult to manage at the best of times, due to a short working window, andany conditions which further increase management problems or increase risk of soildamage or crop loss are likely to result in a Class 5 evaluation.
Class 5 Land on Dolerite
Dolerite rock type outcrops extensively throughout the survey area and particularly inassociation with the upland areas of the Great Western Tiers and the Ben LomondPlateau. Class 5 land on dolerite is found on undulating to rolling terrain withgradients up to 56%. The soils are particularly shallow or contain a high proportion ofdolerite rocks and stones (Eastfield and Deddington associations). In some areasdolerite outcrops may also be a common feature. Where stone content is of the orderof 45-60%, or where rock outcrop is sufficient to severely limit or prohibitcultivation, the land is classified 5s at subclass level. In upland areas there may belittle evidence of stone on the ground surface but the soils are often shallow orcontain a high proportion of subsurface stone. Such land would also be classified 5s.
Class 5 Land on Basalt
Areas of Class 5 land on basalt have been identified in the vicinity of Campbell Townand along Nile Road. Shallow, stony soils and prominent rock outcrops are the manlimitations to agricultural use and such areas correspond to areas of Breadalbane SoilAssociation. Rock outcrops are common along breaks in slope and, together withshort steep slopes, would be considered Class 6e or 6s but are typically too small tobe mapped as separate units. Such areas are usually included with areas of Class 5 or,where Class 6 land constitutes at least 40% of a map unit, mapped as complexes.Longer slopes with 25-32% gradients are classified as 5e if mapped at subclass level.

58
Complexes
Several complexes involving Class 5 land have been identified. Class 4+5 has beendescribed earlier in Section 6.3, Class 6+5 land is described in Section 6.5.
Class 5+4 land occurs around Campbell Town and Dicks Banks in areas of gentlyundulating to rolling terrain with considerable outcrops of basalt or dolerite rock, orshallow soils, which severely limit the agricultural capability of the land. The patternof rock out crop or shallow soils is such that 50-60% of the map unit is consideredunsuitable for cultivation. Class 4 land occurring within this unit may be cultivatedbut it's extent will be limited and it's distribution patchy.
Class 5+6 land is typically identified where rock outcrop and very shallow soils ofland Class 6 are widespread and amount to 40-50% of the map unit, separated by lessstony ground or slightly deeper soils of land Class 5. Such areas predominantly occuron moderate to steep slopes in areas of dolerite hills. Pasture improvement and goodgrazing are available on areas of Class 5 but other areas offer very poor grazingpotential.
A single area of Class 5+6 land is identified which is subject to frequent flooding andvery poor soil drainage. It occurs on the South Esk River east of Epping Forest andincludes significant areas of swampy ground of very limited grazing potential mixedwith slightly higher, better drained land of significantly better quality.
Other Class 5 Land
Other Class 5 land has been identified on a range of soil types. Land associated withBicton soils, along Isis Road, would be classified 5s at subclass level where they areshallow and/or stony, or 5w where they lie wet for substantial periods during thewinter season. Land associated with Blessington soils would be subclass 5s wherethey are stony. At Blessington Class 5 land lies generally above 500 m and isconsidered to have limited cropping potential due to high frost risk. Such areas wouldbe classified 5c at subclass level. At the foot of the Western Tiers alluvial fans occurwith Glen Soil Association. These soils are duplex, poorly drained and containsignificant, though variable, amounts of dolerite stone or gravel. These areas wouldgenerally be considered Class 5s at subclass level. At Tee Tree road in the north-east,other Class 5 land has been mapped where it is associated with Arnon soils and isparticularly shallow and stony (subclass 5s) or occurs in depressions and lies wet fora significant period (subclass 5w).
Some lagoons, where drainage is impracticable and where the soils are not saturatedor inundated other than for a few months over the winter period, are assessed as Class5.
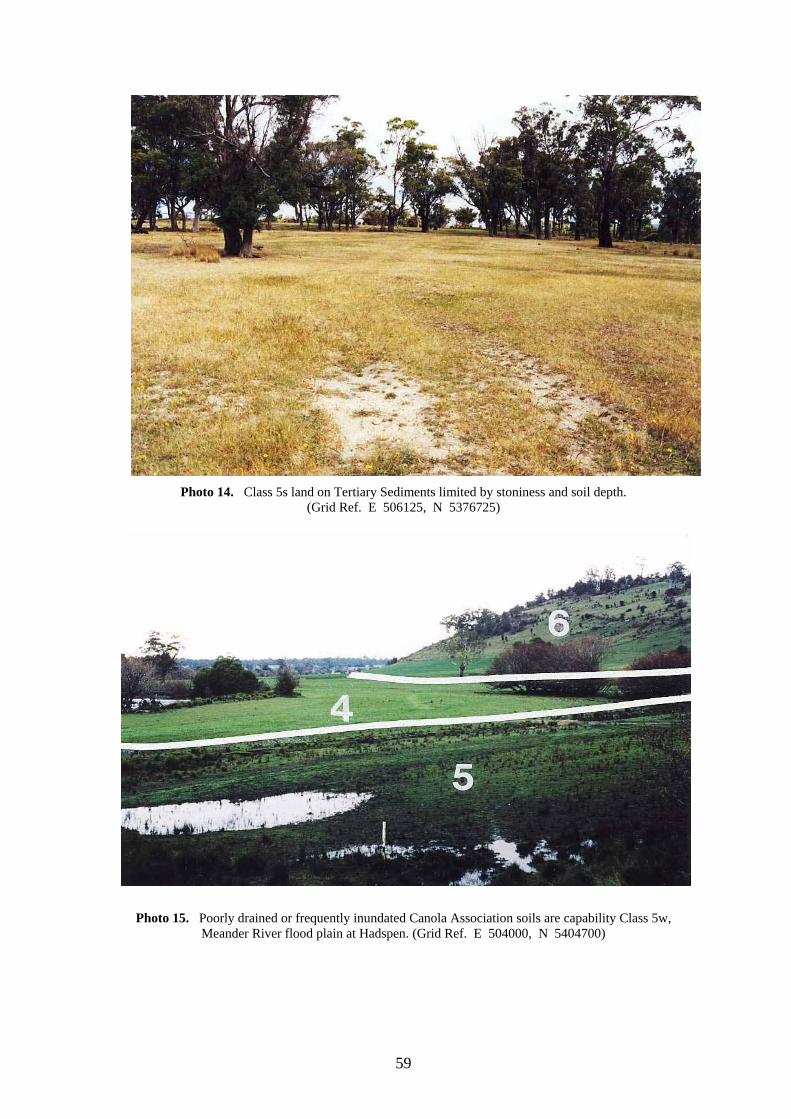
59
Photo 14. Class 5s land on Tertiary Sediments limited by stoniness and soil depth.(Grid Ref. E 506125, N 5376725)
Photo 15. Poorly drained or frequently inundated Canola Association soils are capability Class 5w,Meander River flood plain at Hadspen. (Grid Ref. E 504000, N 5404700)

60
8.5 CLASS 6 LAND
Class 6 34 171 haClass 5+6 8 908 haClass 6+5 68 haClass 6+7 1 478 ha
Areas of Class 6 land are associated predominantly withdolerite outcrops and foothills in the north-east and south-west parts of the survey area and around Hummocky Hillsand Dicks Banks. Other small areas of Class 6 land occurscattered throughout the survey area.
Class 6 Land on Dolerite
Class 6 land on dolerite is mapped throughout the hill areas around The Retreat,Temple Bar, Coxs and Castle Hills in the north-east corner of the survey, HummockyHills and Dicks Banks in the centre and the Great Western Tiers, Jacobs Sugar Loafand Macquarie Tier in southern and south-western parts. These areas include gentle tosteep slopes (5->56%), plateau tops and dolerite scree slopes with Eastfield andDeddington soil associations. Much of the land supports a dense eucalypt woodlandand land use is confined to rough, poor quality grazing due to excessive stoniness,boulders and rock outcrop. Improvement of native pastures in such areas is generallydifficult or impossible and the land is assessed as Class 6. While stone cover presentsa formidable limitation to the grazing potential of this land, the land is often usedduring winter periods to provide shelter and limited grazing.
On upper parts of the Western Tiers climate creates an additional limitation furtherlimiting the grazing potential of this land and permitting only summer grazingactivity. However many of these areas fall within the area identified as an exclusionarea and therefore fall outside the scope of this report.
Complexes
Several complexes of Class 6 land have been identified. Class 5+6 has been describedpreviously in Section 6.5.
Class 6+7 land is of limited extent and is confined to midslope areas of JacobsSugarloaf which contain a mixture of open forest and extensive scree slopes on steepto very step gradients. The unit has limited grazing potential and is lightly stockedwith sheep.
Other Class 6 Land
Other Class 6 land is confined to areas of Brickendon and Woodstock soils whichhave undergone considerable disturbance where extraction of gravels has beenundertaken. It is considered that rehabilitation of such areas will be exceedinglydifficult and is beyond the capacity of most land owners. Much topsoil has been

61
removed exposing the underlying massive, infertile clays. In such condition this landwould be classified as Class 6s if mapped to subclass level.
Class 6 land associated with Canola Association or Lagoon soils are subject tofrequent substantial inundation or high groundwater levels which pose a significantlimitation to grazing activities. Such areas would be classified with a ‘w’ (wetness)limitation if mapped to subclass level. Class 6 land has also been identified inassociation with Blessington soils where they are particularly shallow and havefrequent outcrops of sandstone. Such areas are to be found predominantly around thesettlement of Blessington and would be Class 6s at subclass level.
8.6 CLASS 7 LAND
Class 7 4 365 haClass 6+7 1 478 ha
Much of the Class 7 land occurring within the South Eskmap sheet falls within exclusion areas around the GreatWestern Tiers. Smaller scattered areas have been mappedas part of this survey around Macquarie Tier andO'Connors Peak in the south and Stringy Bark Tier in thenorth-east.
Class 7 land on Dolerite
Class 7 land on dolerite has been mapped where scree slopes or excessive stoninessoccur (subclass 7s) and the land has no agricultural value. Class 7 land is alsoidentified where topographic gradients are very steep (>100 %) or where cliffs orrock outcrops are dominant and an ‘e’ (erosion) limitation would be allocated ifmapped at subclass level. Many areas of Class 7 land are upland areas whichcurrently support a very poor natural vegetation. These areas would be easilydegraded if cleared or grazed, leading to extensive erosion of any shallow soils thatdo occur.
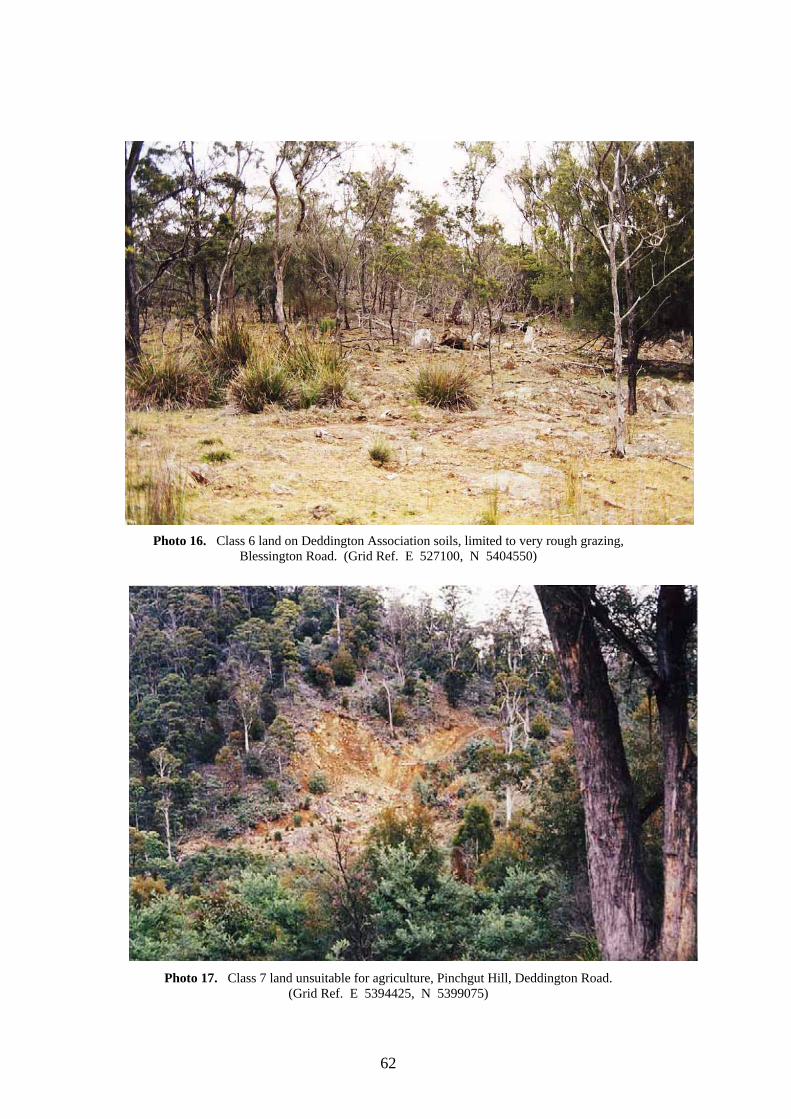
62
Photo 16. Class 6 land on Deddington Association soils, limited to very rough grazing,Blessington Road. (Grid Ref. E 527100, N 5404550)
Photo 17. Class 7 land unsuitable for agriculture, Pinchgut Hill, Deddington Road.(Grid Ref. E 5394425, N 5399075)

63
8.7 EXCLUSION AREAS
Exclusion areas 14 279 ha
The exclusion areas for the South Esk Survey arearepresent those areas other than Private Freehold andLeased Crown Land. The land tenure units which havebeen collectively termed Exclusion Areas by this studyinclude; State Forests, Reserves, Conservation Areas,National Parks and Wildlife areas, Recreation Areas,Hydro Electric Commission areas and CommonwealthAdministered areas.
The boundaries for these areas have been identified for theSouth Esk Survey by TASMAP in Sept 1983 and by Forestry Tasmania more recently(Feb 1996) in their digital land tenure coverage for the state. Where ForestryTasmania has indicated a deletion or an addition DPIF has made the appropriatemodifications to the land tenure class on the South Esk Land Tenure Index Seriesmap by TASMAP.

64
9. DISCUSSION
During the course of the field work attempts have been made to try and improve thesystem and the end product presented to the public. Consideration has been given toincreasing the number of limiting factors beyond the current four. This was to beachieved primarily through addition of a stoniness limitation (r), topographiclimitation (t) and a flooding limitation (f). The potential exists for the addition offurther limiting factors (eg salinity, wind erosion, water erosion). While the conceptof identifying limitations to land use is very useful the practice has significantlyincreased the amount of time spent on field work and led to considerable usefuldiscussion on how to identify different limitations (eg wetness versus flooding;wetness as a soil limitation). At this point in time, however, the sub class informationavailable continues to be the standard four limitations. The additional limitations havebeen identified and recorded on the site cards but further work needs to be done todetermine the usefulness of introducing additional subclass codes.
A valid criticism of the current system is that it is very subjective and is dependent onthe interpretation of the surveyor who undertook the survey. This can makeconsistency a problem. To combat this, attempts have been made during this surveyto identify core data sets which would be used in evaluations for a wide range ofpurposes and to identify class intervals for various land qualities applicable todifferent land class ratings. It is hoped that this approach will help to create a morequantifiable and uniformly applicable system. This approach is dependent on suitableresearch data being available for different soils and the relationships to productivity.However, there is a significant shortage of this type of information for Tasmaniansoils and other relevant baseline information is often at the wrong scale or in a formatwhich is currently difficult to incorporate into a GIS. For example, the best availabledigital geological data is at 1:250 000 scale - less than ideal for 1:100 000 landcapability mapping. As a result, class intervals for a variety of land characteristics andqualities are being adapted from those used in other Australian States. The limitationsand dangers of this approach are recognised but it is the best alternative currentlyavailable. Additional research could help provide more relevant information andmake the system more Tasmanian oriented. It is hoped that the importance ofgathering base line information in the future will not be underestimated as it allows arelatively cost effective way of producing a variety of end products depending on therequirements of the client, as well as providing more accurate interpretations forTasmanian conditions rather than relying on data from other states.
Despite these many problems, land capability information remains a valuableinterpretative tool for long term regional and State planning and the system can beapplied relatively easily at a more detailed level for local and farm planning. There isalready an increasing demand for this type of information from local government,landcare and catchment management groups. The system is being applied at farmlevel through the Whole Farm Planning workshops and Best Farm Practice program.
Assessment of land capability in districts with access to irrigation continues to be anarea of concern. As no climate limitations have been identified within the Cressy-Longford irrigation district, other limitations being considered more dominant, the

65
application of irrigation water will not substantially improve the capabilityclassification of this land.
Potential users of the information should be aware of the problems of trying to use theinformation at a larger scale. Users should also be aware that additional informationrelating to sub classes identified in the survey area is available from DPIF's ProspectOffice.
The authors welcome constructive comment and criticism of the report andaccompanying map and, in the unlikely event that significant errors in classificationbe identified, they should be reported to the field officers concerned.
For any information regarding land capability maps and the land capability systemcontact should first be made with staff at your local DPIF office or with staff of theResource Assessment Branch at the Department’s Prospect Office.

66
REFERENCES
Australian Bureau of Meteorology 1980, Climatic Survey, Tasmania. Region 3Northern. Australian Government Publishing Service, Canberra.
Australian Bureau of Meteorology, April 1988, Climatic Averages Australia.Australian Government Publishing service, Canberra.
Australian Bureau of Meteorology March 1993, Climate of Tasmania. VictoriaPrinting, Canberra.
Australian Bureau of Meteorology 1995, (Unpublished data collated via personalcorrespondence), Average Monthly Rainfall, Monthly Temperature, MonthlyMaximum and Minimum Temperature and Average Evaporation, for selectedstations.
Australian Bureau of Statistics 1988, Tasmanian Year Book. No. 21.
Blake, F. 1959, Longford, Geological Map, Sheet No. 47. Geological Survey ofTasmania.
Carey, S. W. 1947, Geology of the Launceston District. Records of the QueenVictoria Museum, Launceston.
Chilvers, W. 1996, Managing Tasmania's Cropping Soils. A practical guide forfarmers. DPIF, Tasmania.
Doyle, R. B. 1993, Soils of the South Esk Sheet, Tasmania Southern Half. SoilSurvey Series of Tasmania, No 1. DPIF, Tasmania.
Finnigan, J. J. 1995, Salinity Assessment in Tasmanian Irrigation Schemes andRegional Areas. Department of Primary Industry and Fisheries.
Forestry Tasmania 1996, Land Tenure of Tasmania. Digital Coverage.
Goss, K., Chisholm, T., Graetz, D., Noble, I. and Barson, M. 1995, State of theAgricultural resource Base: A Framework for Government Response in Sustainingthe Agricultural Resource Base. Prime Ministers Science and Engineering Council,Dept. the Prime Minister and Cabinet.
Grice, M. S. 1995, Assessment of soil and land degradation on private freehold landin Tasmania. Department of Primary Industry and Fisheries Tasmania.
Gunn, R. H, Beatie J. A, Reid, R. E and van de Graaff, R. H. M 1988, AustralianSoil and Land Survey Handbook - Guidelines for Conducting Surveys. Inkata Press,Australia.
Hannan, D. G. 1993, Two Ages of Till on the Western Edge of the Longford Sub-basin, near Poatina, Northern Tasmania. Aust. J. Earth Sci. 40, pp.271-273.

67
Hubble, G. D. 1947, Unpublished Soil Map of Macquarie Estates, County ofSomerset, Tasmania. CSIRO Div. of Soils, Hobart.
Hydro Electric Commission Tasmania June 1986, Average Annual RainfallTasmania, Isohyet Map, Scale 1:500 000. Systems Development Section.
Isbell, R.F. 1996, The Australian soil Classification. CSIRO Publishing.
Johnstone, R. M. 1875, The Launceston Tertiary Basin. Papers and Proceedings ofthe Royal Society of Tasmania for 1874, pp. 53-62.
Kirkpatrick, J. B. and Dickinson K. J. M. 1984, Vegetation of Tasmania. ForestryCommission of Tasmania, Map and Legend (scale 1:500 000).
Klingbiel, A. A. and Montgomery, P. H. 1961, Land Capability Classification.Agricultural Handbook No. 210, USDA Soil Con. Serv.
Landon, J. R. (ed.) 1991, Booker Tropical Soil Manual. Longman Scientific andTechnical.
Langford, J. 1965, Atlas of Tasmania, Weather and Climate. Lands and SurveysDepartment, Hobart, Tasmania.
Matthews, W. L. 1974, Lake River, Geological Map, Sheet 54. Geological Survey ofTasmania.
Matthews, W. L. 1983, Geology and Groundwater Resources of the LongfordTertiary Basin. Geological Survey of Tasmania, Bulletin 59.
Nicolls, K. D. 1958a, Aeolian Deposits in River Valleys in Tasmania. Aus. J. Sci. Vol21, No 2, pp.50-51.
Nicolls, K. D. 1958b, Reconnaissance Soil Map of Tasmania, Sheet 47 - Longford.Divisional Report 14/57, CSIRO Division of Soils, Adelaide.
Nicolls, K. D. 1960, Erosion Surfaces, River Terraces and River Capture in theLaunceston Tertiary Basin. In Papers and Proceedings of the Royal Society ofTasmania, Vol 94, pp.1-14.
Noble, K. E. 1991, Land Capability Survey of Tasmania, Pipers Report. DepartmentPrimary Industry, Tasmania.
Noble, K. E. 1992a, Land Capability Survey of Tasmania, Land CapabilityHandbook. Department Primary Industry, Tasmania.
Noble, K. E. 1992b, Land Capability Survey of Tasmania, Tamar Report.Department Primary Industry, Tasmania.

68
Noble, K. E. 1993, Land Capability Survey of Tasmania, Meander Report.Department Primary Industry, Tasmania.
Nulsen, R. A. 1995, A Review of Salinity Assessment and Management in Tasmania.Technical Series, Bulletin Number 4. Department of Primary Industry and Fisheries,Tasmania.
Ockerby, J. 1995, Regional Salinity Management. In: Australian Commodities Vol2. No. 2 ABARE, New South Wales.
Prescott, J. A. & Thomas, J. A. 1949, The Length of Growing Season in Australiaas determined by the effectiveness of the Rainfall. Proc. Royal Society of SouthAustralia. Branch Vol.l 1948-49.
Scanlon, A. P, Fish G. J, Yaxley M. L. eds 1990, Behind the Scenery, Tasmania'sLandforms and Geology. Dept. Educ. and Arts, Tasmania.
Stace, H. C. T et al 1968, A Handbook of Australian Soils. Rellim, Glenside, SA.
Stephens, C. G, Baldwin J. G, and Hosking J. S. 1942, The Soils of the Parishes ofLongford, Cressy and Lawrence, County Westmorland, Tasmania. CSIRO Bulletin150, Government Printer Melbourne.
Walker, M. 1995, Causes, Effects, Remediation and Measurement of Land and RiverSalinity in Australia. Report 95/6 Cooperative Research Centre for CatchmentHydrology.
Working Party on Dryland Salinity in Tasmania 1982, Salinity of non-irrigatedland in Tasmania. Soil Conservation Authority of Victoria for Standing Committeeon Soil Conservation.

69
APPENDICES
APPENDIX A Example of a Completed Land Capability Site CardAPPENDIX B Climatic Data for the South Esk AreaAPPENDIX C Land Capability Classes for Sites within the South Esk Area

70
APPENDIX A. Example of Completed Land Capability Site Cards

71
APPENDIX B. Climatic Data for the South Esk Area
Four main Meteorological stations have been used to indicate climatic conditionswithin the South Esk Survey area, these are Launceston Airport, Cressy ResearchStation, Epping Forest and Campbell Town. The data in tables below have been usedto generate the majority of the graphs and tables found in the climate section of thisreport.
Rainfall - Average Monthly (mm)Jan Feb Mar Apr May Jun Jul Aug Sept Oct Nov Dec Total
Launceston Airport 42 40 39 56 63 61 79 78 62 62 51 53 687
Cressy 38 39 38 52 59 53 73 69 58 56 51 52 635
Epping Forest 37 33 35 50 48 47 59 59 48 52 45 53 566
Campbell Town 39 36 36 44 45 43 48 48 48 56 47 54 543
Temperature - Average Monthly ( °C )Jan Feb Mar Apr May Jun Jul Aug Sept Oct Nov Dec
Launceston Airport max 23 23 21 17 14 11 11 12 14 16 19 21
Cressy max 24 24 21 18 14 12 11 12 14 17 19 22
Campbell Town max 23 24 23 19 15 12 11 13 15 18 21 23
Launceston Airport min 10 10 9 7 5 3 2 3 4 6 7 9
Cressy min 9 9 8 5 3 1 1 2 3 5 7 8
Campbell Town min 9 9 8 6 2 0 1 2 3 5 7 8
Monthly Evaporation (mm)Jan Feb Mar Apr May Jun Jul Aug Sept Oct Nov Dec
Launceston Airport 214 182 143 81 47 27 31 47 78 118 156 198
Cressy 186 164 118 69 37 21 25 43 69 102 132 164
Campbell Town 189 155 109 66 34 21 31 47 69 105 126 177
Average Evaporation 196 167 123 72 39 23 29 46 72 108 138 180
Effective Rainfall and Moisture Deficit/Surplus Data collated for each stationLaunceston Airport Jan Feb Mar Apr May Jun Jul Aug Sept Oct Nov DecEffective rainfall required (mm) A 60 53 45 30 21 14 15 21 30 39 48 57
Average Rainfall received (mm) B 42 40 39 56 63 61 79 78 62 62 51 53
Moisture deficit/surplus (mm) C (18) (13) (6) 26 42 47 64 57 33 23 3 (4)
Cressy Jan Feb Mar Apr May Jun Jul Aug Sept Oct Nov DecEffective rainfall required (mm) A 54 50 39 27 18 12 13 19 27 36 43 50
Average Rainfall received (mm) B 38 39 38 52 59 53 73 69 58 56 51 52
Moisture deficit/surplus (mm) C (17) (11) (1) 25 41 41 59 50 31 20 8 2
Campbell Town Jan Feb Mar Apr May Jun Jul Aug Sept Oct Nov DecEffective rainfall required (mm) A 55 48 37 26 17 12 15 21 27 36 41 52
Average Rainfall received (mm) B 39 36 36 44 45 43 48 48 48 56 47 54
Moisture deficit/surplus (mm) C (16) (12) (2) 17 29 31 33 27 21 19 6 2
Moisture deficit/surplus is calculated as follows A-B =C*Note: deficit figures bracketed
Source: Australian Bureau of Meteorology, unpublished data, collated from correspondence, (1995).

72
APPENDIX C. Capability Classes for Sites within the South Esk Area
Site IDMap
EastingMap
NorthingDominant Soil
Association/Series/TypeLand
CapabilityClass
SE1 509050 5379950 Eastfield 5SE2 500500 5378750 Eastfield 6SE3 501225 5373450 Brumby-Panshanger 4SE4 502200 5372800 Canola 4SE5 503000 5370000 MEa and M2 6SE6 504200 5374550 Newham 4SE7 504550 5375375 Brickendon 4SE8 506750 5377200 Newham - Brickendon 4SE9 508050 5374200 Canola 5
SE10 508650 5368850 Canola - Glen 4SE11 505800 5355800 M1 7+ESE12 508050 5356425 Quamby - Blessington 7SE13 506700 5360225 Quamby - Blessington 5SE14 505950 5367600 MEa 6SE15 506075 5370925 Millers 5SE16 510555 5377675 Brumby - Tara 4SE17 514800 5376325 Newham 4SE18 514325 5373800 Woodstock 5SE19 519225 5365875 Macquarie-Panshanger 4SE20 522500 5353250 Bicton 4SE21 521125 5355175 Bicton 5SE22 535550 5369500 Woodstock-Panshanger 4SE23 532250 5371100 Panshanger(Woodstock) 4SE24 527850 5373500 Woodstock (Panshanger) 4SE25 528250 5372775 Eastfield 6SE26 524500 5372000 Macquarie & Brickendon 4SE27 526150 5369500 Blessington-Panshanger 4SE28 527425 5367925 Panshanger-Canola 5SE29 522600 5371650 Panshanger-Eastfield 4+5SE30 531450 5378850 Canola 5SE31 524650 5368100 Canola-Panshanger 5SE32 516925 5377450 Newham-Panshanger 4SE33 529275 5364100 Panshanger 4SE34 519925 5373750 Panshanger-Eastfield 4+5SE35 530150 5362975 Bloomfield-Panshanger 4+6SE36 530925 5362525 Panshanger-Bloomfield 5SE37 533275 5361850 Panshanger-Bloomfield 4SE38 530475 5360050 Canola-Panshanger 4SE39 526875 5361350 Canola-Eastfield 5SE40 526150 5355550 Blessington -Panshanger 4SE41 526425 5350325 Canola 4SE42 525850 5352100 Eastfield-Panshanger 4SE43 526000 5352500 Lagoon 5

73
Site IDMap
EastingMap
NorthingDominant Soil
Association/Series/TypeLand
CapabilityClass
540400 5377300 Canola(west),Brumby(east) 4SE45 539200 5374600 Brumby-Panshanger 4SE46 539100 5374350 Breadalbane 4SE47 537975 5375025 Eastfield-Panshanger 4SE48 537025 5373400 Macquarie 4SE49 536525 5372775 Panshanger-Eastfield 5SE50 538375 5368425 Breadalbane 4SE51 538325 5363325 Canola-Breadalbane 4SE52 539275 5361100 Campbell Town-Breadalbane 4SE53 540875 5355500 Campbell Town-Breadalbane 4SE54 541500 5352625 Panshanger-Bloomfield 4SE55 540900 5352650 Panshanger-Bloomfield 5SE56 537325 5351125 Brumby-Panshanger 4SE57 535500 5351100 MEA. Misc. soils re:Eastfield 6SE58 535800 5355725 Glen-Canola 5SE59 533700 5358275 Glen-Panshanger 5SE60 524500 5364250 Woodstock 4SE61 535675 5361525 Bloomfield 5SE62 535975 5361400 Canola 4SE63 537775 5360550 Campbell Town 4SE64 503700 5379375 Woodstock 4SE65 503400 5376850 Eastfield 5SE66 501800 5371225 Brumby 4SE67 510550 5372400 Brickendon 6SE68 513925 5371500 Newham 4SE69 516875 5369575 Brumby 4SE70 520525 5363400 Eastfield 5+6SE71 520325 5358725 Bicton 4SE72 526275 5358825 Canola-Eastfield 4SE73 526125 5365175 Canola 4SE74 528300 5376500 Woodstock-Panshanger 4SE75 527500 5375600 Panshanger-Woodstock 4SE76 531375 5374725 Brumby-Panshanger 4SE77 536425 5368225 Breadalbane 4SE78 538300 5364475 Breadalbane 5SE79 536900 5353025 Brumby-panshanger 4SE80 533050 5361000 Panshanger/Bloomfield 4SE81 539575 5358250 Campbell Town - Breadalbane 4SE82 500275 5379375 Lagoon soil/ Panshanger 6SE83 500125 5378525 Eastfield 5+6SE84 500100 5379950 Canola 4+5SE85 501375 5380500 Canola\Panshanger 7SE86 502950 5379550 Eastfield 4SE87 502775 5380275 Cressy 3SE88 503550 5382575 Cressy 3SE89 502075 5385025 Brumby 4

74
Site IDMap
EastingMap
NorthingDominant Soil
Association/Series/TypeLand
CapabilityClass
SE90 504000 5385000 Kinburn 4SE91 504875 5381875 Brickendon 4SE92 506350 5378625 Brumby 4SE93 500325 5384200 Woodstock 4SE94 500875 5384900 Brumby 4SE95 503600 5384525 Kinburn 4SE96 505100 5383700 Cressy 3SE97 500175 5388300 Cressy 3SE98 503050 5387775 Cressy 3SE99 506875 5405700 Canola 4SE100 504850 5404850 Panshanger 4SE101 504325 5404375 Brumby 4SE102 502350 5403450 Brickendon 4SE103 504675 5405550 Eastfield 5SE104 534825 5405750 Not Known 4SE105 540000 5404525 probably Brumby 4SE106 539750 5404100 probably Eastfield 5SE107 538950 5403300 Blessington 5SE108 540000 5402300 Deddington (probably) 6SE109 537850 5402750 Deddington 6SE110 532975 5402875 Deddington 5SE111 530825 5404525 Deddington 5SE112 527900 5403800 Deddington or Eastfield 6SE113 525525 5404175 Eastfield 5SE114 523625 5404425 Breadalbane 4SE115 520525 5405350 Relbia 4SE116 521425 5404100 Relbia 4SE117 521775 5402475 Breadalbane 5SE118 523525 5403150 Breadalbane 4SE119 530400 5403000 Arnon 5SE120 529575 5402100 Arnon 5SE121 528150 5400700 Relbia 4SE122 521950 5400400 Relbia 5SE123 525325 5401400 Relbia 5SE124 501250 5398775 Woodstock 4SE125 500375 5395875 Cressy 3SE126 500150 5392500 Cressy 3SE127 500425 5393875 Cressy 3SE128 501825 5394110 Lagoon 4SE129 504600 5394600 Lagoon 5SE130 538725 5402150 Blessington 5SE131 538800 5401725 Blessington 6SE132 539425 5399075 Deddington 7SE133 538900 5398100 Deddington 6SE134 540775 5397250 Deddington 7SE135 540550 5398175 Blessington 5

75
Site IDMap
EastingMap
NorthingDominant Soil
Association/Series/TypeLand
CapabilityClass
SE136 537475 5398025 Canola over stones. 5SE137 541100 5391000 Nile?/Brumby 5SE138 536775 5395525 Canola 4SE139 534100 5393575 Canola? 4SE140 531950 5393475 Deddington 5SE141 527075 5391850 Brumby 4SE142 508475 5381200 Brickendon 4SE143 512625 5382725 Newham 4SE144 508750 5402300 Eastfield 6SE145 527475 5395300 Woodstock 4SE146 525125 5394850 Brickendon 4SE147 526900 5393925 Woodstock/Brickendon 5SE148 529625 5396650 Eastfield 6SE149 527550 5397475 Lateritic Eastfield 5SE150 525850 5397125 Woodstock? 4SE151 525175 5398125 Canola 4SE152 521925 5395550 Brickendon 4SE153 523500 5391700 Panshanger 4SE154 526450 5390275 Nile 4SE155 508200 5402175 Brickendon 4SE156 509175 5401325 Eastfield 5SE157 512200 5397200 Panshanger sand over Brickendon 4SE158 511775 5399525 Eastfield 5SE159 511775 5398900 Eastfield 5SE160 511025 5397250 Sandy Brickendon association 4SE161 509425 5382450 Brickendon 4SE162 511800 5381900 Panshanger 4SE163 519875 5383725 Woodstock 4SE164 527450 5389025 Canola? 4SE165 528175 5388500 Nile 4SE166 530200 5389675 Eastfield 6SE167 532250 5390850 Eastfield 6SE168 533100 5391275 Canola? 4SE169 534600 5387950 Woodstock 5SE170 533600 5388375 Nile and Canola. 5SE171 533725 5392725 Deddington 6SE172 528750 5386350 Brumby? 4SE173 529875 5384775 Brumby? 4SE174 508175 5403750 Eastfield 5SE175 520025 5388600 Brickendon 4SE176 521875 5385175 Brickendon 4SE177 525725 5381100 Brickendon 4SE178 527625 5379000 Brickendon 4SE179 532500 5379200 Panshanger 4SE180 531700 5378900 Breadalbane 5SE181 541225 5376475 Eastfield 5+6

76
Site IDMap
EastingMap
NorthingDominant Soil
Association/Series/TypeLand
CapabilityClass
SE182 540400 5376875 Brumby 4SE183 540050 5376800 Canola 5SE184 541175 5379600 Nile / (Brumby) 4SE185 538700 5379300 Woodstock 5SE186 512175 5404225 Eastfield 5SE187 513950 5404800 Relbia 4SE188 516025 5401350 Breadalbane 4SE189 516550 5398125 Arnon 4+5SE190 513850 5400200 Arnon 5SE191 522475 5391550 Canola 4SE192 526675 5385700 Brumby 3SE193 527200 5387100 Nile 4SE194 524300 5390125 Canola 4SE195 525425 5390725 Brumby 4SE196 522625 5393250 Brumby 4SE197 521800 5392750 Canola 4SE198 522925 5383275 Brickendon? 4SE199 523425 5382650 Woodstock 4SE200 521200 5383750 Woodstock 5SE201 517400 5403950 Breadalbane assoc. 4SE202 519300 5404225 Relbia 4SE203 519000 5404500 Canola 4SE204 518975 5402600 Breadalbane 5SE205 517425 5405475 Woodstock 5SE206 523650 5390525 Sandy alluvial soil 5SE207 522325 5388000 Brumby 4SE208 521700 5389350 Brumby 4SE209 522850 5386125 Panshanger 4SE210 524950 5385175 Canola 5SE211 524550 5385200 Canola association 4SE212 515700 5403925 Breadalbane(Evandale clay) 4SE213 516550 5405575 Relbia 4SE214 520600 5402825 Breadalbane assoc. 4SE215 519775 5398425 Breadalbane assoc. 4SE216 515600 5398000 Panshanger sand 4SE217 518300 5396300 Brickendon 4SE218 519525 5394150 Brumby 4SE219 519050 5394925 Brickendon 5SE220 514725 5395275 Brickendon 4SE221 513850 5392700 Canola 4SE222 514875 5393900 Newham/Brumby/Panshanger 4SE223 508800 5395425 Kinburn 4SE224 509400 5388625 Cressy 3SE225 508525 5389200 Cressy 3SE226 507925 5390850 Brickendon 4SE227 512475 5393550 Brickendon Assoc. 4

77
Site IDMap
EastingMap
NorthingDominant Soil
Association/Series/TypeLand
CapabilityClass
SE228 515325 5391900 Brumby Assoc. 4SE229 517600 5392725 Newham 4SE230 517575 5393525 Newham Assoc. 4SE231 512225 5388425 Brickendon 4SE232 512125 5387525 Brickendon Assoc. 4SE233 514600 5385925 Brickendon 4SE234 513875 5384925 Newham Assoc. 4SE235 512200 5383500 Panshanger 4SE236 509250 5385450 Brumby 4SE237 534425 5380525 Brumby Assoc. 4SE238 534800 5382725 Eastfield 5+6SE239 533950 5382275 Woodstock 4SE240 533125 5381300 Blessington Assoc. 4SE241 532550 5380825 Brumby? 4SE242 531175 5383200 Panshanger 4SE243 524525 5382600 Brickendon Assoc. 4SE244 511325 5384900 Canola 4SE245 510125 5382825 Panshanger 4SE246 509100 5383700 Brumby 4SE247 508975 5382900 Brickendon Assoc. 4SE248 519500 5380100 Deddington 6SE249 519875 5380550 Eastfield 5SE250 519225 5382800 Woodstock 5SE251 520675 5396850 Brumby 4SE252 506400 5395125 Cressy 3SE253 507575 5392875 Cressy 3+4SE254 523050 5378500 Woodstock 5SE255 522775 5379900 Woodstock 5SE256 522300 5379850 Woodstock 5SE257 521600 5381350 Woodstock 5SE258 522475 5381275 Woodstock 5SE259 524275 5380100 Woodstock 5SE260 523750 5380700 Woodstock 5+6SE261 523975 5381000 Woodstock 5SE262 529575 5380800 Canola 6SE263 517900 5390600 Brickendon 4SE264 517500 5390775 Brickendon 4SE265 517075 5390925 Brickendon Assoc. 4SE266 516875 5391925 Brumby 4SE267 519400 5392550 Brumby 4SE268 520300 5395275 Brumby 4SE269 523950 5399425 Canola/Woodstock? 4SE270 524300 5398975 Relbia 4SE271 523600 5399975 Breadalbane 4SE272 522875 5399850 Relbia 4SE273 522775 5398600 Brickendon 4

78
Site IDMap
EastingMap
NorthingDominant Soil
Association/Series/TypeLand
CapabilityClass
SE274 504100 5400450 Cressy 4SE275 500975 5398975 Woodstock 5SE276 503550 5399375 Woodstock 4SE277 504475 5399975 Cressy 3+4SE278 505475 5399625 Eastfield 5SE279 505125 5400475 Cressy Assoc 4SE280 505950 5400975 Brickendon 5SE281 507125 5401250 Canola 5SE282 512950 5391325 Brumby 4SE283 514450 5388450 Brickendon 4SE284 515900 5387475 Brickendon Assoc. 4SE285 516300 5383700 Newham 4SE286 530050 5386575 Newham? 4SE287 532425 5386800 Canola Assoc. 5SE288 534625 5386825 Nuka? 4SE289 537825 5386325 Deddington 6SE290 530775 5384550 Panshanger 5SE291 538100 5381150 Eastfield 4SE292 539300 5381200 Woodstock 5SE293 539550 5379200 Breadalbane 5SE294 536900 5378650 Woodstock 5SE295 512500 5381850 Panshanger 4SE296 512550 5381650 Brumby 5SE297 512850 5380925 Brumby +Panshanger 4SE298 512525 5380850 Brumby +Panshanger 5SE299 513525 5380325 Newham +Panshanger 4SE300 514750 5380275 Eastfield 5SE301 519300 5387900 Brickendon 4SE302 520725 5384875 Woodstock 6SE303 521075 5385900 Brickendon 5+6SE304 518625 5387325 Brickendon 6