Embed Size (px)
Citation preview

Model G58
5-1
SECTION 5PERFORMANCE
TABLE OF CONTENTS
SUBJECT PAGE
Introduction To Performance . . . . . . . . . . . . . . . . . . . . . 5-5Performance In Icing Conditions . . . . . . . . . . . . . . . . . . . 5-5How To Use The Graphs . . . . . . . . . . . . . . . . . . . . . . . . . 5-6
Example Calculations . . . . . . . . . . . . . . . . . . . . . . . . . . . . 5-7Conditions . . . . . . . . . . . . . . . . . . . . . . . . . . . . . . . . . . . . 5-7
Pressure Altitude . . . . . . . . . . . . . . . . . . . . . . . . . . . . . 5-8Take-Off Weight . . . . . . . . . . . . . . . . . . . . . . . . . . . . . . . . 5-8Take-Off Distance . . . . . . . . . . . . . . . . . . . . . . . . . . . . . . 5-9Flight Time, Block Speed and Fuel Requirement. . . . . . 5-11
Cruise Climb . . . . . . . . . . . . . . . . . . . . . . . . . . . . . . . . 5-11 . . . . . . . . . . . . . . . . . . . . . . . 5-12 . . . . . . . . . . . . . . . . . . . . . . . 5-14 . . . . . . . . . . . . . . . . . . . . . . . 5-14 . . . . . . . . . . . . . . . . . . . . . . . 5-15 . . . . . . . . . . . . . . . . . . . . . . . 5-15erformance . . . . . . . . . . . . . . 5-15
al System . . . . . . . . . . . . . . 5-17al System . . . . . . . . . . . . . . 5-18rgency System. . . . . . . . . . . 5-19rgency System . . . . . . . . . . . 5-20 . . . . . . . . . . . . . . . . . . . . . . . 5-21perature Conversion. . . . . . . 5-22 . . . . . . . . . . . . . . . . . . . . . . . 5-23. . . . . . . . . . . . . . . . . . . . . . . 5-24
. . . . . . . . . . . . . . . . . . . . . . . 5-25
58-590000-67A9_sec05toc.fm Page 1 Wednesday, April 25, 2012 1:49 PM
April, 2012
Cruise . . . . . . . . . . . . . .Descent . . . . . . . . . . . .Reserve Fuel . . . . . . . .Total Fuel Required . . .Landing. . . . . . . . . . . . .Balked Landing Climb P
Graphs:
Airspeed Calibration - NormAltimeter Correction - NormAirspeed Calibration - EmeAltimeter Correction - EmeISA Conversion . . . . . . . .Fahrenheit to Celsius TemStall Speeds - Power Idle .Manifold Pressure vs RPMTake-Off Weight . . . . . . . .
Model G58
April, 2012
SECTION 5PERFORMANCE
TABLE OF CONTENTS (CONT’D)
SUBJECT PAGE
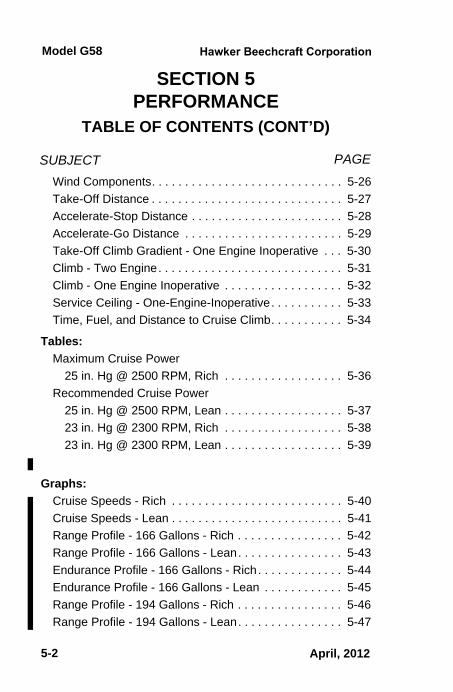
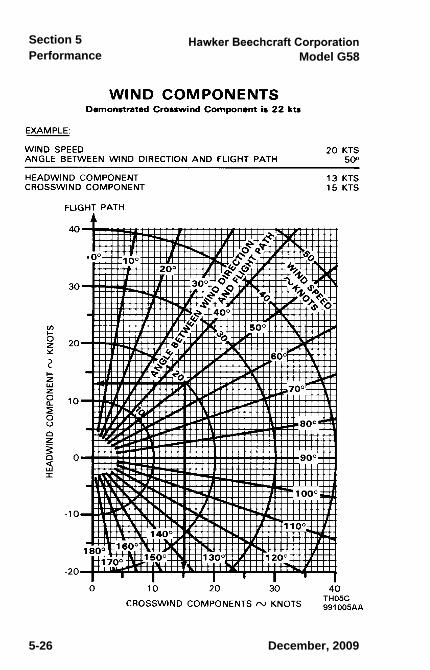
Wind Components. . . . . . . . . . . . . . . . . . . . . . . . . . . . . 5-26Take-Off Distance . . . . . . . . . . . . . . . . . . . . . . . . . . . . . 5-27Accelerate-Stop Distance . . . . . . . . . . . . . . . . . . . . . . . 5-28Accelerate-Go Distance . . . . . . . . . . . . . . . . . . . . . . . . 5-29Take-Off Climb Gradient - One Engine Inoperative . . . 5-30Climb - Two Engine. . . . . . . . . . . . . . . . . . . . . . . . . . . . 5-31Climb - One Engine Inoperative . . . . . . . . . . . . . . . . . . 5-32Service Ceiling - One-Engine-Inoperative. . . . . . . . . . . 5-33Time, Fuel, and Distance to Cruise Climb. . . . . . . . . . . 5-34
Tables:
Rich . . . . . . . . . . . . . . . . . . 5-36er
Lean . . . . . . . . . . . . . . . . . . 5-37Rich . . . . . . . . . . . . . . . . . . 5-38Lean . . . . . . . . . . . . . . . . . . 5-39
. . . . . . . . . . . . . . . . . . . . . . . 5-40
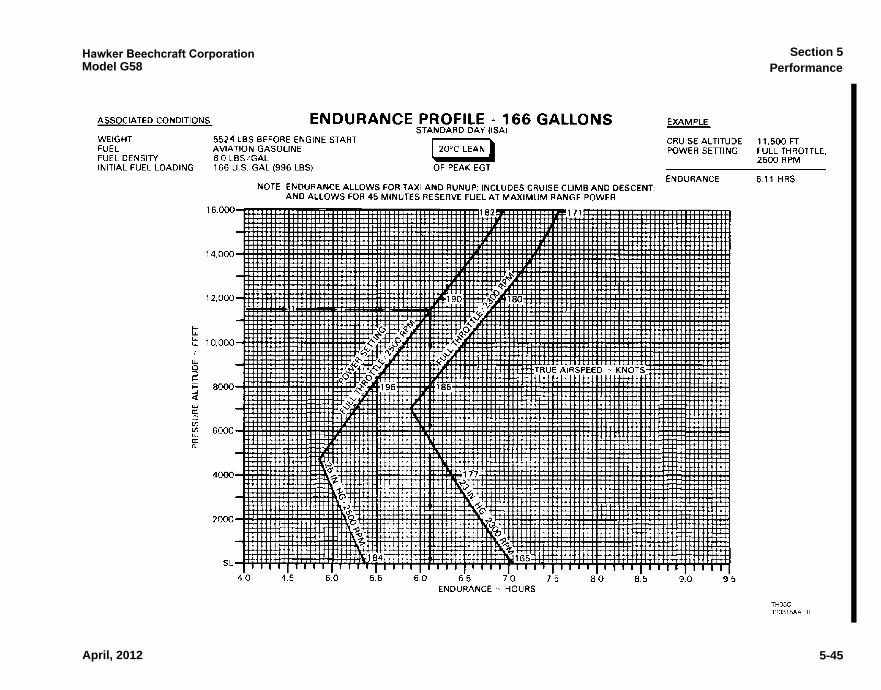
. . . . . . . . . . . . . . . . . . . . . . . 5-41s - Rich . . . . . . . . . . . . . . . . 5-42s - Lean. . . . . . . . . . . . . . . . 5-43llons - Rich. . . . . . . . . . . . . 5-44llons - Lean . . . . . . . . . . . . 5-45
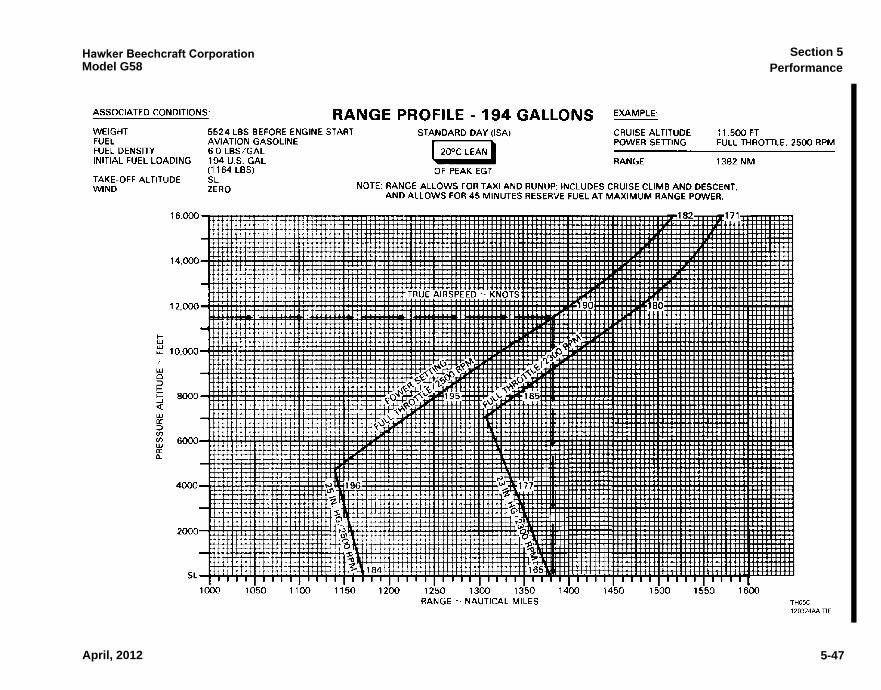
s - Rich . . . . . . . . . . . . . . . . 5-46s - Lean. . . . . . . . . . . . . . . . 5-47
58-590000-67A9_sec05toc.fm Page 2 Wednesday, April 25, 2012 1:49 PM
5-2
Maximum Cruise Power25 in. Hg @ 2500 RPM,
Recommended Cruise Pow25 in. Hg @ 2500 RPM, 23 in. Hg @ 2300 RPM, 23 in. Hg @ 2300 RPM,
Graphs:
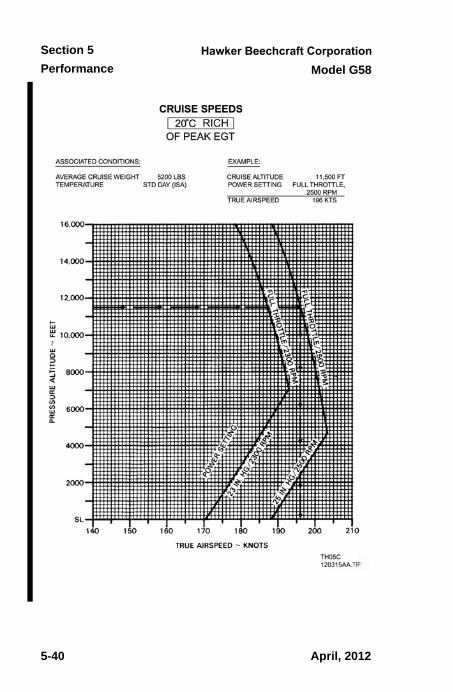
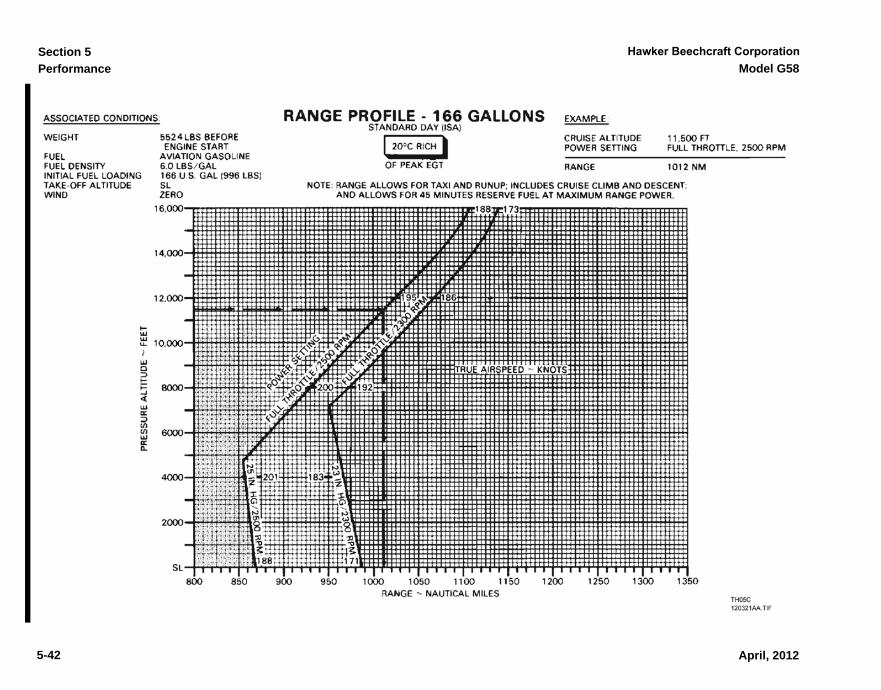
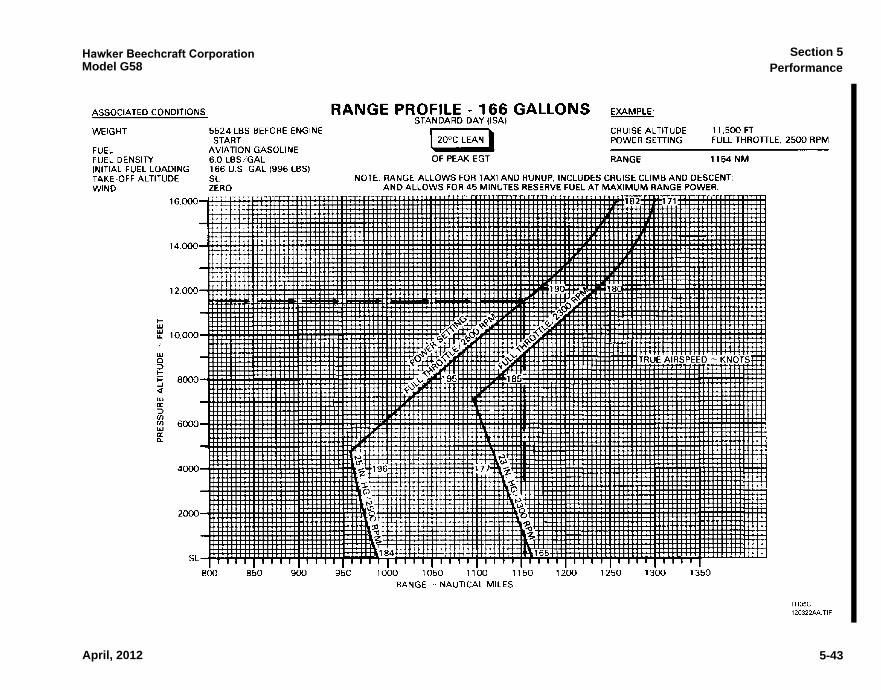
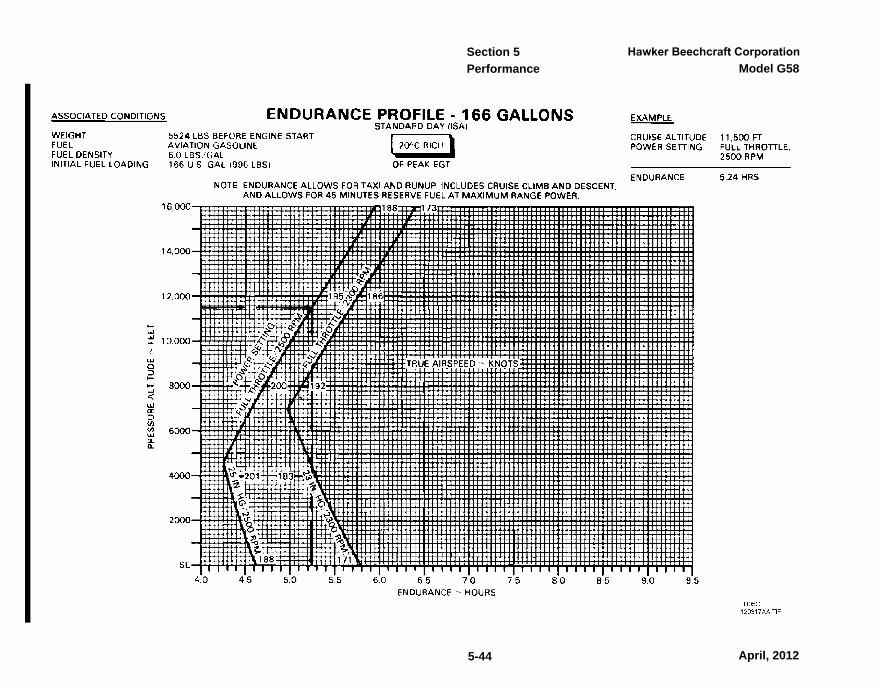
Cruise Speeds - Rich . . . Cruise Speeds - Lean . . . Range Profile - 166 GallonRange Profile - 166 GallonEndurance Profile - 166 GaEndurance Profile - 166 GaRange Profile - 194 GallonRange Profile - 194 Gallon
Model G58
5-3
SECTION 5PERFORMANCE
TABLE OF CONTENTS (CONT’D)
SUBJECT PAGE
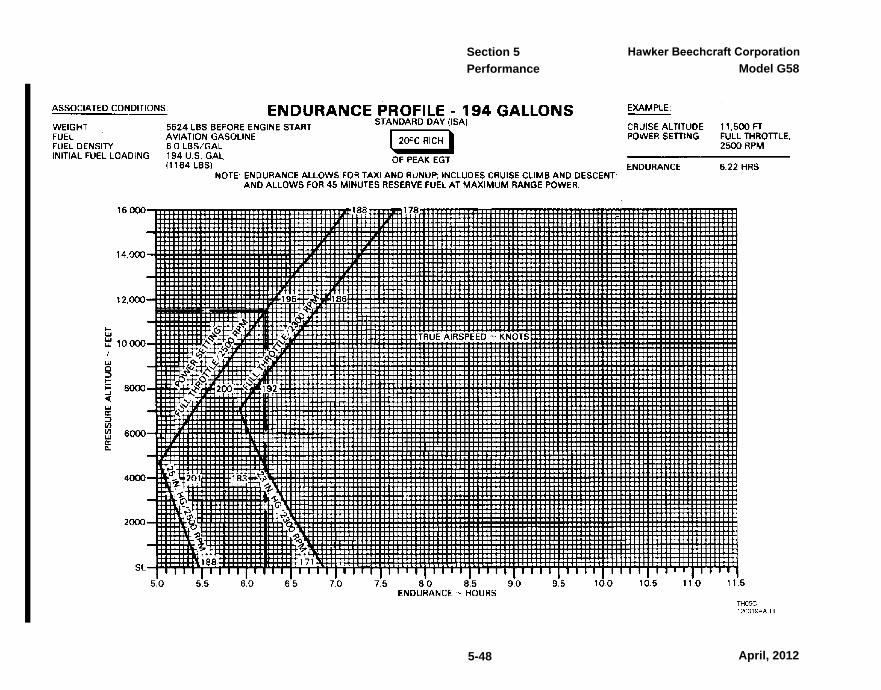
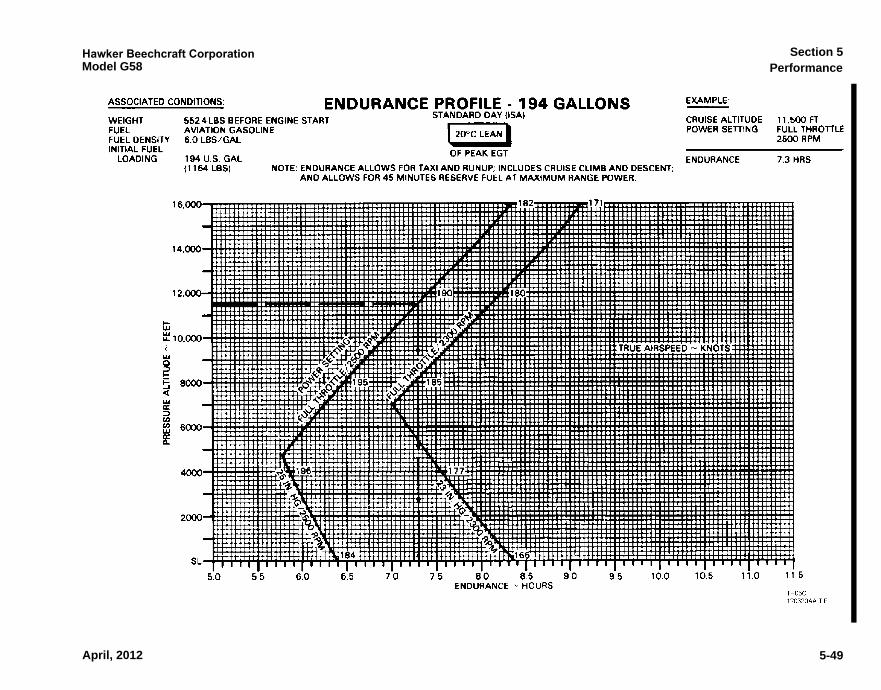
Endurance Profile - 194 Gallons - Rich . . . . . . . . . . . . . 5-48Endurance Profile - 194 Gallons - Lean . . . . . . . . . . . . . 5-49Holding Time . . . . . . . . . . . . . . . . . . . . . . . . . . . . . . . . . 5-50Time, Fuel, and Distance to Descend . . . . . . . . . . . . . . 5-51Climb - Balked Landing . . . . . . . . . . . . . . . . . . . . . . . . . 5-52Landing Distance . . . . . . . . . . . . . . . . . . . . . . . . . . . . . . 5-53
58-590000-67A9_sec05toc.fm Page 3 Wednesday, April 25, 2012 1:49 PM
April, 2012

Model G58
April, 2012
Section 5
IONALLY LEFT BLANK
Performance
58-590000-67A9_sec05toc.fm Page 4 Wednesday, April 25, 2012 1:49 PM
5-4
THIS PAGE INTENT

Section 5
sec05.fm Page 5 Monday, December 14, 2009 3:48 PM
PerformanceModel G58
Except as noted, all airspeeds quoted in this section are indi-cated airspeeds (IAS) and assume zero instrument error.
INTRODUCTION TO PERFORMANCE
The graphs and tables in this section present performanceinformation for flight planning at various parameters of weight,power, altitude and temperature. Examples have been pre-sented on all performance graphs.
PERFORMANCE IN ICING CONDITIONS 1. On a clean airplane (no ice build-up) stall speeds are
increased 4 knots in all configurations when surfacedeice boots are inflated.
2. Residual ice on the airplane can disrupt the airflow overlifting surfaces and may cause an increase in the stallspeeds and a change in the amount of warning providedby the stall warning vane.
3. The wings, stabilizers, and all control surfaces must becleared of frost, ice or snow prior to takeoff.
4. Ice accumulations on unprotected surfaces will decreaseclimb rates, cruise speeds, and range. Therefore, flightplanning should be accomplished for altitudes whereadequate performance margins exist.
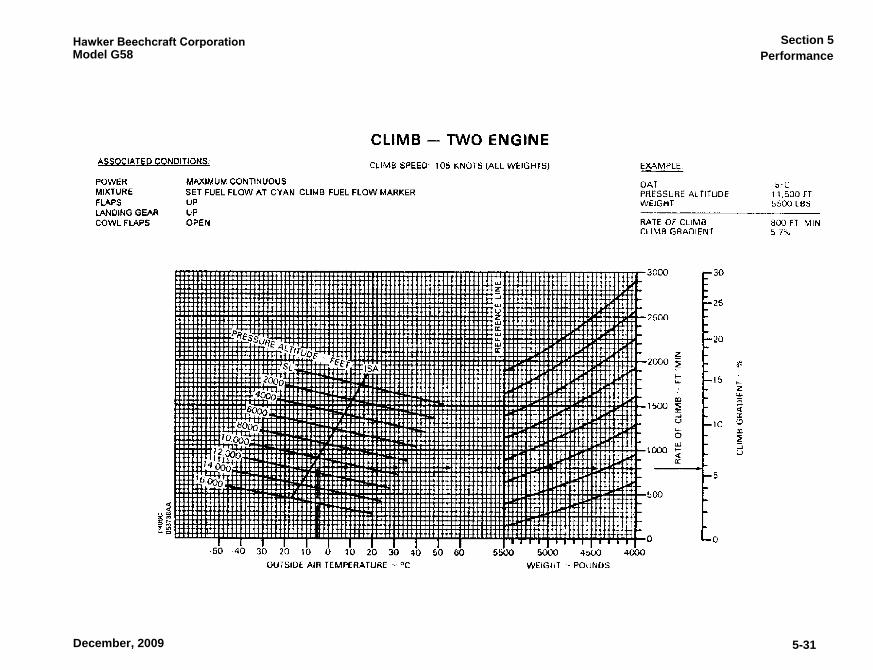
5. Two-engine climb performance at maximum continuouspower will be reduced due to the 130 KIAS minimumclimb speed.
6. The minimum recommended holding speed in icing con-ditions is 140 KIAS.
5-5December, 2009
Section 5
sec05.fm Page 6 Monday, December 14, 2009 3:48 PM
Performance Model G58
HOW TO USE THE GRAPHS1. In addition to presenting the answer for a particular set of
conditions, the example on the graph also presents theorder in which the various scales on the graph should beused. For instance, if the first item in the example isOAT, then enter the graph at the known OAT and pro-ceed to the remaining item(s) in the order given in theexample.
2. The reference lines indicate where to begin following theguidelines. Always project to the reference line first, thenfollow the guidelines to the next known item by maintain-ing the same PROPORTIONAL DISTANCE between theguideline above and guideline below the projected line.For instance, if the projected line intersects the referenceline in the ratio of 30% down/70% up between the guide-lines, then maintain this same 30%/70% relationshipbetween the guidelines all the way to the next knownitem or answer.
3. The associated conditions define the specific conditionsfrom which performance parameters have been deter-mined. They are not intended to be used as instructions;however, performance values determined from chartscan only be achieved if the specified conditions exist.
4. Indicated airspeeds (IAS) were obtained by using theAIRSPEED CALIBRATION-NORMAL SYSTEM graph.
5. The full amount of usable fuel is available for allapproved flight conditions.
5-6 December, 2009

Section 5
sec05.fm Page 7 Monday, December 14, 2009 3:48 PM
PerformanceModel G58
EXAMPLE CALCULATIONS
The calculations for flight time, block speed and fuel requiredfor a proposed flight are listed below:
CONDITIONS
At Departure: Outside Air Temperature . . . . . . . . . . . . . . . . . . . .15°C (59°F) Field Elevation. . . . . . . . . . . . . . . . . . . . . . . . . . . . . . .5333 ft Altimeter Setting . . . . . . . . . . . . . . . . . . . . . . . . .29.60 in. Hg Runway 26L Length . . . . . . . . . . . . . . . . . . . . . . . . 10,004 ft Wind . . . . . . . . . . . . . . . . . . . . . . . . . . . . . . . . 300° at 13 kts
At Destination: Outside Air Temperature . . . . . . . . . . . . . . . . . . .25°C (77°F) Field Elevation. . . . . . . . . . . . . . . . . . . . . . . . . . . . . . .3605 ft Altimeter Setting . . . . . . . . . . . . . . . . . . . . . . . . .29.56 in. Hg Wind . . . . . . . . . . . . . . . . . . . . . . . . . . . . . . . . 190° at 12 kts Runway 22 Length . . . . . . . . . . . . . . . . . . . . . . . . . 13,502 ft
ROUTE SEGMENT
AVERAGE MAGNETIC COURSE
AVERAGE MAGNETIC VARIATION
DIST NM
WIND AT 11,500 FEET
DIR/KTS
OAT 11,500
FEET °C
LEG A 155° 12°E 51 010°/30 -5
LEG B 153° 12°E 40 010°/30 -5
LEG C 135° 12°E 74 100°/20 0
LEG D 132° 11°E 87 200°/20 9
LEG E 126° 10°E 70 200°/20 10
5-7December, 2009

Section 5
sec05.fm Page 8 Monday, December 14, 2009 3:48 PM
Performance Model G58
PRESSURE ALTITUDE
To determine pressure altitude at departure and destinationairports, add 1000 ft to field elevation for each 1.00 in. Hgbelow 29.92, and subtract 1000 ft from field elevation for each1.00 in. Hg above 29.92.
Pressure Altitude at Departure:
29.92 - 29.60 = 0.32 in. Hg 0.32 x 1000 = 320 ft
The Pressure Altitude at the departure airport is 320 ft abovethe field elevation.
5333 + 320 = 5653 ft
Pressure Altitude at Destination:
29.92 - 29.56 = 0.36 in. Hg
0.36 x 1000 = 360 ft
The Pressure Altitude at the destination airport is 360 ftabove the field elevation.
3605 + 360 = 3965 ft
NOTEFor flight planning, the difference betweencruise altitude and cruise pressure altitudehas been ignored.
TAKE-OFF WEIGHT
Maximum Allowable Take-off Weight = 5500 lbs
Ramp Weight = 5500 + 24 = 5524 lbs
NOTEFuel for start, taxi and run-up is normally 24lbs.
5-8 December, 2009
Section 5
sec05.fm Page 9 Monday, December 14, 2009 3:48 PM
PerformanceModel G58
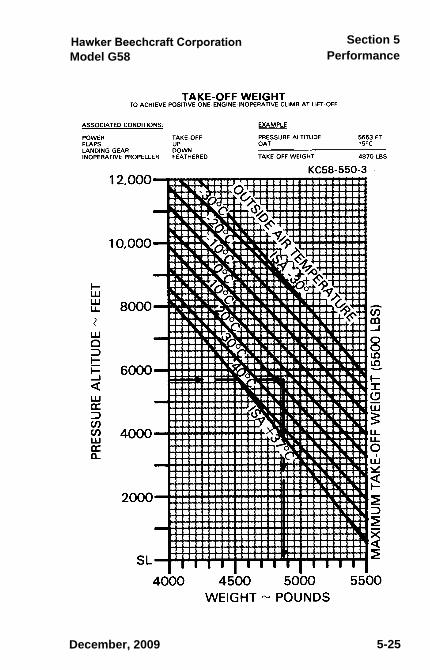
Enter the Take-Off Weight graph at 5653 ft pressure altitudeand 15°C, to determine the maximum take-off weight toachieve a positive one-engine-inoperative rate-of-climb at lift-off.
Take-off Weight = 4870 lbs
TAKE-OFF DISTANCE
Enter the Take-Off Distance graph at 15°C, 5653 ft pressurealtitude, 5500 lbs, and 10 knots headwind component: Ground Roll . . . . . . . . . . . . . . . . . . . . . . . . . . . . . . . .2200 ft Total Distance over 50-ft Obstacle . . . . . . . . . . . . . .3775 ft
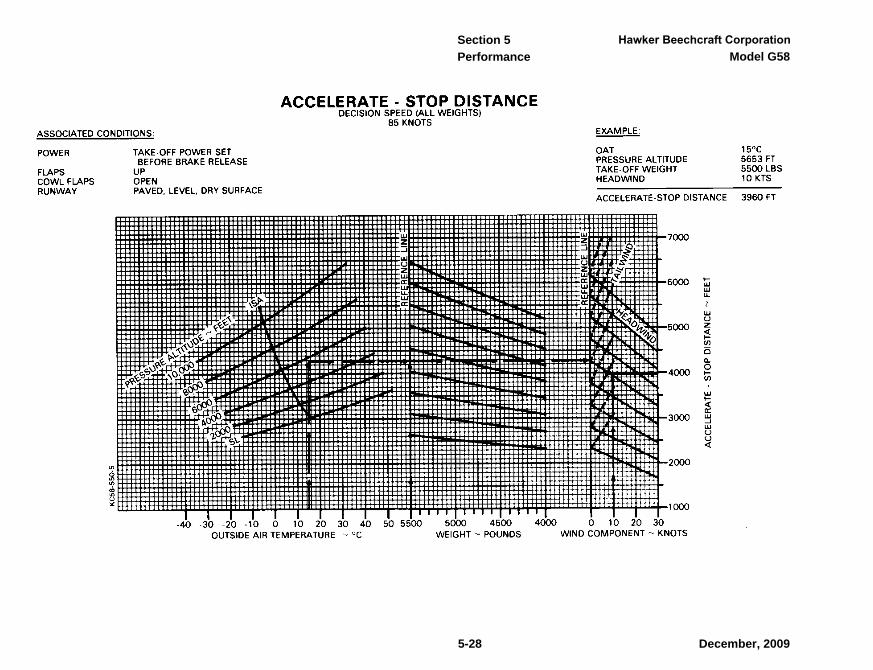
Enter the Accelerate-Stop graph at 15°C, 5653 ft pressure alti-tude, 5500 lbs, and 10 knots headwind component: Accelerate-Stop Distance . . . . . . . . . . . . . . . . . . . . .3960 ft
NOTESince 3960 ft is less than the available fieldlength of 10,004 ft, the accelerate-stop pro-cedure can be performed at any weight.
Take-off at 5500 lbs can be accomplished. However, if anengine failure occurs before becoming airborne, the acceler-ate-stop procedure must be performed.
The following example assumes the airplane is loaded so thatthe take-off weight is 4700 lbs.
Although not required by regulations, information has beenpresented to determine the take-off weight, field requirementsand take-off flight path assuming an engine failure occurs dur-ing the take-off procedure. The following illustrates the use ofthese graphs.
5-9December, 2009
Section 5
sec05.fm Page 10 Monday, December 14, 2009 3:48 PM
Performance Model G58
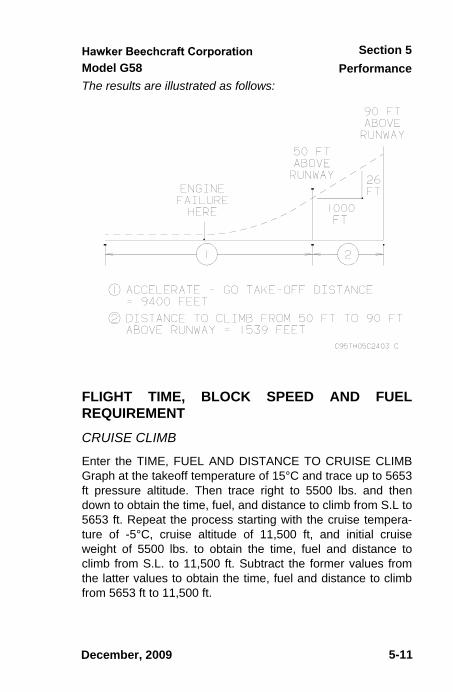
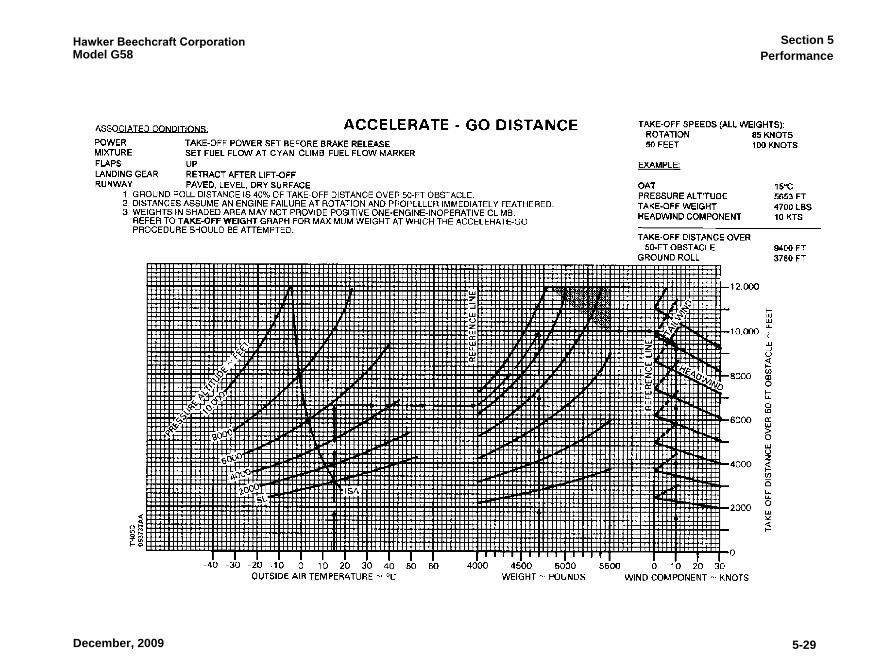
Enter the Accelerate-Go graph at 15°C, 5653 ft pressure alti-tude, 4700 lbs, and 10 knots headwind component: Total Distance Over 50-ft Obstacle . . . . . . . . . . . . . 9400 ft Ground Roll Distance. . . . . . . . . . . . . . . . . . . . . . . . 3760 ft
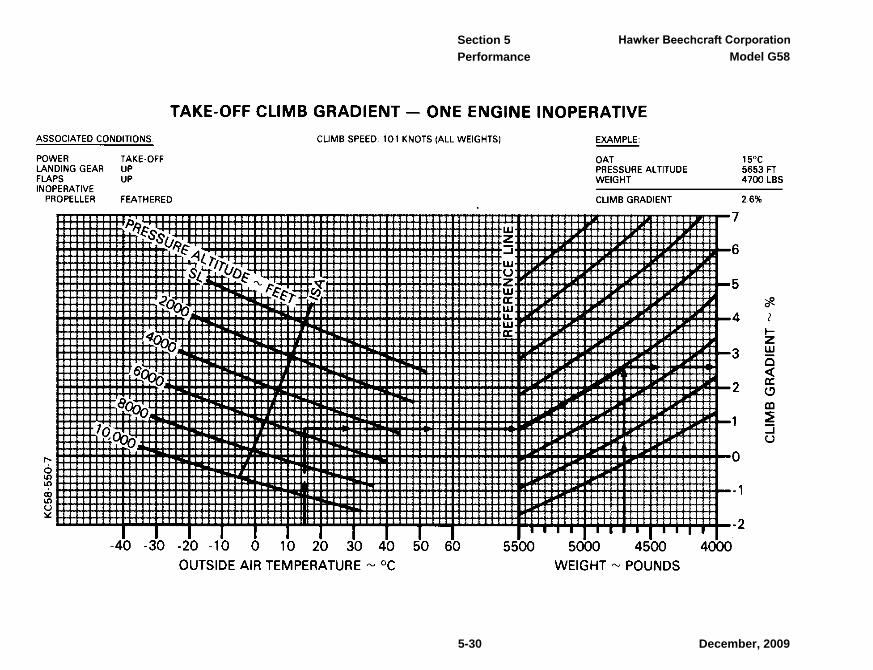
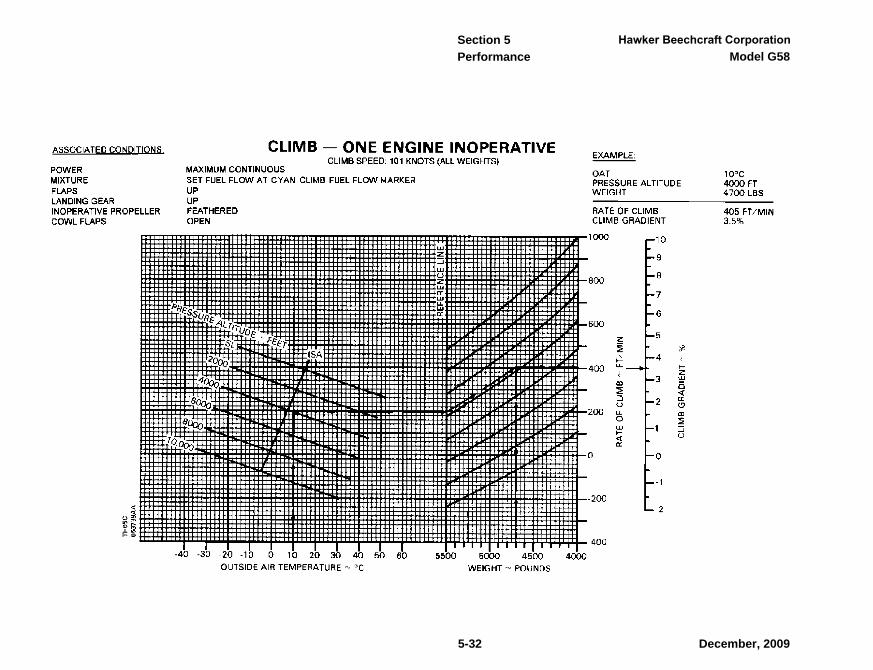
Enter the graph for Take-Off Climb Gradient - One-Engine-Inoperative at 15°C, 5653 ft pressure altitude, and 4700 lbs: Climb Gradient . . . . . . . . . . . . . . . . . . . . . . . . . . . . . . . 2.6%
A 2.6% climb gradient is 26 ft of vertical height per 1000 ft ofhorizontal distance.
NOTEThe Take-off Climb Gradient - One-Engine-Inoperative graph assumes zero wind con-ditions. Climbing into a headwind will resultin higher angles of climb, and hence, betterobstacle clearance capabilities.
Calculation of horizontal distance to clear an obstacle 90 ftabove the runway surface: Horizontal distance used to climb from 50 ft to 90 ft = (90-50) X (1000 ÷ 26) = 1539 ft Total Distance = 9400 + 1539 = 10,939 ft
5-10 December, 2009
Section 5
58-590000-67A9_sec05.fm Page 11 Wednesday, April 25, 2012 1:44 PM
PerformanceModel G58
The results are illustrated as follows:
FLIGHT TIME, BLOCK SPEED AND FUELREQUIREMENT
CRUISE CLIMB
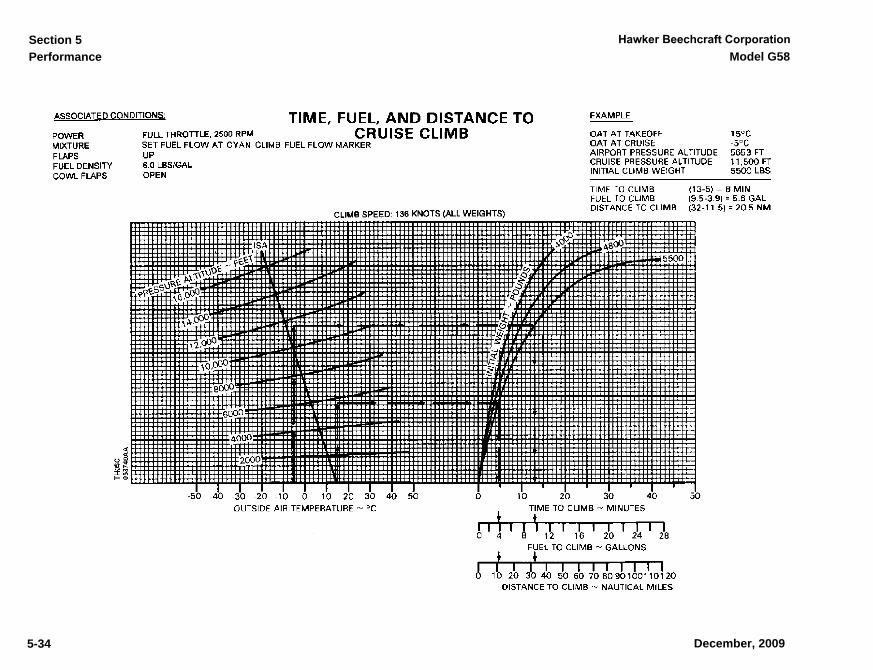
Enter the TIME, FUEL AND DISTANCE TO CRUISE CLIMBGraph at the takeoff temperature of 15°C and trace up to 5653ft pressure altitude. Then trace right to 5500 lbs. and thendown to obtain the time, fuel, and distance to climb from S.L to5653 ft. Repeat the process starting with the cruise tempera-ture of -5°C, cruise altitude of 11,500 ft, and initial cruiseweight of 5500 lbs. to obtain the time, fuel and distance toclimb from S.L. to 11,500 ft. Subtract the former values fromthe latter values to obtain the time, fuel and distance to climbfrom 5653 ft to 11,500 ft.
5-11
Document Date
5-11
December, 2009
Section 5
58-590000-67A9_sec05.fm Page 12 Thursday, April 26, 2012 9:26 AM
Performance Model G58
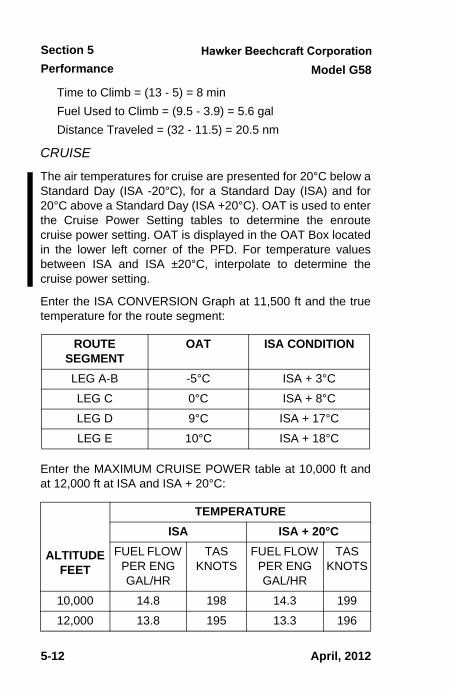
Time to Climb = (13 - 5) = 8 min Fuel Used to Climb = (9.5 - 3.9) = 5.6 gal Distance Traveled = (32 - 11.5) = 20.5 nm
CRUISE
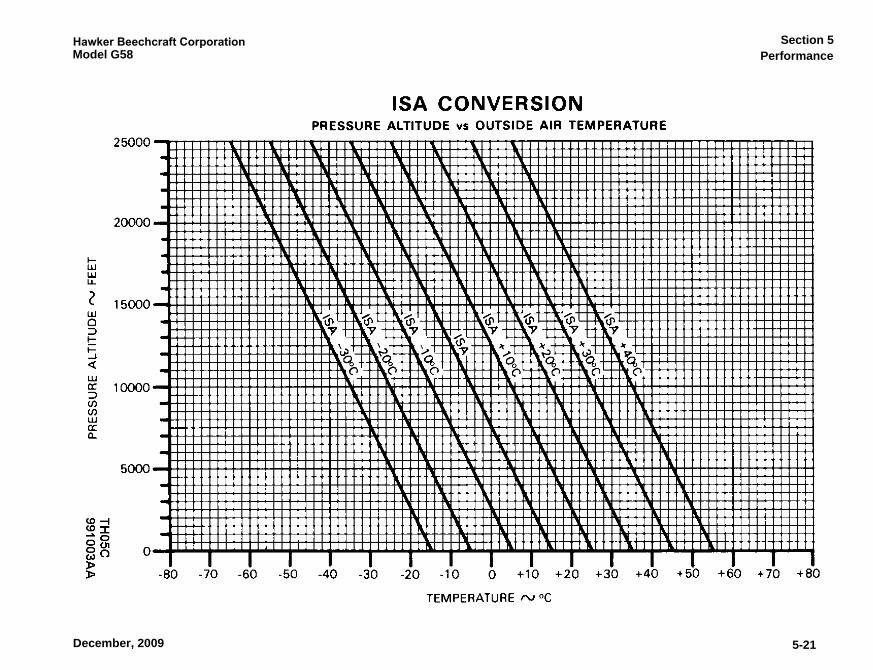
The air temperatures for cruise are presented for 20°C below aStandard Day (ISA -20°C), for a Standard Day (ISA) and for20°C above a Standard Day (ISA +20°C). OAT is used to enterthe Cruise Power Setting tables to determine the enroutecruise power setting. OAT is displayed in the OAT Box locatedin the lower left corner of the PFD. For temperature valuesbetween ISA and ISA ±20°C, interpolate to determine thecruise power setting.
Enter the ISA CONVERSION Graph at 11,500 ft and the truetemperature for the route segment:
Enter the MAXIMUM CRUISE POWER table at 10,000 ft andat 12,000 ft at ISA and ISA + 20°C:
ROUTE SEGMENT
OAT ISA CONDITION
LEG A-B -5°C ISA + 3°C
LEG C 0°C ISA + 8°C
LEG D 9°C ISA + 17°C
LEG E 10°C ISA + 18°C
ALTITUDE FEET
TEMPERATURE
ISA ISA + 20°C
FUEL FLOW PER ENG GAL/HR
TASKNOTS
FUEL FLOW PER ENG GAL/HR
TASKNOTS
10,000 14.8 198 14.3 199
12,000 13.8 195 13.3 196
5 - 12
Document Date
5-12
April, 2012
Section 5
sec05.fm Page 13 Monday, December 14, 2009 3:48 PM
PerformanceModel G58
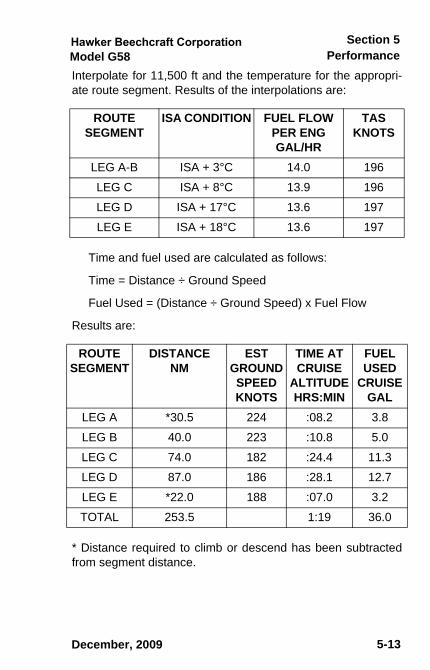
Interpolate for 11,500 ft and the temperature for the appropri-ate route segment. Results of the interpolations are:
Time and fuel used are calculated as follows:
Time = Distance ÷ Ground Speed
Fuel Used = (Distance ÷ Ground Speed) x Fuel Flow
Results are:
* Distance required to climb or descend has been subtractedfrom segment distance.
ROUTESEGMENT
ISA CONDITION FUEL FLOW PER ENG GAL/HR
TASKNOTS
LEG A-B ISA + 3°C 14.0 196
LEG C ISA + 8°C 13.9 196
LEG D ISA + 17°C 13.6 197
LEG E ISA + 18°C 13.6 197
ROUTE SEGMENT
DISTANCENM
EST GROUND SPEEDKNOTS
TIME AT CRUISE
ALTITUDEHRS:MIN
FUEL USED
CRUISEGAL
LEG A *30.5 224 :08.2 3.8
LEG B 40.0 223 :10.8 5.0
LEG C 74.0 182 :24.4 11.3
LEG D 87.0 186 :28.1 12.7
LEG E *22.0 188 :07.0 3.2
TOTAL 253.5 1:19 36.0
5-13December, 2009

Performance Model G58
Section 5
5-14
DESCENT
Enter the TIME, FUEL, and DISTANCE TO DESCEND Graphat the cruise pressure altitude of 11,500 ft and trace right to thereference line. Then trace down to obtain the time, fuel, anddistance to descend to S.L. Repeat the process starting withdestination field pressure altitude of 3965 ft. to obtain the time,fuel and distance to descend from 3965 ft to S.L. Subtract theformer values from the latter values to obtain the time, fuel anddistance to descend from 11,500 ft. to 3695 ft.
Time to Descend = (23 - 7.8) = 15.2 min
Fuel Used to Descend = (8.7 - 2.8) = 5.9 gal
Descent Distance = (70 - 22) = 48 NM
TIME - FUEL - DISTANCE SUMMARY
Total Flight Time: 1 hour, 42.2 min
Block Speed: 322 NM ÷ 1 hour, 42.2 min = 189 kts
RESERVE FUEL
Enter the ECONOMY CRUISE POWER table at ISA and ISA +20°C at 10,000 ft and 12,000 ft. Interpolate to find the FuelFlow at 11,500 ft at ISA + 18°C:
ITEM TIMEHRS:MINS
FUELGAL
DISTANCENM
Start, Runup, Taxi, and Take-off acceleration
0:00 4.5 0
Climb 0:08.0 5.6 20.5
Cruise 1:19.0 36.0 253.5
Descent 0:15.2 5.9 48.0
Total 1:42.2 52.0 322.0
December, 2009
sec05.fm Page 14 Monday, December 14, 2009 3:48 PM
PerformanceSection 5
Model G58
5-15
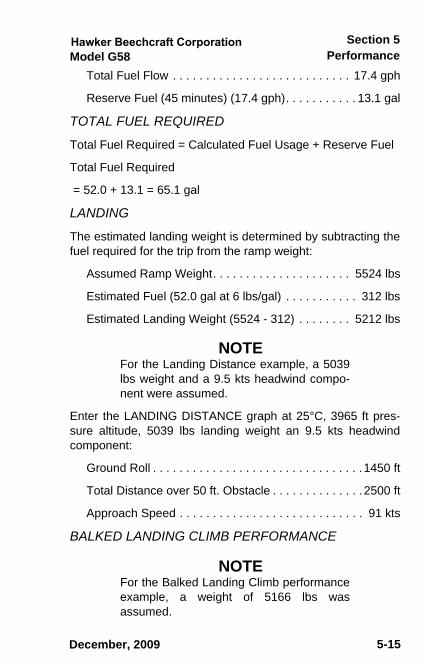
Total Fuel Flow . . . . . . . . . . . . . . . . . . . . . . . . . . . 17.4 gph
Reserve Fuel (45 minutes) (17.4 gph). . . . . . . . . . . 13.1 gal
TOTAL FUEL REQUIRED
Total Fuel Required = Calculated Fuel Usage + Reserve Fuel
Total Fuel Required
= 52.0 + 13.1 = 65.1 gal
LANDING
The estimated landing weight is determined by subtracting thefuel required for the trip from the ramp weight:
Assumed Ramp Weight. . . . . . . . . . . . . . . . . . . . . 5524 lbs
Estimated Fuel (52.0 gal at 6 lbs/gal) . . . . . . . . . . . 312 lbs
Estimated Landing Weight (5524 - 312) . . . . . . . . 5212 lbs
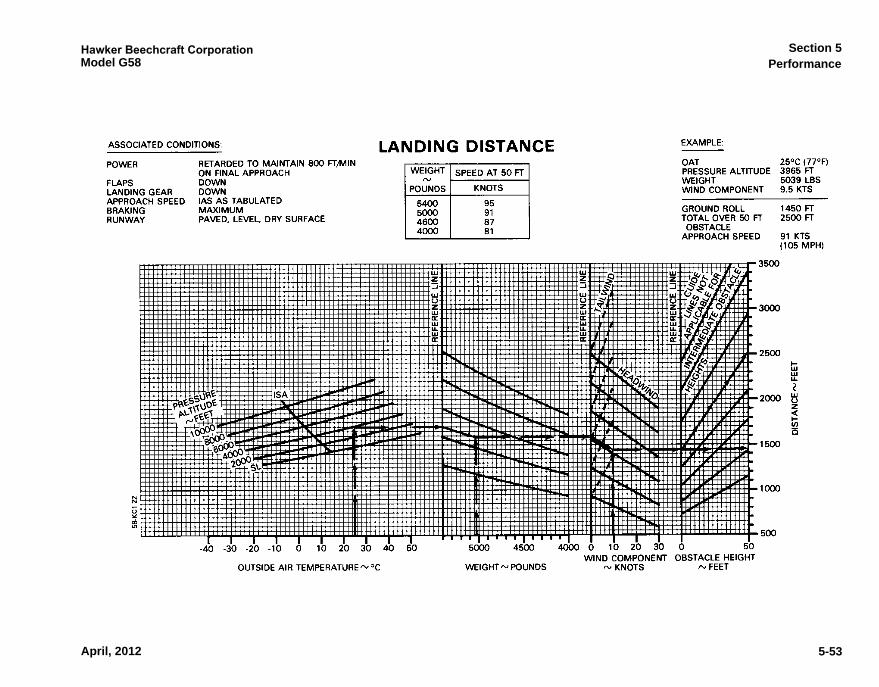
NOTEFor the Landing Distance example, a 5039lbs weight and a 9.5 kts headwind compo-nent were assumed.
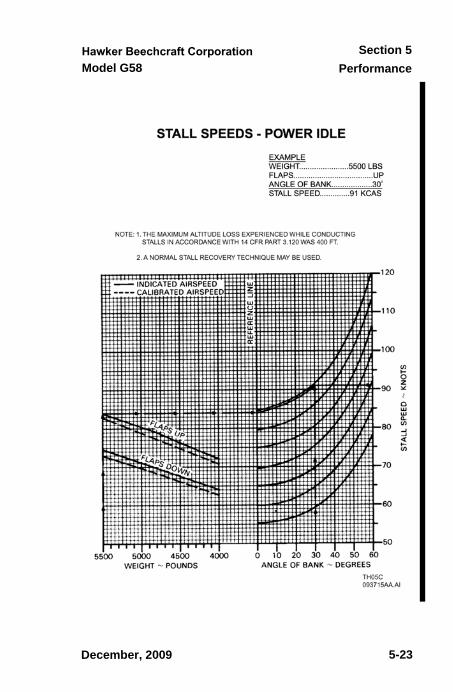
Enter the LANDING DISTANCE graph at 25°C, 3965 ft pres-sure altitude, 5039 lbs landing weight an 9.5 kts headwindcomponent:
Ground Roll . . . . . . . . . . . . . . . . . . . . . . . . . . . . . . . .1450 ft
Total Distance over 50 ft. Obstacle . . . . . . . . . . . . . .2500 ft
Approach Speed . . . . . . . . . . . . . . . . . . . . . . . . . . . . 91 kts
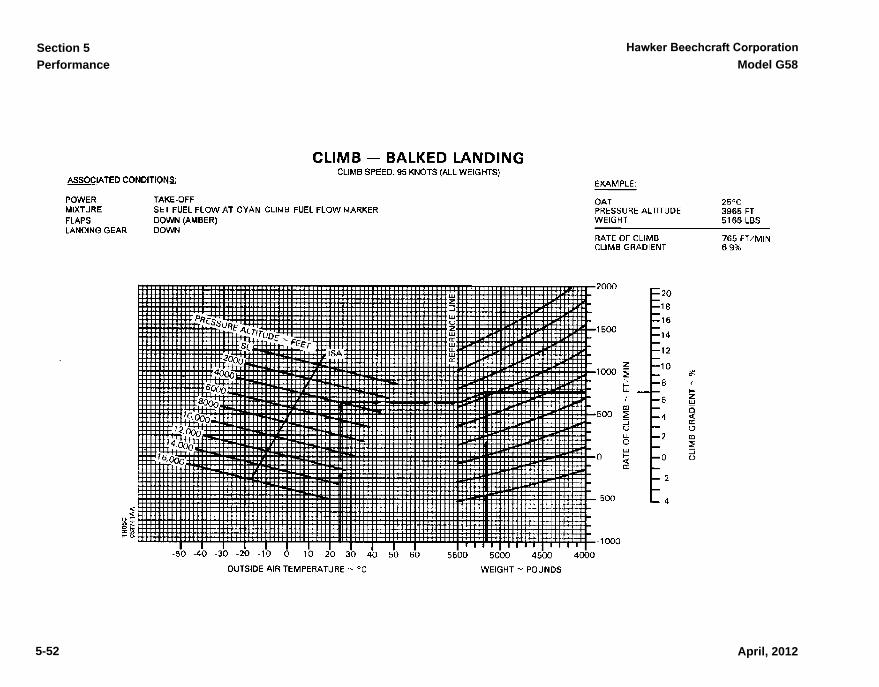
BALKED LANDING CLIMB PERFORMANCE
NOTEFor the Balked Landing Climb performanceexample, a weight of 5166 lbs wasassumed.
December, 2009
sec05.fm Page 15 Monday, December 14, 2009 3:48 PM
Performance Model G58
Section 5
5-16
Enter the CLIMB-BALKED LANDING graph at 25°C, 3965 ftpressure altitude and 5166 lbs:
Rate-of-Climb. . . . . . . . . . . . . . . . . . . . . . . . . . . . 765 ft/min
Climb Gradient . . . . . . . . . . . . . . . . . . . . . . . . . . . . . . . 6.9%
December, 2009
sec05.fm Page 16 Monday, December 14, 2009 3:48 PM

PerformanceSection 5
Model G58
5-17December, 2009
sec05fo.fm Page 1 Monday, December 14, 2009 3:51 PM
Performance Model G58Section 5
5-18 December, 2009
sec05fo.fm Page 2 Monday, December 14, 2009 3:51 PM
PerformanceSection 5
Model G58
5-19December, 2009
sec05fo.fm Page 3 Monday, December 14, 2009 3:51 PM
Performance Model G58Section 5
5-20 December, 2009
sec05fo.fm Page 4 Monday, December 14, 2009 3:51 PM
PerformanceSection 5
Model G58
5-21December, 2009
sec05fo.fm Page 5 Monday, December 14, 2009 3:51 PM

Performance Model G58Section 5
December, 2009
sec05fo.fm Page 6 Monday, December 14, 2009 3:51 PM
5-22
Section 5
58-590000-67A9_sec05.fm Page 23 Wednesday, April 25, 2012 1:44 PM
PerformanceModel G58
5-23
Document Date
5-23
December, 2009
Performance Model G58Section 5
April, 20125-24
58-590000-67A9_sec05fo_greg3.fm Page 7 Wednesday, April 25, 2012 1:48 PM
PerformanceSection 5
Model G58
5-25December, 2009
sec05.fm Page 25 Monday, December 14, 2009 3:48 PM
Performance Model G58
Section 5
5-26 December, 2009
sec05.fm Page 26 Monday, December 14, 2009 3:48 PM

PerformanceSection 5
Model G58
5-27December, 2009
sec05fo.fm Page 11 Monday, December 14, 2009 3:53 PM
Performance Model G58Section 5
December, 2009
sec05fo.fm Page 12 Monday, December 14, 2009 3:53 PM
5-28
PerformanceSection 5
Model G58
5-29December, 2009
sec05fo.fm Page 13 Monday, December 14, 2009 3:53 PM
Performance Model G58Section 5
December, 2009
sec05fo.fm Page 14 Monday, December 14, 2009 3:53 PM
5-30
PerformanceSection 5
Model G58
5-31December, 2009
sec05fo.fm Page 15 Monday, December 14, 2009 3:53 PM
Performance Model G58Section 5
December, 2009
sec05fo.fm Page 16 Monday, December 14, 2009 3:53 PM
5-32
Section 5
sec05.fm Page 33 Monday, December 14, 2009 3:48 PM
PerformanceModel G58
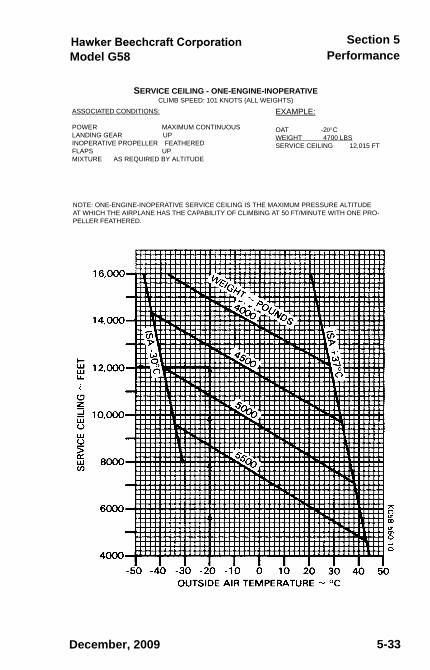
SERVICE CEILING - ONE-ENGINE-INOPERATIVECLIMB SPEED: 101 KNOTS (ALL WEIGHTS)
ASSOCIATED CONDITIONS:
POWER MAXIMUM CONTINUOUSLANDING GEAR UPINOPERATIVE PROPELLER FEATHEREDFLAPS UPMIXTURE AS REQUIRED BY ALTITUDE
EXAMPLE:
OAT -2CWEIGHT 4700 LBSSERVICE CEILING 12,015 FT
NOTE: ONE-ENGINE-INOPERATIVE SERVICE CEILING IS THE MAXIMUM PRESSURE ALTITUDE AT WHICH THE AIRPLANE HAS THE CAPABILITY OF CLIMBING AT 50 FT/MINUTE WITH ONE PRO-PELLER FEATHERED.
5-33December, 2009
Performance Model G58Section 5
5-34 December, 2009
sec05fo.fm Page 18 Monday, December 14, 2009 3:53 PM
Section 5
58-590000-67A9_sec05.fm Page 35 Wednesday, April 25, 2012 1:44 PM
PerformanceModel G58
THIS PAGE INTENTIONALLY LEFT BLANK
5-35
Document Date
5-35
December, 2009
Section 5
58-590000-67A9_sec05.fm Page 36 Wednesday, April 25, 2012 1:44 PM
Performance Model G58
TH05C120028AA.AI
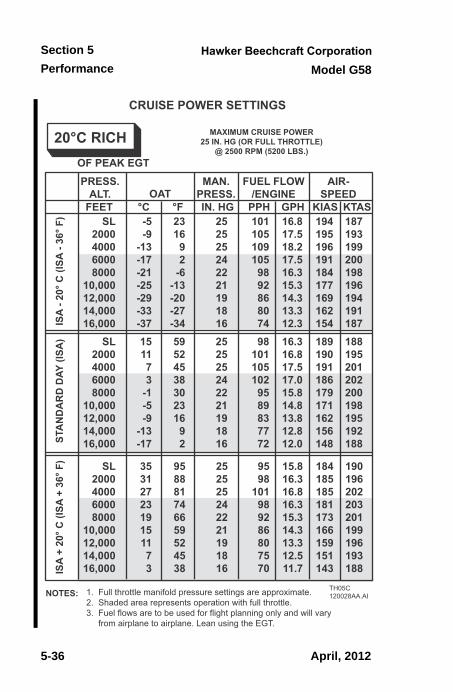
CRUISE POWER SETTINGS
MAXIMUM CRUISE POWER25 IN. HG (OR FULL THROTTLE)
@ 2500 RPM (5200 LBS.)
ISA
- 20°
C (I
SA -
36° F
)ST
AN
DA
RD
DAY
(ISA
)IS
A +
20° C
(ISA
+ 3
6° F
)
20°C RICH
SL2000400060008000
10,00012,00014,00016,000
SL2000400060008000
10,00012,00014,00016,000
SL2000400060008000
10,00012,00014,00016,000
187193199200198196194191187188195201202200198195192188
190196202203201199196193188
194195196191184177169162154189190191186179171162156148
184185185181173166159151143
101105109105
989286807498
101105102
9589837772
9598
101989286807570
252525242221191816252525242221191816
252525242221191816
2316
92
-6-13-20-27-3459524538302316
92
958881746659524538
-5-9
-13-17-21-25-29-33-37151173
-1-5-9
-13-17
3531272319151173
PRESS.ALT.
MAN.PRESS.OAT
FUEL FLOW/ENGINE
AIR-SPEED
OF PEAK EGT
FEET °C °F IN. HG PPH GPH KIAS KTAS
NOTES: 1. Full throttle manifold pressure settings are approximate.2. Shaded area represents operation with full throttle.3. Fuel flows are to be used for flight planning only and will vary from airplane to airplane. Lean using the EGT.
16.817.518.217.516.315.314.313.312.316.316.817.517.015.814.813.812.812.0
15.816.316.816.315.314.313.312.511.7
5 - 36
Document Date
5-36
April, 2012
Section 5
58-590000-67A9_sec05.fm Page 37 Wednesday, April 25, 2012 1:44 PM
PerformanceModel G58
TH05C120029AA.AI
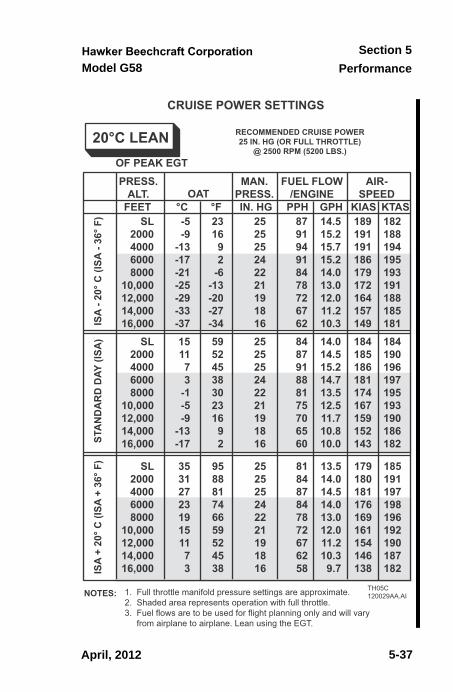
CRUISE POWER SETTINGS
RECOMMENDED CRUISE POWER25 IN. HG (OR FULL THROTTLE)
@ 2500 RPM (5200 LBS.)
ISA
- 20°
C (I
SA -
36° F
)ST
AN
DA
RD
DAY
(ISA
)IS
A +
20° C
(ISA
+ 3
6° F
)
20°C LEAN
SL2000400060008000
10,00012,00014,00016,000
SL2000400060008000
10,00012,00014,00016,000
SL2000400060008000
10,00012,00014,00016,000
182188194195193191188185181184190196197195193190186182
185191197198196192190187182
189191191186179172164157149184185186181174167159152143
179180181176169161154146138
879194918478726762848791888175706560
818487847872676258
252525242221191816252525242221191816
252525242221191816
2316
92
-6-13-20-27-3459524538302316
92
958881746659524538
-5-9
-13-17-21-25-29-33-37151173
-1-5-9
-13-17
3531272319151173
PRESS.ALT.
MAN.PRESS.OAT
FUEL FLOW/ENGINE
AIR-SPEED
OF PEAK EGT
FEET °C °F IN. HG PPH GPH KIAS KTAS
NOTES: 1. Full throttle manifold pressure settings are approximate.2. Shaded area represents operation with full throttle.3. Fuel flows are to be used for flight planning only and will vary from airplane to airplane. Lean using the EGT.
14.515.215.715.214.013.012.011.210.314.014.515.214.713.512.511.710.810.0
13.514.014.514.013.012.011.210.3
9.7
5-37
Document Date
5-37
April, 2012

Performance Model G58
Section 5
5 - 38
Document Date
5-38
TH05C120030AA.AI
CRUISE POWER SETTINGS
RECOMMENDED CRUISE POWER23 IN. HG (OR FULL THROTTLE)
@ 2300 RPM (5200 LBS.)
ISA
- 20°
C (I
SA -
36° F
)ST
AN
DA
RD
DAY
(ISA
)IS
A +
20° C
(ISA
+ 3
6° F
)
20°C RICH
SL2000400060008000
10,00012,00014,00016,000
SL2000400060008000
10,00012,00014,00016,000
SL2000400060008000
10,00012,00014,00016,000
170176182188190188185182178171177183190192189186183178
171178184191193190187182178
176178179180177169162154146171173174175171164156149140
166168169169166159151143135
818487918984787368787985888781767166
767982858478736864
232323232221191817232323232221191817
232323232221191817
2316
92
-6-13-20-27-3459524538302316
92
958881746659524538
-5-9
-13-17-21-25-29-33-37151173
-1-5-9
-13-17
3531272319151173
PRESS.ALT.
MAN.PRESS.OAT
FUEL FLOW/ENGINE
AIR-SPEED
OF PEAK EGT
FEET °C °F IN. HG PPH GPH KIAS KTAS
NOTES: 1. Full throttle manifold pressure settings are approximate.2. Shaded area represents operation with full throttle.3. Fuel flows are to be used for flight planning only and will vary from airplane to airplane. Lean using the EGT.
13.514.014.515.214.814.013.012.211.313.013.514.214.714.513.512.711.811.0
12.713.213.714.214.013.012.211.310.7
April, 2012
58-590000-67A9_sec05.fm Page 38 Wednesday, April 25, 2012 1:44 PM
Performance
Section 5
Model G58
5-39
Document Date
5-39
TH05C120031AA.AI
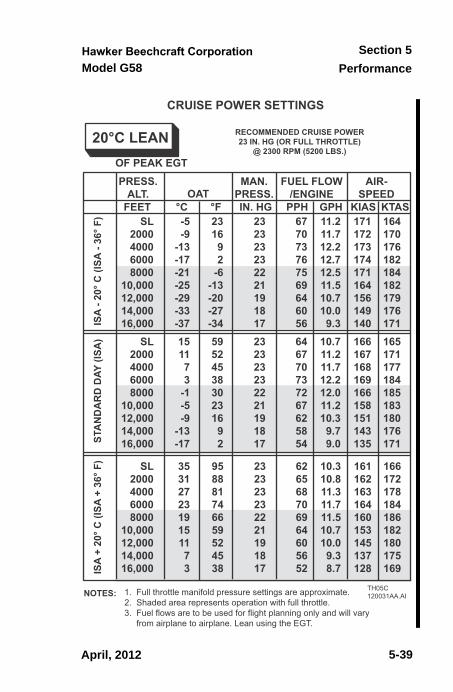
CRUISE POWER SETTINGS
RECOMMENDED CRUISE POWER23 IN. HG (OR FULL THROTTLE)
@ 2300 RPM (5200 LBS.)
ISA
- 20°
C (I
SA -
36° F
)ST
AN
DA
RD
DAY
(ISA
)IS
A +
20° C
(ISA
+ 3
6° F
)
20°C LEAN
SL2000400060008000
10,00012,00014,00016,000
SL2000400060008000
10,00012,00014,00016,000
SL2000400060008000
10,00012,00014,00016,000
164170176182184182179176171165171177184185183180176171
166172178184186182180175169
171172173174171164156149140166167168169166158151143135
161162163164160153145137128
677073767569646056646770737267625854
626568706964605652
232323232221191817232323232221191817
232323232221191817
2316
92
-6-13-20-27-3459524538302316
92
958881746659524538
-5-9
-13-17-21-25-29-33-37151173
-1-5-9
-13-17
3531272319151173
PRESS.ALT.
MAN.PRESS.OAT
FUEL FLOW/ENGINE
AIR-SPEED
OF PEAK EGT
FEET °C °F IN. HG PPH GPH KIAS KTAS
NOTES: 1. Full throttle manifold pressure settings are approximate.2. Shaded area represents operation with full throttle.3. Fuel flows are to be used for flight planning only and will vary from airplane to airplane. Lean using the EGT.
11.211.712.212.712.511.510.710.0
9.310.711.211.712.212.011.210.3
9.79.0
10.310.811.311.711.510.710.0
9.38.7
April, 2012
58-590000-67A9_sec05.fm Page 39 Wednesday, April 25, 2012 1:44 PM
Performance Model G58
Section 5
5 - 40
Document Date
5-40
April, 2012
58-590000-67A9_sec05.fm Page 40 Wednesday, April 25, 2012 1:44 PM

Performance
Section 5
Model G58
5-41
Document Date
5-41
April, 2012
58-590000-67A9_sec05.fm Page 41 Wednesday, April 25, 2012 1:44 PM
Performance Model G58Section 5
April, 20125-42
58-590000-67A9_sec05fo_greg3.fm Page 15 Wednesday, April 25, 2012 1:48 PM
PerformanceSection 5
Model G58
5-43
58-590000-67A9_sec05fo_greg3.fm Page 16 Wednesday, April 25, 2012 1:48 PM
April, 2012
Performance Model G58Section 5
April, 20125-44
58-590000-67A9_sec05fo_greg3.fm Page 17 Wednesday, April 25, 2012 1:48 PM
PerformanceSection 5
Model G58
5-45
58-590000-67A9_sec05fo_greg3.fm Page 18 Wednesday, April 25, 2012 1:48 PM
April, 2012

Performance Model G58Section 5
April, 2012
58-590000-67A9_sec05fo_greg3.fm Page 19 Wednesday, April 25, 2012 1:48 PM
5-46
PerformanceSection 5
Model G58
5-47
58-590000-67A9_sec05fo_greg3.fm Page 20 Wednesday, April 25, 2012 1:48 PM
April, 2012
Performance Model G58Section 5
April, 20125-48
58-590000-67A9_sec05fo_greg3.fm Page 21 Wednesday, April 25, 2012 1:48 PM
PerformanceSection 5
Model G58
5-49
58-590000-67A9_sec05fo_greg3.fm Page 22 Wednesday, April 25, 2012 1:48 PM
April, 2012
Performance Model G58
Section 5
Document Date
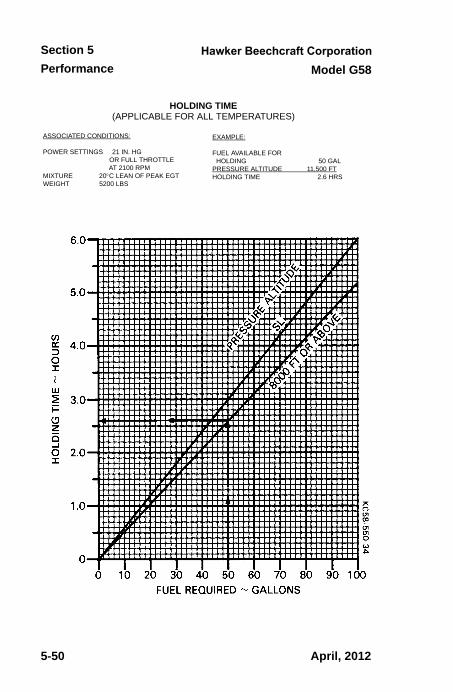
HOLDING TIME(APPLICABLE FOR ALL TEMPERATURES)
ASSOCIATED CONDITIONS:
POWER SETTINGS 21 IN. HGOR FULL THROTTLEAT 2100 RPM
MIXTURE 20C LEAN OF PEAK EGTWEIGHT 5200 LBS
EXAMPLE:
FUEL AVAILABLE FORHOLDING 50 GAL
PRESSURE ALTITUDE 11,500 FTHOLDING TIME 2.6 HRS
April, 2012
58-590000-67A9_sec05.fm Page 50 Wednesday, April 25, 2012 1:44 PM
5 - 50
5-50

Performance
Section 5
Model G58
5-51
5-51
58-590000-67A9_sec05.fm Page 51 Wednesday, April 25, 2012 1:44 PM
Document Date
April, 2012
Performance Model G58Section 5
April, 2012
58-590000-67A9_sec05fo_greg3.fm Page 23 Wednesday, April 25, 2012 1:48 PM
5-52
PerformanceSection 5
Model G58
5-53
58-590000-67A9_sec05fo_greg3.fm Page 24 Wednesday, April 25, 2012 1:48 PM
April, 2012
Performance Model G58
Section 5
Document Date
THIS PAGE INTENTIONALLY LEFT BLANK
April, 2012
58-590000-67A9_sec05.fm Page 54 Wednesday, April 25, 2012 1:44 PM
5 - 54
5-54