Embed Size (px)
Citation preview

Scheduling strategies for LTE uplink with flowbehaviour analysis
D. C. Dimitrova1, H. van den Berg,1,2, R. Litjens2, G. Heijenk1
1 University of Twente, Postbus 217, 7500 AE Enschede, The Netherlands,{d.c.dimitrova,geert.heijenk}@ewi.utwente.nl
2 TNO ICT, The Netherlands,{j.l.vandenBerg,remco.litjens}@tno.nl
Abstract. Long Term Evolution (LTE) is a cellular technology developed to sup-port diversity of data traffic at potentially high rates. It is foreseen to extend thecapacity and improve the performance of current 3G cellular networks. A keymechanism in the LTE traffic handling is the packet scheduler, which is in chargeof allocating resources to active flows in both the frequency and time dimension.In this paper we present a performance comparison of two distinct schedulingschemes for LTE uplink (fair fixed assignment and fair work-conserving) tak-ing into account both packet level characteristics and flow level dynamics dueto the random user behaviour. For that purpose, we apply a combined analyti-cal/simulation approach which enables fast evaluation of performance measuressuch as mean flow transfer times manifesting the impact of resource allocationstrategies. The results show that the resource allocation strategy has a crucialimpact on performance and that some trends are observed only if flow level dy-namics are considered.
1 Introduction
The 3rd Generation Partnership Project (3GPP) just recently finalized the standardiza-tion of the UTRA Long Term Evolution (LTE) with Orthogonal Frequency DivisionMultiple Access (OFDMA) as the core access technology. One of the key mechanismsfor realizing the potential efficiency of this technology is the packet scheduler, whichcoordinates the access to the shared channel resources. In OFDMA-based LTE systemsthis coordination refers to both the time dimension (allocation of time frames) and thefrequency dimension (allocation of subcarriers). These two grades of freedom, togetherwith particular system constraints, make scheduling in LTE a challenging optimizationproblem, see [5].
Most research on LTE scheduling has been treating the downlink scenario, someexamples being [8, 14]. Considerably less work has been dedicated to the uplink, wherethe transmit power constraint of the mobile equipment plays an important role. TheLTE uplink scheduling problem can in general be formulated as a utility optimizationproblem, see e.g. [4, 7, 11]. The complexity of this optimization problem depends ofcourse on the utility function that is considered (mostly aggregated throughput maxi-mization). Still other aspects, among which fairness requirements (e.g. short- or long-term throughput fairness) and specific system characteristics (e.g. regarding fast fading,

multiple antennas), when taken into account [6, 9, 10, 12] have shown to influence thecomplexity of the problem. As the optimal solutions would mostly be too complex forpractical implementation the proposed scheduling algorithms are often based on heuris-tics yielding reasonable system performance under practical circumstances, see e.g. [2,15].
Most papers consider the performance (resulting throughputs) of newly proposedscheduling schemes for scenarios with a fixed number of active users in the system (splitup in different user classes depending on their channel characteristics). Studies that takeinto account the randomness of user behaviour, leading to a time varying number ofongoing flow transfers, are lacking. Filling this gap, in the present paper we study theperformance of different LTE uplink scheduling schemes for scenarios where initiationsof finite sized file transfers occur at random time instants and locations. We focus onthe impact that flow’s behaviour has on the performance observed by the users whilealso accounting for the user’s location in the cell. The design of an optimal schedulingscheme is outside our scope.
In the present paper we focus on a class of resource fair scheduling schemes, wherethe active users are scheduled in a Round Robin fashion and are all assigned an equalnumber of subcarriers to transmit their traffic. However, it is noted that our analysisapproach sketched below is in principle applicable for any uplink scheduling scheme inOFDMA-based networks.
Our modelling and analysis approach is based on a time-scale decomposition andworks, at high level, similar to the approach we used previously in the context ofUMTS/EUL, see [3]. It consists basically of three steps. The first two steps take thedetails of the scheduler’s behaviour into account in a given state of the system, i.e. thenumber of active users and their distance to the base station. In particular, in the firststep the data rate at which a user can transmit when scheduled is determined, takinginto account the number of allocated by the scheduler subcarriers. The second step de-termines an active user’s average throughput in the given system state by accounting forthe total number of users present in that state. In the third step these throughputs and therates at which new users become active are used to create a continuous-time Markovchain, which describes the system behaviour at flow level. From the steady-state distri-bution of the Markov chain the performance measures, such as mean file transfer timeof a user, can be calculated.
For some special cases of our resource fair scheduling schemes the steady-state dis-tribution of the Markov chain describing the system behaviour at flow level is solvedanalytically yielding insightful closed-form expressions for the mean file transfer times.For other cases simulation is used to derive the steady-state distribution. As the jumpsin the Markov chain are related only to flow transfers and not packet level events, sim-ulation is a very attractive option and does not suffer from the long running times of’straightforward’ detailed system simulations.
The rest of the paper is organized as follows. Section 2 provides a general discussionon LTE uplink scheduling and introduces the different resource fair scheduling schemesthat we will analyse in this paper. In Section 3 we describe the considered network sce-nario and state the modelling assumptions. Subsequently, in Section 4 the performanceevaluation approach is described in detail. Section 5 presents and discusses numerical

Fig. 1. Radio resource structure in LTE networks.
results illustrating the performance of the different scheduling schemes and the impactof the flow level dynamics. Finally, in Section 6, conclusions and our plans for futurework are given.
2 Scheduling
In this section we first give a general introduction to scheduling in LTE uplink, nec-essary for the understanding of the proposed schemes and our modelling choices, andintroduce the notation. Subsequently, the proposed scheduling schemes are described.
2.1 LTE Uplink Scheduling
The radio access technology chosen for the LTE uplink - SC-FDMA (Single Carrier -Frequency Division Multiple Access) - is a modified version of an OFDMA (Orthogo-nal FDMA) technology (used in LTE downlink), in which the radio spectrum is dividedinto nearly perfect mutually orthogonal subcarriers. In contrast to e.g. CDMA-basedEUL, simultaneous transmissions from different mobile stations (MSs) do not causeintra-cell interference or compete for a share in the available uplink noise rise bud-get, but rather the transmissions compete for a share in the set of orthogonal (intra-cellinterference-free) subcarriers. The total bandwidth that can be allocated to a single MSdepends on the resource availability, the radio link quality and the terminal’s transmitpower budget.
A key feature of packet scheduling in LTE networks is the possibility to scheduleusers in two dimensions, viz. in time and frequency. The aggregate bandwidth BW avail-able for resource management is divided in subcarriers of 15 kHz. Twelve consecutivesubcarriers are grouped to form what we refer to as a ‘subchannel’, with a bandwidth of180 kHz, as illustrated in Figure 1. Denote with M the number of subchannels offeredby the available bandwidth BW . In the time dimension, the access to the subchannels isorganized in time slots of 0.5 ms. Two slots of 0.5 ms form a TTI (Transmission TimeInterval). The smallest scheduling unit in LTE is the intersection of a 180 kHz subchan-nel with a 1 ms TTI, which consists of two consecutive (in the time domain) resourceblocks (RB). For simplicity of expression, in the rest of this paper we will use the termresource block to refer to a combination of two consecutive RBs. Hence in each TTI,the scheduler can assign M resource blocks over the active flows.

(a) Fair fixed assignment scheme (b) Fair work-conserving scheme
Fig. 2. Scheduling schemes for an LTE uplink.
Scheduling decisions are taken by the base station, termed eNodeB in LTE, eachTTI and are potentially based on channel quality feedback provided by the MSs. Thepacket scheduler decides which users are served and how many resource blocks areassigned to each selected user. As mentioned before, this assignment is restricted by therequirement that resource blocks assigned to any given user must be consecutive in thefrequency domain. The transmit power applied by any given MS is equally distributedover the assigned resource blocks, see [15]. Hence, then a higher assigned number ofresource blocks implies a lower transmit power per resource block. This has obviousimplications for the signal-to-interference-plus-noise ratio (SINR) experienced at theeNodeB, see Section 4. Note that the data rate that a user can realize depends on boththe number M(MS) of assigned resource blocks and SINR experienced per resourceblock, which determines the applied MCS (modulation and coding scheme). This issueis discussed in more detail in Section 5.2.
The rate r is additionally affected by practical limitations, see [1]. On the one side,the SINR is lower bound to a minimum target level, necessary for successful reception.On the other side, the rate per RB is upper bound by the MCS. In our case we workwith 16QAM since it should be supported by all terminals but potentially also 64QAMcan be used (with limited terminal support).
2.2 Scheduling Schemes
In our analysis we concentrate on resource fair scheduling schemes, which assign equalresource shares to all active users, independently of their respective channel conditions.More specifically, we consider two distinct schemes termed fair fixed assignment (FFA)and fair work-conserving (FWC). These scheduling schemes are specified in more de-tail below, supported by the illustrations in Figure 2, which considers a scenario withfour active users.
The first scheduler is termed fair fixed assignment because it assigns the same, apriori specified, number of resource blocks to each active user (see Figure 2(a)). Thenumber of assigned resource blocks, denoted M(MS) is an operator-specified parameter.If the number N of active users is such that the total number of requested resource blocksis less than the available number of resource blocks per TTI, i.e. if N ·M(MS) < M,then a number of resource blocks are left idle. Naturally this reflects a certain degree ofresource inefficiency in the scheme, especially for situations with low traffic load and

hence few active users. When the number of active users is such that N ·M(MS) > M,then not all users can be served in each TTI and hence it may take several TTIs toserve all users at least once. We define the cycle length as the number of TTIs necessaryto serve all users at least once, as indicated in the figure. This cycle length can beexpressed as c = max(1,N ·M(MS)/M), which is not necessarily integral (but at leastone), in which case the start of a given cycle may fall within the same TTI as the end ofthe previous cycle.
The second scheme, the fair work-conserving scheme, aims to avoid the resourceinefficiencies of the FFA scheme under low traffic loads, while still preserving the re-source fairness property. The scheme’s objective is to distribute the available resourceblocks evenly over the active users within each individual TTI. As result the FWCscheduler is optimal in the class of resource-fair Round Robin schedulers. In principleeach user is assigned M/N resource blocks in each TTI. Since M/N need not be inte-gral, in an implementable version of the FWC scheduler, a scheduling cycle is definedof multiple TTIs during which user-specific resource block assignments appropriatelyvary between bM/Nc and dM/Ne in order to, on average, achieve the fair assignment ofM/N resource blocks. More specifically, the cycle length is equal to the smallest integerc such that c ·M/N is integral, which is at most equal to N.
3 Model
We consider the scenario of a single cell with radius r. The cell is divided in K zonesof equal area in order to differentiate between user’s distance to the base station. Eachzone is characterized by a distance di measured fron the outer edge of the zone. Mobilestations are uniformly distributed over the cell zones and flow arrivals follow a Poissonprocess with rate λ . Hence the arrival rate per zone (due to equal area) can be derivedas λi = λ/K, where i = 1...K. The distribution of the active users over the zones of thecell we term state n = n1,n2...nK .
All mobile stations are assumed to have the same maximum transmit power capacityPtx
max. Each user distributes this maximum power level equally over the RBs it gets as-signed leading to transmit power per RB Ptx
i = Ptxmax/Mi(MS). Note that in the discussed
scheduling schemes Mi(MS) is the same for all zones but other schedulers, where thisis not the case, are possible. Due to the different distance di each zone is characterizedby distinctive path loss L(di), where i = 1...K. We apply a Hata 321 path loss model forthe path loss (in dB), according to which
L(di) = PL f ix +10alog10(di) (1)
where PL f ix is a parameter that depends on system parameter such as antenna heightand a is the path loss exponent. In the rest of the paper linear scale is used for L(di).Users belonging to the same zone have the same distance di and hence experience thesame path loss. At this stage of the research we consider only thermal noise N0 fromthe components at the base station. Neither shadowing nor fast fading have been con-sidered. Note that intra-cell interference can be assumed to be effectively zero due tothe orthogonality of the subcarriers in LTE. As we consider a single cell, inter-cell in-terference is not taken into account in the current model.

Given a known path loss, the received power (per zone) at the eNodeB Prxi can be
expressed as
Prxi =
Ptxi
L(di)(2)
Eventually, for the signal-to-noise ratio measured at eNodeB from user of zone i wecan derive:
SINRi =Prx
iN0
=Ptx
iL(di)N0
=Ptx
max/Mi(MS)L(di)N0
(3)
Recall that it should hold that SINRi ≥ SINRmin for each zone.
4 Analysis
Our proposed evaluation approach, as discussed earlier, consists of three steps. Firstwe perform packet level analysis, which accounts for scheduler specifics and systemcharacteristics. The so termed instantaneous rate is defined and is later used at step twoto derive a state-dependent throughput that accounts for the effect of the number of MSsin the system and their position, i.e. the system state. Eventually, at step three a Markovmodel is set up to model the long term performance of the schedulers. From the steadystate distribution of the model we can derive flow level performance measures such asmean flow transfer times (MFTT) Ti. These steps are explained in more detail below.
4.1 Instantaneous Data Rates
The data rate realized by a user when it is scheduled is what we term instantaneous rateri. It is determined by the SINR as derived above, the possible coding and modulationschemes and the receiver characteristics related to that MCS. The instantaneous rateis calculated over all RBs that are allocated to a particular user. In our analysis weuse the Shannon formula modified with a parameter σ to represent the limitations ofimplementation, see Annex A in [1]. Hence for the instantaneous rate we can write:
ri = (Mi(MS)∗180kHz)σ log2(1+SINRi) (4)
Note that both SINRi and ri are calculated over the same RB allocation.In the FFA scheme (with a fixed number of RB allocation per user in a cycle) the
instantaneous rate of a particular MS is always the same when the MSs is served. In thecase of the FWC scheme however the instantaneous rate depends on the total numberof users in the system. In particular, it depends on whether low or high allocation, seeSection 2.2, occurs and hence for the FWC scheme we calculate two instantaneous ratesri,L and ri,H respectively.
4.2 Flow Level Analysis
Depending on the number of active MSs it may happen that several TTIs are necessaryto serve all MSs once, i.e. cycle length ¿ 1 TTI. In such situations the instantaneousrate does not represent correctly the performance of a particular MS since it is only

realized every several TTIs. A better metric is necessary - one which accounts for theactive number of users in the cell and which we term state dependent throughput Ri(n).In the case of FFA scheduler the state dependent throughput can be easily expressed asRi(n) = ri/c. For the FWC scheme we need to consider the variation in low resourceblock allocation (bM/Nc blocks) and high resource block allocation (dM/Ne blocks).Each allocation exhibits for a fraction of the scheduling cycle as follow:
Low allocation aL =MN−⌈
MN
⌉(5)
High allocation aH =MN−⌊
MN
⌋(6)
Eventuallty for the state dependent throughput we can write:
Ri(n) = aLri,L +aHri,H (7)
State dependent throughputs reflect performance for a particular system state. Inorder to observe the system under changing number of users we propose to set up aMarkov model for each of the schemes, which to represent the system (cell) dynam-ics in a long term. The division of the cell in K zones results in a K-dimensional statespace, each dimension reflecting the number of flows in a zone. A state in the modelcorresponds to a system state n and in each dimension i transition rates are determinedby flow arrivals λi/K and flow departures Ri(n)/F , where F is the mean of the expo-nentially distributed flow size.
From the steady-state distribution of the Markov chain we can derive long termperformance metrics such as mean flow transfer times. The distribution can be foundby simulating the model, more precisely the state transitions. In special cases - for aMarkov chain of a well studied class - the distribution can be given by explicit closed-form expressions. In our study the model of the FFA scheduler appeared to be a M/M/1processor sharing (PS) model with state dependent service rates, which we will discussbelow. The model of the FWC scheduler has a more complex form and is not trivial tosolve, which is why we selected a simulation approach for it.
M/M/1 PS with State Dependent Service Rates In the case of FFA scheduler theMarkov chain belongs to the class of M/M/1 processor sharing models with state de-pendent service rates and multiple customer classes, see [13]. For such model the meansojourn time Ti of a users of zone i requiring an amount τ of service is given by (e.g.see [13]):
Ti = τi
∑L−1j=0
ρ j
j! +LL
L!ρ
((ρ/L)L+1 L
1−ρ/L +(ρ/L)L+1 1(1−ρ/L)2
)∑
Lj=0
ρ j
j! +LL
L! (ρ/L)L+1 11−ρ/L
(8)
where L = BW/M(MS) is the maximum number of users that can be served in a TTI,given a RB allocation strategy. Note that the impact of the distance of each zone is takenin the specific flow size τi = F/ri, expressed in time.
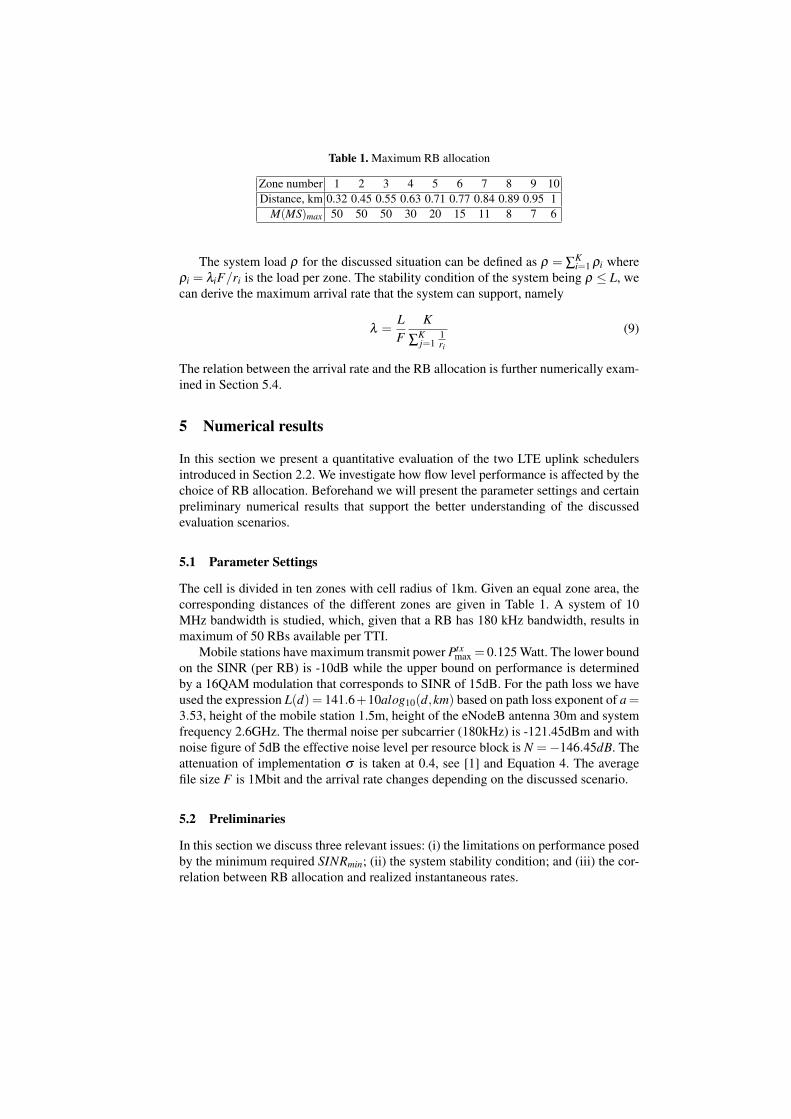
Table 1. Maximum RB allocation
Zone number 1 2 3 4 5 6 7 8 9 10Distance, km 0.32 0.45 0.55 0.63 0.71 0.77 0.84 0.89 0.95 1
M(MS)max 50 50 50 30 20 15 11 8 7 6
The system load ρ for the discussed situation can be defined as ρ = ∑Ki=1 ρi where
ρi = λiF/ri is the load per zone. The stability condition of the system being ρ ≤ L, wecan derive the maximum arrival rate that the system can support, namely
λ =LF
K
∑Kj=1
1ri
(9)
The relation between the arrival rate and the RB allocation is further numerically exam-ined in Section 5.4.
5 Numerical results
In this section we present a quantitative evaluation of the two LTE uplink schedulersintroduced in Section 2.2. We investigate how flow level performance is affected by thechoice of RB allocation. Beforehand we will present the parameter settings and certainpreliminary numerical results that support the better understanding of the discussedevaluation scenarios.
5.1 Parameter Settings
The cell is divided in ten zones with cell radius of 1km. Given an equal zone area, thecorresponding distances of the different zones are given in Table 1. A system of 10MHz bandwidth is studied, which, given that a RB has 180 kHz bandwidth, results inmaximum of 50 RBs available per TTI.
Mobile stations have maximum transmit power Ptxmax = 0.125 Watt. The lower bound
on the SINR (per RB) is -10dB while the upper bound on performance is determinedby a 16QAM modulation that corresponds to SINR of 15dB. For the path loss we haveused the expression L(d) = 141.6+10alog10(d,km) based on path loss exponent of a=3.53, height of the mobile station 1.5m, height of the eNodeB antenna 30m and systemfrequency 2.6GHz. The thermal noise per subcarrier (180kHz) is -121.45dBm and withnoise figure of 5dB the effective noise level per resource block is N =−146.45dB. Theattenuation of implementation σ is taken at 0.4, see [1] and Equation 4. The averagefile size F is 1Mbit and the arrival rate changes depending on the discussed scenario.
5.2 Preliminaries
In this section we discuss three relevant issues: (i) the limitations on performance posedby the minimum required SINRmin; (ii) the system stability condition; and (iii) the cor-relation between RB allocation and realized instantaneous rates.

Table 2. Maximum flow arrival rate
M(MS) 1 2 3 4 5 6 7 8 9 10L 50 25 16 12 10 8 7 6 5 5
Max λ 4.79 2.89 1.9922 1.5582 1.3338 1.09 0.9643 0.8343 0.7 0.703
SINRmin sets an upper bound M(MS)max on the number of RBs that can be assignedto a user. Since the transmit power of a MS is spread over its assigned RBs, increasingthe RB allocation leads to lower transmit power per RB and hence decreasing SINR.Naturally this maximum allocation differs per zone, which is shown in Table 1. Evenif assigned more than its maximum RB allocation, a MS will not use it all leaving RBsunused and potentially leads to utilization inefficiency.
Continuing with the second issue, from the stability conditions in Section 4.2, i.e.ρ ≤ L, it follows that more RBs per MS results in lower maximum supported arrivalrate by the system. Table 2 presents the relation between number of RBs, the maximumpossible number of MSs in a TTI L and the maximum supported arrival rate λ . Notethat the maximum arrival rate for FWC scheme is similar to the maximum for the FFAscheme with a single RB.
Finally, Figure 3(a) shows the changes in instantaneous data rates for a range of RBallocations in the case of a single user. Four scenarios corresponding to distance fromthe base station (0.1 0.25 0.5 0.87)km are examined. As Equation 4 suggests, increasingthe RB allocation leads to increase in the realized data rates. However, MSs close to theeNodeB benefit more from high allocation than remote MSs. For remote users SINRminconstrains the maximum usable RB allocation hence limiting performance gains. Thistrend is well illustrated by the quickly flattening graph for 0.5km and the terminatinggraph of 0.87km (after 15 RBs the MS is no more able to reach the required SINRmin).
5.3 Impact of RB allocation
In this evaluation scenario we extend the investigation on the impact of RB allocation- both in terms of number of assigned RBs and of allocation strategy - towards theflow level. We compare mean flow transfer times for the particular arrival rate of 0.5flows/sec. The number of assigned RBs in the FFA scheme changes from one to threeto ten3. and the results are shown in Figure 3(b).
How the number of assigned RBs affects performance is observed for the FFAscheme. The general trend is that increase in allocation translates to lower MFTT, e.g.one vs. three RBs. However, for remote MSs high allocation worsens performance, i.e.ten vs. three RBs. While close-by MSs have sufficient power capacity to reach SINRminfor all allocations remote users lack this ability (due to high path loss). They use lessRBs such that to guarantee SINRmin but the unused by them RBs are still allocated thuseffectively decreasing state dependent throughputs.
The impact of the allocation strategy is investigated by comparing the one RB FFAwith the FWC scheme, see Figure 3(b). The particular choice is dictated by the similar
3 These showed to be the most interesting assignments within the range one to ten RBs with astep of one.

(a) Data rate (b) Single case
(c) Range case (d) Load progression
Fig. 3. Performance evaluation scenarios for: (a) relation between RB allocation and deliverabledata rates for a single user; (b) impact of RB allocation on flow level performance for a particulararrival rate; (c) impact of arrival rate on flow level performance; and (d) flow level performancefor a range of system loads.
realized load by both schemes, i.e. about 6% of the maximum load. Note that equalarrival rate means equal traffic offered to the system but not equal system load (whichdepends on RB assignment). Due to its inefficient utilization for low loads (it leavesRBs unassigned, see Section 2.2) the FFA scheme is outperformed by the FWC scheme(which assigns all RBs over the active users).
5.4 Impact of System Arrival Rate
Figure 3(c) shows the MFTT for a range of arrival rates, i.e. (0.3, 0.5, 1, 1.5) flows/sec.Again the FWC outperforms the FFA scheme. It is more interesting that system ca-pacity changes (decreases) for different (increasing) RB allocation. For example, tenRBs allocation is not feasible already at arrival rate of 1 flows/sec while the three RBsallocation at 1.5 flows/sec.
Furthermore the optimal choice of RB allocation also differs per arrival rate. Fig-ure 3(c) shows that few RBs, e.g. five, become beneficial for higher arrival rate com-pared to many RBs, e.g. ten. With high load cycle lengths bigger than one are more

probable, in which case the inherent inefficiency of the FFA scheme for remote usersstarts to affect flow level performance, see Equation 7. An effect that is strengthened bythe fact that remote users stay longer in the system.
Also notice that the one RB FFA is not affected at all by the arrival rate for thepresented range. Since the system load is relatively low compared to the maximumthe number of users is such that still all of them fit in the same TTI hence leading tounchanged performance.
5.5 Impact of System Load
In this section we investigate performance for a range of specifically chosen arrival ratesX%λmax where X% is chosen between (10%,30%,50%,70% and 90%). The so selectedarrival rates correspond to a particular system load scenario, e.g. low, medium or highload. Note that the maximum arrival rate λmax differs per RB allocation, see Section 5.2.The results are presented in Figure 3(d).
The results indicate that the choice of best RB allocation is load specific. For lowloads (10% and 30% λmax) we see that more resource blocks are beneficial while forhigh load (70% and 90% λmax) the contrary holds - a single RB allocation providesbetter service. On the one side, the utilization inefficiency of the FFA scheme for remoteusers exhibits more for high loads due to the big number of active users, including celledge users. These stay relatively long in the system and virtually occupy RBs, causingdegradation in state dependent throughputs. On the other side, many MSs with few RBsper MS but high transmit power per RB result in higher accumulated energy per TTIthan few MSs where each MS gets assigned many RBs. This is particularly true aboutMSs at the cell edge.
It is interesting to note that although FWC outperforms the FFA scheme the gaindecreases in X% and for high loads the performance is very similar.
6 Conclusion
In this paper we present an indicial investigation on the impact that flow dynamics(changing number of users) have on performance given the complex scheduling envi-ronment of LTE uplink. We argue that flow dynamics are crucial for the understandingand selection of a scheduler. Two low complexity scheduling schemes are examined- both designed to provide equal channel access. We propose a hybrid modelling andanalysis approach which combines packet level analysis with flow level simulation. Theapproach allows to capture diverse features of users and system, supports fast evalua-tion and scales well. Indeed the numerical results show that certain performance trendscan be observed only if flows’ behaviour is considered. The conclusions apply for asingle cell scenario and accounting for user’s limited transmission power and system’sconstrains on signal strength.
Currently we are extending our flow level performance evaluation to account forthe practical limitation on the maximum number of users that can be served in a TTI,see [5]. Additionally it would be interesting to consider a scheduling scheme whichmaximizes the delivered performance but might be less fair is the provided service.

References
1. 3GPP TS 36.942. LTE; evolved universal terrestrial radio access (E-UTRA); radio frequency(RF) system scenarios.
2. M. Al-Rawi, R. Jntti, J. Torsner, and M. Sagfors. On the performance of heuristic oppor-tunistic scheduling in the uplink of 3G LTE networks. Proceedings PIMRC 2008, 2008.
3. D.C. Dimitrova, J.L. van den Berg, G. Heijenk, and R. Litjens. Flow level performancecomparison of packet scheduling schemes for UMTS EUL. WWIC ’08, 2008.
4. L. Gao and S. Cui. Efficient subcarrier, power and rate allocation with fairness considera-tions for OFDMA uplink. volume Vol. 7, pages 1507–1511. IEEE Transactions on WirelessCommunications, 2008.
5. H. Holma and A. Toskala. LTE for UMTS, OFDMA and SC-FDMA Based Radio Access.John Wiley & Sons, 2009.
6. J. Huang, V.G. Subramanian, R. Agrawal, and R. Berry. Joint scheduling and resource allo-cation in uplink OFDM systems for broadband wireless access networks. volume Vol. 27,pages 226–234. IEEE Journal on Selected Areas in Communications, 2009.
7. K. Kim, Y. Han, and S. L. Kim. Joint subcarrier and power allocation in uplink OFDMAsystems. volume Vol. 9, pages 526–52. IEEE Communications Letters, 2005.
8. Raymond Kwan, Cyril Leung, and Jie Zhang. Multiuser scheduling on the downlink of anLTE cellular system. Rec. Lett. Commun., 2008:1–4, 2008.
9. S. B. Lee, I. Pefkianakis, A. Meyerson, S. Xu, and S. Lu. Proportional fair frequency-domainpacket scheduling for 3GPP LTE uplink. IEEE INFOCOM 2009 mini-symposium, 2009.
10. L.A. Maestro Ruiz de Temino, G. Berardinelli, S. Frattasi, and P. Mogensen. Channel-awarescheduling algorithms for SC-FDMA in LTE uplink. Proceedings PIMRC 2008, 2008.
11. H. G. Myung, J. Lim, and D.J. Goodman. Single carrier FDMA for uplink wireless trans-mission. volume Vol. 48, pages 30–38. IEEE Vehicular Technology Magazine, 2006.
12. C. Ng and C. Sung. Low complexity subcarrier and power allocation for utility maximizationin uplink OFDMA systems. volume Vol. 7, pages 1667–1675. IEEE Transactions on WirelessCommunications, 2008.
13. R. D. van der Mei, J. L. van den Berg, R. Vranken, and B. M. M. Gijsen. Sojourn times inmulti-server processor sharing systems with priorities. volume 54, pages 249–261. Perfor-mance Evaluation, 2003.
14. C. Wengerter, J. Ohlhorst, and A. G. E. von Elbwart. Fairness and throughput analysisfor generalized proportional fair frequency scheduling in OFDMA. Vehicular TechnologyConference, 2005. VTC 2005-Spring, 2005.
15. E. Yaacoub and Z. Dawy. Centralized and distributed LTE uplink scheduling in a distributedbase station scenario. Advances in Computational Tools for Engineering Applications, 2009.ACTEA ’09, 2009.