Embed Size (px)
Citation preview

Institute of Actuaries of India
Subject SA6 – Investment
May 2013 Examinations
INDICATIVE SOLUTIONS
IAI SA6-0513
Page 2
Solution 1 :-
i. The company is exposed to various risks as given below:
a) Reinvestment risk
b) Parallel shifts in yield curve
c) Non-parallel shifts in yield curve
d) Duration mismatch risk
e) Basis risk / Spread risk
f) Interest rate gap risk, liquidity gap risk
However the main risk is reinvestment risk on the future renewal premiums.
Interest rates may drop in the future leading to the renewal premiums earning
lower than the guaranteed rate of interest.
The risks arise because there is a duration gap or mismatch between assets and
liabilities. Lack of assets with long term duration and which also give matching
guarantees on future investments would lead to exposure to interest rate risks.
Thus the ALM would require estimating the parallel shifts or otherwise of the
yield curve and its impact on the assets and liabilities.
In the Indian market the long term government securities are not available beyond
30 years maturity and such securities can only serve to hedge the interest rate
guarantee on the first premium when reserves are very small.
Also the market risk is not only pertinent for maturity value guarantees; it
becomes more risky if there are guarantees on surrender values as well (even
though they can be partly mitigated by the surrender penalties).
(4)
ii. The recurring deposits offered by banks also guarantee the interest rates on future
deposits / investments to be made thus creating a good ALM match for the
guarantees on future renewal premiums.
The duration of such deposits because of future reinvestment rate guarantee
becomes higher and when there is a lack of long duration assets it serves to be a
good match for the long term liabilities with reinvestment risks.
The other possible instruments for such long term liabilities are long term
government securities (30 year maturity or longest term to maturity available).
Corporate bonds for such long terms are not available. Currently the longest term
government security available has 28 years maturity term. This can be a good
investment considering liabilities are also long term however it helps lock the
interest rates for the current premiums only and the reinvestment risk on future
premiums still remains.
(3)

IAI SA6-0513
Page 3
iii.
a) The callable bonds come with an in-built call option to the issuer of the
bonds wherein he can call the issue off if the interest rates decline
significantly. It thus gives the issuer an option to purchase back the bond
after some time period at a pre-determined price. (1)
b) Effective Duration is used to measure the price volatility of debt
instruments (government securities or other bonds). It gives the average
change in the price of the bond due to change in interest rates/yields. The
formulae is given as follows:
(P1 – P2)/(P0×2×∆i)
where ∆i is the change in the interest rate/yield
P0 is the base (original) price
P1 is the price when interest rates / yields drop by ∆i
P2 is the price when interest rates / yields increase by ∆i
Macaulay duration is the discounted mean term of the bond and gives the
average term to maturity for the bond cashflows weighted by the present
value of the cashflows given by the following:
∑ (PV of each cash-flow × term or time for the cash flows)/ Current Bond
Price
Where current bond price = ∑ (PV of all the cashflows)
Modified duration like effective duration measures the sensitivity of the
bond price to changes in interest rates (yields) with the only difference that
all cash-flows are considered while calculating the price and any option
(call option etc) are ignored for such pricing. Modified duration =
Macaulay duration / (1 + i) where i is the current bond yield. (3)
c) The effective yield allows for the call option or any other option on the
bonds which means while considering the up price or the down price if the
cap on price is reached (due to the embedded option) then the formulae of
the Effective duration uses the capped price or floor at which the option
would be exercised. [Please see the solution of question number D (v)
below] (2)
d) If the interest rates fall at the time when the issuer has an option to call
back the bonds then the price of the bond which should have otherwise
shown an increase will not behave in the same manner since the issuer has

IAI SA6-0513
Page 4
a right to buy-back the same at the pre-determined price communicated at
the time of the issuance. Hence the price of the bond will show negative
convexity after some time wherein the increase in price of the bond due to
drop in interest rate will be much tapered and would become fixed (once it
touches the pre-determined price) for very high / low interest rates. (1)
e) For investors the risk is that the bond may be called back when interest
rates fall and hence the upside in the price is limited. The investors are like
writers of the option and run the reinvestment risk when such bond would
be called off and the investment amount is returned to them by the issuer
to be reinvested only at lower rates prevailing at that point of time. (1)
f) Coupons are given at pre-determined time periods and they need to be
reinvested when received to create a match with longer term liabilities
where the payout is largely deferred till maturity. Thus the higher coupons
add to reinvestment risk wherein if the interest rates are lower when
coupons are received then we may have to lock the new reduced rates on
the coupon money. In case of the company the guaranteed returns given to
customers are on the maturity (long end fixed liabilities) whereas new
premiums and coupons will need to be reinvested. On the other hand the
duration reduces if the coupons are higher in size (zero coupon will have
the longest duration) which means the interest rate risk reduces with
increase in coupon size. (1)
iv.
a) The price of the g-sec is calculated as the present value of the cash-flows
to be received
Coupons of Rs 90 are received for 28 years along with final payment of face value of Rs 1000 after
28 years. Thus the present value of cash flows is equal to:
90× Present Value Interest Factor for Annuity (PVIFA for immediate annuity) for 28 years at 8% +
Present Value of 1000 (to be received after 28 years, at 8%)
PVIFA factor = ((1+0.08)^28-1)/((1+0.08)^28*0.08)
Thus PVIFA factor = 11.05108
Thus we get 90×11.05108 + 1000/(1.08^28)
994.5971 + 115.9137 = 1110.511
(2)
b) The risks on yields making an upward or downward parallel shift arises if
the durations of assets and liabilities are not matched. The price change in
assets and liabilities is approximately equal to their duration times the
IAI SA6-0513
Page 5
change in the yields. Thus if yields drop by 100bps where assets have a 10
year duration and liabilities have 20 years duration then the increase in the
asset price will be 10% whereas the liabilities will increase by 20% thus
creating a strain on the shareholders capital. (1)
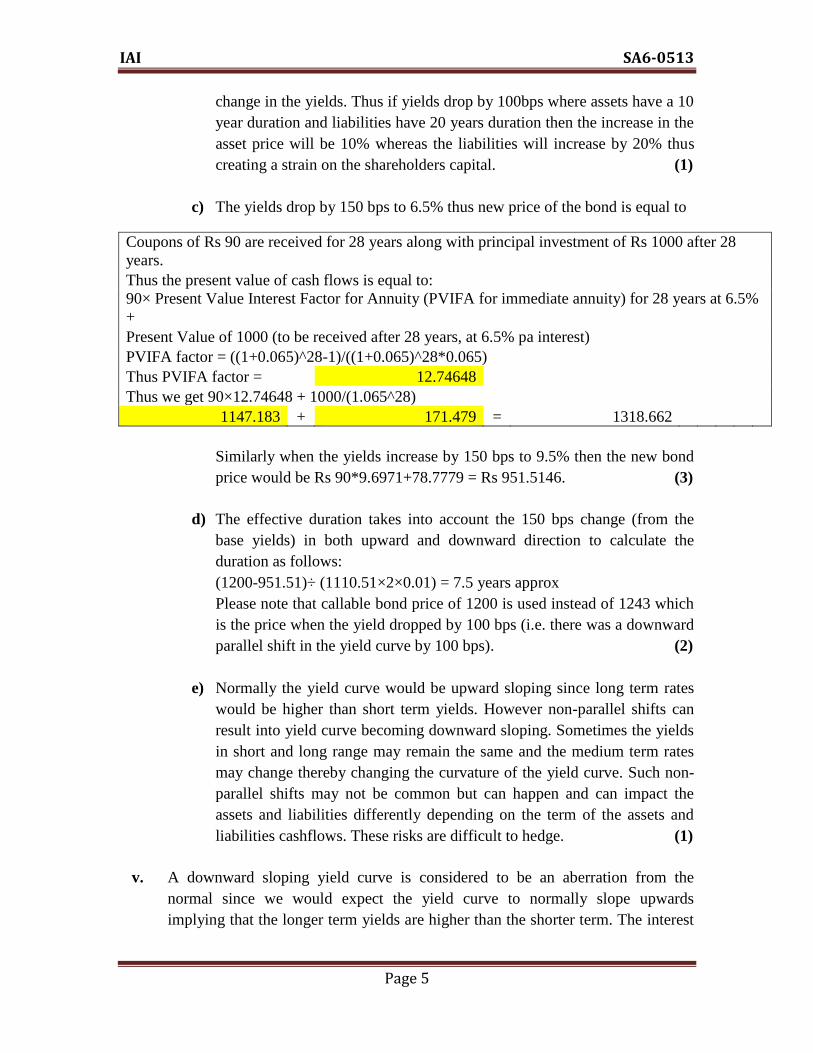
c) The yields drop by 150 bps to 6.5% thus new price of the bond is equal to
Coupons of Rs 90 are received for 28 years along with principal investment of Rs 1000 after 28
years.
Thus the present value of cash flows is equal to:
90× Present Value Interest Factor for Annuity (PVIFA for immediate annuity) for 28 years at 6.5%
+
Present Value of 1000 (to be received after 28 years, at 6.5% pa interest)
PVIFA factor = ((1+0.065)^28-1)/((1+0.065)^28*0.065)
Thus PVIFA factor = 12.74648
Thus we get 90×12.74648 + 1000/(1.065^28)
1147.183 + 171.479 = 1318.662
Similarly when the yields increase by 150 bps to 9.5% then the new bond
price would be Rs 90*9.6971+78.7779 = Rs 951.5146. (3)
d) The effective duration takes into account the 150 bps change (from the
base yields) in both upward and downward direction to calculate the
duration as follows:
(1200-951.51)÷ (1110.51×2×0.01) = 7.5 years approx
Please note that callable bond price of 1200 is used instead of 1243 which
is the price when the yield dropped by 100 bps (i.e. there was a downward
parallel shift in the yield curve by 100 bps). (2)
e) Normally the yield curve would be upward sloping since long term rates
would be higher than short term yields. However non-parallel shifts can
result into yield curve becoming downward sloping. Sometimes the yields
in short and long range may remain the same and the medium term rates
may change thereby changing the curvature of the yield curve. Such non-
parallel shifts may not be common but can happen and can impact the
assets and liabilities differently depending on the term of the assets and
liabilities cashflows. These risks are difficult to hedge. (1)
v. A downward sloping yield curve is considered to be an aberration from the
normal since we would expect the yield curve to normally slope upwards
implying that the longer term yields are higher than the shorter term. The interest
IAI SA6-0513
Page 6
rates are higher for longer terms since the risks/uncertainties would increase as the
term increases thereby seeking higher returns for longer term.
If there is a reversal in the yield curve whereby it has become downward sloping
then it is abnormal and the trend in the market may be bearish. This can happen
when there are more investors looking for shorter term assets. Normally longer
term assets are sought by insurance companies or annuity providers and /or
pension funds which have long term liabilities and are seeking longer term assets
to match / hedge their liabilities. However if there is a short term liquidity crunch
wherein companies, governments or other borrowers are looking to pay high
interest to meet their liquidity requirements / payouts etc then the interest rates in
shorter term will become higher than longer terms.
It also indicates that long term investors have lesser cash availability and hence
their demand for long term assets has reduced. Such liquidity crunch or lack of
investible amount with long term investors generally leads to a bearish market.
The high short term rates may also occur due to central bank increasing bank rates
or increasing CRR/SLR requirements thereby causing a short term liquidity
squeeze. All of these indicates a bearish trend. (3)
vi. A high Put/Call ratio means the option buyers have higher number of puts than
calls thus more option buyers seems to believe that markets may go down (thus
buying more Put options). Historically the option buyers have been more incorrect
in assessing the market as compared to option sellers/writers. It has been seen that
the market trends in an opposite direction of the views of the option buyers.
The option writers have opposite view of option buyers (and that is the reason
why they have sold the options). Most of the times Individuals are option buyers
and large Financial Institutions only write options. It has been seen that the
market knowledge and research by Institutional investors is much higher and
hence the Institutions who are option writers are more equipped than option
buyers to predict the market trend correctly.
Thus in a market with a high Put/Call ratio the Option writers believe that the
markets may go up and hence they are happy to write more Puts than Calls. It has
been seen that the writers predict the trends better hence a high Put/Call ratio
means the market would have a bullish trend. (2)
vii. The investment risks increases with the following:
Higher savings component in the product
Future renewal premiums, thereby increasing reinvestment risk
IAI SA6-0513
Page 7
Longer policy term
In-built interest rate guarantees
Flexibility or liquidity options such as early surrender values etc thereby
making it difficult to ascertain the future cash flows and a higher
possibility of mismatch between assets and liabilities
Based on the above we can give the following explanation of the product risks
followed by an appropriate ranking in terms of investment risks.
a) Regular Premium Non-Par Whole life Assurance product with
higher surrender options.
This is risky because it is very long term (whole life) and also has
savings element in it. It has regular premiums thus having
reinvestment risks. The non-par products have in general higher
guarantees thereby increasing the risks. Also this product has more
surrender options which exposes it to policyholders behaviour leading
to risks of assets being liquidated to pay the surrender liabilities at an
in-opportune time.
b) Regular Premium Par Endowment Assurance for 20 years with
higher surrender options.
This is again risky for various reasons like it has regular premium
payment (reinvestment risks) for sufficiently long term and has
savings element. There are also higher surrender options making it
exposed to interest rate risks.
c) Regular Premium Term Insurance for 25 years
This one has lower risks since savings component is low but still some
risk is there since in the initial years the premiums would be higher
than the claims thus small reserves would be created.
d) One year Renewable Group Term Insurance product
This one may have the lowest risk since it has no savings component,
it has very short term (1 year) and no future premium reinvestment risk
etc.
e) Single Premium Endowment Assurance for 20 years
Single premiums have in general lower risks than the regular premium
products (though savings element is higher and all are received
together) since the premiums are received upfront as Single premium
and a good Asset Liability management can be carried by investing the

IAI SA6-0513
Page 8
premiums into long term assets available (thus the liabilities can be
hedged better). However in case this product is a Non-Par single
premium it would carry significant guarantees and must be classified
as risky from investment point of view. If it is a Single Premium
Participating product with low guarantees the risks will be
significantly lower.
f) Regular premium Par Endowment Assurance for 20 years with lower
surrender options
This one has similar risks as explained for number (ii) above however
since surrender options are fewer, the risk is lower than the number (ii)
which has much higher surrender options exposing to an additional
risk wherein assets may have to be liquidated at an in-opportune time.
g) Regular Premium Non-Par Endowment Assurance for 20 years
with higher surrender options
This one again is similar to number (ii) option above but has higher
risks than number (ii) since it is offered on non-par platform which has
generally higher guaranteed values offered on maturity as compared to
par products
h) Unit Linked Endowment Assurance for 20 years with no
guarantees
This has virtually no investment risk except that the earnings from
fund management charges may reduce if the investments do not
perform well. All the risk are transferred to policyholders.
i) Single Premium Whole life Annuity (Non-Par platform)
This one has large risks since the term can be very long and savings
component is high. However being single premium it can be matched
with long term assets to reduce the risks.
j) Single Premium Annuity with Return of Premium on Death (Non-Par
platform)
This has higher investment risks than number (ix) even though the
longevity risks reduces as compared to number (ix).
In number (ix) the regular annuity payouts are higher since the capital
is also paid back as annuities. In return of premium only the interest
component is paid regularly as annuities and the premium component
is retained for longer period and given only on death. Thus a large
IAI SA6-0513
Page 9
component is retained for longer period exposing it to more interest
rate volatilities.
The ranking of the products from most risky to least risky keeping the
investment risk into perspective is given below.
1. Regular Premium Non-Par Whole life Assurance product
2. Regular Premium Non-Par Endowment Assurance for 20 years with
higher surrender options
3. Single Premium Annuity with Return of Premium on Death (Non-
Par platform)
4. Single Premium Whole life Annuity (Non-Par platform)
5. Single Premium Endowment Assurance for 20 years (Assuming it is
a Single Premium Non-Par Endowment Assurance with high
guarantees). However if it is a Single premium Par Endowment
Assurance (with low guarantees) then its ranking would drop down
from number (v) currently to number (vii), i.e. after the Regular
Premium Par products since the regular premium products would
have higher reinvestment risk on future premiums as compared to a
single premium product.
6. Regular Premium Par Endowment Assurance for 20 years with
higher surrender options
7. Regular premium Par Endowment Assurance for 20 years with lower
surrender options
8. Regular Premium Term Insurance for 25 years
9. Unit Linked Endowment Assurance for 20 years with no guarantees
10. One year Renewable Group Term Insurance product (14)
11.
viii.
a) Insurance regulations require companies to hold solvency capital to run
the business. The capital acts as a cushion and is maintained over and
above the reserves. Many companies maintain capital which is higher than
the solvency capital. This extra capital is called fund beyond solvency
(FBS).
The solvency capital is a regulatory requirement whereas the Fund beyond
solvency (FBS) is an extra capital which many shareholders maintain to
provide extra cushion to the existing business, write new business,
infrastructure and expansion strategies of the organisation, smoothening of
bonus, creating extra returns by taking higher risks on this capital.
(1)
IAI SA6-0513
Page 10
b) The Fund beyond solvency if regulated reduces the incentive for
shareholders to put in extra capital. Shareholders want higher returns from
the capital they put. Since Solvency funds investments are strictly
regulated the shareholders do not have incentives to bring extra capital in
the solvency fund. However if the Fund beyond Solvency (FBS) is not as
strictly regulated then shareholders may be able to generate extra returns
(utilising the investment freedom) and would thereby have incentives to
infuse higher capital as FBS.
Thus the cons of higher investment regulations on FBS are as follows:
Prohibit extra capital to be brought into business
Restricts expansion and growth strategies
Will mean frequent visits to shareholders for capital requirements
Will reduce shareholders returns on investment
Robustness of the business may go down
Reduces risk taking appetite of the fund manager
The pros of higher investment regulations on FBS are as follows:
Will restrict FBS from becoming a speculative avenue for the
investment manager
Will make it simple from monitoring and process point of view
since both the Solvency Fund and FBS would have the same
pattern for investments. It may also lead to companies maintaining
only Solvency Fund (no FBS).
We can see that the extra capital through FBS helps in many ways. It
creates an extra cushion for the business risks. It helps in writing new
business (absorbing the new business strain). It can help create more
returns since more asset classes are available to invest. It can help reduce
the volatility in capital requirements. It allows the business to take more
risks and expand. In my view the Fund beyond Solvency should not be
regulated since it discourages shareholders to put in extra capital as FBS.
(5)
c) FBS was less regulated and given higher freedom in terms of exposure
norms and assets classes. However the recent regulations make the
investment regulations for FBS more aligned to the Fund for Solvency
thereby reducing the investment freedom earlier available for the FBS.
IAI SA6-0513
Page 11
The regulator has extended the applicability of Regulation 9 which is
dealing with Exposure / Prudential Norms to ‘Fund Beyond Solvency
Margin (FBS).
From 1 April 2013 the new regulation has extended the applicability of
exposure norms to FBS. However the regulator continues to exclude the
applicability of pattern of investments to FBS.
(2)
[Total 52 Marks]
Solution 2 :-
(i)
An appropriate investment policy ensures that the liabilities are met as they fall due and
also maximize the returns of the asset
To do so following are the questions one needs to look at:-
1. Nature of liabilities:- Are the liabilities fixed or real in monetary terms? Are there
any guaranteed benefits? What is the level of bonus adjustment possible keeping
in mind policyholder’s expectations
2. Term of the liability:- What is the term of the liabilities? Is it short term or long
term? This will depend upon the product and maturity. Are the products are
mainly sold as single premium or regular premium?
3. Currency:- Are there are any overseas liabilities?
4. Certainty of liabilities:-Are the claims susceptible to external environment e.g
surrender due to economic conditions, health claims due to pandemic etc
5. Level of expenses:- What is the level of expenses? Are there any regular policy
related expenses which are related to inflation?
6. Level of Free assets:- What is the level of free assets? Is there is any restrictions
on investment of free assets?
Looking at the portfolio
Unit link constitutes 30%. For unit linked business the assets in the unit fund are exactly
matched with the unit liabilities. This has to follow a principle of close matching. Most of
the risk are passed on to the policyholder. However if the product has some guarantees
then one may require a investment guarantee reserve. This reserve will have to be
matched by assets which are less volatile and fixed in nature. Government bonds will be
most appropriate
Term + Critical Illness + Health business constitutes 30%. This is usually a short term
business. Health Claims are highly uncertain. Also the payments may be related to

IAI SA6-0513
Page 12
inflation if the products are indemnity type products. This has to be matched with short
term assets like cash or short term
Par Products constitutes 40%. This is usually a long term business. Bonus once declared
vests and are guaranteed. However declaration of bonus depends upon the investment
performance of the assets subject to PRE. This gives flexibility in terms of the return. Par
Products are best backed by a combination of bonds and equities. Property is also a good
match for long term liabilities and provides real returns. However they have the
disadvantage of being illiquid.
Looking at the current asset mix
Bonds:- 78%
Equities + Property:- 12%
Unsecured debenture:- 5%
Cash:- 5%
It appears looking at the portfolio exposure to equities maybe increased and more short
term assets may be held to cover the health liabilities. (10)
(ii)
IRDA Investment Regulations
Type of Investment %
Government Securities
and other approved
securities
Not less than 50% of the controlled fund shd be
invested of which Government securities alone
shd not be less than 25%
Infrastructure and Social
Sector
At least 15% of the controlled fund should be
invested in this sector
Other investments to be
governed by exposure
norms
Not exceeding 35% of the CF to be invested of
which investment in "other than approved
investment" category cannot exceed 15% of the
fund
Comparing this with current portfolio of assets there appears to be no violation except no
information about infrastructure bonds.
(5)
(iii) Points on Equity Investment:-
Equity Investment would generate higher expected returns. Also equities are long term
and real and hence provide a match to long term liabilities. Given that company has 40%
with par portfolio, equities should be able to provide a higher return
Comparing the asset mix in light of IRDA norms also shows that there is scope to
increase the equity exposure
However, the volatility of equities should also be considered. For this we will need to
consider the duration of liabilities as well as existing level of free assets.
Also increasing the exposure to equities will have to be planned and executed.

IAI SA6-0513
Page 13
Points on Market being at 2 yr low:-
Just current level of markets being low cannot be a barometer of investing into equities
It needs to be researched along with the fundamentals of the economy
When it is said markets are 2 yr low, is he referring to a particular INDEX? Does that
have any reference to the model portfolio the company follows?
Overall increasing equity exposure would mean more diversification. Hence CFO’s
suggestion seems reasonable to switch more into equities
Iv Some important points:-
Economic Recovery is not a easy prediction. Most times recovery is already underway
for several months before it can be recognized
Markets tend to recover before the economy, so it should be seen if markets have
discounted that or not.
GDP forecasts can fluctuate.
Economists use a variety of indicators, including GDP, inflation, financial markets and
unemployment to analyze the state of the economy and determine whether a recovery is
in progress
Manufacturing Stocks
In a recovery Phase of a business cycle there is a period of early cycle phase. This is a
phase where credit begins to grow, monetary policy is easy and environment is
considered healthy for growth. Typically economically sensitive sectors such as
manufacturing industry are boosted by a recovery. These stocks tend to perform well with
growth of the economy. However the profits can be volatile. Identification of appropriate
stock which return shareholder value is critical.
P/E Ratio:- P/E is Market Price / earnings per share (usually 12 months) and is an
important measure of value and is widely used measure for stock selection. It shows the
sum of money one is ready to pay for each rupee worth of earnings of the company. It
offers an idea of stock has potential to grow. For ex if P/E of a stock is low as compared
to its peers it can be considered a good bargain and is still unknown to the market
As the economy starts to recover, the P/E ratios of cyclical companies will rise in
anticipation of
future earnings growth. P/E ratios of defensive companies may now be lower than those
of
cyclical stocks. As growth continues, the earnings of cyclical companies will catch up
with the share price and P/E ratios will fall back towards their long-term average level.
However it has its own drawbacks. Earnings per share are forecast of future growth
based on past performance. So this in itself is a caveat. There is no guarantee that
company will perform. In a economic recovery situation, it is a test on companies to
deliver on future growth.
Also PE ratio is dependent on comparison with peers which can be driven as per sectors.
Also major announcements or acquisitions tend to move PE.
IAI SA6-0513
Page 14
Real-estate Stocks
Real estate stocks are usually laggards in a economic recovery. The catch up is usually a
little late. Consumers start buying into real estate once their income levels rise and they
are bullish about the economy. This leads to higher demand of property and rise in stock
prices.
Hence it is crucial to identify the appropriate real estate stocks before the market becomes
bullish about the economy. So in a recovery mode it is possible to identify some
underpriced real estate stocks. (11)
(v) Problems in carrying out such a switch without using derivatives are:-
Possibility of shifting market prices in 3 months time
Sale of commercial property may take longer than 3 months
Detailed Research on stocks requires time
Dealing costs and research costs need to be considered
Tax liabilities
(5)
(vi)
To lock into the low level then index linked derivative can be bought till the time
property market transaction is carried out
Using Derivatives saves dealing costs.
Derivative markets are much more liquid
(5)
[Total 40 Marks]
Solution 3 :-
(i) The option strategy which will work best for this situation is to form a straddle.
A straddle involves buying a call and a put option with same strike price and expiry date.
In a straddle whenever there is a sufficiently large move in either direction, a significant
profit will result. If the stock price is close to strike price at expiry of the option, the
straddle will lead to a loss
Hence a straddle works only if there is a large move expected in a stock price but which
direction is unkown. In this case the supreme court ruling would move the share price
either ways.
Payoffs
Suppose stock price is ST and strike price is K
Let Cost of buying a call and put = P
ST < K
Pay off from Call 0
Payoff from Put K- ST
Total = K – ST - P
ST > K

IAI SA6-0513
Page 15
Pay off from Call ST - K
Payoff from Put 0
Total = ST – K - P
ST = K
Pay off from Call – 0
Payoff from Put - 0
Total = -P
Hence the maximum loss in this strategy is two premiums. (4)
(ii) If only call options were to be used then the strategy would be to do a bull spread.
This involves buying a call option with a certain strike price (say K1) and selling a call
option on the same stock with higher strike price (K2)
K1 < K2
Both options have the same expiry. The bull spread limits investor’s upside as well as
downside. So like a straddle above this strategy will neutralize the effect of the
announcement but will limit upside and downside
If S >= K
Pay off long call S –K1
Pay off from short call –(S-K2)
Total K2 – K1
If K1 < S < K2
Pay off long call S –K1
Pay off from short call 0
Total St – K1
If S <= K1
Pay off long call 0
Pay off from short call 0
Total 0
(4)
[Total 8 Marks]
*************************