Embed Size (px)
Citation preview
White PaperNovember 2011
Review of recent ITIL® studies
For APMG by Rob England
©APM Group Ltd 2011
© APM Group Ltd 2011
Executive summary 3
1 Introduction 3
2 Objective 3
3 Methodology 3
3.1 Reliability and validity tests 4
4 ITIL® adoption 5
4.1 Findings 5
4.2 Commentary 6
5 ITIL benefits 8
5.1 Finding 8
5.2 Commentary 10
6 Other findings 11
6.1 Process maturity 11
6.2 Problem management 12
6.3 Service design 12
6.4 Configuration management database 12
7 Conclusion 13
8 List of studies 14
About the author 15
Acknowledgements 15
Trademarks and statements 15
Contents
2 Review of recent ITIL® studies
© APM Group Ltd 2011
Executive summaryThis paper presents a review of the current state of ITIL®.
We have reviewed 23 studies into the use of ITIL. Some of these surveys were commissioned by commercial organizations, often to prove a point, so their findings need to be considered from this viewpoint. Others are academic research.
There were geographic biases in many of the studies. The USA and UK are over-represented in some; others are specific to a country, such as Australia, Germany or South Africa. There is limited representation from other regions or countries.
There is no consistent definition of ‘using ITIL’ but, depending on the population, between 30% and 60% of organizations use ITIL. In one case it is as high as 85%. Two studies suggest that only 10% of organizations surveyed strictly or thoroughly use ITIL.
ITIL adoption and training are both still growing strongly (somewhere around 20% compounding each year).
The top three benefits by one method of ranking were:
■ customer satisfaction
■ cost control
■ faster response and resolution.
We recognize that this is not a survey based on extensive and rigorous scientific data, but we hope it contributes to the wider understanding of the current extent and growth of ITIL adoption, and the benefits that organizations can gain from adopting and adapting ITIL.
1 IntroductionThis paper presents the results of a review of available studies into the current state of ITIL in the IT community, as at June 2011. This review does not claim to be complete but it represents a wide cross-section of available data.
The paper was commissioned by APM Group, on behalf of Best Management Practice, written by Rob England of Two Hills (aka The IT Skeptic), and reviewed by David Favelle (UXC Consulting), Karen Ferris (Macanta), Mark Flynn (Felix Maldo), Dan Lee (Beetil), Richard Pharro (APMG), Kim Riordan (APMG) and Robert Stroud (CA Technologies/ISACA). The reviewers’ comments are based on broad industry experience and added useful context to the research.
Opinion from the author, Rob England, appears in boxes like this one.
Comments from reviewers appear in boxes like this one.
The complete list of studies reviewed can be seen in Chapter 8.
2 ObjectiveThe objective of this review was to determine the state of ITIL; in particular, the extent of ITIL adoption and the benefits derived from it. There are conflicting views on the state of ITIL; the purpose of this paper is to provide an objective overview of the available information about ITIL adoption and benefits. At the end of the paper we also comment on some other interesting findings that came out of the selected studies.
3 MethodologyThe Cochrane Collaboration is a group of over 28,000 volunteers in more than 100 countries who review the effects of health care. Their excellent open-learning resource on the conduct of systematic reviews1 was used as a model for this review. It says:
Reviews can be unscientific and biased in the way they collect, appraise and summarise information. Systematic reviews attempt to minimise these biases to provide a reliable basis for making decisions.
The steps of a systematic review:
■ Define the question
■ Look for all studies reliably addressing the question
■ Sift the studies to select relevant ones
■ Assess the quality of the studies
■ Calculate results for each study (and combine them if appropriate)
■ Interpret results.
We searched Google (of course) and Google Scholar. We also solicited input from a number of organizations in the ITIL industry and academic institutions known to be investigating ITIL.
The selection criteria were:
■ the research was done in the last three years (2008–2011)
■ includes metrics about the extent of ITIL adoption
■ includes metrics or lists of benefits derived from ITIL
■ no vendor-sponsored analysis of a single client.
The result of the search was more than 50 different studies, of which 23 had relevant data or findings about adoption levels and benefits.
These 23 studies (see Chapter 8) were reviewed and their key findings collated.
1 http://www.cochrane-net.org/openlearning
Review of recent ITIL® studies 3
3.1 Reliability and validity testsVery few of the studies were sufficiently detailed or statistically rigorous enough to allow any analysis of reliability or validity. (‘Reliability is the consistency of your measurement, or the degree to which an instrument measures the same way each time it is used. Validity is the strength of our conclusions, inferences or propositions.’2)
None of the scientific methods of assessing reliability and validity are applicable to ITIL studies because:
■ There are no control groups.
■ In the studies, examined measurements were never – to our knowledge – applied multiple times to the same subject.
■ In these studies, there are not enough data points to group them to test internal consistency, and the research seldom applies the test.
■ Causality is generally assumed and not tested.
■ Generalization to other settings was not tested in most of the studies.
■ Most of the measured situations are too complex to eliminate – or even detect – internal validity threats.
■ ‘Measurement’ is anecdotal in all of these studies: self-reporting, not actually measured in any objective way.
Instead, a subjective reliability index was assigned to each paper using one point for each of eight criteria:
■ Was it a random sample?
■ Was it a random selection from the sample?
■ Was there a control?
■ Were the results actually measured as compared to anecdotally self-reported by interviewees?
■ Can the results be generalized to the wider population?
■ Was the study performed by an agency independent of vendors?
■ Is the raw data available?
■ Is the methodology explained?
The average reliability index was 2.7 out of 8, and no study scored over 4. This indicates lower levels of reliability, though it should be noted that in some cases the answer was unknown due to insufficient information about the methodology, which was treated as a negative.
2 See Appendix B (Glossary) of Title II (Sections 205 through 208) of the US Higher Education Act http://title2.ed.gov/TA/Glossary.pdf
Karen Ferris: I think the findings of this systematic review have identified an opportunity for the IT service management (ITSM) industry: a more ‘scientific’ approach to determining (a) the use of the ITIL framework in organizations, (b) the degree of usage, and (c) the benefits realized.
This should be an independent and objective study that is not driving for a particular outcome, e.g. proving that organizations need ITIL.
Robert Stroud:
■ The proliferation of varied surveys and studies that lack independence identifies an opportunity for a regular consistent targeted independent survey.
■ The lack of valid return on investment (ROI) data is consistent with the anecdotal data I have received from many independent interviews.
■ In my conversations, I have discovered that most ITIL initiatives are ITIL initiatives, not part of a wider business transformation exercise.
David Favelle: Adoption by geography and IT market maturity is a factor I’m keen to see some findings on at some point. Correlation to the IT Service Management Forum (itSMF) chapters and vendor presence is something I’ve noted. I’d be hoping to see adoption trends over time in certain geographies; e.g. I could put together a product lifecycle for ITIL service operations in Australia and correlate to the training numbers but if you roll it up to a global level it’s really hard to make any real conclusions.
The IT Skeptic: My concern with a number of studies that are published (from the vendor and analyst communities rather than from academia) is that the ‘research’ is:
■ commissioned to prove a point, like cancer research paid for by the tobacco industry, but with less observers ready to cry ‘foul’
■ created as a revenue-generating exercise, therefore the results need to be useful, attention getting and self-serving (grow the market)
■ often anecdotal and opinion-based
■ often asked of the wrong person: ‘How brilliant were you …?’, ‘Did you make the right decision to…?’, ‘What ROI have you had from your spending…?’
4 Review of recent ITIL® studies
© APM Group Ltd 2011
Review of recent ITIL® studies 5
© APM Group Ltd 2011
■ lacking transparency (and hence impossible to reproduce): What was the methodology?, What questions were actually asked?, How was the sample derived?, What controls were there? (Generally, none), What were the raw results?
■ no peer review. Where are the academic and professional ITSM journals and ITSM conferences with real review panels?
It sometimes seems that any number at all will do as an excuse for a press release. We need more scientific rigour in our study of ITSM.
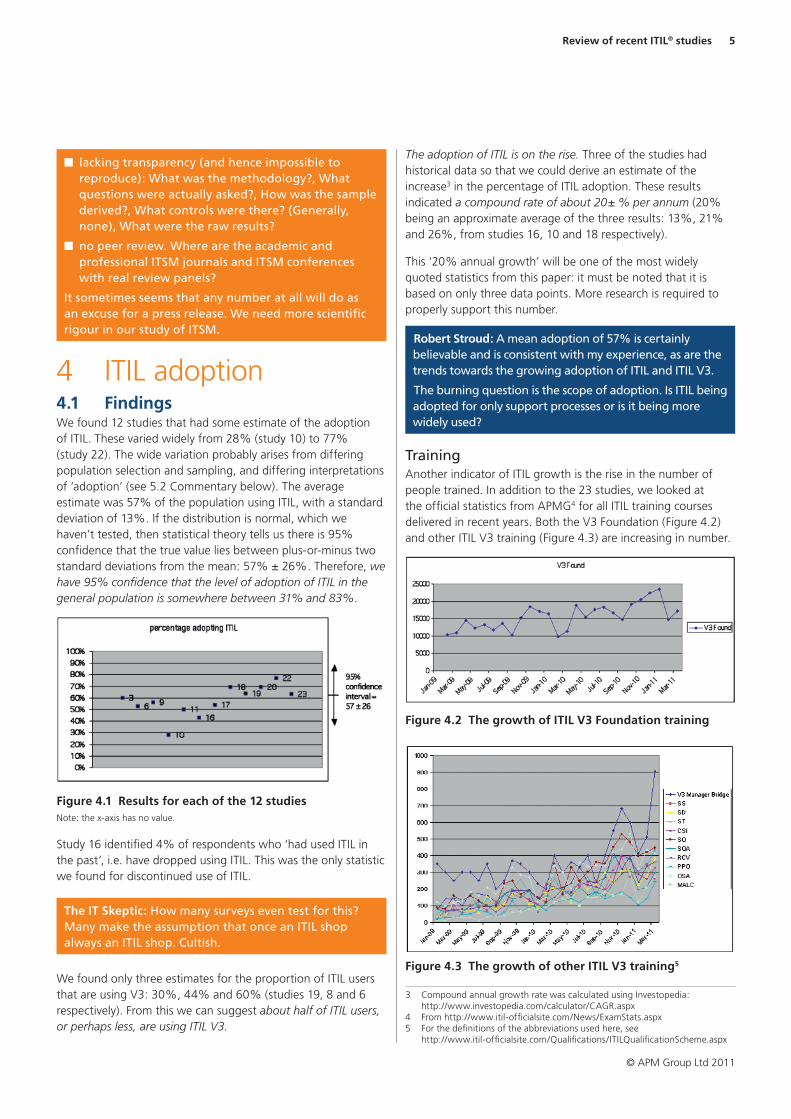
4 ITIL adoption4.1 FindingsWe found 12 studies that had some estimate of the adoption of ITIL. These varied widely from 28% (study 10) to 77% (study 22). The wide variation probably arises from differing population selection and sampling, and differing interpretations of ‘adoption’ (see 5.2 Commentary below). The average estimate was 57% of the population using ITIL, with a standard deviation of 13%. If the distribution is normal, which we haven’t tested, then statistical theory tells us there is 95% confidence that the true value lies between plus-or-minus two standard deviations from the mean: 57% ± 26%. Therefore, we have 95% confidence that the level of adoption of ITIL in the general population is somewhere between 31% and 83%.
Figure 4.1 Results for each of the 12 studiesNote: the x-axis has no value.
Study 16 identified 4% of respondents who ‘had used ITIL in the past’, i.e. have dropped using ITIL. This was the only statistic we found for discontinued use of ITIL.
The IT Skeptic: How many surveys even test for this? Many make the assumption that once an ITIL shop always an ITIL shop. Cultish.
We found only three estimates for the proportion of ITIL users that are using V3: 30%, 44% and 60% (studies 19, 8 and 6 respectively). From this we can suggest about half of ITIL users, or perhaps less, are using ITIL V3.
The adoption of ITIL is on the rise. Three of the studies had historical data so that we could derive an estimate of the increase3 in the percentage of ITIL adoption. These results indicated a compound rate of about 20± % per annum (20% being an approximate average of the three results: 13%, 21% and 26%, from studies 16, 10 and 18 respectively).
This ‘20% annual growth’ will be one of the most widely quoted statistics from this paper: it must be noted that it is based on only three data points. More research is required to properly support this number.
Robert Stroud: A mean adoption of 57% is certainly believable and is consistent with my experience, as are the trends towards the growing adoption of ITIL and ITIL V3.
The burning question is the scope of adoption. Is ITIL being adopted for only support processes or is it being more widely used?
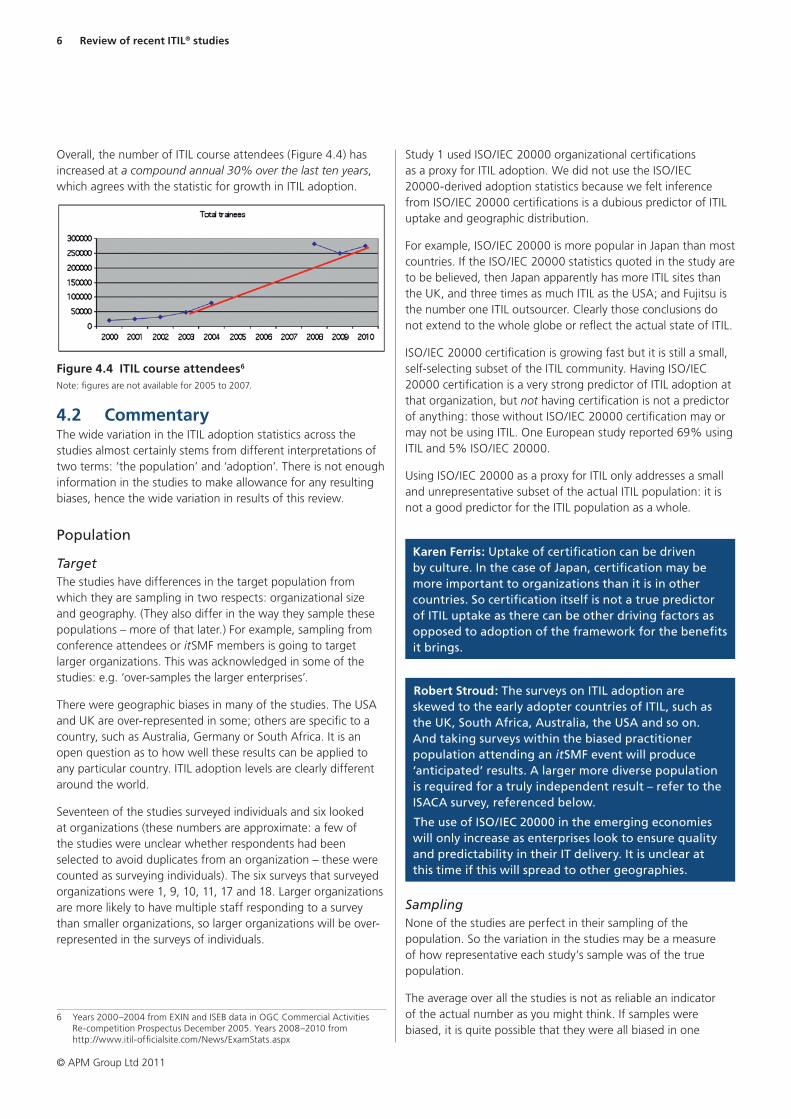
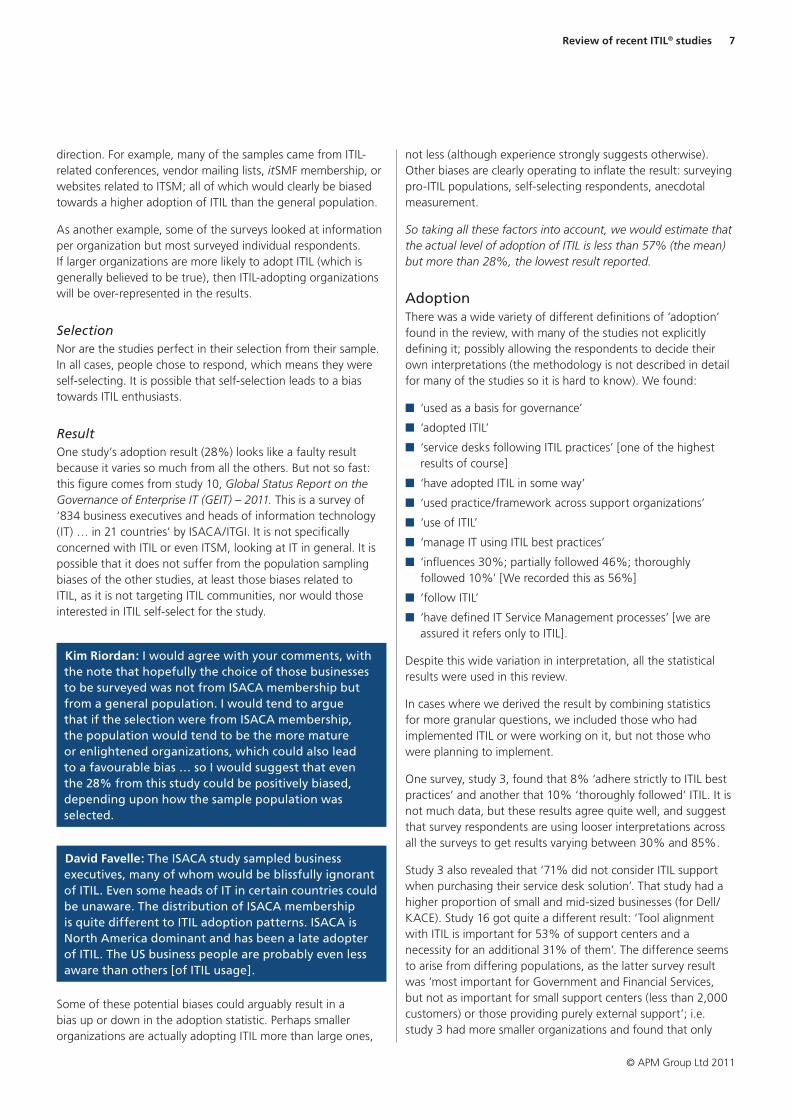
TrainingAnother indicator of ITIL growth is the rise in the number of people trained. In addition to the 23 studies, we looked at the official statistics from APMG4 for all ITIL training courses delivered in recent years. Both the V3 Foundation (Figure 4.2) and other ITIL V3 training (Figure 4.3) are increasing in number.
Figure 4.2 The growth of ITIL V3 Foundation training
Figure 4.3 The growth of other ITIL V3 training5
3 Compound annual growth rate was calculated using Investopedia: http://www.investopedia.com/calculator/CAGR.aspx
4 From http://www.itil-officialsite.com/News/ExamStats.aspx5 For the definitions of the abbreviations used here, see
http://www.itil-officialsite.com/Qualifications/ITILQualificationScheme.aspx
6 Review of recent ITIL® studies
© APM Group Ltd 2011
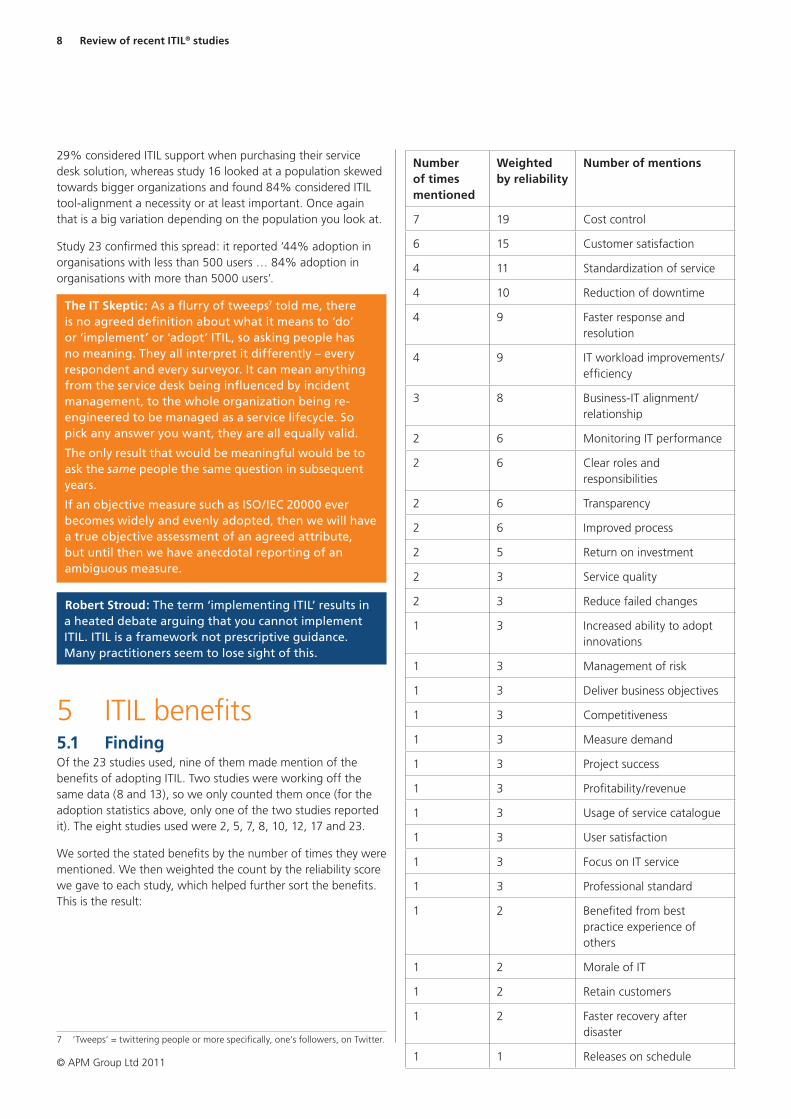
Overall, the number of ITIL course attendees (Figure 4.4) has increased at a compound annual 30% over the last ten years, which agrees with the statistic for growth in ITIL adoption.
Figure 4.4 ITIL course attendees6 Note: figures are not available for 2005 to 2007.
4.2 CommentaryThe wide variation in the ITIL adoption statistics across the studies almost certainly stems from different interpretations of two terms: ‘the population’ and ‘adoption’. There is not enough information in the studies to make allowance for any resulting biases, hence the wide variation in results of this review.
Population
TargetThe studies have differences in the target population from which they are sampling in two respects: organizational size and geography. (They also differ in the way they sample these populations – more of that later.) For example, sampling from conference attendees or itSMF members is going to target larger organizations. This was acknowledged in some of the studies: e.g. ‘over-samples the larger enterprises’.
There were geographic biases in many of the studies. The USA and UK are over-represented in some; others are specific to a country, such as Australia, Germany or South Africa. It is an open question as to how well these results can be applied to any particular country. ITIL adoption levels are clearly different around the world.
Seventeen of the studies surveyed individuals and six looked at organizations (these numbers are approximate: a few of the studies were unclear whether respondents had been selected to avoid duplicates from an organization – these were counted as surveying individuals). The six surveys that surveyed organizations were 1, 9, 10, 11, 17 and 18. Larger organizations are more likely to have multiple staff responding to a survey than smaller organizations, so larger organizations will be over-represented in the surveys of individuals.
6 Years 2000–2004 from EXIN and ISEB data in OGC Commercial Activities Re-competition Prospectus December 2005. Years 2008–2010 from http://www.itil-officialsite.com/News/ExamStats.aspx
Study 1 used ISO/IEC 20000 organizational certifications as a proxy for ITIL adoption. We did not use the ISO/IEC 20000-derived adoption statistics because we felt inference from ISO/IEC 20000 certifications is a dubious predictor of ITIL uptake and geographic distribution.
For example, ISO/IEC 20000 is more popular in Japan than most countries. If the ISO/IEC 20000 statistics quoted in the study are to be believed, then Japan apparently has more ITIL sites than the UK, and three times as much ITIL as the USA; and Fujitsu is the number one ITIL outsourcer. Clearly those conclusions do not extend to the whole globe or reflect the actual state of ITIL.
ISO/IEC 20000 certification is growing fast but it is still a small, self-selecting subset of the ITIL community. Having ISO/IEC 20000 certification is a very strong predictor of ITIL adoption at that organization, but not having certification is not a predictor of anything: those without ISO/IEC 20000 certification may or may not be using ITIL. One European study reported 69% using ITIL and 5% ISO/IEC 20000.
Using ISO/IEC 20000 as a proxy for ITIL only addresses a small and unrepresentative subset of the actual ITIL population: it is not a good predictor for the ITIL population as a whole.
Karen Ferris: Uptake of certification can be driven by culture. In the case of Japan, certification may be more important to organizations than it is in other countries. So certification itself is not a true predictor of ITIL uptake as there can be other driving factors as opposed to adoption of the framework for the benefits it brings.
Robert Stroud: The surveys on ITIL adoption are skewed to the early adopter countries of ITIL, such as the UK, South Africa, Australia, the USA and so on. And taking surveys within the biased practitioner population attending an itSMF event will produce ‘anticipated’ results. A larger more diverse population is required for a truly independent result – refer to the ISACA survey, referenced below.
The use of ISO/IEC 20000 in the emerging economies will only increase as enterprises look to ensure quality and predictability in their IT delivery. It is unclear at this time if this will spread to other geographies.
SamplingNone of the studies are perfect in their sampling of the population. So the variation in the studies may be a measure of how representative each study’s sample was of the true population.
The average over all the studies is not as reliable an indicator of the actual number as you might think. If samples were biased, it is quite possible that they were all biased in one
Review of recent ITIL® studies 7
© APM Group Ltd 2011
direction. For example, many of the samples came from ITIL-related conferences, vendor mailing lists, itSMF membership, or websites related to ITSM; all of which would clearly be biased towards a higher adoption of ITIL than the general population.
As another example, some of the surveys looked at information per organization but most surveyed individual respondents. If larger organizations are more likely to adopt ITIL (which is generally believed to be true), then ITIL-adopting organizations will be over-represented in the results.
SelectionNor are the studies perfect in their selection from their sample. In all cases, people chose to respond, which means they were self-selecting. It is possible that self-selection leads to a bias towards ITIL enthusiasts.
ResultOne study’s adoption result (28%) looks like a faulty result because it varies so much from all the others. But not so fast: this figure comes from study 10, Global Status Report on the Governance of Enterprise IT (GEIT) – 2011. This is a survey of ‘834 business executives and heads of information technology (IT) … in 21 countries’ by ISACA/ITGI. It is not specifically concerned with ITIL or even ITSM, looking at IT in general. It is possible that it does not suffer from the population sampling biases of the other studies, at least those biases related to ITIL, as it is not targeting ITIL communities, nor would those interested in ITIL self-select for the study.
Kim Riordan: I would agree with your comments, with the note that hopefully the choice of those businesses to be surveyed was not from ISACA membership but from a general population. I would tend to argue that if the selection were from ISACA membership, the population would tend to be the more mature or enlightened organizations, which could also lead to a favourable bias … so I would suggest that even the 28% from this study could be positively biased, depending upon how the sample population was selected.
David Favelle: The ISACA study sampled business executives, many of whom would be blissfully ignorant of ITIL. Even some heads of IT in certain countries could be unaware. The distribution of ISACA membership is quite different to ITIL adoption patterns. ISACA is North America dominant and has been a late adopter of ITIL. The US business people are probably even less aware than others [of ITIL usage].
Some of these potential biases could arguably result in a bias up or down in the adoption statistic. Perhaps smaller organizations are actually adopting ITIL more than large ones,
not less (although experience strongly suggests otherwise). Other biases are clearly operating to inflate the result: surveying pro-ITIL populations, self-selecting respondents, anecdotal measurement.
So taking all these factors into account, we would estimate that the actual level of adoption of ITIL is less than 57% (the mean) but more than 28%, the lowest result reported.
AdoptionThere was a wide variety of different definitions of ‘adoption’ found in the review, with many of the studies not explicitly defining it; possibly allowing the respondents to decide their own interpretations (the methodology is not described in detail for many of the studies so it is hard to know). We found:
■ ‘used as a basis for governance’
■ ‘adopted ITIL’
■ ‘service desks following ITIL practices’ [one of the highest results of course]
■ ‘have adopted ITIL in some way’
■ ‘used practice/framework across support organizations’
■ ‘use of ITIL’
■ ‘manage IT using ITIL best practices’
■ ‘influences 30%; partially followed 46%; thoroughly followed 10%’ [We recorded this as 56%]
■ ‘follow ITIL’
■ ‘have defined IT Service Management processes’ [we are assured it refers only to ITIL].
Despite this wide variation in interpretation, all the statistical results were used in this review.
In cases where we derived the result by combining statistics for more granular questions, we included those who had implemented ITIL or were working on it, but not those who were planning to implement.
One survey, study 3, found that 8% ‘adhere strictly to ITIL best practices’ and another that 10% ‘thoroughly followed’ ITIL. It is not much data, but these results agree quite well, and suggest that survey respondents are using looser interpretations across all the surveys to get results varying between 30% and 85%.
Study 3 also revealed that ‘71% did not consider ITIL support when purchasing their service desk solution’. That study had a higher proportion of small and mid-sized businesses (for Dell/KACE). Study 16 got quite a different result: ‘Tool alignment with ITIL is important for 53% of support centers and a necessity for an additional 31% of them’. The difference seems to arise from differing populations, as the latter survey result was ‘most important for Government and Financial Services, but not as important for small support centers (less than 2,000 customers) or those providing purely external support’; i.e. study 3 had more smaller organizations and found that only
8 Review of recent ITIL® studies
© APM Group Ltd 2011
29% considered ITIL support when purchasing their service desk solution, whereas study 16 looked at a population skewed towards bigger organizations and found 84% considered ITIL tool-alignment a necessity or at least important. Once again that is a big variation depending on the population you look at.
Study 23 confirmed this spread: it reported ‘44% adoption in organisations with less than 500 users … 84% adoption in organisations with more than 5000 users’.
The IT Skeptic: As a flurry of tweeps7 told me, there is no agreed definition about what it means to ‘do’ or ‘implement’ or ‘adopt’ ITIL, so asking people has no meaning. They all interpret it differently – every respondent and every surveyor. It can mean anything from the service desk being influenced by incident management, to the whole organization being re-engineered to be managed as a service lifecycle. So pick any answer you want, they are all equally valid.
The only result that would be meaningful would be to ask the same people the same question in subsequent years.
If an objective measure such as ISO/IEC 20000 ever becomes widely and evenly adopted, then we will have a true objective assessment of an agreed attribute, but until then we have anecdotal reporting of an ambiguous measure.
Robert Stroud: The term ‘implementing ITIL’ results in a heated debate arguing that you cannot implement ITIL. ITIL is a framework not prescriptive guidance. Many practitioners seem to lose sight of this.
5 ITIL benefits5.1 FindingOf the 23 studies used, nine of them made mention of the benefits of adopting ITIL. Two studies were working off the same data (8 and 13), so we only counted them once (for the adoption statistics above, only one of the two studies reported it). The eight studies used were 2, 5, 7, 8, 10, 12, 17 and 23.
We sorted the stated benefits by the number of times they were mentioned. We then weighted the count by the reliability score we gave to each study, which helped further sort the benefits. This is the result:
7 ‘Tweeps’ = twittering people or more specifically, one’s followers, on Twitter.
Number of times mentioned
Weighted by reliability
Number of mentions
7 19 Cost control
6 15 Customer satisfaction
4 11 Standardization of service
4 10 Reduction of downtime
4 9 Faster response and resolution
4 9 IT workload improvements/efficiency
3 8 Business-IT alignment/relationship
2 6 Monitoring IT performance
2 6 Clear roles and responsibilities
2 6 Transparency
2 6 Improved process
2 5 Return on investment
2 3 Service quality
2 3 Reduce failed changes
1 3 Increased ability to adopt innovations
1 3 Management of risk
1 3 Deliver business objectives
1 3 Competitiveness
1 3 Measure demand
1 3 Project success
1 3 Profitability/revenue
1 3 Usage of service catalogue
1 3 User satisfaction
1 3 Focus on IT service
1 3 Professional standard
1 2 Benefited from best practice experience of others
1 2 Morale of IT
1 2 Retain customers
1 2 Faster recovery after disaster
1 1 Releases on schedule
Review of recent ITIL® studies 9
© APM Group Ltd 2011
Dan Lee: Interesting here that the primary focus appears to be on cost control/damage limitation, and not so much on ‘innovation’ and differentiating a business. It appears to be seen very much as an operational thing (think ITIL V2) as opposed to a strategic and differentiating asset (think the ITIL V3 theory).
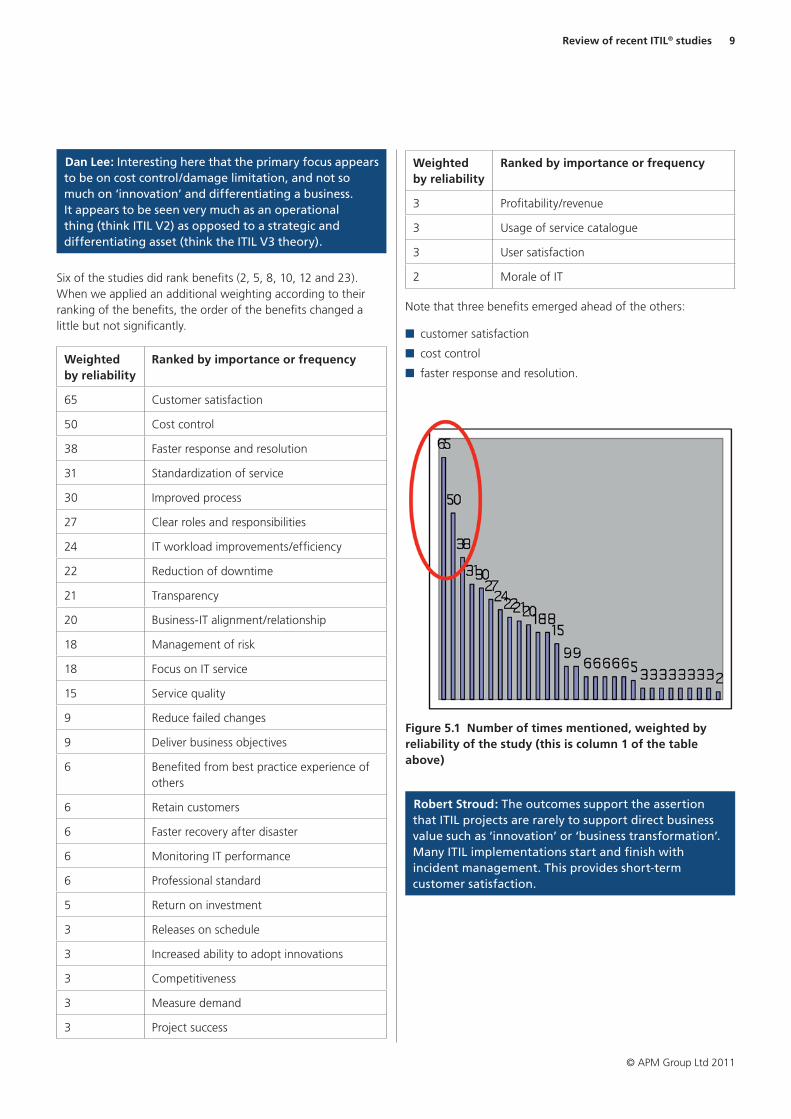
Six of the studies did rank benefits (2, 5, 8, 10, 12 and 23). When we applied an additional weighting according to their ranking of the benefits, the order of the benefits changed a little but not significantly.
Weighted by reliability
Ranked by importance or frequency
65 Customer satisfaction
50 Cost control
38 Faster response and resolution
31 Standardization of service
30 Improved process
27 Clear roles and responsibilities
24 IT workload improvements/efficiency
22 Reduction of downtime
21 Transparency
20 Business-IT alignment/relationship
18 Management of risk
18 Focus on IT service
15 Service quality
9 Reduce failed changes
9 Deliver business objectives
6 Benefited from best practice experience of others
6 Retain customers
6 Faster recovery after disaster
6 Monitoring IT performance
6 Professional standard
5 Return on investment
3 Releases on schedule
3 Increased ability to adopt innovations
3 Competitiveness
3 Measure demand
3 Project success
Weighted by reliability
Ranked by importance or frequency
3 Profitability/revenue
3 Usage of service catalogue
3 User satisfaction
2 Morale of IT
Note that three benefits emerged ahead of the others:
■ customer satisfaction
■ cost control
■ faster response and resolution.
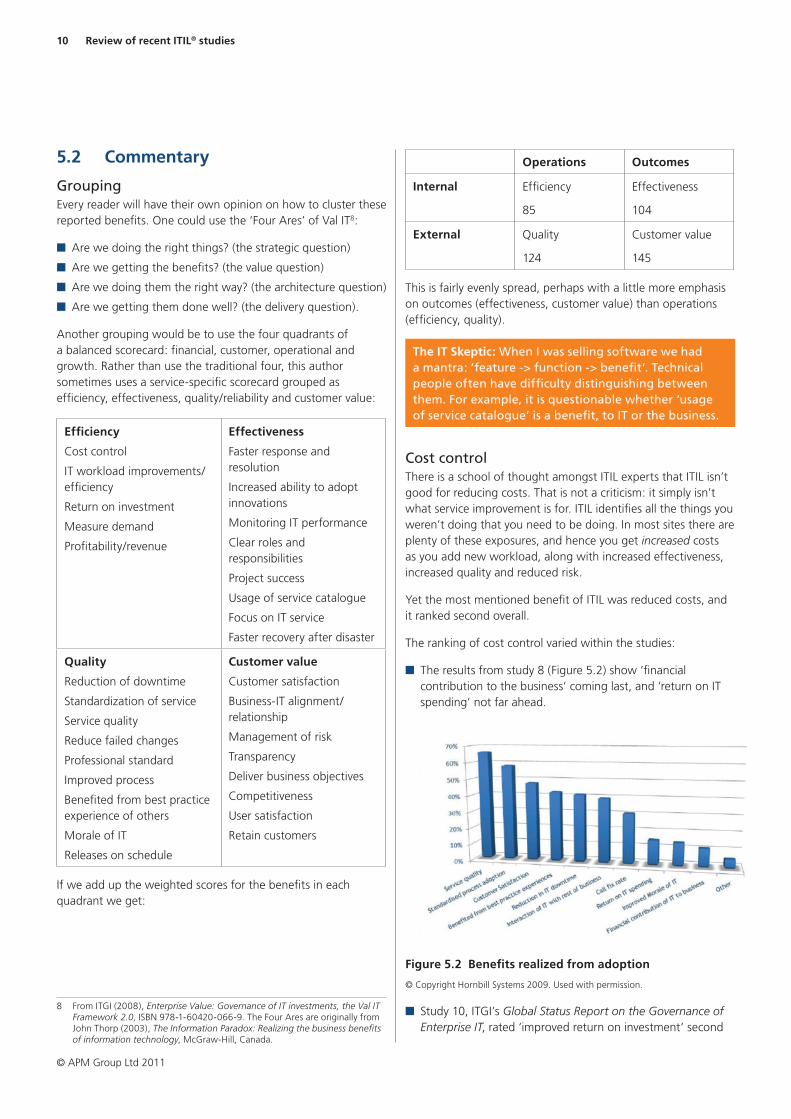
Figure 5.1 Number of times mentioned, weighted by reliability of the study (this is column 1 of the table above)
Robert Stroud: The outcomes support the assertion that ITIL projects are rarely to support direct business value such as ‘innovation’ or ‘business transformation’. Many ITIL implementations start and finish with incident management. This provides short-term customer satisfaction.
10 Review of recent ITIL® studies
© APM Group Ltd 2011
5.2 Commentary
GroupingEvery reader will have their own opinion on how to cluster these reported benefits. One could use the ‘Four Ares’ of Val IT8:
■ Are we doing the right things? (the strategic question)
■ Are we getting the benefits? (the value question)
■ Are we doing them the right way? (the architecture question)
■ Are we getting them done well? (the delivery question).
Another grouping would be to use the four quadrants of a balanced scorecard: financial, customer, operational and growth. Rather than use the traditional four, this author sometimes uses a service-specific scorecard grouped as efficiency, effectiveness, quality/reliability and customer value:
Efficiency
Cost control
IT workload improvements/efficiency
Return on investment
Measure demand
Profitability/revenue
Effectiveness
Faster response and resolution
Increased ability to adopt innovations
Monitoring IT performance
Clear roles and responsibilities
Project success
Usage of service catalogue
Focus on IT service
Faster recovery after disaster
Quality
Reduction of downtime
Standardization of service
Service quality
Reduce failed changes
Professional standard
Improved process
Benefited from best practice experience of others
Morale of IT
Releases on schedule
Customer value
Customer satisfaction
Business-IT alignment/relationship
Management of risk
Transparency
Deliver business objectives
Competitiveness
User satisfaction
Retain customers
If we add up the weighted scores for the benefits in each quadrant we get:
8 From ITGI (2008), Enterprise Value: Governance of IT investments, the Val IT Framework 2.0, ISBN 978-1-60420-066-9. The Four Ares are originally from John Thorp (2003), The Information Paradox: Realizing the business benefits of information technology, McGraw-Hill, Canada.
Operations Outcomes
Internal Efficiency
85
Effectiveness
104
External Quality
124
Customer value
145
This is fairly evenly spread, perhaps with a little more emphasis on outcomes (effectiveness, customer value) than operations (efficiency, quality).
The IT Skeptic: When I was selling software we had a mantra: ‘feature -> function -> benefit’. Technical people often have difficulty distinguishing between them. For example, it is questionable whether ‘usage of service catalogue’ is a benefit, to IT or the business.
Cost controlThere is a school of thought amongst ITIL experts that ITIL isn’t good for reducing costs. That is not a criticism: it simply isn’t what service improvement is for. ITIL identifies all the things you weren’t doing that you need to be doing. In most sites there are plenty of these exposures, and hence you get increased costs as you add new workload, along with increased effectiveness, increased quality and reduced risk.
Yet the most mentioned benefit of ITIL was reduced costs, and it ranked second overall.
The ranking of cost control varied within the studies:
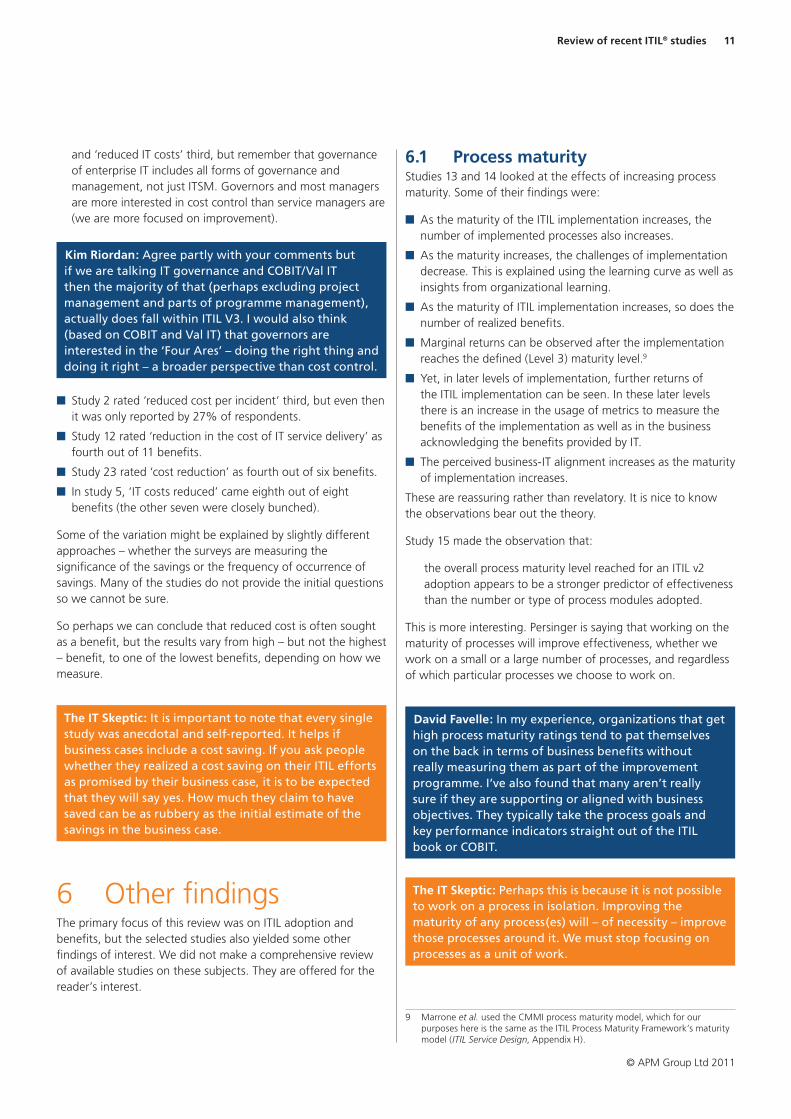
■ The results from study 8 (Figure 5.2) show ‘financial contribution to the business’ coming last, and ‘return on IT spending’ not far ahead.
Figure 5.2 Benefits realized from adoption
© Copyright Hornbill Systems 2009. Used with permission.
■ Study 10, ITGI’s Global Status Report on the Governance of Enterprise IT, rated ‘improved return on investment’ second
Review of recent ITIL® studies 11
© APM Group Ltd 2011
and ‘reduced IT costs’ third, but remember that governance of enterprise IT includes all forms of governance and management, not just ITSM. Governors and most managers are more interested in cost control than service managers are (we are more focused on improvement).
Kim Riordan: Agree partly with your comments but if we are talking IT governance and COBIT/Val IT then the majority of that (perhaps excluding project management and parts of programme management), actually does fall within ITIL V3. I would also think (based on COBIT and Val IT) that governors are interested in the ‘Four Ares’ – doing the right thing and doing it right – a broader perspective than cost control.
■ Study 2 rated ‘reduced cost per incident’ third, but even then it was only reported by 27% of respondents.
■ Study 12 rated ‘reduction in the cost of IT service delivery’ as fourth out of 11 benefits.
■ Study 23 rated ‘cost reduction’ as fourth out of six benefits.
■ In study 5, ‘IT costs reduced’ came eighth out of eight benefits (the other seven were closely bunched).
Some of the variation might be explained by slightly different approaches – whether the surveys are measuring the significance of the savings or the frequency of occurrence of savings. Many of the studies do not provide the initial questions so we cannot be sure.
So perhaps we can conclude that reduced cost is often sought as a benefit, but the results vary from high – but not the highest – benefit, to one of the lowest benefits, depending on how we measure.
The IT Skeptic: It is important to note that every single study was anecdotal and self-reported. It helps if business cases include a cost saving. If you ask people whether they realized a cost saving on their ITIL efforts as promised by their business case, it is to be expected that they will say yes. How much they claim to have saved can be as rubbery as the initial estimate of the savings in the business case.
6 Other findingsThe primary focus of this review was on ITIL adoption and benefits, but the selected studies also yielded some other findings of interest. We did not make a comprehensive review of available studies on these subjects. They are offered for the reader’s interest.
6.1 Process maturityStudies 13 and 14 looked at the effects of increasing process maturity. Some of their findings were:
■ As the maturity of the ITIL implementation increases, the number of implemented processes also increases.
■ As the maturity increases, the challenges of implementation decrease. This is explained using the learning curve as well as insights from organizational learning.
■ As the maturity of ITIL implementation increases, so does the number of realized benefits.
■ Marginal returns can be observed after the implementation reaches the defined (Level 3) maturity level.9
■ Yet, in later levels of implementation, further returns of the ITIL implementation can be seen. In these later levels there is an increase in the usage of metrics to measure the benefits of the implementation as well as in the business acknowledging the benefits provided by IT.
■ The perceived business-IT alignment increases as the maturity of implementation increases.
These are reassuring rather than revelatory. It is nice to know the observations bear out the theory.
Study 15 made the observation that:
the overall process maturity level reached for an ITIL v2 adoption appears to be a stronger predictor of effectiveness than the number or type of process modules adopted.
This is more interesting. Persinger is saying that working on the maturity of processes will improve effectiveness, whether we work on a small or a large number of processes, and regardless of which particular processes we choose to work on.
David Favelle: In my experience, organizations that get high process maturity ratings tend to pat themselves on the back in terms of business benefits without really measuring them as part of the improvement programme. I’ve also found that many aren’t really sure if they are supporting or aligned with business objectives. They typically take the process goals and key performance indicators straight out of the ITIL book or COBIT.
The IT Skeptic: Perhaps this is because it is not possible to work on a process in isolation. Improving the maturity of any process(es) will – of necessity – improve those processes around it. We must stop focusing on processes as a unit of work.
9 Marrone et al. used the CMMI process maturity model, which for our purposes here is the same as the ITIL Process Maturity Framework’s maturity model (ITIL Service Design, Appendix H).
12 Review of recent ITIL® studies
© APM Group Ltd 2011
6.2 Problem managementStudy 12 found that:
problem management – a process that requires organizational maturity and commitment – is the ITIL process most firms are currently [2010] implementing (24%) or planning to implement (24%). Furthermore, 43% currently follow ITIL problem management processes, reflecting a 91% adoption/soon-to-be-adopted rate among those surveyed.
Other surveys agreed. The statistics are not all directly comparable because some surveyed an ITIL-specific population and others a more general IT population, but all were high. This contradicts the conventional wisdom that problem management is immature and neglected. This study shows that while problem management does lag behind incident and change management, it is now reported to be widely implemented.
(One survey made the statement: ‘there is still a relatively low take up on problem management’ but provided no data.)
Karen Ferris: As with the term ‘adoption’ and the variation of interpretation, I think the same could apply to problem management. As noted above, the results contradict the conventional wisdom that problem management is immature and neglected.
I believe this could be the result of the misinterpretation of what problem management really is. From my experience, I have seen many iterations of problem management in organizations without any evidence of root cause analysis (RCA) activity taking place! The activity that is taking place is major incident management, which of course is incident management and not problem management. It might say problem management on the door but what is taking place behind it has little similarity to the process described in ITIL.
It may be common in ‘name’ but not in ‘practice’. For example, when I talk about problem management at conferences, I often ask the audience to indicate if their organization is doing ‘problem management’ by a show of hands. Generally the majority raise their hands. Whilst hands are still raised, I ask those who have heard the problem management folks in their organization talk about RCA techniques such as Kepner-Tregoe to keep their hands raised. I am often left with one or two hands still showing!
So I would agree that most recipients to a survey would say ‘Yes, we are doing problem management’, but I believe that further investigation or the provision of additional qualifying questions would prove otherwise. Perhaps another industry research opportunity?
Kim Riordan agreed: Perhaps the perception relates also to the true level of maturity of that process.
Robert Stroud agreed: Survey results reinforce my recent discussions with analysts that ITIL implementations are indeed maturing and problem management is being focused on as implementations mature.
David Favelle didn’t: Problem management is out there and high on the agenda of many once they’ve done service desk and incident management. People get it – not to say they do it well, mind you.
6.3 Service designStudy 4 makes the observation that:
In 2008 well over 50% of the ITSM improvement projects were focused on the Service Operation and Service Transition lifecycle stages. In 2011 Service Operations remains the top of the list by a healthy 10% however Service Design has moved into the 2nd spot over Service Transition.
Several studies commented on increasing interest in service catalogue (study 8 reported that ‘37% have already implemented a Service Catalog and 41% are developing one currently’), and there is increasing interest in request fulfilment, which also drives interest in service catalogue at the request level.
Karen Ferris: Totally agree – service catalogue is the 2010/2011 flavour of the month. It would be interesting to know what the drivers were for the 37% who have implemented and the 41% who are implementing. True business benefit or latest trend?
Robert Stroud: The issue with the significant increase in the service catalogue is that it is being leveraged fundamentally as a service request system. That’s a good start, but few go beyond this.
6.4 Configuration management database
Study 8 found that:
42% have already implemented a CMS or CMDB and that almost a quarter (24%) are developing one currently. Of those that have implemented, the majority have the relationship between CIs (78%) and the dependencies between IT services and the CIs (64%).
It should be noted that over one third do not consistently update through Change and Release Management, with 43% stating that their CMDB is not accurate.
Review of recent ITIL® studies 13
© APM Group Ltd 2011
The statistics may not be independent of each other, but as an estimate 42% × 64% × (100 – 43)% = 15% have an accurate content management system (CMS) or configuration management database (CMDB) implemented with the dependencies between IT services and the configuration items (by some definitions, having service dependencies is an essential feature of CMS). Given the probable bias of the data towards larger organizations and ITIL users, the figure for the general population will be lower still. (Other studies that measured configuration management reported 32%, 25% and 37%.)
Kim Riordan: If you don’t record the relationships it is really not a CMS/CMDB – so [those who don’t have the relationships] have an ‘asset register plus’.
Robert Stroud: My understanding is that many organizations that implement a detailed asset repository can call it a CMDB. Hard to prove without appropriately worded questions.
7 ConclusionITIL is widely adopted. The average figure was 57% across the studies we looked at. There was a wide variation (±26%) and any bias is probably going to inflate the figure. So we conclude that somewhere between 30% and 60% of organizations use ITIL, depending on what population you are looking at and how you define ‘use’. In some communities it is as high as 80% or 85%. Perhaps only 10% of the general population strictly or thoroughly use it.
Mark Flynn: Rather than conclude that ITIL implementation is somewhere between 30% and 60% (i.e. we just can’t tell), I think it’s more interesting that the research consistently suggested a minimum global take-up figure of 30%. That is pretty impressive when you take into account regional differences. It would be interesting to know if there are many other best practice standards that have a similar level of success internationally – I doubt it.
ITIL adoption and training are both increasing by about 20% compounding each year (this is a very approximate number but we arrived at it from two different types of data: adoption and training).
There are many benefits reported for ITIL. The top three by one method of ranking were:
■ customer satisfaction
■ cost control
■ faster response and resolution.
Other interesting findings to come out of the studies were:
■ Two studies show that maturity of process does pay off as predicted by theory.
■ Problem management is common, not far behind incident and change.
■ There is growing interest in service design, and especially service catalogue.
■ One study suggests fully-fledged, accurate and updated CMDBs or CMSs are not common, occurring in perhaps 10% of organizations … or less, depending again on what population you consider.
Kim Riordan: I would like to see some strong recommendations: perhaps a survey correctly designed to try to identify ITIL usage, overall and process by process; perhaps a database or information collection about maturity by process (differentiating between self-assessed and externally assessed); perhaps a standard for maturity assessment … . So many possibilities.
Robert Stroud: The results show that a well-formed independent survey is required to validate the findings. The outcomes are supportive of the widespread knowledge of ITIL.
The IT Skeptic: Did you ever notice how often about one third of a sample say there is not enough or too much of something? In a normal distribution (the classic bell curve), about a third are in the tail below the mean, a third are around the mean, and a third are in the tail above the mean. So in any survey which is measuring people’s relative perception, about a third will be too much and a third too little. It is like a survey discovering that a third of people are tall. I used this once to argue that a third of the human race will always be incompetent, no matter how much we all evolve and improve.
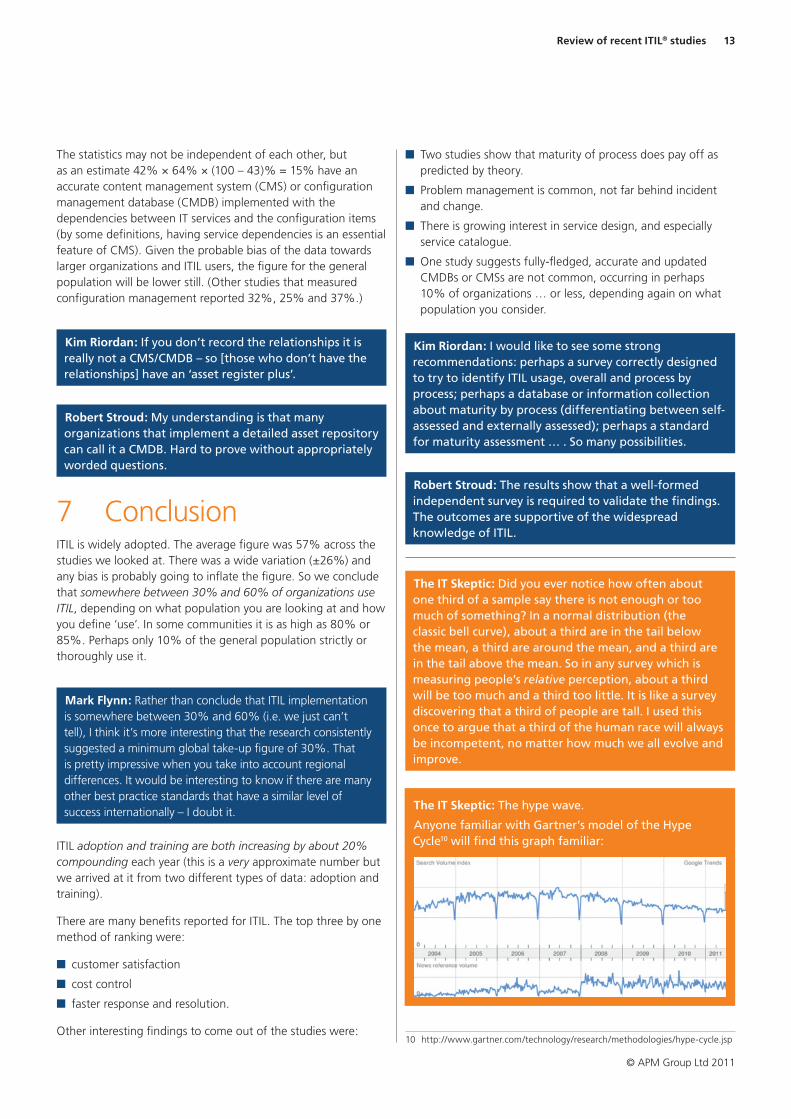
The IT Skeptic: The hype wave.
Anyone familiar with Gartner’s model of the Hype Cycle10 will find this graph familiar:
10 http://www.gartner.com/technology/research/methodologies/hype-cycle.jsp

14 Review of recent ITIL® studies
© APM Group Ltd 2011
It is the Google Trends curve for ITIL11. The top curve shows the worldwide number of searches for the term ‘ITIL’ and the bottom curve is the number of news items referring to ITIL.
This is unreliable data. As Google says, ‘Please keep in mind that several approximations are used when computing these results.’ For example, the news fi gures for 2007 seem odd. It is hard to believe that the world’s media lost interest in ITIL at the very time that interest in ITIL V3 was reaching fever pitch.
But if we are careful we can discern trends. So looking at the search curve at the top, we might be tempted to infer that ITIL is over the top of the Hype Cycle curve. And so it is in most parts of the world, e.g. the UK:
Clearly the Brits are over it. So are Australia, Brazil, Canada, France, Germany and Japan. (The China data is unclear.) But there is more to this.
First, a large chunk of the search traffi c comes from Indonesia, where ‘itil’ means something else, and not a suitable topic for polite conversation. Searches in Indonesian have been falling since Google tracked searches there.
The USA is down a bit but hardly falling like a Hype Cycle.
And in parts of the world the curve is fl at, such as India.
Nevertheless, there does seem to be an overall trend of falling interest in ITIL on Google. This does not contradict this paper’s conclusion that ITIL adoption is increasing. It simply shows that our understanding of ITIL is maturing. We really are over the hype cycle and starting to regard ITIL as ordinary.
Those who understand the Gartner Hype Cycle know we are now falling into the ‘Trough of Disillusionment’ as a reaction to the excessive hype in the past. This disillusionment is apparent in the current ‘backlash’ against ITIL in some circles.
11 http://www.google.com/trends?q=ITIL&ctab=0&geo=all&geor=all&date=all&sort=0
Whether the Google Trend graph is really showing this or not is debatable. If it is, it would be one of the longer hype cycles the IT industry has seen. Perhaps methodologies go through the cycle much slower than technologies? Or perhaps the Gartner Hype Cycle doesn’t apply at all. You decide.
8 List of studies1. Cater-Steel A., Tan W. and Toleman M. (2009), ‘Using
institutionalism as a lens to examine ITIL adoption and diffusion’, 20th Australasian Conference on Information Systems, 2–4 December 2009, Melbourne.
2. Cater-Steel A., Tan W. and Toleman M. (2010), itSMF Australia 2010 Conference: Summary report of ITSM standards and frameworks survey, University of Southern Queensland.
3. Dimensional Research (2011), Current Trends with Service Desk Tools, Dell KACE.
4. DuMoulin T. and Spalding G. (2011), The Seven Enablers and Constraints of IT Service Management: Research update 2011, Pink Elephant.
5. Hirth T. and Melander L. (2010) ‘ITIL practice and theory: An empirical study’, Masters thesis, Norges Handelshøyskole (Norwegian School of Economics and Business Administration).
6. Holub E. (2009), Implementing ITIL v.3: Theory versus reality, Gartner, 29 October.
7. Holub E. (2009), There’s Gold at the End of the ITIL Rainbow, Gartner, 20 October.
8. Hornbill (2009), ITIL: State of the nation survey fi ndings.
9. ITGI (2008), IT Governance and Process Maturity.
10. ITGI (2011) Global Status Report on the Governance of Enterprise IT (GEIT) – 2011.
11. Lubambo N. (2008), ‘Investigating the use of the ITIL framework towards IT service delivery at the NMMU’, Thesis, Nelson Mandela Metropolitan University.
12. Marquis H, Daly C. and Timpany G. (2010), ITIL Benefi ts to the Business, Global Knowledge and HDI.
13. Marrone M and Kolbe L (2010), ‘Uncovering ITIL claims: IT executives’ perception on benefi ts and business-IT alignment’, University of Goettingen.
14. Marrone M. and Kolbe L (2009), ‘ITIL and the creation of benefi ts: An empirical study on benefi ts, challenges and processes’, University of Goettingen.

Review of recent ITIL® studies 15
© APM Group Ltd 2011
15. Persinger J. (2010), ‘Summary of ITIL v2 effectiveness’, Dissertation, Indiana State University.
16. Rains J., Daly C. and Selva M. (2010), 2010 HDI Practices & Salary Report, HDI.
17. Rice C. (2008), ITIL Benefits Benchmarks Study Release, Glomark-Governan.
18. SDI (2008), ‘Service desk software vendors … The customer experience: Research paper 2008’, Service Desk Institute.
19. Smith S. (2009), ‘Service Desk Institute’s interactive survey results’, SDI and Hornbill.
20. Spafford G. (2011), ‘How to obtain real value from ITIL’, Gartner.
21. Timpany G. (2011), 2011 IT Skills and Salary Report, Global Knowledge and TechRepublic.
22. Wood D. (2009), Service Desk Benchmarking Report 2009, SDI.
23. RAAD for itSMFde (2008), ‘IT Service Management – Status und Potenziale’, translation by Stephan Brendel (APMG International).
About the authorRob England is an IT commentator, consultant, blogger, coach, trainer, and published author. He is best known for his controversial website and alter-ego, The IT Skeptic at www.itskeptic.org. Find out more about Rob at www.twohills.co.nz.
AcknowledgementsSourced by APM Group and published on www.best-management-practice.com
Our White Paper series should not be taken as constituting advice of any sort and no liability is accepted for any loss resulting from use of or reliance on its content. While every effort is made to ensure the accuracy and reliability of the information, TSO cannot accept responsibility for errors, omissions or inaccuracies. Content, diagrams, logos and jackets are correct at time of going to press but may be subject to change without notice.
© Copyright APM Group Ltd. Reproduction in full or part is prohibited without prior consent APM Group Ltd.
Trademarks and statementsThe Swirl logo™ is a Trade Mark of the Cabinet Office.
ITIL® is a Registered Trade Mark of the Cabinet Office.