Embed Size (px)
Citation preview

TREND REPORT REPORT ON TRENDS IN Water stressed regions
Techneau, November 2006
© 2006 TECHNEAU TECHNEAU is an Integrated Project Funded by the European Commission under the Sixth Framework Programme, Sustainable Development, Global Change and Ecosystems Thematic Priority Area (contractnumber 018320). All rights reserved. No part of this book may be reproduced, stored in a database or retrieval system, or published, in any form or in any way, electronically, mechanically, by print, photoprint, microfilm or any other means without prior written permission from the publisher
TECHNEAU REPORT ON TRENDS IN Water stressed regions
Techneau, November 2006

Colofon
Title Techneau Report On Trends In Water stressed regions Author(s) Rita Hochstrat, RWTH Aachen, Germany Quality Assurance By Chris Swartz, Swartz Water Utilisation Engineers Deliverable number D 1.1.2 This report is PU = Public
Executive Summary
Introduction The aim of work area 1 in the TECHNEAU project is to consider the capability of present water systems to cope with ongoing and future challenges. It is assumed that actual challenges and adaptive strategies will vary between countries and regions. This report on trends in water stressed region focuses on the specific situation in regions where either water availability or water quality are not sufficient to easily cover the demand for water at any time and place. It is essential to differentiate between transitory periods of water deficiency, due to an exceptional drought, and long-term imbalances of available water resources and demand. Nonetheless both phenomena constitute water stress and ask for specific provisions. Importance More frequent drought periods especially in southern European countries during the 1990s have repeatedly revealed the limitation of available water resources. The vulnerability of even temperate climate regions has become obvious in summer 2003 when a heat wave struck large parts of Europe. Portugal, Spain and France suffered another drought in 2005 with high losses in agricultural production and forest due to fires. This pushed the request to initiate a European action on water scarcity and droughts during the Environment Council of 9 March 2006. It is recognised that this issue has to be taken into consideration while implementing the Water Framework Directive. Specific aspects linked to water scarcity and droughts will be included in the work programme 2007-2009 of the Common Implementation strategy of the Water Framework Directive. Approach In order to make suitable projections, it was necessary to start with a mapping of the present situation. Another focus of the activities was on the future projections of the present situation and the identification of driving forces, factors which are leading to changes. The information on current situation and trends is primarily based on available reports and literature. Data material for this report was derived from statistical offices (Eurostat, UN, national and regional institutions) and environmental agencies as well as water suppliers. Future trends and estimations have been derived from scenarios expressed by regional, national or supranational organisations.
TECHNEAU Trends in water stressed regions © TECHNEAU - 1 - December 2006

Furthermore a questionnaire elaborated by the work area leader was sent out to acquire expert opinions. Result Providing good quality drinking water under water stressed conditions is a challenging task. Advanced technologies can support this undertaking but pose the financial burden to the water supplier exclusively and consequently might increase water prices. A better source protection and integrated water management approaches are indispensable to produce more sustainable solutions. Climate change will have an impact on water supply, partly because a reduction or deterioration of water sources is expected, but even more because there is a high uncertainty about these impacts. Although significant improvements have been achieved already, efforts to improve water quality have to continue and also include rehabilitation of contaminated water resources. Financing becomes more and more a limiting factor for realising appropriate solutions and adaptive strategies. More information The complete information is laid down in the report on trends in water stressed regions (Deliverable 1.1.2) Rita Hochstrat RWTH Aachen University Institut fuer Verfahrenstechnik +49 241 8090585 [email protected]
TECHNEAU Trends in water stressed regions © TECHNEAU - 2 - December 2006
TECHNEAU Trends in water stressed regions © TECHNEAU - 3 - December 2006
TECHNEAU Knowledge Integrator (TKI) categorisation Categorisation of Knowledge Packages Categorisation (i.e. classification, contains and constraints) of knowledge packages (KPs) can be carried out by ‘checking’ the appropriate boxes in the tables (see attachment). For example, for a KP investigating point-of-use treatment suitable for a developing world country, the following might be checked: Classification: Process chain – Tap (Customer) – Point-of-use (POU). Contains: Report; Literature review. Constraints: Low cost; Simple technology; No/low skill requirement; No/low energy requirement; No/low chemical requirement; No/low sludge production; Developing world location. Note that only the lowest level classification needs to be checked, e.g. Point-of-use (POU) in the above example. Meta data can be included under the ‘More Information’ section of the Executive Summary Report, i.e. Author(s), Organisation(s), Contact details (name and email), Quality controller (name and organisation) and Date prepared. (The TKI administrator can enter Source (= TECHNEAU), Date submitted (TKI) and Date revised (TKI)).

TKI Categorisation
Classification Supply Chain Process Chain Process Chain (cont’d) Water Quality Water Quantity (cont’d) Source Raw water storage Sludge treatment Legislation/regulation - Leakage - Catchment - Supply reservoir - Settlement - Raw water (source) - Recycle - Groundwater - Bankside storage - Thickening - Treated water - Surface water Pretreatment - Dewatering Chemical - Spring water - Screening - Disposal - Organic compounds - Storm water - Microstraining Chemical dosing - Inorganic compounds - Brackish/seawater Primary treatment - pH adjustment - Disinfection by-products - Wastewater - Sedimentation - Coagulant - Corrosion Raw water storage - Rapid filtration - Polyelectrolyte - Scaling - Supply reservoir - Slow sand filtration - Disinfectant - Chlorine decay - Bankside storage - Bank filtration - Lead/plumbosolvency Microbiological Water treatment - Dune infiltration Control/instrumentation - Viruses Consumers / Risk - Pretreatment Secondary treatment - Flow - Parasites - Primary treatment - Coagulation/flocculation - Pressure - Bacteria Trust - Secondary treatment - Sedimentation - pH - Fungi - In water safety/quality - Sludge treatment - Filtration - Chlorine Aesthetic - In security of supply Treated water storage - Dissolved air
flotation(DAF) - Dosing - Hardness / alkalinity - In suppliers
- Service reservoir - Ion exchange - Telemetry - pH - In regulations and regulators
Distribution - Membrane treatment Analysis - Turbidity Willingness-to-pay/acceptance
- Pumps - Adsorption - Chemical - Colour - For safety - Supply pipe / main - Disinfection - Microbiological - Taste - For improved
taste/odour
Tap (Customer) - Dechlorination - Physical - Odour - For infrastructure - Supply (service) pipe Treated water storage - For security of supply
TECHNEAU Trends in water stressed regions© TECHNEAU - 4 - December 2006

TECHNEAU Trends in water stressed regions© TECHNEAU - 5 - December 2006
- Internal plumbing - Service reservoir Water Quantity Risk Communication - Internal storage Distribution - Communication strategies - Disinfection Source - Potential pitfalls - Lead/plumbosolvency - Source management - Proven techniques - Manganese control - Alternative source(s) - Biofilm control Management Tap (Customer) - Water balance - Point-of-entry (POE) - Demand/supply trend(s) x - Point-of-use (POU) - Demand reduction
TKI Categorisation (continued) Contains Constraints Meta data Report x Low cost Author(s) Rita Hochstrat Database Simple technology Organisation(s) RWTH Spreadsheet No/low skill requirement Contact name Rita Hochstrat Model No/low energy
requirement Contact email [email protected]
aachen.de
Research No/low chemical requirement
Quality controller name Chris Swartz
Literature review x No/low sludge production Quality controller organisation
Swartz Water Utilisation Engineers
Trend analysis x Rural location Source Case study / demonstration Developing world location Date prepared December 2006 Financial / organisational Date submitted (TKI) Methodology Date revised (TKI) Legislation / regulation Benchmarking

Contents
Executive Summary 1
Contents 6
1 General Description 8 1.1 Water stress 8 1.1.1 Water availability 8 1.1.2 Sectoral water use 8 1.1.3 Water stress index 9 1.2 The challenge for water supply 10 1.2.1 References 11
2 Summary of the questionnaire 12
3 Top trends 13 3.1 Environmental awareness 13 3.1.1 Introduction 13 3.1.2 Definitions 13 3.1.3 Driving Forces 14 3.1.4 General Implications 15 3.1.5 Implications for the water industry 15 3.1.6 Adaptive Strategies 15 3.1.7 Conclusion 16 3.1.8 References 16 3.2 State of the aquatic environment - emerging pollutants 17 3.2.1 Introduction 17 3.2.2 Definitions 17 3.2.3 Driving forces 20 3.2.4 General Implications 21 3.2.5 Implications for the water industry 21 3.2.6 Adaptive Strategies 22 3.2.7 Conclusions 23 3.2.8 References 23 3.3 Climate change 26 3.3.1 Introduction 26 3.3.2 Definitions 26 3.3.3 Driving Forces 28 3.3.4 General Implications 28 3.3.5 Implications for the water industry 29 3.3.6 Adaptive Strategies 29 3.3.7 References 30 3.4 Population development 32 3.4.1 Introduction 32 3.4.2 Definitions 32 3.4.3 Driving Forces 33 3.4.4 General Implications 33
TECHNEAU Trends in water stressed regions © TECHNEAU - 6 - December 2006

3.4.5 Implications for the water industry 34 3.4.6 Adaptive Strategies 35 3.4.7 References 35 3.5 Increasing energy demand and cost of electricity 37 3.5.1 Introduction 37 3.5.2 Definitions 37 3.5.3 Driving Forces 39 3.5.4 General Implications 39 3.5.5 Implications for the water industry 39 3.5.6 Adaptive Strategies 40 3.5.7 References: 40 3.6 Liberalisation and privatisation of public services 41 3.6.1 Introduction 41 3.6.2 Definitions 41 3.6.3 Driving Forces 41 3.6.4 General Implications 41 3.6.5 Implications for the water industry 42 3.6.6 Adaptive Strategies 42 3.6.7 References 42
4 Conclusions 43 4.1 Exploitation of alternative water resources 43 4.1.1 Desalination 43 4.1.2 Water reuse 43 4.1.3 Rainwater harvesting 44 4.2 Water use restrictions 44 4.3 Improved monitoring of water quality 45 4.4 Advanced treatment technologies 45 4.5 References 45
TECHNEAU Trends in water stressed regions © TECHNEAU - 7 - December 2006

1 General Description
1.1 Water stress Water stress occurs when the demand for water exceeds the available amount during a certain period or in a particular area or when poor quality restricts its use. Water stress is often related to the deterioration of fresh water resources in terms of both quantity and quality. Overexploited aquifers, low flow or even dry rivers, are typical indicators and at the same time promoters for water stress. The situation is often aggravated by quality problems such as eutrophication, organic matter pollution or saline intrusion (EEA, 1999). Water stress leads to sectoral competition and thus necessitates to expand water supply and to tap new or alternative resources as the conventional ones become exhausted.
1.1.1 Water availability The total renewable freshwater resource of a region is the amount of water flowing in rivers and aquifers, originating either from precipitation over the region (internal water resource) or from water received from neighbouring countries in case of trans-boundary rivers and aquifers (external water resource) (EEA, 1999).
1.1.2 Sectoral water use Water use is mainly affected by three sectors: agriculture, industry and households. On average, in the European Union 14% of total water abstraction is used for public water supply, 30 % in agriculture, 10% in industry (excluding cooling water) and 46% as cooling water, mainly for power generation (Eurostat, 2003, AQUAREC, 2006).
0%
25%
50%
75%
100%
Luxe
mbo
urg
UK
Mal
ta
Cze
ch R
ep.
Den
mar
k
Switz
erla
nd
Rom
ania
Pola
nd
Net
herla
nds
Fran
ce
Bel
gium
Ger
man
y
Hun
gary
Slov
enia
Bul
garia
Lith
uani
a
Esto
nia
Slov
ak R
ep.
Swed
en
Nor
way
Latv
ia
Irela
nd
Aus
tria
Finl
and
Cyp
rus
Italy
Spai
n
Turk
ey
Gre
ece
Port
ugal
Perc
enta
ge o
f tot
al fr
eshw
ater
abs
trac
tion
Public water supply Agriculture/Irrigation Industry Cooling/Electricity
Figure 1: Sectoral water use in European countries, (AQUAREC, 2006)
TECHNEAU Trends in water stressed regions © TECHNEAU - 8 - December 2006

As shown in Figure 1, the water use patterns in different European countries vary remarkably. It can be observed that there are four clusters of countries representing different predominant water uses: agricultural water use dominates the water regime of Italy, Cyprus, Greece, Portugal and Spain. Industrial application and cooling water use are most prominent in e.g. Bulgaria, Romania, Belgium, Finland, Germany, Ireland, Poland), whilst domestic water use makes up around 50% of total freshwater demand in e.g. Denmark, UK and Malta. All these countries may envisage different problems related to water and influenced by the predominant water use. Likewise, responses have to be taken on different levels and in different domains reflecting that main drivers and pressures are located in different sectors.
1.1.3 Water stress index The water stress index (WSI) is one indicator to quantify water stress in a region or country. It relates the parameters water availability and water use and is defined as the ratio of annual water withdrawal from groundwater and surface water to the total renewable freshwater resources. Hence high water stress indices can either be caused by low availability or excessive high water demand. The OECD (2003) defines a water stress index of more than 40% as high water stress, 20% to 40% classifies as medium-high, whilst 10% to 20% is defined as moderate water stress. Figure 2 reveals that approximately half of the European countries and almost 70% of the population are facing water stress issues. Israel and Belgium are exceeding water stress indices of 40% whilst Romania stays below the 10% threshold, but these data refer to the country-level and do not reflect the fact that water scarcity often appears at a regional scale.
0
20
40
60
80
100
120
Isra
el
Cyp
rus
Bul
garia
Mal
ta
Bel
gium
Spa
in
Ger
man
y
Italy
Turk
ey
Pol
and
Fran
ce
Den
mar
k
Por
tuga
l
Cze
ch R
epub
lic
Gre
ece
Lith
uani
a
Est
onia UK
Net
herla
nds
Slo
veni
a
Hun
gary
Sw
itzer
land
Aus
tria
Rom
ania
Slo
vak
Rep
ublic
Irela
nd
Finl
and
Luxe
mbo
urg
Latv
ia
Sw
eden
Nor
way
Wat
er S
tres
s In
dex
[%]
Figure 2: Water stress index for European countries, Israel and Turkey (AQUAREC, 2006)
TECHNEAU Trends in water stressed regions © TECHNEAU - 9 - December 2006

1.2 The challenge for water supply The original task of any water supply is to produce drinking water of a defined or desired quality from a source of given quality and quantity. In doing so, the choice of technology of treatment influences the cost of the service as do the characteristics of the supplied area (urban, remote, mountainous …). An adjusted appropriate financing and organisational structure has to be established to run this business (cf. Figure 3)
Technology (treatment & distribution)Cost implicationsEconomic efficiencyFinancingOrganisational structure
Waterresources
Legislative demandlimit values, quality standardsPublic awarenessConsumer expectations(Scientific) Knowledge
Water availability Source water qualityPhysical constraints
Water treatment, supply & water management
process
Water use & product
Figure 3: General scheme of boundary conditions and aims of water supply
In analysing the trends and developments leading to changes in the water sector this report focuses on aspects considered crucial for an aggravation or mitigation of water stress. It depicts a summary of trends not necessarily prevailing in each of the regions, but characterising their specific constraints. Additionally, where relevant, the trend analysis refers to situations in other water stressed regions to underpin the universality of particular developments. The report focuses in particular on three regions: Bucharest, Flanders and Israel, whose key characteristics are given in Table 1.
TECHNEAU Trends in water stressed regions © TECHNEAU - 10 - December 2006

Table 1: Summary of key figures of investigated regions
Bucharest Flanders Israel Geographical region
Central Europe
Western Europe
Mediterranean
Climate Continental Temperate maritime Semi-arid, arid
Average rainfall [mm]
600-700 mm 580 - 710 mm (coast) 820 mm Brussels
435 mm
Inhabitants 2 million 6 million 6.8 million Population trends declining coastal, tourist area
seasonal population peaks
growing resident population
Administrative level
Capital city, local Region Country
Organisation of drinking water utilities
PPP Public Public
Major drinking water source
Surface water / river water
Groundwater / Surface water (50:50)
Primarily surface water Groundwater
Drinking water price
0.49 EUR/m³ 0.11 EUR/m³ (ww)
1.65 EUR/m³ (dw) 0.65 EUR/m³ (ww)
0.70-0.90 EUR/m³
1.2.1 References AQUAREC (2006) Report on integrated water reuse concepts, Eds. Wintgens, T. and Hochstrat, R. (unpublished) EEA (1999) Environment in the European Union at the turn of the century State of Environment report No 1/1999 Chapter 3.5 "Water Stress" European Environment Agency, Copenhagen Eurostat (2003) Water Resources in the EU and in the Candidate Countries, Statistics in focus. Environment and Energy. Theme 8 - 03/2003 OECD (2003) Water – Performance and challenges in the OECD countries. Environmental Performance Reviews. Organisation for Economic Co-operation and Development, Paris
TECHNEAU Trends in water stressed regions © TECHNEAU - 11 - December 2006
2 Summary of the questionnaire
This section summarises the main findings of the factors addressed in the questionnaire. It takes into account the answers of the respondent and additional information from other available sources. Socio-cultural factors For all three regions the level of information of the consumer with regard to water issues is considered to be high. Particularly interest is paid to health aspect and water quality issues. It is striking that for Flanders and Bucharest no information could be found about the percentage of consumers drinking water directly from the tap. Approximately 50% of the Israeli population are estimated to actually drink tap water. Economical factors The financing models for water supply in the three regions differ. Water supply in Flanders is largely in public hands (municipal or inter-municipal companies) and will most probably stay so. The water supply in Bucharest is provided by the company "Apa Nova", controlled by the French group Veolia Water (84%) and by the Municipality Council (16%). The contract on this public private partnership was concluded in 2000 and has been signed for 25 years. Prices for drinking water have increased from 0.16 EUR/m³ to 0.25 EUR/m³ between 2001 and 2004. In Israel the state-owned company Mekorot accounts for 60% of the water supply. The remaining 40% are provided by municipal water utilities which are partly private-owned. Political factors The existence, tightening and review of legislative standard for e.g. bathing waters, drinking water, effluent discharge and the like, is unanimously considered to have beneficial effects on the state of drinking water resources. Technical factors Disinfection of raw and drinking water with chlorine will be replaced by ozonation, UV disinfection and the use of membranes. Membranes are supposed to increasingly be employed in desalination (reverse osmosis) and as substitute for deep bed filtration (ultrafiltration). Ecological factors As to the quality of water resources, nitrate presents a problem in all regions. Many aquifers exceed the limit value of 50 mg/L nitrate. Demographical factors Inhabitant numbers in Bucharest are declining. Belgium exhibits a moderate growth rate of 0.22% in 2005 which will be slowing down and turn into a negative growth of -0.19% by 2050. For Israel the population trend still heads upwards. Growth rates will be falling below 2% in 2015.
TECHNEAU Trends in water stressed regions © TECHNEAU - 12 - December 2006

3 Top trends
3.1 Environmental awareness
3.1.1 Introduction The last three decades have witnessed a European wide trend of increasing environmental awareness. Raising environmental awareness aims to catalyse, advocate, educate and promote the wise use and sustainable development of the environment. This affords to critically reflect and investigate the impacts of human behaviour on the environment and to communicate it to the public. Particularly in the EU 15 this has fed into political decisions and environmental policy making with binding environmental standards and mandatory restrictions. This development has been mainly driven by the work of non-governmental organisations and has also been advocated by green political parties – increasingly involved in political debates. As a societal issue, environmental awareness is raised at different levels of society:
− consumer /private person − industry − policy
Among the SEPTED dimensions this trend is classified SOCIO-CULTURAL and POLITICAL.
3.1.2 Definitions Environmental awareness is not restricted to a personal attitude or an individual evaluation but is also reflected by the societal preference. The prerequisite for awareness building is information. As for the population (private persons) environmental awareness comes along with environmental concern. In Belgium, ca. 90% of the population are concerned about the state of the environment, while at the same time considering themselves well informed (Mira-S, 2000). Policy making The most important attainment of increasing environmental awareness is the incorporation of environmental protection into binding legislation and regulations. On a European level, since 1970 a number of directives have been issued to define use related quality standards or to set emission limit values in order to minimise the impacts of diverse (industrial) activities on different environmental compartments. Industrial production & products
TECHNEAU Trends in water stressed regions © TECHNEAU - 13 - December 2006

The reduction of environmental impacts of industrial enterprises has been tackled by the COUNCIL DIRECTIVE 96/61/EC of 24 September 1996 concerning integrated pollution prevention and control (IPPC Directive). It lays down "measures designed to prevent or, where that is not practicable, to reduce emissions in the air, water and land from" a number of activities. Supportive documents defining best reference practice have been worked out to suggest technical solutions and best practices for water efficient, energy efficient and waste reducing production. Next to compulsory compliance with legislative requirements - often imposed during authorisation procedures - enterprises have increasingly adopted voluntary environmental management systems. These schemes support the continuous improvement of the environmental performance and acknowledge the possibilities to materialise monetary benefits from environmental protection measures (optimisation of processes with regard to material input, energy consumption, water use). Labelling of products to highlight their environmental merit is an increasing practice and a good guidance for consumers. Counter-trend: Although well informed, all players - policy, industry and consumer - do not orientate their decisions and behaviour towards the most environmental friendly solution. Environmental protection is desirable but not at any cost. National economies struggle to finance their social security systems, issues like risk of unemployment and insecure retirement conditions are gaining more attention. This leads to a desensitisation and loss of interest in environmental topics.
3.1.3 Driving Forces Trend:
− Funding of education campaigns and dissemination of knowledge (e.g. in Accession countries) through the work of NGO but also increasingly by state-funded organisation and agencies.
− A high level of education is favourable − Market penetration of water saving appliances. − Rational use of water and reduced consumption are partly enforced
by increased water prices Counter-trend: Developments fostering the counter trend include the following aspects
− On a political level majorities to impose even more stringent environmental standards cannot be found. Especially on EU level the challenge to integrate the new member states binds too many resources.
− Lack of clear signals and incentives to steer and support a preferred behaviour
TECHNEAU Trends in water stressed regions © TECHNEAU - 14 - December 2006

− Even though information is easily available via internet and media for everyone, it becomes even more difficult to select trustful sources and come to a decision.
3.1.4 General Implications Growing environmental awareness of the producing sector enables sustainable growth of economies. The acceptance of environmental products saves resources and energy.
3.1.5 Implications for the water industry Environmental awareness of consumers will influence their water use. Domestic and especially industrial water demand might further decline, which in turn produces overcapacities of today’s treatment and distribution systems. In an environmentally aware society, bottled water transported over long distances might become questionable with regard to the water miles it has accumulated. Consequently local sources would be preferred and that could also include tap water. Provided the trend for increasing bottled water consumption would be reversed, it would nonetheless only marginally effect the water industry. Bottled water consumption in Belgium amounts to 137 L/cap/year which equals 0.25% of the drinking water supplied, hence it would not necessitate severe adaptations in drinking water production. Increased understanding of sustainable resources management, awareness of the whole water cycle, increasing grasp of the interdependencies in the water cycle can prepare support for integrated measures and acceptance of increasing cost for water services
3.1.6 Adaptive Strategies Depending on the customer attitude one can pick up the growing “green” awareness and promote water as an environmental friendly product (compared to bottled water). In Flanders, the Antwerp Water Works offers drinking fountains to public utilities (such as schools) offensively marketing the product "drinking water" (AWW, 2006). Such programmes are rather aimed at raising trust in a safe product and a reliable enterprise than in increasing the turnover. Communication Enlightened customers are supposedly more willing to pay for a good quality drinking water as they understand the boundary conditions and necessary steps to produce safe drinking water. Hence public relations concepts including websites, guided tours, water days or alike are a matter of course. On the other hand they are more critical as to the performance of the water supplier. Water supplier could use benchmarking systems and performance indicators to justify costs and prove efficiency.
TECHNEAU Trends in water stressed regions © TECHNEAU - 15 - December 2006

Overcapacities In Flanders, many water suppliers purchase considerable volumes of drinking water from other suppliers, either from Flanders, Walloon or the neighbouring countries (FR, NL) (AMINAL, 2002). Depending on the production pattern of the water supplier (own treatment + purchased bulk supply) the supply can be matched to demand by cutting down the acquisition of volumes. To do so an appropriate contract design offering this flexibility is needed.
3.1.7 Conclusion The level of environmental awareness of customers influences their water use behaviour. Water suppliers have to take this into account when estimating future demand.
3.1.8 References AMINAL (2002) Drinkwater in Vlaanderen: Van drinkwatersector naar watercluster - eindrapport. Prepared by Idea Consult and Dialogic by order of the Ministerie von de Vlaamse Gemeenschap, AMINAL, Afdeling Water http://www.mina.be/uploads/watercluster.pdf AWW (2006) http://www.aww.be
TECHNEAU Trends in water stressed regions © TECHNEAU - 16 - December 2006

3.2 State of the aquatic environment - emerging pollutants
3.2.1 Introduction A number of legislative initiatives regulating wastewater treatment and discharge of harmful substances have been issued in the past decades. As a consequence, the emission of pollutants into various environmental compartments has been significantly reduced and resulted in a measurable improvement of water quality. Concentration of organic matter and ammonium are exhibiting a downward trend in most of the European rivers, as do phosphate concentrations. On the other hand nitrate concentrations remain on the same level (EEA, 2003). Nonetheless the evaluation of surface water and groundwater in the course of the Water Framework Directive implementation (Article 5 reports) has identified perpetual pressures on water resources. Many of them are at risk of failing to achieve the “good status” by 2015. Next to bulk pollutants such as organic matter and nutrients, the range of surveyed contaminants comprises heavy metals, pesticides, PAH, AOX and alike. The environmental concentrations of most of these substances are declining, too. On the other hand the detection and analysis of trace organics such as hormones, pharmaceuticals, endocrine disrupting compounds and personal care products has just started and is not yet part of regular monitoring programmes. But their widespread occurrence and related effects in the environment have become an issue for both the scientific and the public community. Having regard to the large number of chemicals produced and applied and the progress in analytical capacities and efforts, every day an unexpected "new" chemical may be identified as emerging contaminant of concern. Among the SEPTED dimensions this trend is classified ECOLOGICAL and POLITICAL.
3.2.2 Definitions Trend It can be assumed for all regions that the number of substances present and detectable in water will continue to grow. New materials and chemicals with improved technical properties are being developed. Distribution pathways sometimes allow for a delayed appearance in water media, e.g. substances that are attenuated by soil for years before leaching to groundwater or compounds transported via air and drift. On the other hand the pollution by degradable organic matter and nutrients is assumed to further decrease. The following sections give an overview of these developments in the considered regions.
TECHNEAU Trends in water stressed regions © TECHNEAU - 17 - December 2006

Flanders - surface water and groundwater quality: − The level of wastewater treatment has improved over the last decade
and will improve with ongoing implementation of the Urban Wastewater Treatment Directive (91/271/EEC). The connection rate to municipal wastewater treatment plants increased from 30% in 1990 to 63% in 2004. For 2007 a treatment rate of 80% is envisaged (VMM, 2005). Consequently the discharge into surface water has been reduced remarkably between 35% - 45% per parameter (Figure 4).
0
25
50
75
100
125
COD BOD TSS N P
Tons
per
yea
r
1990 2004
Figure 4: Evolution of pollution discharge by municipal wastewater treatment plants in Flanders (VMM, 2005)
− It is expected that diffuse pollution by contaminated land will be further reduced taking into account the legislative requirement to remediate such sites. Moreover the stepwise connection of the total population to sewage treatment plants will further reduce the organic load in rivers. On the other hand the water quality improvement will slow down due to the increasing impact of flooding, the poor structural quality of water bodies and persistent contamination of sediments (VMM, 2005).
− Concentration of pesticides in surface water quite often surpass the PNEC values (predicted no effect concentration) (VMM, 2005).
− Heavy metals and pesticides cause local problems in groundwater and surface water. At 31 out of 44 sample sites, the basic quality norm of 100 ng/L for PAK is not met (VMM, 2005).
− As shown in Table 2 almost 40% of the measuring points exceed the norm for nitrate in groundwater (> 50 mg/L). Another 51% contain more than 25 mg/L nitrate
TECHNEAU Trends in water stressed regions © TECHNEAU - 18 - December 2006

Table 2: Trend in nitrate in groundwater in Flanders (APS, 2006) 2005-spring 2004-autumn 2004-spring number of sampled wells 2026 1728 1925 number of samples >= 50 mg/L nitrate 801 616 688 number of samples >= 25 mg/L nitrate 1029 785 915 % >=50 mg/L nitrate 39.5 35.65 35.74 % >=25 mg/L nitrate 51.0 45.40 47.50
Romania / Bucharest River water quality in Romania has been improving. This is mainly due to some highly polluting industrial units reducing or ceasing their activity. Progress in wastewater treatment is still lagging behind, i.e. that almost 80% of wastewater is not or only insufficiently treated. Figure 5 illustrates that in 2000 more than 60% of the river length in Romania, are categorised class I, i.e. suitable for drinking water production. At the beginning of the 1990s on 35% of river stretches belonged to this category whereas around 20% were of class III and D quality (SoE, 2000).
0
10
20
30
40
50
60
70
Class I Class II Class III Class D
Dis
tribu
tion
of le
ngth
s by
qua
lity
clas
s [%
]
1989 2000
Figure 5: Distribution of river lengths by quality class in 1989 and 2000, where Class I - water that may be rendered drinkable and supplied to localities, or may be supplied to animal breeding farms or used for fish breeding purposes; Class II - rivers that may be used for fish breeding (excepting salmon breeding), i.e. water supply for industrial and leisure purposes; Class III - water that may be used for crop irrigation, electric power generation – hydroelectric power stations, industrial cooling plants, laundries and other uses; Class D - degraded water that does not allow for fish breeding (SoE, 2000)
TECHNEAU Trends in water stressed regions © TECHNEAU - 19 - December 2006

Israel − The overall state of the Israeli water resources is critical. Increase in
salinity and nitrate contents as well as high local concentrations of microbial and organic compounds or heavy metals, poisonous trace elements and hydrocarbons are reported. Groundwater of both the Coastal and Mountain Aquifers is prone to salinisation. Between 1970 and 1998, the nitrate concentration in the Coastal aquifer has more than doubled (from 85 mg/L to 180 mg/L). Over the same period the chloride content has increased from 125 to 195 mg/L (Gabbay, 1998; Schwarz, 2001).
− Several cases of groundwater contamination have been reported and partly brought to court by the Israel Union for Environmental Defense (IUED). Drinking water wells had to be closed down in single cases.
− Lack of sanitary solutions for waste disposal in the recharge area of the Mountain Aquifer and contamination by industrial sites pose an ongoing threat (IUED, 2006; Tagar and Qumsieh, 2006).
− Discharge of industrial and domestic wastewater is also a main polluter of rivers, of which many exceed the environmental quality standard of 20 mg/L BOD (CBS, 2006)
For all three regions, little data material is available as regards the emerging contaminants (Benijts et al., 2004). But concluding from analyses carried out in other countries a true cocktail of pharmaceuticals and personal care products can be expected to be present in waters, all the more, as still large flows of wastewater reach the environment without treatment.
3.2.3 Driving forces The trend of improving environmental quality on the one hand and increasing awareness and attention for emerging micropollutants is driven by the following factors. Legislation Tightening of legislative standards and the implementation of existing regulations support the improvement of water quality. Since 2000, when the Water Framework Directive has entered into force, water legislation is being streamlined. The management of water resources is to be tackled in a more integrated way. Particular attention is paid to the so- called priority substances whose presence in water is to be restricted to natural background concentrations. The determination of environmental quality standards and maximum allowable concentrations has defined ambitious target values (EC, 2006). But speed and degree of compliance will highly depend on the financial capabilities and the annual invest. Backlogs in enforcement of environmental legislation, such as the Urban Wastewater Treatment Directive (15 years after it was enacted), are alarming (EC, 2004). Economic changes
TECHNEAU Trends in water stressed regions © TECHNEAU - 20 - December 2006
Typically for Eastern European countries, reduction of pollution in the last decade of the 20th century was mainly attributable to economic break down of heavy industries. Analytical capabilities Following impressive progress in analytical capabilities and extended research concerning fate and risk of these compounds in the environment, suitable and effective treatment technologies are identified. In line with the polluter pays principle wastewater will probably have to undergo an appropriate quaternary treatment. Tightening standards for drinking water and adoption of new parameters into the list of restricted substances are possible. The 1998 revision of the European Drinking Water Directive (98/83/EC) introduced boron with a limit value of 1 mg/L.
3.2.4 General Implications In this field of uncertainties about effects and mitigation approaches, research is on the forefront of supported activities. The European Commission has been funding several projects dealing with trace organics in the 6th Framework Programme (ACE, COMPRENDO, EMCO, ERApharm, Poseidon and many more) investigating their presence, fate and behaviour in the environment and to evaluate their potential hazard. It should be expected that the findings of the research will prepare political decisions on regulation of these substances. The necessity for research regarding emerging contaminants is well acknowledged by the Flemish government. The development of bioassays to detect substances which interfere with the hormone system was supported and used to trace oestrogen activity in 8 Flemish rivers, 4 effluents of sewage water purification plants, and 4 surface waters, which serve as a source of drinking water. This study showed the usefulness of the biotests, which were applied (Vervliet, 1999). At the same time, funds have been granted to the Public Environmental Agency of Flanders for the development of measurement networks for water, and the development of the environmental database for micro-pollutants and especially endocrine disrupters (Vervliet 2003, 2004, 2005). VITO, the Flemish institute for technological research receives grants to further investigate the proven concept on disinfection and the removal of micro-pollutants by means of continuously created plasma in water. This technology will be evaluated and optimised in terms of its technical and economic advantages compared to existing techniques using ozone and/or UV (Vervliet, 2006).
3.2.5 Implications for the water industry
TECHNEAU Trends in water stressed regions © TECHNEAU - 21 - December 2006

Production and distribution of drinking water (e.g. treatment) − When surface water is used for drinking water production, the quality
issue and the load of contaminants becomes important. The degradation or retention of even traces of pollutants has to be assured by appropriate treatment technology.
− Admittedly, the application of certain treatment steps, such as chlorination and ozonation may form degradation and reaction products whose effects on human health are even less known. The formation of NDMA (N-nitrosodimethylamine) is critically discussed (Mitch and Sedlak, 2002). The formation of tribromopyrrole (TBPy) in bromide rich surface water of Sea Galilee in Israel also causes concern. (Glezer et al., 2003)
Substitutes (e.g. bottled water)
− Contaminated wells or even drinking water may force the water supplier to provide bottled water. The resulting loss in confidence in the water supply might lead to the increased use of bottled water in general – not only in emergency cases. In Israel the low quality of tap water and the fact that the Ministry of Health announced several times that it was forbidden to drink tap water, increased the consumption of bottled water." (Winston et al., 2003, N.N. 2006)
3.2.6 Adaptive Strategies The water industry can adapt in different ways to poor raw water quality and problematic compounds.
− Avoid poor quality raw water, i.e. find new sources or purchase from other suppliers
− Adopt water treatment processes to the raw water quality − Rehabilitation of raw water quality
The adoption of new technologies is one option and should comprise the involvement in relevant research projects. Cooperation with technology developers and research institutions to bring new technologies to market maturity might be beneficial. Catchment control is another important aspect. This includes monitoring networks and early warning systems or stations that detect spills and identify polluters and pollutants to allow for adjustment in treatment options. Appropriate protection of raw water sources is of major interest for water suppliers. Hence, they will try to get involved as competent party in the discussion about environmental quality standards (EQS). When the EQS of priority substances in Annex X of the WFD were discussed, the International Association of the Water Works in the Rhine Catchment Area (IAWR) has called for taking into account endocrine disrupters (BisphenolA), pharmaceutical residues and other substances when fixing target values (IAWR, 2005).
TECHNEAU Trends in water stressed regions © TECHNEAU - 22 - December 2006

Israel intends to rehabilitate contaminated and high-salt-containing aquifers using reverse osmosis (MNI, 2002a). A communication strategy with the customer about the unknown or unassessed risks of these substances of concern should complement the activities.
3.2.7 Conclusions Providing good quality drinking water under water stressed conditions is a challenging task. Advanced technologies can support this undertaking but pose the financial burden to the water supplier exclusively and consequently might increase water prices. A better source protection and integrated water management approaches are indispensable to produce more sustainable solutions. Legislation to reduce bulk pollutants and nutrients in raw water are in place. But there is also an implementation gap revealing poor compliance. There is the awareness of potential hazard of persistent trace contaminants but at the time there is no unified attitude concerning approaches to cope with it.
3.2.8 References APS (2006) http://aps.vlaanderen.be/sgml/largereeksen/3476.htm Benijts, Tom, Lambert, W. and De Leenheer, A. (2004) Analysis of Multiple Endocrine Disruptors in Environmental Waters via Wide-Spectrum Solid-Phase Extraction and Dual-Polarity Ionization LC-Ion Trap-MS/MS. Anal. Chem. 2004, 76, 704-71 EEA (2003) Europe's water: An indicator-based assessment, Summary. European Environment Agency EC (2004). Report from the Commission to the Council, The European Parliament, the European economic and social committee and the committee of the regions. Implementation of Council Directive 91/271/EEC of 21 May 1991 concerning urban waste water treatment, as amended by Commission Directive 98/15/EC of 27 February 1998, COM(2004) 248 final EC (2006) Communication (COM(2006)398 final) Proposal for a DIRECTIVE OF THE EUROPEAN PARLIAMENT AND OF THE COUNCIL on environmental quality standards in the field of water policy and amending Directive 2000/60/EC (link) Gabbay, S. (1998) The Environment in Israel, State of Israel, Ministry of Environment Schwarz, J. (2001) Water resources development and management in Israel (available at http://www.biu.ac.il/soc/besa/waterarticle5.html)
TECHNEAU Trends in water stressed regions © TECHNEAU - 23 - December 2006

Glezer, V., Juraev, O. and Richardson, S. (2003). Tribromopyrrole - its appearance in the environment. Chemistry of Heterocyclic Compounds, Vol. 39, No. 12, 1647-1648 IAWR (2005) Position Statement of the International Association of Waterworks in the Rhine catchment area concerning the Proposal for a DIRECTIVE OF THE EUROPEAN PARLIAMENT AND OF THE COUNCIL on environmental quality standards and pollution control in the field of water policy and amending Directive 2000/60/EC (list of priority substances) IUED Israel Union for Environmental Defense. www.iued.org.il Mitch, W.A. and Sedlak, D.L. (2002). Formation of N-Nitrosodimethylamine (NDMA) from Dimethylamine during Chlorination. Environ. Sci. Technol., 36 (4), 588 -595. MNI (2002a) Israel Water Sector. Ministry of National Infrastructure, Water Commission, Planning Division. Executive Summary N.N. http://www.euromonitor.com/Soft_Drinks_in_Israel SoE (2000). State of the Environment in Romania in 2000. Report available at http://enrin.grida.no/htmls/romania/soe2000/eng/index.htm Tagar, Z. and Qumsieh, V. (2006) A Seeping Time Bomb - Pollution of the Mountain Aquifer by Solid Waste, Investigative Report Series on Water Issues No. 3. Friends of the Environment Vervliet, Greta (1999) Science Technology and Innovation. Ministry of Flanders Science and Innovation Administration p. 213 http://awi.vlaanderen.be/cijfers_en_publicaties/index.php?id=143 Vervliet, G. (2003) Science, technology and innovation information guide Ministry of Flanders, Science and Innovation Administration Vervliet, G. (2004) Science, technology and innovation information guide Ministry of Flanders, Science and Innovation Administration Vervliet, G. (2005) Science, technology and innovation information guide Ministry of Flanders, Science and Innovation Administration Vervliet, G. (2006) Science, technology and innovation information guide Ministry of Flanders, Science and Innovation Administration VMM (2005) Milieurapport Vlaanderen, MIRA Achtergronddocument 2005, Kwaliteit oppervlaktewater. Vlaamse Milieumaatschappij
TECHNEAU Trends in water stressed regions © TECHNEAU - 24 - December 2006
Winston G, Lerman S, Goldberger S, Collins M, and Leventhal A. (2003). A tap water turbidity crisis in Tel Aviv, Israel, due to technical failure: toxicological and risk management issues. Int J Hyg Environ Health. 2003 Jun;206(3):193-200
TECHNEAU Trends in water stressed regions © TECHNEAU - 25 - December 2006

3.3 Climate change
3.3.1 Introduction Climate change is primarily characterised by global warming caused by an increase in greenhouse gases in the atmosphere. The anthropogenic emission of greenhouse gases (CO2, CH4, N2O, halocarbons and others) has changed the atmospheric composition and contributed to temperature incline especially during the industrial era. CO2 concentration in the atmosphere has risen from 280 ppm in pre-industrial times to 368 ppm in 2000 (of which an increase from 320 to 368 took place in the second half ot the 20th century (IPCC, 2001) and is supposed to incline to 550 ppm by 2050. Combustion of fossil fuels is a main source for CO2 emissions but also changes in land use (deforestation) increase the atmospheric concentration. Cattle breeding and industrial production and products contribute further greenhouse gases. Next to rising temperatures, snow cover and ice extent on the pole caps and glaciers have decreased. Repercussions on other elements of the complex phenomenon weather are likely (precipitation, storms, droughts, great ocean conveyor belt). Among the SEPTED dimensions this trend is classified ECOLOGICAL.
3.3.2 Definitions Flanders: Albeit Belgium is small on a climate zone scale and global models have a resolution of some few hundred kilometres, several trends have emerged from the scenarios and models:
− Significant increase of temperatures by 2050 in both summer and winter. Rise in temperature would amount to 1.7 to 4.9°C in winter and 2.4 to 6.6°C in summer, compared to the end of the 20th century. The statistic analysis of the annual average temperature already revealed a constant incline (see Table 3).
Table 3: Observed temperature increase in Belgium
Period Annual average temperature increase from 1833 to 1910 8.8 °C from 1911 to 1987 9.6 °C + 0.8 °C from 1988 to 2003 10.7 °C + 1.1 °C
− The projections for the change in precipitation until the end of the 21st century are heterogeneous. For winter, a rise of between 6% and 23% is expected whereas summer rainfall remains on today’s level or will drop by up to 50% (580 – 710 mm in West Flanders). This can result in an overall increase of the annual average water availability
TECHNEAU Trends in water stressed regions © TECHNEAU - 26 - December 2006

per capita with water abundance in winter and possibly sharply reduced run-offs during summers
− Cold winters will gradually disappear − More extreme weather events are expected, such as increased
likelihood of severe heat waves and more frequent episodes of heavy rain.
− Increased risk of flooding − Coastal regions might get impacted by floods during storms, coastal
erosion and loss or movement of inland natural wetlands. − Rising seawater levels will impact on groundwater levels and pose
risk of salinisation of soils and groundwater − At the coastline a rising sea level has been registered over the last
decades. Levels in Zeebrugge en Nieuwpoort are reported to be 7.7 and 9.6 cm respectively higher today than in 1937. In Oostende, the sea level was on average 7.9 cm higher in 2003 compared to 1937, representing an annual mean increase of 1.7 mm/yr.
(van Ypserle and Marbaix, 2004; VMM, 2006a & 2006b) Israel According to Pe’er and Safriel (2000) a slight increase of annual mean temperature in the North and the central parts of Israel has been observed already. In continuation of this trend Israel is expecting increased climatic variations and frequency of extreme events as follows:
− Seasonal variability in temperature − Frequency and severity of extreme climatic conditions − Frequency of high intensity rainstorms − Shortened rainy season − Delayed winter rains − Expected evapotranspiration incline by 10% (with a warming of 1.5°C)
As shown in Table 4 changes in temperature (up to 0.8 till the middle of the century) and precipitation are not as distinct, as projections for more moderate European climate regions.
Table 4: Projected changes in climate parameters in Israel
Period temperature precipitation evapotranspiration by 2020 0.3-0.4° C -2 to -1% by 2050 0.7-0.8° C -4 to -2% by 2100 1.6-1.8° C -8 to -4% +10%
Romania Based on a scenario, assuming a doubling of atmospheric CO2 concentrations the annual mean temperature in the southern region of Romania is likely to increase by 3.9 - 4.4 °C. Model predictions for changes in precipitation vary between 47% reduction in summer months and 81% increase in autumn (Cuculeanu et al., 2002). Other models assume less extreme variations of -20%
TECHNEAU Trends in water stressed regions © TECHNEAU - 27 - December 2006

in summer and +20% in winter. In any case, probability for inundation in autumn increases. Counter-trend: The opposite trend of global warming – global cooling - is not to be very likely, as the already emitted gases tend to be effective over the next decades. Nonetheless, a change in energy consumption pattern and a break through of renewable energy will slow down the warming and curb the temperature increase. Primarily break-through of innovations in the energy sector such as solar power, CO2 free power plants, the increased use of biomass, the market penetration of hybrid vehicles and alike prevent excessive CO2 increase. The maturity of CO2 capture and storage technologies (geological and ocean storage options) will lead to significant emission reduction. Abandoning of rainforest clearing and reforestation contribute to CO2 fixation. Halocarbons will have been successfully replaced.
3.3.3 Driving Forces The main reason for continuous climate change is the growing energy demand primarily covered from fossil fuels. Growing economies and developing life standards (especially in newly industrialising countries) As outlined in Section 3.5 the energy demand for the considered regions is expected to rise over the next decades.
3.3.4 General Implications Agriculture In the moderate climate of the mid latitudes and northern Europe the effects on agriculture could be positive. Slight temperature rise, prolonged growing season and increased CO2 concentrations could potentially be beneficial. Whereas in parts of southern Europe reduced soil moisture and water shortage could be detrimental for crop yields (IPCC, 2001a). More frequent extreme weather periods could also increase the risk of spoiled harvests and huge economic losses. In Europe, the drought of 2003 has caused damages in the range of billions of euros. Energy sector Climate change and most notably drought events will hit the energy sector. Reduced river flows will negatively impact electricity generation through
− Physical lack of cooling water − Little temperature gradient of abstracted and discharged cooling
water (in many countries limits for the maximum temperature of discharged cooling water exist)
− Loss of hydro power potential. Eventually, power plants especially nuclear power plants, will have to be operated at lower load or even be switched off temporarily.
TECHNEAU Trends in water stressed regions © TECHNEAU - 28 - December 2006

3.3.5 Implications for the water industry The major challenges for the water industry imposed by climate change impacts are related to the projected
− deterioration of the water quality − shortage of water resources
Water quality deterioration Flash floods producing pronounced peak runoffs and soil erosion will leach more ions, nutrients and suspended particles into the water and will favour eutrophication. Additionally, reduced natural run-off in rivers will cause higher concentration of pollutants due to less dilution of discharged effluents. Reduced O2 saturation due to higher water temperatures and higher pollutions loads contribute to oxygen depletion in water courses leading to overall unsatisfactory self-purification. Reservoirs will suffer more algae blooms which is problematic for drinking water production. Water salinisation will also increase due to higher temperatures of water surface and to accelerated evaporation (Pe’er and Safriel, 2000). In addition, flood events are known to remobilise pollutants contained in river sediments. Hence, temporarily increased suspended particles, organic matter and pollutants are likely to deteriorate the drinking water quality. Shortage of water resources Groundwater More extreme rain events and storms generally lead to increased surface water run-off and reduced infiltration rates with negative impacts on aquifer recharge. Instead there will be an increased water loss to the sea. A high share of sealed surfaces in urban areas deteriorates this situation. Moreover, the impermeability of soil and open areas in arid regions constitutes an additional obstacle to groundwater replenishment. Surface water Another issue is the reduction of surface water reservoir capacity by the increased deposition of sediments in reservoirs and channels due to increased surface runoff and soil erosion. Limited storage capacity leads inevitably to a greater loss of surface runoff, due to limited opportunities to capture it. Possible increased evaporation further reduces the usable amount of stored water.
3.3.6 Adaptive Strategies In the view of greater temporal uncertainty of water availability it is of utmost importance to collect and save water for drought years. Such enhanced drought preparedness might comprise the adoption of the water storage infrastructure and other measures:
− New dams could be an option but taking into account the difficulties to predict where runoff peaks will occur the planning of new
TECHNEAU Trends in water stressed regions © TECHNEAU - 29 - December 2006

reservoirs or adapting current ones is highly unconfident. Also with regard to the increased spatial uncertainty of rainfall collection by dams seems an inefficient and expensive solution.
− Dam construction will also damage natural ecosystems and natural resources for tourism, with its consequent costs.
− Control of excessive surface runoff through water-sensitive urban planning and better management of aquifer recharge including elements like rainwater harvesting and infiltration.
− Artificial groundwater recharge with reclaimed wastewater is an appropriate tool to extend the residence time of water in the usable water cycle instead of discharging it to the sea, eventually.
− Reforestation and natural vegetations trap to conserve soil moisture and improve retention of rainwater.
− Desalination of brackish water and seawater − Use of cloud seeding to enhance rain and to support the
replenishment of reservoirs. − Imposing water use restrictions, ban of particular wasteful uses − Demand management plans, water saving measures, programmes for
efficient water use − Improvement of water treatment and distribution efficiency with
regard to losses in supply networks and on-site recycling. It is obvious that many of these actions are not merely an operational or strategic adaptation of the water supplier. Some require the involvement of all players in water management.
3.3.7 References Cuculeanu, V., Tuinea, P. and Balteanu, D. (2002) Climate change impacts in Romania: Vulnerability and adaptation options. GeoJournal, Volume 57, Number 3 / July, 2002Topic report No 15/1996 EEA (1996) Water resources problems in Southern Europe. Topic report No 15/1996 IPCC (2001) Climate Change 2001: Synthesis Report, Summary for Policymakers IPCC (2001a) Climate Change 2001: Impacts, Adaptation and Vulnerability. Chapter 13: Europe Van Ypersele, J.-P. and Marbaix, P. (2004) Impacts of climate change in Belgium. Report commissioned by Greenpeace MIRA (2005) Ook in België eerste tekenen klimaatverandering waargenomen http://www.milieurapport.be/portals/sitesource/uploads/docs/Registered%20Users/Toestand%20klimaat%2025.1.2005.pdf
TECHNEAU Trends in water stressed regions © TECHNEAU - 30 - December 2006

Pe’er, G. and Safriel, U. N. (2000) Climate Change - Israel National Report Under The United Nations Framework Convention on Climate Change - Impact, Vulnerability and Adaptation. Commissioned by the Ministry of Environment From the Blaustein Institute for Desert Research Sede Boqer Campus of Ben-Gurion University of the Negev http://www.bgu.ac.il/BIDR/rio/Global91-editedfinal.html UNEP (2004) Impacts of summer 2003 heat wave in Europe, Environmental Alert Bulletin 2 VMM (2006a) Milieurapport Vlaanderen, MIRA Achtergronddocument 2005, Klimaatverandering. Vlaamse Milieumaatschappij VMM (2006b) Milieurapport Vlaanderen, MIRA Achtergronddocument 2005, Verstoring van de waterhuishouding. Vlaamse Milieumaatschappij
TECHNEAU Trends in water stressed regions © TECHNEAU - 31 - December 2006

3.4 Population development
3.4.1 Introduction Population development covers the changes in population structure (age, gender, nationality etc) as well as in their spatial distribution and migration. Apart from fertility and mortality rates, emigration and immigration determine the growth of a population. Whereas the global population is growing, the trend in Europe is regressive. The higher the economic wealth and education in a society, the lower the birth rate. Among the SEPTED dimensions this trend is classified DEMOGRAPHIC.
3.4.2 Definitions The regions under discussion in this report exhibit diverse population trends. In Bucharest the population has declined over the last 15 years by 7.8% to 2.2 million inhabitants (DRS, 2006). For Romania as a whole continuing negative growth rates are projected for the upcoming decades (UN, 2006). On the other hand, life expectancy is increasing constantly. Today the group of people aged 60+ makes up app. 19% compared to 16.5% in 1990 (DRSM, 2006). It can be assumed that the downward trend in inhabitant numbers of Bucharest will rather continue, as the annual growth rate for Romania is appraised to be negative: -0.39% in 2015 and -0.78 (2050). Flanders Population in Flanders has been growing for the past decades and will continue to do over the next decades with moderate rates. Appraisals published by STATBEL expect an incline from 5.94 million inhabitants in 2000 to a peak population size of 6.175 million in the year 2030. In the following decades the population is expected to decline again to 6.07 million in 2050. The population increase is more pronounced in conurbation and in the coastal regions (Devogelaer, 2004). Due to increased life expectancy the population will also be aging. The fraction of inhabitants aged 60+ will continuously grow - from 12.9% in 2000 to 18.6% in 2030. Israel The population has been growing notably over the last decade of the 20th century from 4.8 to 6.3. million. Immigration in the years 1990-2000 contributed approx. 1 million new inhabitants. Moreover the total fertility rate was constantly high, around 2. 9 (CBS, 2006). The population growth will slow down, as growth rates are supposed to fall below the 2% mark on the long run (UN, 2006). Nonetheless the projections assume a total population of 7.95 to 8.29 million by 2015 (or 8.80 m to 9.79 m
TECHNEAU Trends in water stressed regions © TECHNEAU - 32 - December 2006
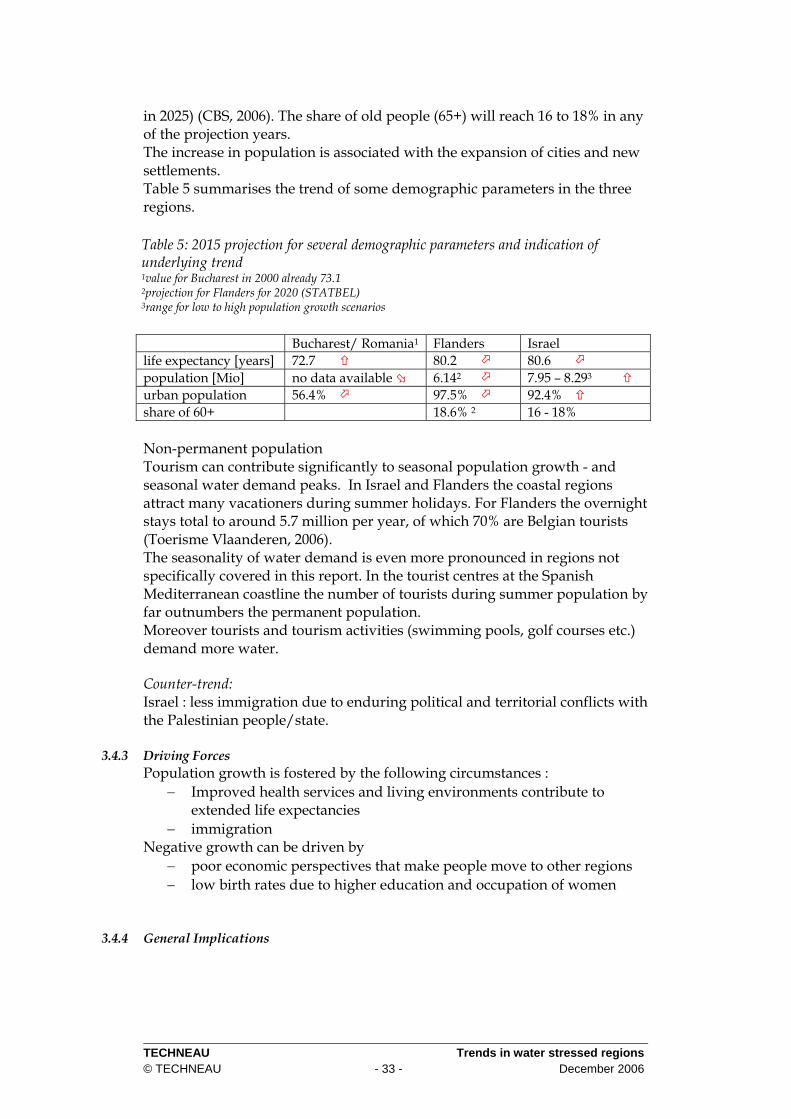
in 2025) (CBS, 2006). The share of old people (65+) will reach 16 to 18% in any of the projection years. The increase in population is associated with the expansion of cities and new settlements. Table 5 summarises the trend of some demographic parameters in the three regions.
Table 5: 2015 projection for several demographic parameters and indication of underlying trend 1value for Bucharest in 2000 already 73.1 2projection for Flanders for 2020 (STATBEL) 3range for low to high population growth scenarios
Bucharest/ Romania1 Flanders Israel life expectancy [years] 72.7 80.2 80.6 population [Mio] no data available 6.142 7.95 – 8.293 urban population 56.4% 97.5% 92.4% share of 60+ 18.6% 2 16 - 18% Non-permanent population Tourism can contribute significantly to seasonal population growth - and seasonal water demand peaks. In Israel and Flanders the coastal regions attract many vacationers during summer holidays. For Flanders the overnight stays total to around 5.7 million per year, of which 70% are Belgian tourists (Toerisme Vlaanderen, 2006). The seasonality of water demand is even more pronounced in regions not specifically covered in this report. In the tourist centres at the Spanish Mediterranean coastline the number of tourists during summer population by far outnumbers the permanent population. Moreover tourists and tourism activities (swimming pools, golf courses etc.) demand more water. Counter-trend: Israel : less immigration due to enduring political and territorial conflicts with the Palestinian people/state.
3.4.3 Driving Forces Population growth is fostered by the following circumstances :
− Improved health services and living environments contribute to extended life expectancies
− immigration Negative growth can be driven by
− poor economic perspectives that make people move to other regions − low birth rates due to higher education and occupation of women
3.4.4 General Implications
TECHNEAU Trends in water stressed regions © TECHNEAU - 33 - December 2006

The aging of society implies a number of consequences. It can be assumed that expenses of the health system will increase with the share of old people in the society, requiring more medication and care. Moreover, the inverted age pyramid is a particular challenge for many social security systems like retirement funds and health insurance that heavily rely on contributions of the active workforce.
3.4.5 Implications for the water industry Variations of future population numbers primarily influence the production and distribution of drinking water (e.g. treatment)
− As can be seen in Figure 6 and Figure 7, drinking water demand and production follow the changes in population. Production capacities have to be adapted to the changing demand. Increasing drinking water production and supply might demand an extension of treatment facilities.
Flanders
0
100
200
300
400
500
600
1990 2000 2003
Mm
³/yr
3.000
4.000
5.000
6.000
Inha
bita
nts
[1,0
00]
Drinking water supply Inhabitants
Israel
0
100
200
300
400
500
600
700
800
1990 2000 2003
Mm
³/yr
0
1.000
2.000
3.000
4.000
5.000
6.000
7.000
8.000
Inha
bita
nts
[1,0
00]
Drinking water supply Inhabitants
Figure 6 Development of population growth and drinking water supply in Flanders and Israel 1990-2003(VMM, 2006; CBS, 2006)
− number of connected households will increase, all the more as the individualisation increases
Bucharest
0
100
200
300
400
500
1990 2000 2003
Mm
³/yr
2.000
2.100
2.200
2.300
2.400
2.500
Inha
bita
nts
[1,0
00]
Drinking water supply Inhabitants
Figure 7 Development of population and drinking water supply in Bucharest, (DRSM, 2006)
TECHNEAU Trends in water stressed regions © TECHNEAU - 34 - December 2006

− For Bucharest the decrease in supply of water is even disproportionate to the decline in population. This is also caused by improving infrastructure like leakage detection and repair.
− Developing new settlements and connecting new customers demands for reconsidering the supply infrastructure. Decentralised solutions and supply concepts could be interesting and more feasible compared to a mere expansion of the existing network
Operations − Seasonal fluctuation in served population (due to tourism)
necessitates temporary expansion of drinking water production. The provision of sufficient spare capacity imposes additional cost. In these cases the coincidence of high demand and possibly reduced availability during summer months aggravates the problematic situation.
− Maintenance of oversized existing infrastructure is costly, too. To provide less volume through a given distribution network increases the specific cost per cubic meter, as the fixed cost for maintenance remain the same (in addition to the financial cost).
3.4.6 Adaptive Strategies Modular systems to temporarily upgrade treatment capacity are among the possible adaptive strategies. Membrane treatment processes can ideally realise spare capacity of a small footprint. Connecting new settlements, the implementation of decentralised supply systems could be considered. Those systems might offer financial advantages over a mere expansion of the distribution network, in particular if its pipe capacity is not sufficiently big to convey the required volumes.
3.4.7 References CBS (2006) Central Bureau of Statistics. Statistical Abstract of Israel 2006 No. 57 http://www1.cbs.gov.il/reader/ accessed November 2006 Devogelaer, D. (2004) Federaal Planbureau Economische analyses en vooruitzichten, WORKING PAPER 8-04 Interne migraties in België: wie, waarom en naar welke gemeenten? DRSM (2006). Direcţia Regională de Statistică BUCUREŞTI http://www.bucuresti.insse.ro/main.php?lang=fr&pageid=582 accessed November 2006 STATBEL http://statbel.fgov.be/figures/d23_nl.asp Toerisme Vlaanderen (2006) Toerisme in cijfers 2005 XL UN (2006) Globalis - Annual population growth rate, accessed November 2006
TECHNEAU Trends in water stressed regions © TECHNEAU - 35 - December 2006

http://globalis.gvu.unu.edu/indicator_detail.cfm?IndicatorID=29&Country=RO VMM (2006) Kernset Milieudata MIRA-T 2005, accessed November 2006 http://www.milieurapport.be/desktopdefault.aspx?tabid=939
TECHNEAU Trends in water stressed regions © TECHNEAU - 36 - December 2006

3.5 Increasing energy demand and cost of electricity
3.5.1 Introduction The final energy consumption of the considered regions has been rising over the last years. Figure 8 illustrates the range of changes and shows that after a temporary depression, the consumption in Romania is rising again.
0
5000
10000
15000
20000
25000
30000
35000
40000
Belgium Romania Israel
Fina
l ene
rgy
cons
umpt
ion
[1,0
00 to
e] 1995 2000 2004
Figure 8 Trend in final energy consumption in Belgium, Romania and Israel (Eurostat 2006, CBS, 2006)
The energy mix of the considered regions is primarily based on imported fossil fuels (coal and crude oil in Israel, CBS, 2006). Rising oil prices have put pressure on energy prices, for both fuel and electricity. Hence the development of this trend will depend on the oil prices on the world market, highly sensitive to political events and crisis. Among the SEPTED dimensions this trend is classified ECONOMICAL.
3.5.2 Definitions Trend: Most forecasts assume a growing electricity and overall energy demand in all three regions: For Israel a growth of 4% per annum in energy requirements is forecasted (Pe’er and Safriel, 2000). To cover the electricity demand, Israel will need to double its generating capacity (from 10 GW to 20 GW) over the next decade (till 2016) (Ministry of Environment, 2006). This will be achieved by increased use of natural gas.
TECHNEAU Trends in water stressed regions © TECHNEAU - 37 - December 2006

For Belgium on the time horizon of 2030 an annual increase in energy use of 0.2% is projected. Especially, the use of natural gas is expected to increase by 84% until then, which represents a clear shift towards gas from coal. The prognosis for Belgium for the year 2030 projects an annual growth rate of 0.5% as to final energy consumption and of 1.2% for electricity in particular (see Table 6)(Gusbin, 2004).
Table 6: Actual and projected energy demand of Belgium
2000 2030 Annual growth rate Primary energy demand 57 Mtoe* 61 Mtoe 0.2 % Final energy consumption 37 Mtoe 42 Mtoe 0.5 % Electricity demand 1.2 % * Tons of oil equivalent, 1 toe = 11.63 MWh. In Flanders the overall energy demand has been growing steadily between the years 1990 and 2004 (Table 7).
Table 7 : Energy use in Flanders http://aps.vlaanderen.be/sgml/largereeksen/1664.htm
Sector evolution 1990-2004 Demand 2004 [PJ] Industry 18 % 763.4 Households 24 % 253.5 Transport & traffic 25 % 210.7 Trade & services 80 % 96.6 Agriculture - 10 % 32.2 Total 21 % 2,120 Projections of the future electricity demand assume a growth of 4% per year for the period 1998-2010 (MIRA-S, 2000). This is above the average of 1.2% projected for Belgium as a whole. In the period January 2005 – January 2006 the electricity prices for standard industrial consumers in Belgium increased by 25% to 0.097 per kWh whilst for household consumers a slight decrease to 0.14 per kWh (Eurostat, 2006a). As the Belgian Government has adopted the resolution to phase out nuclear energy production, alternatives have to be adopted to satisfy the increasing demand. Gusbin, D. and Hoornaert (2004) appraise that the increase in primary energy consumption will be accompanied by a steep increase in prices as well (gas prices incline by 50%). Counter-trend: The cost impact and environmental effects of increasing energy demand will be partly mitigated by considerable progress in energy efficiency. Increased competition in the internal market might partly compensate and slow down the price increase.
TECHNEAU Trends in water stressed regions © TECHNEAU - 38 - December 2006

3.5.3 Driving Forces Demand increase is primarily driven by population growth and economic growth (annual growth rates 0.2 in Belgium). Israel is also aiming for a higher GNP per capita. Price increases are not exclusively triggered by high crude oil prices. The financial cost for constructing more efficient gas power plants can be a price driver, too. Moreover, taxes and fees imposed by the state government on the use of energy are accounting for a high share of the retail price. This also applies to the effects the emission trading schemes for CO2, where the carbon costs are potentially fully passed through into electricity prices.
3.5.4 General Implications The increase of energy consumption produces an increase in pollution as well. Unless considerable improvements in energy production and use efficiency are obtained, CO2 emission reduction targets will not be met. The development of alternative energies to achieve more independence from world market prices of crude oil and gas could be considered. The use of internal resources in Israel (oil shale) becomes competitive. Intentions to install a more sustainable energy sector and increasing the share of renewable energies are expressed in all three regions.
3.5.5 Implications for the water industry Treatment and distribution, operation
− High level energy prices will impact on operational cost at almost all levels of water supply: abstraction, treatment and distribution. Pumping of groundwater as well as distributing drinking water will become more expensive. Cost of treatment will also rise, especially when energy intensive processes such as reverse osmosis, other membrane processes or ozonation are applied.
− For Israel water pumping is an issue as the National Water Carrier network is stretched over almost the whole country, from the place of capture (Lake Galilee), to Tel Aviv and into the Negev.
− For the Bucharest water supply the renovation of pumping stations after the privatisation has significantly increased energy efficiency and electricity demand
− Need for cost effectiveness and increased operational efficiency will pave the way for benchmarking instruments
Sales and marketing − Fully passing through the additional costs to the customer will
increase the water prices. Depending on their ability to pay, bill recovery could worsen. This is particularly true for Bucharest, where bill recovery is poor and the expenses for drinking water make up 2.5% of household income and is supposed to rise further (Chiru, 2006).
TECHNEAU Trends in water stressed regions © TECHNEAU - 39 - December 2006

3.5.6 Adaptive Strategies The search for least energy consuming technologies and operational modes will be intensified. To avoid high impacts of price increases, favourable prices for use of electricity during off-peak hours have to be negotiated with the energy supplier.
3.5.7 References: CBS (2006) Central Bureau of Statistics. Statistical Abstract of Israel 2006 No. 57 http://www1.cbs.gov.il/reader/ Tab. 21.1 accessed November 2006 Chiru, E. (2006) personal communication with Dr. Chiru of Apanova Eurostat (2006) Final energy demand Link Eurostat (2006a) Electricity prices in the EU25 in January 2006 Gusbin, D. and Hoornaert, B. (2004). Perspectives énergétiques pour la Belgique à l’horizon 2030, Bureau Fédérale du Plan (Eds) ; http://www.plan.be Pe’er, G. and Safriel, U. N. (2000) Climate Change - Israel National Report Under The United Nations Framework Convention on Climate Change - Impact, Vulnerability and Adaptation. Commissioned by the Ministry of Environment From the Blaustein Institute for Desert Research Sede Boqer Campus of Ben-Gurion University of the Negev Vito (2002) Aernouts K. en Jespers K., Energiebalans Vlaanderen: onafhankelijke methode. http://www.emis.vito.be/Energiebalans/index.asp
TECHNEAU Trends in water stressed regions © TECHNEAU - 40 - December 2006

3.6 Liberalisation and privatisation of public services
3.6.1 Introduction Liberalisation and privatisation of public services are increasingly promoted in the course of the implementation of the European internal market (e.g. Directive 2003/54/EC to establish an Internal Market of Electricity). But even long before, several countries’ governments have opened the public services for private involvement. The water services in England and Wales have been privatised in 1989. Also in France the private sector is widely involved in water supply and wastewater treatment activities. Contrary, amongst others Austria, Portugal and the Netherlands have rejected privatisation of water services (EUROMARKET, 2004). Due to the structure of the water sector competition is difficult to implement. Some elements (distribution and collection) are natural monopolies. Hence through the involvement of the private sector the water market will experience a modernisation rather than a liberalisation (Gee, A. 2004) Among the SEPTED dimensions this trend is classified POLITCAL, ECONOMICAL and ORGANISATIONAL.
3.6.2 Definitions Flanders In Flanders water supply is provided by 7 inter-municipalities (groups of municipalities) and 20 local water companies (each owned by a municipality). In addition there is the Flemish Regional Water Company (VWM), which is owned by the regional government and is contracted by municipalities to provide water supply services (AMINAL, 2002). Privatisation of drinking water supply is not an option (CIW, 2005), nonetheless there is a private involvement in two of the water inter-municipality water companies. According to Gordon-Walker and Marr (2002) a law (Decree dated 6th July 2002) now prohibits the involvement of private sector investors in inter-municipality companies.
3.6.3 Driving Forces The decision for involvement of private sector investment is mostly driven by cost considerations. In Bucharest the lack of public funding capacities to finance the necessary invest in infrastructure and technology was decisive for the private party participation. Also lack of know-how on a municipal level regarding operation and technological aspect can be a reason for involving experienced companies. The ambitious desalination target of Israel will not be realised without significant private sector investment. Most of the proposed plants will be realised in a BOOT (build, own, operate, transfer) constellation (MNI, 2002).
3.6.4 General Implications
TECHNEAU Trends in water stressed regions © TECHNEAU - 41 - December 2006

3.6.5 Implications for the water industry New competitors
− Third party access (TPA) will allow competitors to enter the market. It is supposed that due to the natural monopoly of the distribution network the competition will be focused on supplying large users
− Possible increase of opportunities for more innovative technical solutions and at more cost effective benefits compared to least cost conscious monopolies (Gordon-Walker and Marr, 2004)
− Third party access for ancillary services like meter reading, pipe laying etc.,
Customer/consumer response − Especially in the supply of industrial water users roof or sectoral
organisation might try to negotiate prices (corporate enterprises might get the same price for their water regardless of the location)
3.6.6 Adaptive Strategies Most countries allow for an involvement of the private sector, although the municipalities are legally responsible for water services. They have to prepare for new requirements concerning the tendering of water supply and wastewater treatment services. Increased competition in a market is always a matter of cost efficiency. The merger of smaller water suppliers could increase the efficiency.
3.6.7 References AMINAL (2002) Drinkwater in Vlaanderen: Van drinkwatersector naar watercluster - eindrapport. Prepared by Idea Consult and Dialogic by order of the Ministerie von de Vlaamse Gemeenschap, AMINAL, Afdeling Water http://www.mina.be/uploads/watercluster.pdf EUROMARKET (2004) Analysis of the strategies of the water supply and sanitation operators in Europe. http://www2.epfl.ch/mir/page47163.html CIW (2005) Coordinatiecommisie Integraal Waterbeleid, De eerste waterbeleidsnota – een kennismaking p. 31 http://www.ciwvlaanderen.be Gee, A. (2004) Competition and the water sector, Competition Policy Newsletter, 2004, No. 2 – summer p. 38-40, DG Competition Unit B1 Gordon-Walker, S. and Marr, S. (2002) Study on the application of the competition rules to the water sector in the European Community, Prepared by WRC and ECOLOGIC for the European Commission – Competition Directorate General MNI (2002) Israel Water Sector. Ministry of National Infrastructure, Water Commission
TECHNEAU Trends in water stressed regions © TECHNEAU - 42 - December 2006
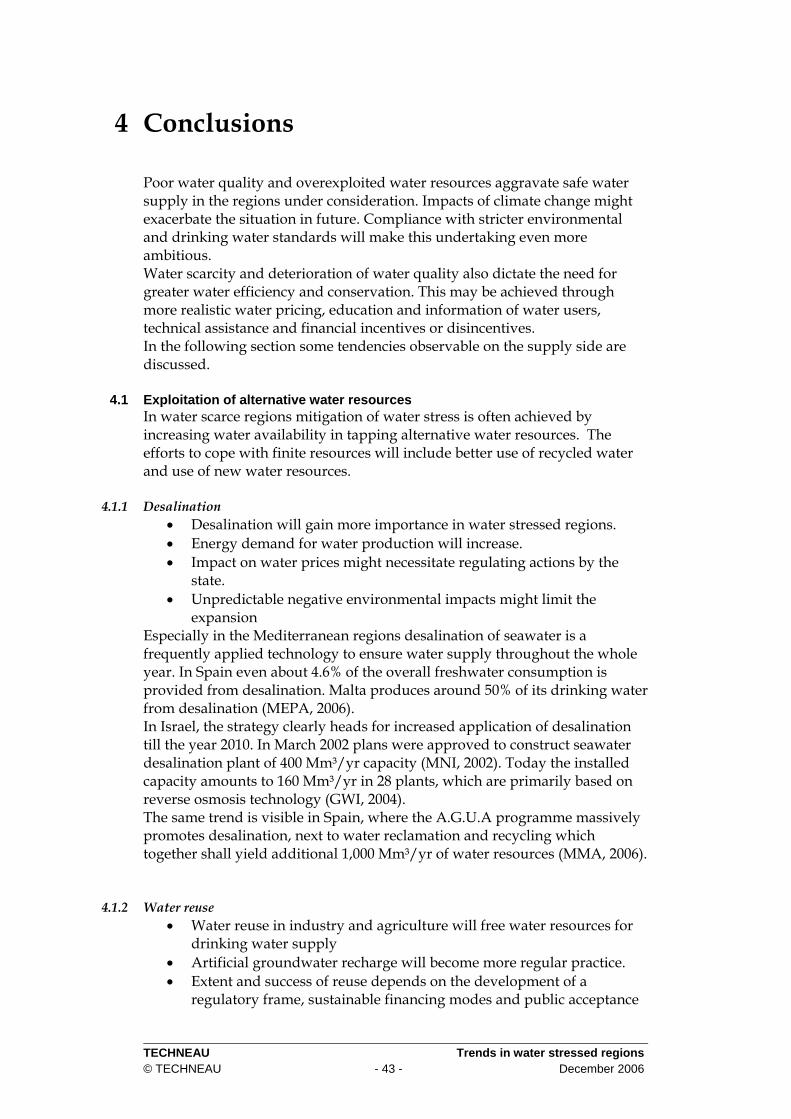
4 Conclusions
Poor water quality and overexploited water resources aggravate safe water supply in the regions under consideration. Impacts of climate change might exacerbate the situation in future. Compliance with stricter environmental and drinking water standards will make this undertaking even more ambitious. Water scarcity and deterioration of water quality also dictate the need for greater water efficiency and conservation. This may be achieved through more realistic water pricing, education and information of water users, technical assistance and financial incentives or disincentives. In the following section some tendencies observable on the supply side are discussed.
4.1 Exploitation of alternative water resources In water scarce regions mitigation of water stress is often achieved by increasing water availability in tapping alternative water resources. The efforts to cope with finite resources will include better use of recycled water and use of new water resources.
4.1.1 Desalination • Desalination will gain more importance in water stressed regions. • Energy demand for water production will increase. • Impact on water prices might necessitate regulating actions by the
state. • Unpredictable negative environmental impacts might limit the
expansion Especially in the Mediterranean regions desalination of seawater is a frequently applied technology to ensure water supply throughout the whole year. In Spain even about 4.6% of the overall freshwater consumption is provided from desalination. Malta produces around 50% of its drinking water from desalination (MEPA, 2006). In Israel, the strategy clearly heads for increased application of desalination till the year 2010. In March 2002 plans were approved to construct seawater desalination plant of 400 Mm³/yr capacity (MNI, 2002). Today the installed capacity amounts to 160 Mm³/yr in 28 plants, which are primarily based on reverse osmosis technology (GWI, 2004). The same trend is visible in Spain, where the A.G.U.A programme massively promotes desalination, next to water reclamation and recycling which together shall yield additional 1,000 Mm³/yr of water resources (MMA, 2006).
4.1.2 Water reuse • Water reuse in industry and agriculture will free water resources for
drinking water supply • Artificial groundwater recharge will become more regular practice. • Extent and success of reuse depends on the development of a
regulatory frame, sustainable financing modes and public acceptance
TECHNEAU Trends in water stressed regions © TECHNEAU - 43 - December 2006

In most South European countries and some countries in the humid north-western climate, water reuse is practised and gains more and more influence and acceptance. It is estimated that in 2004 about 700 Mm³ per year of treated wastewater was directly reclaimed in Europe (Hochstrat et al. 2006). The motivation is not only to mitigate quantitative water stress but also to prevent further discharge of pollutants (Bixio et al. 2006). Israel recycles 70% of its treated wastewater, primarily to sustain agricultural irrigation water demand. The aim is to increase this amount to almost 500 Mm³/yr., representing almost half of the projected agricultural water demand of the year 2010 (MNI, 2002). In Flanders a reuse scheme for artificial groundwater recharge is operational since 2002. The reclaimed water is eventually reused for drinking water production (van Houtte and Verbauwhede, 2004). Further applications for industrial water uses are being developed (Thoeye et al, 2005). Trends in other countries prone to water stress (Australia, many regions in the US, Spain) clearly point the way towards the integration of water reuse in water cycle management. The river basin management plans should take this into account.
4.1.3 Rainwater harvesting In regions with low precipitation, the potential for rainwater harvesting is naturally low. Nonetheless it is beneficial to capture this resource during rainy seasons, infiltrate it and store it in aquifers for periods of water shortage. Infiltration of rainwater - instead of draining it to the next surface water (via a wastewater treatment plant or not) more and more constitutes an element in integrated water management. Also the direct use of rainwater is increasingly popular among the population. For Flanders the use of rainwater by households has increased by 34% since 1995 (MIRA-T 2005). Innovative water management concepts for new settlement regularly include rain water in their programme of measures.
4.2 Water use restrictions A common and widely applied adoption to manage scarce water resources particularly in times of drought are water use restrictions. Applying this measure clearly indicates a sense of urgency for the problem of water scarcity. Prominent cases of drought decrees are known for Spain (hose pipe ban, prohibition to fill swimming pools), Southeast England (hose pipe ban), Australia (Sydney Water). Israel massively restricted water allocations to farmers, cutting them to 50% of the level of 1998 consumption when reservoirs were almost depleted in 1999 (MNI, 2002a). These decisions are based on and reflect the prioritisation of water uses which often rank domestic water supply over industrial and higher than agriculture. Quota fixing is essential, when e.g. reservoirs are shared by different users (agriculture, hydropower, drinking water) In Flanders considerations to reserve good quality deep groundwater for drinking water production and to offer alternative resources to other users, i.e. industry and agriculture, are under discussion (GOM, 2004). These
TECHNEAU Trends in water stressed regions © TECHNEAU - 44 - December 2006

measures are aimed at avoiding overuse and enabling replenishment of water resources. Such steering activities necessitate a supportive frame. Aiding measures like incentives and authorisations have to be embedded in water policy and management.
4.3 Improved monitoring of water quality In water stressed regions, natural resources tend to vary widely in both water quality and quantity. Reduced flows during specific periods allow for higher impact of pollution events. This risk calls for an improved monitoring of the raw water or drinking water as such. Monitoring of groundwater resources, both quantitatively and qualitatively, will be further promoted and implemented in the courses of the Water Framework Directive requirements.
4.4 Advanced treatment technologies Evidence of pollutants in all aquatic compartments and even in drinking water force adaptive reactions of the water supply. Scandals of environmental pollution reveal that conventional treatment technology is often not sufficient. Membranes, ozonation, UV light and activated carbon are options to achieve disinfection, degradation and adsorption of contaminants. The selection of a treatment train should aim at better balancing the risks and benefits of established or proposed new water treatment technologies with regard to energy intensity, residue management, formation of degradation by-products and alike . At the same time, the introduction of new or advanced technology requires the know-how and the financial capacity for funding and operating. Further involvement of private capital in the water sector seems inevitable. The ambitious increase in seawater desalination capacity in Israel will mainly be financed by private capital. New technical demands might lead to more mergers or clustering of water treatment utilities.
4.5 References Bixio, D., Thoeye, C., De Koning, J., Joksimovic, D., Savic, D., Wintgens, T., Melin, T. (2006) Wastewater reuse in Europe Desalination Vol. 187. 89-101 GOM - WEST-VLAANDEREN (2004) Prioriteitenplan - Alternatieven voor diep grondwater in West-Vlaanderen, Kenniscentrum Rationeel Waterbeheer GWI (2004) Desalination Markets 2005-2015 - A global assessment and forecast. Global Water Intelligence
TECHNEAU Trends in water stressed regions © TECHNEAU - 45 - December 2006

Hochstrat, R., Wintgens, T., Melin, T., Jeffrey, P. (2006) Assessing the European wastewater reclamation and reuse potential - a scenario analysis. Desalination, Vol. 188, 1-8. MMA (2006) Spanish Ministry of Environment http://www.mma.es/agua/entrada.htm MNI (2002) Transitional Master Plan for Water Sector Development in the Period 2002-2010. Ministry of National Infrastructure, Water Commission, Planning Division. Executive Summary MNI (2002a) Israel Water Sector. Ministry of National Infrastructure, Water Commission, Planning Division. Executive Summary MEPA (2006) State of the environment report 2005. Malta Environment & Planning Authority MIRA-T2005 available at http://www.milieurapport.be/desktopdefault.aspx?tabid=939 Thoeye, C., Cauwenberghs, J., Wintgens, T., van Houtte, E., Bixio, D., De Gueldre, G. (2005) Overview and Background of Water Reuse practice in Flanders, Belgium. Proceedings of the Technical Workshop: The integration of reclaimed water in water resources management, 19-20 October 2005, Lloret de Mar, Costa Brava, Spain, 235-247 Van Houtte, E. and Verbauwhede, J (2004) Closing the water cycle: twenty months of operational experiences in Torreele (Flanders), International Workshop on Implementation and Operation of Municipal Wastewater Reuse Plants, Thessaloniki, Greece - 11/12 March 2004
TECHNEAU Trends in water stressed regions © TECHNEAU - 46 - December 2006