Embed Size (px)
Citation preview

Reconnection in Three Dimensions: The Role of Spines in Three Eruptive
Flares
Angela Des Jardins1, Richard Canfield1, Dana Longcope1, Crystal Fordyce2 and ScottWaitukaitis3
1Physics Department, Montana State University, Bozeman, MT 59717-3840, U.S.A.,2Department of Physics and Astronomy, Clemson University, Clemson, SC, 29634, U.S.A.,
3Department of Physics, University of Arizona, Tucson, AZ, 85721, U.S.A.
revised: 9-24-2008
ABSTRACT
In order to better understand magnetic reconnection and particle acceleration insolar flares, we compare the RHESSI hard X-ray (HXR) footpoint motions of threeflares with a detailed study of the corresponding topology given by a Magnetic ChargeTopology (MCT) model. We analyze the relationship between the footpoint motions andtopological spine lines and find that the examined footpoint sources move along spinelines. We present a 3D topological model in which that movement can be understood.As reconnection proceeds, flux is transferred between the reconnecting domains, causingthe separator to move. The movement of the separator’s chromospheric ends, identifiedwith the HXR footpoints, is along those spine lines on which the separator ends.
1. Introduction
Magnetic reconnection is the mechanism of topological change that is thought to bring aboutenergy release and non-thermal electron acceleration in solar flares. By studying the radiativeoutput of flares in association with the magnetic topology of the flaring region, we can learn a greatdeal about the topological location of reconnection. Knowing the location of reconnection is key tounderstanding both flare trigger and evolution processes.
Since the wealth of data now available from Ramaty High Energy Solar Spectroscopic Imager(RHESSI; Lin et al. 2002) exhibits many cases of hard X-ray (HXR) footpoint motion, an expla-nation for the various types of movement is of great interest. For example, Fletcher & Hudson(2002) compare observed footpoint motions to those predicted by flare models. They conclude thatfootpoint motions do not resemble the simple increase in separation expected in 2D reconnectionmodels. Bogachev et al. (2005) analyze the HXR footpoint motions of 31 flares observed by theYohkoh Hard X-ray Telescope (HXT; Kosugi et al. 1991) with respect to neutral lines calculatedfrom photospheric magnetograms. They find that only 13% of footpoints move away from theneutral line.

– 2 –
Several groups have sought to explain flare features via topological models. Gorbachev &Somov (1988) describe a topological model which satisfies the observational requirements of two-ribbon flares, such as HXR ‘knots’ in the ribbons. In their model, the active region separator,the special field line on which reconnection occurs, directs the released energy flux to the flareribbons. Somov et al. (1998) present a reconnection model which explains the observation that theseparation of HXR footpoints in ’less impulsive’ flares (impulsive phase t > 30-40 s) tends to increasewhile in ’more impulsive’ flares (t < 30-40 s), it decreases. They attribute the increase/decreasein footpoint separation to an increase/decrease in the longitudinal field at the flaring separator,increasing/decreasing the length of the reconnected field lines.
While substantial work has been done in the areas of multi-wavelength analysis of solar flaresand coronal magnetic field modeling, little attention has been given to the combination of these twosubjects. Metcalf et al. (2003) describe a coincidence between magnetic separatricies and featuresof the 25 August 2001 white-light flare. They conclude that the HXR footpoint motions present inthis flare are consistent with reconnection at a separator. Here, we explore three flares by examiningthe relationship between HXR footpoints and spine lines.
In this paper, for the first time, we compare flare HXR footpoint motions observed by RHESSIand a detailed study of the active region’s magnetic topology. This examination is conductedusing data from the Solar and Heliospheric Observatory’s Michelson Doppler Imager (SOHO/MDI;Scherrer et al. 1995) and a magnetic charge topology model (MCT; see Longcope 2005). The MCTmodel allows us to observationally characterize the connectivity of coronal field lines by definingdistinct source regions in the photosphere. We use this information to explain footpoint motionswithin the framework of magnetic reconnection – the transport of flux from one pair of sources toanother – and flare models.
Several topological features are important to reconnection in flares (for terminology see Long-cope 2005). Poles are the positive and negative point sources of magnetic flux, an idealization ofwell-defined features like sun spots and pores. The set of all field lines originating at a given positivepole and ending at a given negative pole fills a volume of space called a domain. A separatrix is aboundary surface dividing domains. Null points are the locations where the magnetic field vanishes.Near null points, the magnetic field is approximately
B(xa + δx) ≈ Ja · δx, (1)
where Jaij = ∂Bi/∂xj is the Jacobian matrix evaluated at xa. This matrix has three eigenvalues
which sum to zero because it must be traceless; ∇ · B = 0. If two eigenvalues are positive (negative)then the null is positive (negative). The eigenvectors associated with the two like-signed eigenvaluesdefine the fan, in which the separatrix field lines lie. The third eigenvector defines one parallel andone anti-parallel spine field line, which connect the null’s two spine poles. A spine line usually liesin the photosphere, extending from a pole through a null to another pole of the same polarity. Aseparator field line, which starts and terminates at null points, is the intersection between separatrixsurfaces. A separator is the generalization to three dimensions of a two-dimensional X-point. While
– 3 –
reconnection can also occur on separatrix surfaces, separators are hypothesized to be the mainlocation for reconnection in MCT models (Greene 1988; Lau & Finn 1990).
There are several advantages to this MCT method including: 1) Due to the fact that the topo-logical features are quantitatively defined, powerful mathematical tools can be used. One of thesetools is the ability to calculate the spine lines associated with the field. 2) Model sources representthe fluxes and locations of strong photospheric fields, thus the photospheric boundary of the modelis a quantitative representation of the observed line of sight magnetogram. Of course, we would liketo apply a full nonlinear force-free field model to extrapolate the complex magnetic field of theseflaring active regions into the corona. Such modeling, however, is beyond current computationalcapabilities at the level of complexity of the magnetic fields of the active regions we study below.3) Calculation of the topological features of the model coronal field is not computationally timeconsuming, so we are able to study several cases.
In this paper, we present the analysis of three X class flares, each well observed by RHESSI, eachexhibiting significant footpoint motion. We have examined the HXR emission in detail (see Section2), calculating the centroids of each footpoint source several times per minute, or as frequentlyas count statistics allowed. A MDI magnetogram close to each flare start time was used as aninput to the MCT extrapolation model, resulting in a topological map of each flaring active region(see Section 3). We then plotted the footpoint centroids on the topological maps and looked for arelationship between the spine lines and footpoint tracks. Details of this step is given in Section 4.Finally, in Section 5, we propose a simple topological model for why footpoints move along spinelines in the directions that are observed.
2. Flare Observations and Analysis
The criteria for the flares chosen in this study were that they occurred within 30 degrees ofdisk center, were well observed by RHESSI, and exhibited significant footpoint motion. Only ahandful of flares fit these criteria, so while compact flares might have been a more simple startingplace for this study, all three of the flares we examined were eruptive (as indicated by the LargeAngle Spectroscopic Coronagraph (LASCO; Brueckner et al. 1995) coronal mass ejection catalog).These flares occurred on 29 October 2003, 7 November 2004 and 15 January 2005, hereafter A, Band C respectively.
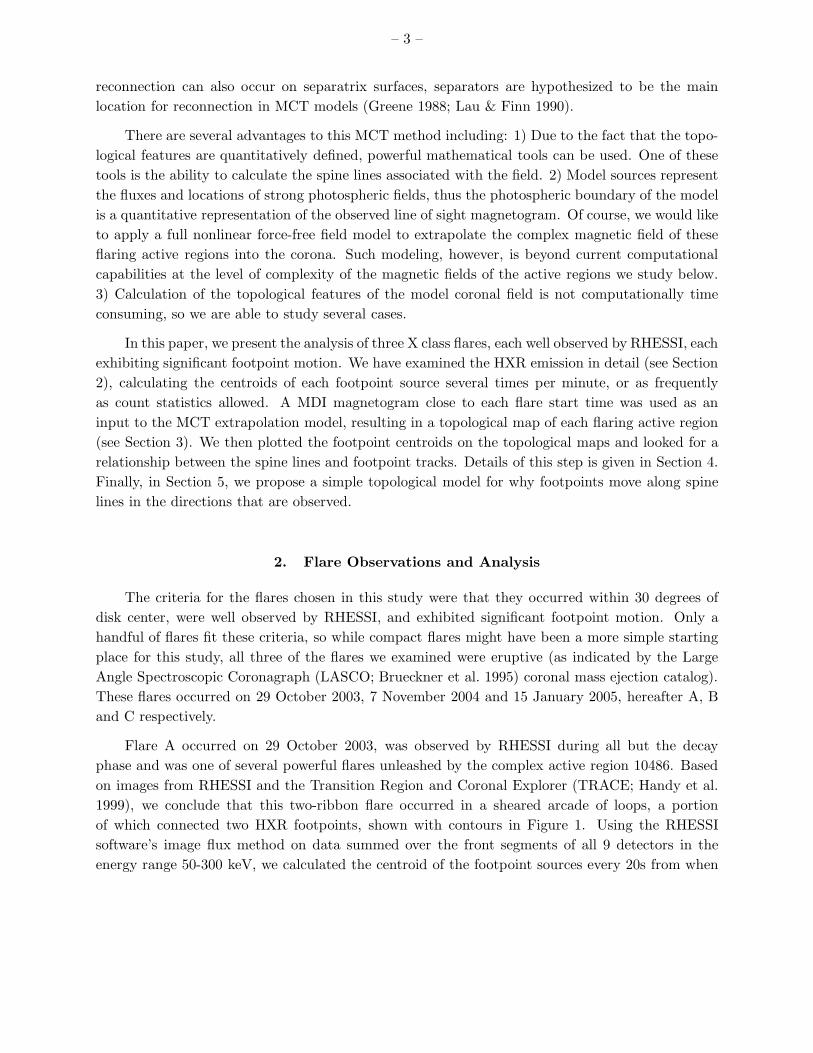
Flare A occurred on 29 October 2003, was observed by RHESSI during all but the decayphase and was one of several powerful flares unleashed by the complex active region 10486. Basedon images from RHESSI and the Transition Region and Coronal Explorer (TRACE; Handy et al.1999), we conclude that this two-ribbon flare occurred in a sheared arcade of loops, a portionof which connected two HXR footpoints, shown with contours in Figure 1. Using the RHESSIsoftware’s image flux method on data summed over the front segments of all 9 detectors in theenergy range 50-300 keV, we calculated the centroid of the footpoint sources every 20s from when
– 4 –
C) TRACE 1600, RHESSI 25-300 keV
80 100 120 140260
280
300
320
340
A) TRACE 195, RHESSI 50-100 keV
0 20 40 60 80 100 120 140
-440
-420
-400
-380
-360
-340
-320
-300
Fig. 1.— TRACE images from flares A and C with RHESSI contours. Top (flare A): TRACE 195A image with RHESSI 50-100 keV contours at 30, 50, 70% integrated for 4 s. Bottom (flare C):TRACE 1600 A image with RHESSI 25-300 keV contours at 30, 50, 70% integrated for 20 s.

– 5 –
Flare A, MDI 20:50:36 UT
0 50 100 150 200 250-450
-400
-350
-300
1N 1P
2P
Flare B, MDI 16:30:00 UT
200 250 300 350 400
20
40
60
80
100
120
1N 1P
Flare C, MDI 22:27:00 UT
0 50 100 150
240
260
280
300
320
340
360
1P
1N
2P
2N
Fig. 2.— MDI line of sight magnetic field images of the three active regions (white is positive, blackis negative) and RHESSI HXR footpoint tracks, which follow the color coded UT time scaling shownto the right. Each + symbol marks the centroid location of a source at 50-300, 25-300 and 25-300keV for flares A, B and C respectively. The centroids are plotted with the following (UT) timing:A - every 20 s from 20:41:00-20:57:00, B - every 10 s from 16:20:50-16:30:00, C - every 20 s from22:32:40-23:08:20.

– 6 –
Table 1: Flare properties. AR is the active region number and FP motion gives the time range overwhich the footpoints were observed to move.
Flare Date Location Peak Time GOES AR FP Motion(heliocentric ′′) (UT) Class (UT)
A 29 Oct 2003 (100, -350) 20:48 X10 10486 20:41-20:57B 7 Nov 2004 (330, 170) 16:06 X2 10696 16:21-16:30C 15 Jan 2005 (150, 310) 22:50 X2 10720 22:34-22:58
Fig. 3.— Left hand panels are GOES lightcurves for each flare. The dashed lines on the left panelsindicate the time range for the right panels. Right hand panels are corrected count rates per secondin the 6-12 (top) and 50-100 keV (bottom) energy bins for each flare. In both the right and leftpanels, the solid vertical lines indicate the time range over which the footpoint motion is observedand plotted in Figures 2 and 5. The dotted lines indicate the time of the images shown in Figure1.

– 7 –
they first appeared at 20:41 UT until they faded out at 20:57 UT. The negative polarity footpoint(1N, top panel, Figure 2) moved steadily at ∼ 44 km s−1 along an extended region of negativeflux with average field strength -650 G. The positive footpoint (1P) traveled at a slower rate (∼18 km s−1) through a large 1920 G positive source. From approximately 20:41-20:44 UT, a thirdfootpoint source (2P) was present just below and to the east of source 1P. This source exhibited nosignificant motion during the short time it was observed. Footpoint 1N was present for the entireperiod while the weaker footpoint 1P was missing for two periods: 20:47:00-20:50:00 and 20:56:20-20:57:00 UT. A substantial decrease in count rate during the first of these periods (see 50-100 keVlightcurve in Figure 3) coincides with a decrease in flux of both footpoints, and footpoint 1P fallsbelow the level of detection.
Flare B was recorded by RHESSI on 7 November 2004 from 16:05-17:04 UT with exceptionof a span between 16:32 and 16:45 UT. Flare B came right on the heels of an earlier thermal flarejust to the west, which occurred mostly during RHESSI night. Both the negative (1N) and positive(1P) polarity footpoints (middle panel, Figure 2) are observed in each of a series of 10 s imagesfrom 16:20:50 to 16:30:00 UT. The images were made with the front segments of all 9 detectors inthe energy range 25-300 keV. Footpoint 1N takes a curious path through a region with average lineof sight field strength -680 G. For the first 2 minutes it moves to the west at ∼ 116 km s−1, thentravels for 3 minutes to the east before traveling again to the west at a slower rate (∼ 58 km s−1)about 5′′ below the first westward movement. Footpoint 1P progresses at ∼ 80 km s−1 along anarea of 500 G positive field for about 6 minutes, taking a sharp turn 2 minutes in before slowingdown to ∼ 18 km s−1 in a stronger 1720 G source.
Flare C occurred on 15 January 2005 and was observed by RHESSI during its impulsive phase,from 22:15-23:15 UT. Two sets of footpoints were followed in a series of 20 s images using the frontsegments of all 9 detectors in the energy range 25-300 keV, starting at 22:32:40 and continuing until23:08:20 UT. The first set was observed from 22:32:40-22:59:00 UT, where the positive polarityfootpoint (1P, bottom panel, Figure 2) disappears from the images after 22:53 UT. A second pairof footpoints (2P and 2N) was detected from 22:58:00-23:08:20 UT. Co-temporal TRACE 1600A images (Figure 1) show flare ribbons whose brightest parts are co-spatial with the first set ofRHESSI footpoints (1P and 1N). The second set of footpoints was located to the west of the first,the positive polarity footpoint (2P) in the same region of positive flux as 1P, and the negativefootpoint (2N) in a separate region from 1N. Footpoint 1P moved slowly (∼ 12 km s−1) througha region with average line of sight field strength 1770 G in a manner that was somewhat randombut generally parallel to the nearby magnetic inversion line. Footpoint 1N progressed slowly (∼ 14km s−1) out of a -1500 G region then moved more quickly (∼ 46 km s−1) through a -670 G areabefore jumping over to another -290 G source where it did a zigzag across about 10′′ before RHESSIcoverage was lost. The later set of footpoints, 2P and 2N, moved along a 1620 G extended sourceat ∼ 37 km s−1 and moved to the boundary of a -620 G region at ∼ 50 km s−1, respectively. Dueto its location, we hypothesize that the second set of footpoints was from a separate sympatheticflare. Further evidence for this hypothesis can be observed in the RHESSI lightcurves (Figure 3).
– 8 –
At 22:58, when the second set of footpoints appears, the flux observed in the 6-12 keV energyband is decreasing, a sign that the first flare is decaying. However, the HXR emission (50-100 keV)continues for another 10 min and the 6-12 keV emission rises to a second peak. These factors ledus to conclude that footpoints 2P and 2N were part of a sympathetic flare.
When studying the motion of RHESSI HXR sources, one of the first steps to take is to establishthat they are indeed chromospheric (footpoint), not coronal (loop top) sources, and that they aremagnetically conjugate. We address these matters in three ways. First, we compare the generalcharacteristics (e.g. start, peak and end times) of the HXR light curves of the candidate pair. If thetwo footpoints are connected by the same field lines, then the fast electrons running down eitherside of those lines should impact the chromosphere at approximately the same time. With a 20 simaging cadence, the sources’ light curves should coincide. Second, we examine the MCT modeltopology to see if a connection exists between the positive and negative magnetic sources associatedwith the footpoints. Third, if an extreme ultraviolet image is available during the flare time, welook for a hot loop connecting the HXR source regions. This visual connection gives credence tohot evaporated plasma having filled up the newly reconnected loop. The employment of thesetechniques leads us to the conclusion that the HXR sources 1P and 1N of flare A are conjugate.Due to a lack of extreme ultraviolet images during flare B, the case for conjugacy is not as strong.However, the RHESSI data and topology lend enough support that we claim sources 1P and 1N offlare B are conjugate. Flare C has two sets of conjugate footpoints: sources 1P and 1N and sources2P and 2N. Finally, these demonstrations of conjugacy also serve to justify a basic assumption thatwe have made implicitly up to this point, namely that the RHESSI HXR sources whose motionswe have tracked in Figure 2 are not loop top sources.
3. Topology Observations and Analysis
In order to understand the topological location of magnetic reconnection, we need to char-acterize the connectivity of the field. An approximation must be made in order to produce theboundaries needed to determine this connectivity. Here, we approximate the field by using a MCTmodel. Following Longcope & Klapper (2002), the line-of-sight field recorded in magnetograms ispartitioned into strong-field regions. Each region is then characterized by a point source whichmatches the region’s net flux and is located at the region’s centroid.
In the standard 2.5D model for two-ribbon flares, the CSHKP model (Carmichael 1964; Stur-rock 1968; Hirayama 1974; Kopp & Pneuman 1976), the footpoints are predicted to move apartfrom one another as the reconnection region moves higher in the corona. As field lines are recon-nected, the footpoints travel across continuous regions of magnetic flux. In the MCT model, thisflux region is represented by a point source, so we cannot follow a footpoint path across it. Wecan, however, use the concept of spine lines to make the connection between footpoint motion andthe MCT model. Spine lines extend across strong-field regions, providing paths through regions oflike flux that can be compared to the paths traveled by the HXR footpoints.

– 9 –
As with any coronal field extrapolation model currently available, there are limitations to theMCT model we use. One limitation of our model is the loss of information on the geometry ofthe field. This is a result of representing patches of magnetic field with point sources. We cannotdistinguish if a coronal field line emanates from the outside edge of the modeled source or thecenter. We are not concerned, however, with the exact location of the topological features of thefield – the geometry – but are only interested in the location of topological features relative to eachother – the connectivity.
Another limitation of this extrapolation model is that the magnetic field in each domainis potential. Currently, we do not have the ability to model coronal fields above the complexactive regions where flares typically occur with a non-linear force free field model. Nevertheless, amoderately stressed field probably has a topology similar to that of the potential field (Brown &Priest 2000); it has the same separators dividing the flux domains and the same spines modelingphotospheric sources.
A third limitation of this MCT model is our inability to consider open field lines or shearedor twisted flux tubes, whose currents can induce significant topological changes. This means thatwe cannot fully model the properties of the flux tube which becomes the coronal mass ejection inthe CSHKP model. The evidence we have for reconnection deals with electrons streaming alongthe closed field lines that have collapsed down beneath the separator. Using these closed field linesand the information we have from HXR emission still allows us to point to the topological locationof reconnection and thus learn a great deal about the release of energy in flares.
Topological models can be applied more directly to eruptive flares by following flux changes inthe strong field regions during the tens of hours prior to a flare. This has been done by Longcopeet al. (2007) for the 7 November 2004 X2 flare using the Minimum Current Corona model (MCC;Longcope 1996, 2001). While using the MCC model certainly has quantitative advantages, it isbeyond the scope of this paper.
The MCT model produces a topological map at the photosphere which can be used to extrap-olate the field into the corona. The calculation of the topology begins by selecting a subregion,namely the main body of the active region, from full-disk MDI magnetograms made as close to theflare start time as is available, typically within 30 min. Next, the observed field is partitioned bygrouping pixels that exceed a set threshold (100 G for flares A and B, 50 G for flare C) and aredownhill from the local maximum into a region. Regions with fewer than 10 pixels are discarded.
The partitioning determines the location and charge of each pole. A potential field extrapolatedfrom these determines the locations of the nulls. Once the nulls are calculated, the spine lines,separatricies and separators are given by the physics of the MCT model.
The skeleton footprint, the intersection of the separatrix surfaces with the photosphere aswell as the spine lines, poles and nulls, characterizes the topology of the model and shows theconnectivity of the field visually. The area within a domain’s boundary, formed in part by theintersection of the separatricies with the photospheric plane and in part by the spine line, contains

– 10 –
the photospheric footprint of the set of field lines connecting the domain’s positive and negativepoles. The topological footprint for flare A is given in the top panel of Figure 4. Source P01, pointedout by the arrow, is connected to many negative sources, including N22, N14, N08 and N13, whichare just to the east of P01. For clarity, subsequent figures show only the poles (unlabeled), nullsand spine lines.
We paid careful attention to the co-alignment of the MDI magnetograms and RHESSI data.Spatial alignment of MDI and RHESSI data taken at the same time typically agree to within 2′′
(Krucker et al. 2005). The MDI magnetograms are differentially rotated to the midpoint time ofthe observed footpoint motion to ensure the best spatial and temporal comparison. One of thecriteria for topological analysis of this type is that the flaring region not be more than about 30degrees from disk center. Outside of 30 degrees, the line-of-sight component of the field is not anaccurate enough approximation for our topological models.
Topological analysis gives the connectivity of the field, which is important in this study for twomain reasons. One, it aids in the determination of conjugate HXR footpoints. If two HXR sourcesare conjugate, then there must be field lines connecting the corresponding magnetic sources. Two,the connectivity gives the locations of topological features such as spine lines, which, as we arguein this paper, are important analytical tools in the study of reconnection and particle accelerationin flares.
4. Analysis of Footpoint Motion and Spine Lines
While analyzing the topology of active region 10486 with respect to the HXR footpoints offlare A, we noticed a remarkable visual relationship between the spine lines and footpoint tracks.For example, track 2 (top panel, Figure 5) moves through an extended region of negative flux nearlyparallel to the spine line. We then expanded our analysis to two different flares, flares B and C,and observed the same relationship. In flare B (center panel, Figure 5), the footpoint associatedwith the positive magnetic field makes two turns, from track 2 to 3 and from track 3 to 4, whichresemble the spine line curves. As in the first case, the footpoint is moving along an elongatedarea of flux. The spine lines trace through this flux, connecting a source to an intermediate nullto another source. Notice also that this footpoint slows down once it reaches the strong positiveregion of flux at the end of its path.
Not all footpoint tracks have shapes identical to the corresponding spine line. For example,track 2 of flare C (bottom panel, Figure 5) moves in a nearly straight path along the main regionof positive flux, while the spine line, due to the locations of the nulls, makes a W shape. Thisdiscrepancy can be explained by the nature of the topological approximation. As we discussed inSection 3, information about the geometry of the magnetic field is lost in the process of definingthe field’s connectivity. The loss of information occurs when boundaries are drawn around sourceregions and the source regions are represented by point charges. Thus, the location of the spine

– 11 –
Fig. 4.— Top: photospheric footprint of the topology for flare A. Plus (+) symbols labelled witha P (e.g., P01, indicated by the arrow) identify positive poles, while (×) symbols labelled with N(e.g., N08, to the left of P01) identify negative poles. The triangles indicate null points, eitherpositive (�) or negative (�). Solid lines are the spine lines and dashed lines are the intersectionof the separatrix surfaces with the photosphere plane. Bottom: example field lines and RHESSIHXR sources (+ symbols without P or N labels) for flare A.

– 12 –
12
3
2
3
41
1
2
34
5
Fig. 5.— Poles, nulls, spine lines and HXR footpoint tracks on magnetograms for flares A (top),B (center) and C (bottom). Violet lines are spine lines which we did not associate with HXRfootpoints. Spine lines marked with non-violet colors were identified (and quantitatively analyzed)with the HXR footpoint tracks of like color. The color-coded numbers label the tracks in Table 2.

– 13 –
lines have a spatial uncertainty proportional to the size of the source region. The larger the sourceregion, the larger the uncertainty in the location of spine line. The defining property of a spineline is that it connects regions of like flux. Depending on the characteristics of local maxima in thefield, a spine line can take on different paths through the flux regions. We refer again to track 2of flare C. Here, the spine line reflects the structure of the positive field, but the HXR footpointsimply moves through it.
In order to quantify the association of spine lines and HXR footpoints of the type describedabove as well as those with a clear visual relationship, we conducted an analysis of the two features’average angles. Due to the nature of the uncertainties in the spine lines, the angle at which thefootpoints moved relative to the spines is more important than their distance from the spine lines.
The HXR footpoint angles shown in Table 2 were calculated by finding the angle betweenconsecutive centroids and averaging these angles for each footpoint track. Angles were measuredfrom 0 to 2π radians where 0 rad. always pointed straight to the right of footpoint centroid i. Ifcentroid i + 1 was located directly north of i, then the angle between these footpoints was π/2.A footpoint moving straight from right to left would have the average angle π. In some cases,footpoints did move steadily in one direction and thus the standard deviation of the angles wassmall (∼ 0.3 rad). However, in other cases, footpoints moved more randomly and the uncertaintywas larger (as large as 1.23 rad.). By integrating over more time when reconstructing RHESSIimages, we could have smoothed over some of the small spatial variations. Nevertheless, we wantedto retain a much spatial and temporal information as was allowed by count statistics.
Spine line angles were calculated with the same method as the footpoint tracks, averaging theangles from one point on the spine curve to the next. The uncertainty in the spine angle comesfrom the fact that a spine can extend from a null at the edge of a flux region across the region inany direction. In our method, the pole is placed at the region’s center of flux, such that the spineextends from the null through the center. However, in the un-approximated field the spine line, asan edge of a domain, can extend across the region from the null through any point in the region.Thus, the uncertainty in the spine angle is proportional to the width of the region. To calculatethis uncertainty, we measured the angular width of each flux region by finding the angle betweentwo special lines, one drawn from a spine’s null to the widest point of the flux region and the otherfrom the spine’s null to the center of flux.
Once we calculated the two sources of error – the standard deviation of the footpoint angleand the uncertainty in the spine line angle(s) – we added them in quadrature to produce a totaluncertainly. We then checked if each average spine and footpoint angle agreed to within the totaluncertainty. Not only was it confirmed that the two angles agreed with each other in every case,but they often matched much more closely than the total uncertainty angle. This can be explainedby the fact that our method gives the maximum total error. If we had simply fit the footpointtrack with a line and found how well each HXR centroid agreed with this line, our error would havebeen smaller. The best fit line method, however, doesn’t accurately represent the detailed motion

– 14 –
of the footpoints; it smoothes out the short time-scale variations.
Table 2 gives the spine line and footpoint track angles as well as their differences. If the spinelines and footpoint tracks were unrelated and their angles were random, then the distribution oftheir differences would be flat. The distribution is not flat, but peaks about 0. Differences in thetwo angles extends between 0 and π/2 because spine lines have no temporal ’direction’. We choseto calculate the spine angles in the same direction as the footpoint motion. Thus, the largest theangle differences could have been is π/2 rad.
In order to quantify the significance of this result, we applied the Kolmogorov-Smirnov (K-S)test (Press et al. 1992) to the unbinned angle differences. The K-S test is the best test for oursample because it assumes nothing about the distribution and uses no bins, both of which can affectthe accuracy of other tests. We find that we can reject the null hypothesis that the average spineline and footpoint track angles have a random relationship with 99.95% confidence. Therefore, itis our observational conclusion that the RHESSI HXR sources move along spine lines.
5. Discussion
In this paper, we have demonstrated the association of HXR footpoint tracks and spine lines.Now the question is why the HXR footpoints move along spine lines. To understand this relation-ship, we first need to examine the types of footpoint motion commonly observed. Somov et al.(1998) define two categories of flares: more impulsive and less impulsive, acknowledging that someflares are of an intermediate type. They state that in more impulsive flares, which have impulsivephases lasting less than 30-40 s, the HXR footpoints move toward one another. Less impulsiveflares, with impulsive phases lasting longer than 30-40 s, undergo an increase in the distance be-tween footpoints. Others (e.g. Bogachev et al. 2005) refer to footpoint motion using descriptionssuch as motion parallel or perpendicular to the magnetic inversion line. Sakao et al. (1998) ob-served some HXR footpoints whose separation decreased, others whose separation increased, andeven some footpoints that moved parallel to the magnetic inversion line.
The motion of footpoints along spine lines can be understood with the aid of the quadrupolarmodel in Figure 6. Even in the most complex field, each individual reconnection event involvesonly 4 domains and therefore can be understood in terms of a quadrupolar configuration. Thequadrupolar configuration is not meant to model the entire flaring region, but rather, the separatorin the configuration is one of several on which reconnection occurs over the course of a flare.
We discuss three cases of reconnection events for this quadrupolar model. In each case, re-connection is the result of a flux imbalance in part of the quadrupolar configuration. As a flareprogresses, the reconnection moves from separator to separator (thus from one quadrupolar re-gion to another), balancing the flux and reducing the energy state of the global magnetic field.More complete details on the way we understand how reconnection transfers from one separator toanother are given in a paper recently submitted by Longcope & Beveridge (2007).

– 15 –
1
12 2
3 3
Fig. 6.— Upper panel: key topological features. P1 and P2 (+) are positive poles while N1 and N2are negative poles (×). The triangles are null points, one positive (�) and one negative (�). Theorange, purple and red field lines lie on the separatrix surface under which exist all of the field linesconnecting P2/N1, P1/N2 and P2/N2 respectively. Above the orange and purple separatricies is thedomain containing all of the field lines that connect P1 to N1. All four of these domains intersectat the separator (thick black line). The thick green lines are the spine lines. Lower panel: expectedfootpoint movement along the spine lines for the configuration in the upper panel. Dashed linesare the intersections of the separatrix surfaces with the photosphere. Arrows indicate the directionof separator movement during reconnection for cases 1, 2 and 3 (see Section 5).

– 16 –
The assumptions involved in our explanation include the following. Reconnection occurs at acurrent sheet which is located on the separator, producing fast-precipitating electrons which streamalong the separator field line until they encounter the chromosphere. At the chromosphere, theelectrons are decelerated via thick-target bremsstrahlung, resulting in the HXR footpoint sources.
We point out that linked spine lines are the topological characterization of extended regions oflike flux. The MCT extrapolation model’s point sources (poles) represent patches of photosphericflux. The poles are placed at patch’s center of flux. Between two poles exists a place where thefield strength goes to zero (a null). A single spine line connects two like poles via the null. Often,a spine line links not just one pair of poles, but continues to another null and then another pole,and so on. It is not surprising, therefore, that the HXR footpoints move along the spine lines,especially in the cases where the magnetic flux is strung out in fragmented pieces as in track 2 offlare A. The correlation, however, between spine lines and non-fragmented flux is also significant.For example, track 3 of flare C, which extends through a solid area of flux, corresponds to the spineline to within 0.18 rad.
In case 1, we suppose that the domain P2/N2 (containing the red field lines) has too muchflux in the sense that it can reach a lower energy state (become more potential) by decreasing itsflux through reconnection. Also, let’s say the separator in the figure is at the position drawn attime t=0. If a field line from the underlying flux domain P2/N2 approaches a field line in theoverlying domain P1/N1 at the separator and reconnects, producing two new field lines in thedomains P2/N1 (orange) and P1/N2 (purple), then the reconnected flux is moved from P2 into P1and from N2 into N1. At a later time t=1, the separator is located closer to the P2 source centerdue to P2’s loss of connecting field lines and P1’s gain. The other end of the separator is closer toN2’s center due to N2’s loss and N1’s gain. As time goes on, the process of P2 losing field linesto P1 and N2 to N1 continues, and the chromospheric ends of the separator (and hence the HXRfootpoints) move antiparallel and slightly toward each other along the spine lines, as shown by thepurple arrows labelled 1 in Figure 6.
Somov et al. (1998) present a different analysis reaching a similar conclusion. In their topolog-ical model ‘more impulsive’ flares have decreasing longitudinal magnetic flux along the separator,resulting in a decrease in the distance between footpoints. They also point out that the reconnectedfield lines decrease in length as the reconnection process proceeds. This is the same basic physicalprocess we describe in case 1, with the exception that we refer specifically to how the separatorchanges rather than the decrease of longitudinal flux and reconnected field line length. In case 1,the separator would shorten in length and decrease in height as the domain beneath it shrank.
In case 2, we suppose that the domain P2/N2 (red) has too little flux, so field lines from thedomains P1/N2 (orange) and P2/N1 (purple) reconnect to form new lines in P1/N1 and P2/N2.Here, the footpoints move towards the N1 and P1 centers of flux, antiparallel and away from eachother along the spine line,as shown by the yellow arrows labeled 2 in Figure 6. The separatorlengthens and increases in height as the domain beneath it grows.

– 17 –
This example is similar to the reasoning used to explain two ribbon flares with sheared arcades.When a sheared magnetic field suddenly releases energy in the form of a two ribbon flare, domainsof source pairs initially far apart and nearly empty of flux now have too little flux relative to alower-energy field. In order to lower the energy state, flux is added to the underlying deficientdomains, reducing the shear in the field and increasing the length and height of the separator. Theseparator current sheet moves along the spine lines, sweeping through equal areas of positive andnegative photospheric flux and the flare footpoints move apart. The magnetic sources themselvesdon’t change–only their connectivity does so.
In case 1 the imbalance of flux led to the growth of both center domains P1/N2 and P2/N1(purple and orange) and case 2 led to their shrinkage. In case 3, we deal with the final possibilityof flux transfer in a quadrupolar configuration – when there is a flux imbalance in one of the centerdomains with respect to the other. For example, we assume the domain P1/N2 has too much fluxand it can reach a lower energy state by transferring flux from domains P1/N2 (purple) and P1/N1(overlying) into domains P2/N1 (orange) and P2/N2 (red). In this process, the entire separatorshifts along the magnetic neutral line as the footpoints move parallel to each other towards the P1and N2 poles, as shown by the red arrows labeled 3 in Figure 6. Parallel HXR footpoint motionsare often observed; for example, Bogachev et al. (2005) report that 35% of the flares they observedhad HXR footpoint sources that moved in the same direction.
To summarize, footpoint motion along spine lines corresponds to movement of the reconnectionlocation. As the separator current sheet sweeps across region of flux, its chromospheric ends eithermove toward each other (compact flare; case 1) as the separator shortens, the ends move away fromeach other (eruptive two ribbon flare; case 2) as the separator lengthens or the ends move parallelto each other (case 3) as the separator stays approximately the same length. The movement ofthe separator’s chromospheric ends, and hence the HXR footpoints, is along the spine lines. Spinelines connect two poles via a null which shifts during the flare toward one pole or the other. Thedirection the null shifts depends on the global configuration of the region; the underlying domaingains or loses flux in order to decrease the region’s energy state.
The above explanation agrees with the observed footpoint tracks of the three flares reviewedin this paper. Referring again to Figure 4, we propose the following explanation for the footpointmotions of flare A. As is indicated by the number of light grey field lines drawn in domains P01/N14and P01/N08, a large percentage of P01’s flux is connected to N14 and N08. Initially, the footpointseparation distance decreases due to the reconnection of flux out of underlying domains P01/N14and P01/N08. The next stage of reconnection acts to release energy stored in the sheared arcade.Domains which have little connecting flux in the earlier stage of the flare (P01/N11 and P01/N10)fill up as reconnection takes place on higher and longer separators, and the footpoints move apartfrom one another. An in-depth analysis of separator properties before and after flares will be givenin a subsequent paper.
Our model can be compared to other models that have been proposed to explain HXR footpoint

– 18 –
source motions. Bogachev et al. (2005) use a sheared 2.5D model to explain the antiparallel motionof HXR footpoints along the neutral line. In their model, which cannot distinguish between flareswith increasing footpoint separation from flares with decreasing separation, the apparent motionsof HXR sources are determined by the order of reconnection along the sheared system of field lines.During the onset of a flare, the footpoint sources move toward each other, decreasing the distancebetween them, until a critical point is reached and the sources begin to move away from one another.This model is similar to other models of reconnection in sheared arcades, where reconnection startson the most highly sheared field lines and progresses to the less sheared field higher in the corona.As was pointed out earlier in this section, case 2 of our model is analogous to these models wherereconnection in sheared fields leads to the antiparallel motion of HXR footpoint sources. In thiscase, the flux deficiency in the underlying domains, due to the shear in the initial configuration,leads to reconnection that increases the length of the separator, and consequently, the footpointseparation increases.
Our model is also comparable to the slip-running reconnection model proposed by Aulanieret al. (2006), which describes reconnection within the framework of QSLs. In complex 3D magneticconfigurations, QSLs become separatrices as their width approaches zero. In fact, the intersectionof QSLs with the chromosphere are similar to spine lines in that they extend from one magneticflux source to another of the same polarity. Within the QSL, the sub-region where the squashingdegree Q (Titov et al. 2002) peaks (where the connectivity gradients are the largest) is known asthe hyperbolic flux tube (HFT; Titov et al. 2003). A HFT becomes a separator as its squashingdegree asymptotically tends to infinity. Aulanier et al. (2006) state that QSL reconnection leadsto field line slippage along the QSLs and thus the field lines slip-run along the intersection of theQSLs with the line-tied boundary. In this reconnection process, particles are accelerated to theirhighest energies in the HFT, so HXR emission is expected at the chromospheric ends of the HFT.Given this and the fact that the intersection of the QSLs with the chromosphere correspond to flareribbons (e.g. Demoulin 2006), slip-running reconnection is a possible explanation for the motion ofHXR sources along flare ribbons. Due to the analogies between the intersection of QSLs with thechromosphere and spine lines, as well as between HFTs and separators, we suggest that slip-runningreconnection is the QSL version of the separator reconnection modeled in this paper.
The association of footpoints tracks with spine lines, and more importantly the physical ex-planation for the association, can be used in future flare analysis. Having an explanation for whyHXR footpoints move the way they do will aid in the understanding of flare initiation and evolu-tion. Further work with topological models, especially analysis involving the role separator currentsheets, is needed to understand this and other aspects of the flaring process.
This work was supported by RHESSI funds from the University of California at Berkeleythrough a contract, SA1868-26308PG, with Montana State University. Funding for our ResearchExperience for Undergraduates (REU) students was provided by NSF grant ATM-0243923.

– 19 –
REFERENCES
Aulanier, G., Pariat, E., Demoulin, P., & Devore, C. R. 2006, Sol. Phys., 238, 347
Bogachev, S. A., Somov, B. V., Kosugi, T., & Sakao, T. 2005, ApJ, 630, 561
Brown, D. S., & Priest, E. R. 2000, Sol. Phys., 194, 197
Brueckner, G. E., et al. 1995, Sol. Phys., 162, 357
Carmichael, H. 1964, in The Physics of Solar Flares, ed. W. N. Hess, 451
Demoulin, P. 2006, Advances in Space Research, 37, 1269
Fletcher, L., & Hudson, H. S. 2002, Sol. Phys., 210, 307
Gorbachev, V. S., & Somov, B. V. 1988, Sol. Phys., 117, 77
Greene, J. M. 1988, J. Geophys. Res., 93, 8583
Handy, B. N., et al. 1999, Sol. Phys., 187, 229
Hirayama, T. 1974, Sol. Phys., 34, 323
Kopp, R. A., & Pneuman, G. W. 1976, Sol. Phys., 50, 85
Kosugi, T., et al. 1991, Sol. Phys., 136, 17
Krucker, S., Fivian, M. D., & Lin, R. P. 2005, Advances in Space Research, 35, 1707
Lau, Y.-T., & Finn, J. M. 1990, ApJ, 350, 672
Lin, R. P., et al. 2002, Sol. Phys., 210, 3
Longcope, D. W. 1996, Sol. Phys., 169, 91
Longcope, D. W. 2001, Phys. Plasmas, 8, 5277
Longcope, D. W. 2005, Living Reviews in Solar Physics, 2, 7
Longcope, D. W., & Beveridge, C. 2007, ApJ, in-press
Longcope, D. W., Beveridge, C., Qiu, J., Ravindra, B., Barnes, G., & Dasso, S. 2007, Sol. Phys.,in-press
Longcope, D. W., & Klapper, I. 2002, ApJ, 579, 468
Metcalf, T. R., Alexander, D., Hudson, H. S., & Longcope, D. W. 2003, ApJ, 595, 483
Press, W. H., Teukolsky, S. A., Vetterling, W. T., & Flannery, B. P. 1992, Numerical recipes in C.The art of scientific computing (Cambridge: University Press, —c1992, 2nd ed.)

– 20 –
Sakao, T., Kosugi, T., & Masuda, S. 1998, in ASSL Vol. 229: Observational Plasma Astrophysics: Five Years of YOHKOH and Beyond, ed. T. Watanabe & T. Kosugi, 273
Scherrer, P. H., et al. 1995, Sol. Phys., 162, 129
Somov, B. V., Kosugi, T., & Sakao, T. 1998, ApJ, 497, 943
Sturrock, P. A. 1968, in IAU Symp. 35: Structure and Development of Solar Active Regions, ed.K. O. Kiepenheuer, 471
Titov, V. S., Galsgaard, K., & Neukirch, T. 2003, ApJ, 582, 1172
Titov, V. S., Hornig, G., & Demoulin, P. 2002, Journal of Geophysical Research (Space Physics),107, 3
This preprint was prepared with the AAS LATEX macros v5.0.

– 21 –
Table 2: Footpoint track and spine line average angles and their difference.Flare, Track Footpoint Angle Spine Angle Difference
A, 1 4.13 4.95 0.82A, 2 3.31 2.96 0.35A, 3 0.69 0.29 0.40B, 1 3.34 3.36 0.02B, 2 2.67 2.00 0.67B, 3 0.70 0.68 0.02B, 4 2.20 2.04 0.16C, 1 1.65 1.23 0.42C, 2 0.64 0.41 0.23C, 3 3.51 3.69 0.18C, 4 2.55 2.55 0.00C, 5 1.09 1.49 0.40