Embed Size (px)
Citation preview

REALIZING THE POTENTIAL OF PUBLIC–PRIVATE PARTNERSHIPS TO ADVANCE ASIA’S INFRASTRUCTURE DEVELOPMENTJANUARY 2019
REALIZIN
G TH
E POTEN
TIAL O
F PUBLIC–PRIVATE PA
RTNERSH
IPS TO A
DVA
NCE A
SIA’S INFRA
STRUCTU
RE DEVELO
PMEN
T
Realizing the Potential of Public–Private Partnerships to Advance Asia’s Infrastructure Development
This publication highlights how public–private partnerships (PPPs) can be effective to meet Asia’s growing infrastructure needs. It shows how governments and their development partners can use PPPs to promote more inclusive and sustainable growth. The study finds that successful PPP projects are predicated on well-designed contracts, a stable economy, good governance and sound regulations, and a high level of institutional capacity to handle PPPs. It is the result of a collaboration between the Asian Development Bank, the Korea Development Institute, and other experts that supported the theme chapter “Sustaining Development through Public–Private Partnership” of the Asian Development Outlook 2017 Update.
About the Korea Development Institute KDI, established in 1971, is an independent policy-oriented research organization and a leading think-tank of the Republic of Korea. It has contributed to policy making and institutional reform by conducting research in many areas, including macroeconomics, finance, fiscal policy, social security, labor, industry, trade, economic law, and the economy. It has developed into a comprehensive policy institute of international recognition by taking up diverse roles and functions. The Public and Private Infrastructure Investment Management Center, the affiliated body of KDI, started its operations in 1999, serving as a gatekeeping agency of the Government of the Republic of Korea, then to procuring economic and social infrastructure, and enhancing efficiency and transparency of public and private infrastructure investments.
About the Asian Development Bank
ADB is committed to achieving a prosperous, inclusive, resilient, and sustainable Asia and the Pacific, while sustaining its efforts to eradicate extreme poverty. Established in 1966, it is owned by 67 members—48 from the region. Its main instruments for helping its developing member countries are policy dialogue, loans, equity investments, guarantees, grants, and technical assistance.
ASIAN DEVELOPMENT BANK6 ADB Avenue, Mandaluyong City1550 Metro Manila, Philippineswww.adb.org
KOREA DEVELOPMENT INSTITUTE263(Bangok-dong, Korea Development Institute)Namsejong-ro, Sejong-si 30149, Republic of Korea www.kdi.re.kr

Edited by Akash DeepHarvard Kennedy School, United States
Jungwook KimKorea Development Institute, Republic of Korea
Minsoo LeeAsian Development Bank, Philippines
REALIZING THE POTENTIAL OF PUBLIC–PRIVATE PARTNERSHIPS TO ADVANCE ASIA’S INFRASTRUCTURE DEVELOPMENTJANUARY 2019
Creative Commons Attribution 3.0 IGO license (CC BY 3.0 IGO)
© Asian Development Bank, Korea Development Institute6 ADB Avenue, Mandaluyong City, 1550 Metro Manila, PhilippinesTel +63 2 632 4444; Fax +63 2 636 2444www.adb.org
Some rights reserved. Published in 2019.
ISBN 978-92-9261-418-8 (print), 978-92-9261-419-5 (electronic)Publication Stock No. TCS189648-2DOI: http://dx.doi.org/10.22617/TCS189648-2
The views expressed in this publication are those of the authors and do not necessarily represent or reflect the views and policies of Korea Development Institute (KDI), the Asian Development Bank (ADB) or its Board of Governors or the governments they represent.
ADB does not guarantee the accuracy of the data included in this publication and accepts no responsibility for any consequence of their use. The mention of specific companies or products of manufacturers does not imply that they are endorsed or recommended by ADB in preference to others of a similar nature that are not mentioned.
By making any designation of or reference to a particular territory or geographic area, or by using the term “country” in this document, ADB does not intend to make any judgments as to the legal or other status of any territory or area.
This work is available under the Creative Commons Attribution 3.0 IGO license (CC BY 3.0 IGO) https://creativecommons.org/licenses/by/3.0/igo/. By using the content of this publication, you agree to be bound by the terms of this license. For attribution, translations, adaptations, and permissions, please read the provisions and terms of use at https://www.adb.org/terms-use #openaccess.
This CC license does not apply to non-ADB copyright materials in this publication. If the material is attributed to another source, please contact the copyright owner or publisher of that source for permission to reproduce it. ADB cannot be held liable for any claims that arise as a result of your use of the material.
Please contact [email protected] if you have questions or comments with respect to content, or if you wish to obtain copyright permission for your intended use that does not fall within these terms, or for permission to use the ADB logo.
Notes: 1. In this publication, “$” refers to United States dollars.2. ADB recognizes “China” as the People’s Republic of China; “Hong Kong” as Hong Kong, China;
and “Korea” as the Republic of Korea.Corrigenda to ADB publications may be found at http://www.adb.org/publications/corrigenda.Cover photo: Astana Bridge spans across Ishim river. Photo by Ariel Javellana.

iii
Contents
Tables, Figures, and Boxes v
Foreword ix
Acknowledgments xi
Abbreviations xii
1 Overview 1Akash Deep, Jungwook Kim, and Minsoo Lee
PART I THE BENEFITS AND RISKS OF 13 PUBLIC–PRIVATE PARTNERSHIPS
2 The Empirical Evidence and Channels for Effective 15 Public–Private PartnershipsMinsoo Lee, Raymond Gaspar, Emmanuel Alano, and Xuehui Han
3 Assessing Risk in Public–Private Partnerships 47Minsoo Lee, Pilipinas F. Quising, Mai Lin Villaruel, and Xuehui Han
PART II MOBILIZING FINANCE FOR 75 PUBLIC–PRIVATE PARTNERSHIPS
4 Factors Influencing Bank Project Financing of Infrastructure 77 Public–Private Partnership Projects in Developing AsiaVivek Rao
5 Syndicated Loans in Project Finance: Empirical Evidence 109 from Asian Public–Private Partnership MarketsMichael Timbang and Vivek Rao
6 Determinants of Public–Private Partnerships in 137 Infrastructure in Emerging EconomiesSuk Hyun, Donghyun Park, and Shu Tian
7 Risk Mitigation and Sovereign Guarantees 167 for Public–Private Partnerships in Developing EconomiesAlexander Jett

iv Contents
PART III LESSONS FROM THE EXPERIENCE OF 189 USING PUBLIC–PRIVATE PARTNERSHIPS IN DEVELOPING ASIA
8 Delivering Economic Benefits from Public–Private Partnerships: 191 The Experience of the Republic of KoreaJungwook Kim and Suhyeon Wi
9 Public–Private Partnerships versus Traditional Procurement: 215 A Comparison of Financing Modalities in the Republic of KoreaHojun Lee and Kiwan Kim
10 Improving the Performance of Public–Private Partnerships in 233 Infrastructure Services in Asia through Better RegulationXun Wu
11 Public–Private Partnership Development in Southeast Asia 255Fauziah Zen
12 Public–Private Partnership Systems in the Republic of Korea, 287 the Philippines, and Indonesia: A Comparative ReviewKang-Soo Kim, Min-Woong Jung, Mee-Soo Park, Yoo-Eun Koh, and Jin-Oh Kim
AppendixesA2.1 Variables, Definitions, and Data Sources for the Analysis 35A2.2 PPPs and Sectoral Employment in Developing Asia 38A2.3 PPP Investment Ratios to Total Infrastructure Investment 40
in 17 Asian Countries, 2011A3.1 Descriptive Statistics 68A4.1 Factors Influencing Project Finance in Mature Markets 98A4.1.1 Sources and Description of Variables 98A4.1.2 Project-Level Descriptive Statistics for Mature Markets 100A4.1.3 Drivers of Project Finance Deals in Mature Markets 101A5.1 Probit Regression on the Loan Syndication Dummy Variable 131A6.1 Definition of Variables 160A6.2 Correlation Matrix for Explanatory Variables 162A7.1 Regression Framework 185A12.1 PPP Systems in the Republic of Korea, the Philippines, 312
and Indonesia
Contributors 323
Index 325

v
Tables, Figures, and Box
Tables2.1 PPPs and Economic Growth in Developing Asia 282.2 PPPs and Infrastructure Access and Quality in Developing Asia 302.3 Effect of Increasing PPP Investments in Developing Asia 323.1 Parametric Hazard Regression for Developing Asia 613.2 Parametric Hazard Regression between Developing Asia 64
and Other Developing Regions4.1 Project Finance Deals by Country 844.2 Project Finance Deals by Sector 844.3 Project Finance Deals by Ranking 854.4 Project-Level Descriptive Statistics for Developing Asian 86
Markets4.5 Drivers of Project Finance Deals in Asian Markets 895.1 Summary Statistics of Key Variables 1215.2 Baseline Regressions on Debt Concentration 1245.3 Baseline Regressions without Loan-Specific Characteristics 1275.4 Probit Regression on the Likelihood of Loan Syndication 1286.1 Determinants of Private Participation in Infrastructure 141
Investments from a Literature Review6.2 Descriptive Statistics 1466.3 PPP Determinants—Panel Regression with Fixed Effect 1526.4 PPP Determinants—Difference Generalized Method of 154
Moments Regression6.5 PPP Determinants—Panel Fixed Effect Regression 1566.6 PPP Determinants—System Generalized Method of Moments 158 Regression7.1 ADB Survey Results on Infrastructure Investor Risk Perceptions 168
in Asia7.2 Regression Analysis on Country and Sovereign Risks Ratings 171
to Number of Financially Close Infrastructure PPPs7.3 World Bank and Asian Development Bank Guarantee Options 175
for Government Payment Obligations8.1 Korea Development Institute 2014 Survey on Build–Transfer– 194
Operate Projects8.2 Comparison Result on Characteristics of Build–Transfer–Lease 195
Projects8.3 Effect on Growth from Build–Transfer–Operate Projects 196
in the Republic of Korea

vi
8.4 Effect on Growth from Build–Transfer–Lease Projects 196 in the Republic of Korea
8.5 Net Benefits from PPPs in the Republic of Korea, 2012 1978.6 Value–for–Money Results for PPP Projects in the Republic 198
of Korea, 2005–20128.7 Value for Money by Sector in the Republic of Korea 1988.8 Estimated Value for Money for PPPs in the Republic of Korea 1998.9 Infrastructure Bond Issuance in the Republic of Korea, 2009 2008.10 Bond Issuance for PPP Projects in the Republic of Korea, 200
2012–20178.11 Unsolicited Proposals for PPP Projects in Four Emerging 203
Economies8.12 Acceptance Ratio for Unsolicited PPPs in the Republic of Korea, 204
2009–2016 8.13 Average Dispute Resolution Periods for PPPs in the 206
Republic of Korea, 20148.14 Dispute Resolution Processes 2079.1 Composition of Investors in Build–Transfer–Operate 224
PPP Projects in the Republic of Korea9.2 Results of Regression Models 22910.1 Selected PPP Regulations in the People’s Republic of China, 238
2013–201510.2 Water and Sanitation PPPs in the People’s Republic of China, 244
1994–201711.1 PPP and Public Spending on Infrastructure in Southeast Asia, 259
2005–201511.2 Size and Composition of Local Currency Bond Markets 264
in Select Countries11.3 Indonesia’s Priorities and Financing Needs, 2015–2019 26611.4 PPP Implementation Stages Based on Policy Maturity 27011.5 Global Competitiveness Index 2017–2018 Rankings 272
for Southeast Asia12.1 Approval Procedures for PPPs in the Philippines 29312.2 Government Organizations Promoting PPP Systems 297
in the Republic of Korea12.3 Government Organizations Promoting PPP Systems 298
in the Philippines12.4 Government Organizations Promoting PPP Systems 299
in Indonesia12.5 Exemption from Charges and Taxes for PPP Projects 303
in the Republic of Korea
Tables, Figures, and Box

Tables, Figures, and Box vii
Figures1.1 Infrastructure Ranking of Developing Asian Economies, 1
2017–20182.1 Infrastructure PPP Projects in Developing Regions, 1985–2015 162.2 Infrastructure PPP Projects in Developing Asia, 1985–2015 172.3 Infrastructure PPP Projects by Sector in Developing Asia, 17
1985–20152.4 PPP–Economic Growth–Poverty Nexus 212.5 Real Per Capita Gross Domestic Product Growth Before 25
and After a PPP Investment Boom2.6 Average Real Per Capita Gross Domestic Product Growth 26
and Capabilities to Manage PPPs2.7 PPP Readiness Scores in Asia and the Pacific, 2014 273.1 Cancelled PPP Projects by Region, 1991–2015 483.2 Cancelled PPP Projects by Sector and Project Type 49
by Investment, 1991– 20153.3 Mean Duration of PPP Project Cancellations 503.4 Factors Affecting PPP Project Outcomes 513.5 Kaplan-Meier Curve Estimates for PPP Projects 59
in Developing Asia and Other Developing Regions3.6 Kaplan-Meier Curve Estimates for Developing Asia PPPs 60
by Project-Based Factors6.1 PPP Infrastructure Investment in 12 Emerging Economies, 144
1995–20156.2. Average Annual PPP Infrastructure Investment 145
by 12 Emerging Economies, 1995–20157.1 Risk Profile of ADB’s 39 Borrowing Member Countries 1697.2 Modalities for Allocating Demand Risk in PPP Projects 1727.3 Sovereign Partial Risk Guarantee Using a Letter of Credit 176
for a PPP7.4 Partial Risk Guarantee Structure for Thika Power 1777.5 Government Annuity Payments with and without Multilateral 181
Development Bank Sovereign Partial Risk Guarantees7.6 Estimated Financial Benefits of a Sovereign Partial Risk 181
Guarantee7.7 Estimated Financial Benefits of a Nonsovereign Partial Risk 182
Guarantee8.1 The Economic Contribution of PPPs 1938.2 Major Governance Issues for PPPs 2058.3 Performance of PPP Dispute Mediation in the Republic of Korea 2089.1 Basic Structure of a PPP in the Republic of Korea 2169.2 Structure of a PPP in the Republic of Korea 22310.1 Changes in Regulatory Functions from Traditional Procurement 237
to PPPs

viii
10.2 Key Components for Designing a Regulatory System for PPPs 241 in Infrastructure Services
11.1 Infrastructure and Institutions Scores in Asia and the Pacific, 257 2017–2018
11.2 The Infrastructure Industry Ecosystem 26311.3 Infrastructure Stock in Indonesia, 1995–2015 26511.4 Basic Infrastructures for Empowering People 27711.5 Umbulan Water Supply Project Transaction Scheme 28112.1 PPP Procurement Options for Solicited Proposals 294
in the Philippines 12.2 PPP Procurement Process for Solicited Proposals in Indonesia 29512.3 Mechanism of a Build–Operate–Transfer Risk-Sharing Scheme 300
in the Republic of Korea12.4 Mechanism of a Build–Operate–Transfer Adjusted Scheme 301
in the Republic of Korea12.5 The Philippines’ Project Development and Monitoring Fund 306
Box8.1 Accounting Standards for Public–Private Partnerships 202
Tables, Figures, and Box

ix
Foreword
The rapid growth in developing Asia’s infrastructure has helped power the region’s fast growth. Despite their impressive performance, many developing countries have glaring infrastructure deficits in electricity, transport, and water and sanitation. It is estimated that annual investments of $1.7 trillion, including for climate mitigation and adaptation, will be needed across developing Asia in 2016–2030 to maintain the region’s growth momentum, eradicate poverty—the region’s main unfinished development agenda—and take effective action against climate change. Indeed, infrastructure will be a key element in attaining the Sustainable Development Goals, and its expansion will be vital for tackling Asia’s rapid urbanization and strengthening value chains.
Governments recognize the need to expand and modernize their infrastructure. But tight fiscal conditions are preventing them from developing infrastructure at anything like the level needed, and especially in economies that are lagging behind. With most of developing Asia’s countries grappling with fiscal deficits, policymakers are increasingly looking to partnerships with the private sector to help close infrastructure gaps. Of course, the private sector was instrumental to Asia’s economic success. Sustaining that performance, however, will depend on the private sector taking on a much bigger role than it has been playing so far in building and upgrading the region’s infrastructure. But what is that role exactly? The objective of private sector participation in infrastructure should go beyond attracting investments to help close the infrastructure gap. The primary goal should be to deploy all the resources and expertise of the private sector in the provision of physical infrastructure and infrastructure services, especially its incentivized finance, operational efficiency, and innovation capacity.
Public–private partnerships (PPPs) have been an effective conduit to channel private capital and funds to address a broader development agenda. This book, the result of a productive collaboration among the Asian Development Bank, the Korea Development Institute, and other experts, presents the potential economic benefits from PPPs and the factors behind successful partnerships in infrastructure. It draws on the experiences of several Asian countries for lessons on what to do—and what not to do—for the effective and efficient implementation of PPPs. Good governance is a common thread that runs through the successful implementation of PPPs. The findings of this book will surely encourage countries to reexamine their regulatory and policy arrangements for PPPs and, where needed, to strengthen governance and public sector capacity for these partnerships.

x Foreword
This book is aimed at policymakers and their development partners striving to expand national and regional infrastructure, officials working on PPPs at all levels of governments, the business communities, and researchers. Governments, private partners, commercial banks, and international financial institutions such as the Asian Development Bank should collaborate to make the most and best use of PPPs to foster inclusive and sustainable development in developing Asia. We hope that this book will facilitate future collaborations to make PPPs better governed, more effective, and more sustainable.
Yasuyuki Sawada Chief Economist and Director GeneralEconomic Research and Regional Cooperation DepartmentAsian Development Bank
Kiwan KimExecutive Director Public and Private Infrastructure Investment Management CenterKorea Development Institute

xi
Acknowledgments
This book is an outcome of the collaboration between the Economic Research and Regional Cooperation Department (ERCD) of the Asian Development Bank (ADB) and the Korea Development Institute (KDI) under ADB’s regional technical assistance research project—Asian Development Outlook (ADO) 2016–2018. The project supports the production of the ADO, one of ADB’s flagship knowledge products. This book was born out of the theme chapter—Sustaining Development through Public–Private Partnership—of the Asian Development Outlook 2017 Update. The chapter, coauthored by members of ADB and KDI and Akash Deep, senior lecturer in public policy at the Harvard Kennedy School, examined the state of public–private partnerships (PPP) in developing Asia, and how these partnerships can contribute to economic growth and poverty reduction. It also discussed how PPPs can be used to meet developing Asia’s infrastructure needs and contribute to sustainable development. This book contains the background papers that were used in the preparation of the theme chapter. All the papers have been updated and expanded for this book.
ADB Vice-President for Knowledge Management and Sustainable Development Bambang Susantono, ERCD Chief Economist Yasuyuki Sawada, ERCD Deputy Chief Economist Joseph E. Zveglich Jr., and ADB’s Office of Public–Private Partnership provided invaluable comments on the papers, helpful guidance, and unfailing support throughout the project. This book would not have been possible without the valuable research of its contributing authors. We are also grateful for the comments and suggestions from the discussants and participants at the Joint KDI-ADB Workshop: Asian Development Outlook 2017 Update Theme on Public–Private Partnerships sponsored by ADB on 8 June 2017 in Manila.
Several others deserve special mention for their great help and support. Alastair McIndoe edited the manuscript. Edith Creus did the layout and graphic design. Rhia Theresa Bautista-Piamonte and Elenita Pura provided logistics support. The study would not have been possible without the generous assistance of the Knowledge Support Division of ADB’s Department of Communications and the Printing Services Unit of the Office of Administrative Services.
Akash Deep, Cambridge MAJungwook Kim, SejongMinsoo Lee, Beijing

xii
Abbreviations
ADB - Asian Development Bank
ASEAN - Association of Southeast Asian Nations
BOO - build–own–operate
BOT - build–operate–transfer
BTL - build–transfer–lease
BTO - build–transfer–operate
DMC - developing member country
GDP - gross domestic product
GMM - generalized method of moments
IDA - International Development Association
Lao PDR - Lao People’s Democratic Republic
MIGA - Multilateral Investment Guarantee Agency
MDB - multilateral development bank
MWSS - Metropolitan Waterworks and Sewerage System
NEDA - National Economic and Development Authority
OECD - Organisation for Economic Co-operation and Development
PDMF - Project Development and Monitoring Fund
PIMAC - Public and Private Infrastructure Investment Management Center
PPP - public–private partnership
RFP - request for proposal
SOE - state-owned enterprise
SPV - special purpose vehicle
WEF - World Economic Forum
CHAPTER 1
Overview
Developing Asia’s remarkable economic performance since the 1980s comes in no small measure from its great strides in building infrastructure. Even so, the region still faces significant difficulties in delivering infrastructure services caused by the huge gap in infrastructure investment that translates into many unmet needs. Access to physical infrastructure and associated services remains inadequate, particularly in poorer areas. Over 400 million Asians live without electricity, 300 million without safe drinking water, and 1.5 billion without basic sanitation. And even those using these services often find the quality is inferior in both rural and urban areas. Notable problems are intermittent electricity, congested roads and ports, substandard water supply and sewerage, and poor-quality school and health facilities. The World Economic Forum’s Global Competitiveness Report 2017–2018 shows that many economies in developing Asia are in the bottom half of the ranking on infrastructure (WEF 2017) (Figure 1.1).
Figure 1.1: Infrastructure Ranking of Developing Asian Economies, 2017–2018
119111110109108
106102
9997
8985
8079
6968
6660
5251
4643
2215
821
0 50 100 150Nepal
BangladeshPakistan
Kyrgyz RepublicMongolia
CambodiaLao PDR
TajikistanPhilippines
BhutanSri LankaArmenia
Viet NamGeorgia
KazakhstanIndia
Brunei DarussalamIndonesia
AzerbaijanChina, People’s Republic of
ThailandMalaysia
Taipei,ChinaKorea, Republic of
SingaporeHong Kong, China
Lao PDR = Lao People’s Democratic Republic.Source: World Economic Forum. 2017. Global Competitiveness Report 2017–2018. Geneva.

Realizing the Potential of PPPs to Advance Asia’s Infrastructure Development2
The infrastructure gap is the result of both a lack of financial resources and innovative and efficient channels to mobilize resources for desired development outcomes. While the need to build up infrastructure is widely recognized in the region, tight fiscal conditions and limited public sector capacity prevent most countries in developing Asia from making significant headway in narrowing their infrastructure gaps. A long sought-after solution has been to get the private sector to help fill the infrastructure gap. The private sector clearly has a lot to offer in many areas of infrastructure delivery, including improving operational efficiency, granting incentivized finance, promoting project innovation, and technical and managerial skills. An effective way for the private sector to maximize its comparative advantages is to redraw its relationship with the public sector to share roles and responsibilities in providing public goods and services more efficiently. To this end, the Public–Private Partnership (PPP) approach could transform how both sectors collaborate to deliver infrastructure services. The World Bank defines PPPs as “a long-term contract between a private party and a government entity, for providing a public asset or service, in which the private party bears significant risk and management responsibility, and remuneration is linked to performance” (World Bank 2017a). The Asian Development Bank (ADB) and the Inter-American Development Bank define PPPs similarly.
This book evaluates the major challenges that Asia must overcome to get more PPPs off the ground and to use these partnerships far more effectively than is currently the case. It examines optimal ways of sharing risk in these partnerships, proposes financial instruments that can promote private financing for PPPs, and suggests roles that multilateral development banks (MDBs) can play in mobilizing finance for PPPs. All these measures are powerful catalysts for bridging the risk gap that is holding back Asia’s infrastructure development. The book presents country evidence and experiences from across the region to draw lessons and suggest ways for PPPs to unlock their potential for helping secure sustainable development. The Republic of Korea’s considerable experience in implementing these partnerships holds many useful lessons—successes and shortcomings alike—for countries in developing Asia trying to increase private participation in infrastructure.
Using PPPs for Building Infrastructure The fundamental idea behind a PPP is not new. Private firms have been involved in delivering public services for decades in a variety of configurations. Since the 1980s, however, different PPP modalities have acquired distinct characteristics as experience has been gained in delivering a broader range of public goods and services, and partnering across multiple project stages,
Overview 3
such as building, financing, and operation and maintenance. PPPs are being increasingly used in Asia, but the level is still quite low compared with developed countries. While the risk-sharing characteristic of PPPs makes this modality more attractive than traditional procurement, the complexity of PPPs is an obstacle to these partnerships.
The Impetus for Participating in a PPP
Building and upgrading infrastructure is widely acknowledged to bolster and sustain economic activity. Infrastructure helps emerging economies avoid unnecessary bottlenecks. And economies at all levels of development need infrastructure to improve connectivity, and to be able to advance agendas for economic development. The increased use of PPPs as a procurement method by countries and across sectors is being driven by expectations that these partnerships will deliver better-quality and more affordable infrastructure services.
PPPs can be particularly effective in reducing poverty by using them to develop social infrastructure that provides welfare services, such as basic health care, clean water, primary and secondary education, and housing. But, so far, this has not been done on a large scale in Asia. Data from IJGlobal show that, from 2000 to 2016, Asia accounted for only 5% of all PPP projects in education, health care, housing, and other social sectors, compared with 90% in Organisation for Economic Co-operation and Development countries.
The benefits of infrastructure PPPs are the functional features of these partnerships; that is, a life-cycle perspective on the provision and pricing of infrastructure, a focus on service delivery, and sharing risks between the public and private sectors. Well-structured PPPs manage risks by allocating them across both sectors in a way that optimizes their cost and aligns incentives for performance. In PPPs, design, construction, and operational risks are typically passed on to the private partner. The private partner calibrates the design of, say, a road or new airport that responds to life-cycle costs and to meet performance obligations set out in the contract. Private partners innovate when risk-sharing provides incentives to avoid failure, and deliver timely and cost-effective physical infrastructure and infrastructure services.
Successfully carrying out PPP projects requires good governance and, if needs be, governments redesigning their regulatory and policy institutions. The institutional improvements required to implement PPP projects can also help establish a more robust investment environment for other private sector activities.

Realizing the Potential of PPPs to Advance Asia’s Infrastructure Development4
Asia’s Changing PPP Landscape
PPPs in developing Asia have evolved considerably in recent years. Governments are no longer the sole provider of essential public assets and services. And, although investments in infrastructure are still dominated by the public sector, the private sector is playing a larger and increasingly important role in developing, building, and improving public goods and services.
The World Bank’s Private Participation in Infrastructure Database—a widely used resource in this book—has logged over 6,400 infrastructure PPP projects that have at least 20% private ownership and reached financial closure in 139 low- and middle-income countries. The database is a valuable resource for gauging PPP trends, particularly in energy, telecommunication, transport, and water and sewerage. The database shows that the number of PPP projects that reached financial closure in developing Asia between 1991 and 2015 rose by a compounded annual growth rate of 11% (ADB 2017a).1 In aggregate, the number of PPPs in developing Asia account for half of all PPPs in developing countries. But the distribution of PPPs is uneven across countries and sectors. More than 70% are in East Asia and South Asia, and 90% of that share is in India and the People’s Republic of China. Even so, PPPs are gaining ground in Southeast Asia, particularly in the larger economies of Indonesia, Malaysia, the Philippines, Thailand, and Viet Nam. Central Asia and the Pacific together account for only 2% of the region’s PPPs.
The Economist Intelligence Unit’s 2014 Infrascope analyzed the readiness of countries in Asia and the Pacific to deliver sustainable PPPs (EIU 2015). It reported significant improvements in developing Asia in how governments handle PPP projects, based on its evaluation of regulatory and institutional frameworks, the investment climate, and the availability of finance. Of the 19 countries surveyed, India, Japan, the Philippines, and the Republic of Korea were considered to have “developed” PPP markets: 10 countries were classified as having “emerging” PPP markets in terms of their capacity to select, design, deliver, manage, and finance domestically PPP projects. The PPP market in the People’s Republic of China was the most mature of the economies in the emerging group. Infrascope classified three countries—Georgia, the Kyrgyz Republic, and Tajikistan—as having “nascent” PPP markets, where the institutional and technical capacity required to deliver complex PPP projects was not in place.

Overview 5
Obstacles to Attracting Private Investments in Infrastructure
PPP investment in five major Southeast Asia economies—Indonesia, Malaysia, the Philippines, Thailand, and Viet Nam—has been less than 1% of their annual gross domestic product (GDP) since the first decade of the 2000s. Project cancellations remain a big disincentive, not least because of high sunk costs. From 1991 to 2015, PPP projects with $41.6 billion in initial committed investment were canceled, affecting 6.3% of all committed PPP investment in developing Asia.
The World Bank (2017b) assessed the performance of 82 economies in four thematic areas of PPP processes: preparation, procurement, contract management, and unsolicited proposals. Although the World Bank found that Asia and the Pacific was close to the global average score in its rankings for these areas, its report showed that only 13% of countries in the region have detailed procedures to ensure the alignment of PPPs with public investment priorities.
Weak governance in many developing Asian countries can make PPPs less attractive, and may discourage private sector investment in infrastructure PPPs. Countries in developing Asia get low rankings in the World Economic Forum’s Global Competitiveness Report 2017–2018 on the quality of their legal and institutional environment. Hindering the whole PPP process are legal gaps that affect these partnerships, PPP policies lacking cohesion, redundant contract processes, and laws and regulations that change unpredictably. According to businesses in the region, the most pressing problems affecting investor confidence are lapses in law and order, government inefficiency, corruption, and political instability. Many governments do not have the institutions and capacity to handle PPP projects, and only half of developing Asian countries have dedicated PPP units. These have numerous and varied roles, including coordination, quality control, and accountability to procurement processes, and they provide transparency in PPP negotiations.
The political vulnerability of PPP projects in the region is also a long-standing concern for infrastructure investors, with these projects less likely to be implemented in countries where sovereign risks are high. In developing Asia, 59% of countries are unrated and, therefore, considered risky by international lenders. Twenty-six percent are rated below investment grade, and only 15% lie at or above investment grade.

Realizing the Potential of PPPs to Advance Asia’s Infrastructure Development6
Mobilizing More Financing for Infrastructure For developing Asia to maintain its growth momentum and eradicate poverty, the region needs to spend an estimated $22.6 trillion—$1.5 trillion annually (in 2015 prices) from 2016 to 2030—in transport, power, telecommunication, and urban water and sanitation. Factoring in climate mitigation and adaptation costs raises the investment requirement to $26.2 trillion—$1.7 trillion annually—or 5.9% of developing Asia’s projected GDP in 2030 (ADB 2017b). The region invested $881 billion in infrastructure in 2015 (for 25 ADB developing member countries with sufficient data, comprising 96% of the region’s population). This is well below the estimated $1.2 trillion (baseline) or $1.3 trillion (climate adjusted) annual investment needed during 2016–2020 for these countries to maintain their growth momentum and eradicate poverty.
Just over 90% of funding for infrastructure development in the region comes from public spending. ADB estimates that raising more public funds through improving tax administration or reorienting other budget expenditures could raise additional resources for infrastructure equivalent to 2% of GDP for 24 of its 25 developing member countries (that is, excluding the People’s Republic of China). This would bridge 40% of the estimated investment gap during 2016–2020. For the private sector to fill the remaining 60%, it would have to increase investments to $250 billion a year over this period from an estimated $63 billion in 2015. Attracting investments at this level will require highly bankable projects that are perceived to present low or moderate risk to investors.
Indeed, mitigating the sizable risks associated with infrastructure investments in the region could go a long way toward attracting private capital to help fill the infrastructure gap. A PPP project allocates risks to the partners that can best manage them, thereby enabling the public sector partner to mobilize financing from private sources for public infrastructure. Mobilizing these financial resources, however, will require a coordinated effort by governments and private investors, which is the main challenge that policymakers face in attracting private capital to long-term infrastructure projects.
Project Finance and Optimal Risk-Sharing
The rise of project finance for long-term infrastructure PPP projects proves that financing structures are important to project success. Project finance involves creating a distinct legal and economic entity to act as the counterparty to various contracts involved in a PPP and to get the financial resources required to develop and manage a project. Setting up a special purpose vehicle

Overview 7
is the necessary first step for the private sector to deliver infrastructure through a PPP.
Project finance is vital for improving investment management and governance, but it needs to be structured in a way that allocates risk to the parties that are best able to manage them. A solid corporate governance structure for project finance can improve the management of risk in infrastructure projects. Because of the many risks present in large PPP transactions, project finance is structured to match risks and their corresponding returns to the parties best able to manage them. Facilitating the equitable and rational distribution of risk creates an environment in which investors can work together easily. Project finance also allows the leveraging of long-term debt, which is necessary to finance high-capital expenses. The use of project finance as a financing tool may also help mitigate information asymmetry problems that are typically present in large infrastructure PPP projects.
Sources of Project Finance
In all financing structures, equity financiers own the asset, exercise control over decisions on the asset, and receive any profits that it generates. The proportion of debt to equity is ultimately determined by a project’s contractual and capital structures, and how various risks are mitigated.
Debt finance constitutes the largest component of financing for PPP projects. Among debt providers, commercial banks are the largest source of debt finance for infrastructure projects, both in Asia and globally, because of several clear advantages that they have. Banks play an important monitoring role in lending, and bank lending has the flexibility to meet the particular need of infrastructure projects for funds to be gradually disbursed over the long term. Banks can provide debt restructuring when needed, and do so earlier and with greater pricing certainty through the structured tender process of a well-designed PPP. But their ability to provide debt financing for developing Asia’s infrastructure needs is limited, partly because bank capital requirements under Basel III have tightened requirements for project finance lending by banks. The underdeveloped capital markets of Asia’s emerging economies are also making it harder for PPP projects to tap debt finance (BIS 2016).
Project bonds are another source of debt financing for PPP projects. Bond financing is normally more attractive than bank financing because bond investors can lend at fixed rates and for longer maturities. Bond financing can also be drawn from investors with natural long-term liabilities, compared with the relatively short-term funding sources of banks. Clearly, bonds have several advantages over bank lending for providing the sort of financing that is well

Realizing the Potential of PPPs to Advance Asia’s Infrastructure Development8
suited to long-term PPP contracts, but they are not widely used in developing Asia. The rarity of project bonds reflects an aversion in corporate bond markets to diversity in credit quality, and, as earlier noted, the credit ratings of developing countries in Asia are at the lower end of investment grade or below. Credit enhancement therefore has a vital role to play if project bond financing is to become more widely used in the region.
The Role of Multilateral Development Banks in Infrastructure Financing
MDBs working in developing Asia contributed about 2.5% of the region’s infrastructure financing in 2015 (ADB 2017b). These banks can play a vital role as catalysts to attract private sector investment into infrastructure assets, and bring the expertise and creativity to these projects that is often lacking in the public sector. An effective MDB effort to promote PPPs has been the provision of transaction advisory services; this is early-stage capacity building to improve the regulatory and institutional environment, and to support project preparation. The participation of MDBs in PPPs can lower project risks through policy dialogue to influence negotiations and help resolve disputes between governments and their private sector partners (Jandhyala 2016). Although MDBs have an important role to play in promoting PPPs, their involvement so far in projects in low- and middle-income countries has been minimal, particularly in developing Asia.
The mitigation of sovereign risk—an area where MDBs can make a difference—can strengthen the weak credit profiles that are holding back private investments in PPPs in developing Asia. Analysis of the various sources of private capital indicates that the region’s infrastructure financing gap is more of a risk gap than a gap in available funds. MDBs can reduce the adverse impacts of these risks through credit enhancement products that seek to improve the risk rating of projects. MDBs can support the PPP process by advising on transactions and providing technical assistance. With accelerated global action on climate change, MDBs could also expand their risk-mitigation products to tackle climate risks and promote private investments in climate-resilient infrastructure.
Lessons for Better-Performing PPPs Public institutions must monitor PPPs carefully to ensure that performance targets are met and that risks are allocated to the party best suited to manage them. Having a dedicated PPP unit plays an important role in a country’s PPP program and can promote better-performing projects. Setting up a dedicated PPP unit can significantly contribute to increased private participation and

Overview 9
project success. PPP activity increased significantly in the Republic of Korea after it set up its PPP unit, the Public and Private Infrastructure Investment Management Center, in 1998. And the Philippines’ readiness to handle PPP projects improved noticeably after the Public–Private Partnership Center was reorganized and strengthened.
The success of the PPP approach is predicated on a list of prerequisites. A systematic evaluation of a project’s feasibility is necessary to determine whether features required for PPPs are present or can be produced with reasonable effort. Skilled private players and incentivized private finance are the driving forces in realizing efficiency gains. Governments need to ensure that the technical, legal, and institutional requirements needed by a successful PPP program are in place. It is the complementary abilities of the public and private sector, realized through a partnership in risk and control, that lies at the heart of fruitful PPPs.
Structure of the BookThis book has three parts. The first discusses how economic benefits can be derived from using PPPs to develop, build, and upgrade public infrastructure, but how these partnerships come with considerable risks and challenges. The second part examines the financing mechanisms that can be used to attract so far hard-to-budge private investment in public infrastructure. The third part examines procurement modalities for PPPs in the Republic of Korea, and how better regulation can improve the performance of PPPs in developing Asia. It also looks at the development of infrastructure in Southeast Asia using PPPs, and has a three-country comparative analysis on PPP systems.
Part I has two chapters. In Chapter 2, The Empirical Evidence and Channels for Effective Public–Private Partnerships, Minsoo Lee, Raymond Gaspar, Emmanuel Alano, and Xuehui Han examine the potential macroeconomic benefits from building infrastructure using PPPs. The authors present a framework for identifying the channels through which these partnerships can deliver macroeconomic benefits, particularly in helping reduce poverty by improving the access of the poor to infrastructure. In Chapter 3, Assessing Risk in Public–Private Partnerships, Minsoo Lee, Pilipinas F. Quising, Mai Lin Villaruel, and Xuehui Han estimate the hazard rates of PPPs in developing Asia by analyzing the project-related factors of government support, institutional factors, and macroeconomic conditions.
Part II has four chapters. In Chapter 4, Factors Influencing Bank Project Financing of Infrastructure Public–Private Partnership Projects in Developing Asia, Vivek Rao looks at ways to increase private financing for infrastructure in

Realizing the Potential of PPPs to Advance Asia’s Infrastructure Development10
an analysis of the role of bank lending to PPP projects through project finance. Unlocking this finance will require reducing macroeconomic risks and having well-capitalized banks. In Chapter 5, Syndicated Loans in Project Finance: Empirical Evidence from Asian Public–Private Partnership Markets, Michael Timbang and Vivek Rao assess the potential for bank loan syndication to finance infrastructure PPPs. They examine the channels by which the degree of bank debt concentration and the likelihood of syndicated lending are driven by different factors, but particularly the governance functions played by banks on loan syndicate transactions.
In Chapter 6, Determinants of Public–Private Partnerships in Infrastructure in Emerging Economies, Suk Hyun, Donghyun Park, and Shu Tian examine the role that greater access to finance, especially bonds, can play in promoting infrastructure PPPs. The authors identify the main obstacles to attracting more private capital, and discuss the economic and financial market conditions needed to attract more of these investments. In Chapter 7, Risk Mitigation and Sovereign Guarantees for Public–Private Partnerships in Developing Economies, Alexander Jett analyzes country and sovereign risks in infrastructure PPP financing, and the complementary roles of governments and MDBs in mitigating these risks. Case studies and a shadow bid financial model for a sample project are used to show the potential financial benefits from risk-mitigation mechanisms.
Part III has five chapters. In Chapter 8, Delivering Economic Benefits from Public–Private Partnerships: The Experience of the Republic of Korea, Jungwook Kim and Suhyeon Wi draws lessons from the Republic of Korea’s considerable experience in PPPs, with over 600 projects carried out since 1998, for other countries in developing Asia trying to increase private participation in infrastructure using these partnerships. In Chapter 9, Public–Private Partnerships versus Traditional Procurement: A Comparison of Financing Modalities in the Republic of Korea, Hojun Lee and Kiwan Kim, compare the bundling effects of traditional procurement and PPPs, since these partnerships are not always more efficient than traditional procurements.
In Chapter 10, Improving the Performance of Public–Private Partnerships in Infrastructure Services in Asia through Better Regulation, Xun Wu examines the role of regulation in improving the performance of PPPs for infrastructure services in light of regulatory developments since the start of the 2000s. The author draws on lessons from water sector PPPs using case studies from the People’s Republic of China and the Philippines to show how a strong strong regulatory environment can improve the performance of PPPs in infrastructure services. In Chapter 11, Public–Private Partnership Development in Southeast Asia, Fauziah Zen looks at infrastructure development in the five Southeast Asian countries that are most actively promoting PPPs—Indonesia, Malaysia,

Overview 11
the Philippines, Thailand, and Viet Nam. The author examines the factors that influence the performance of PPPs in the region, and the use of these partnerships in social infrastructure and pro-poor development planning. In Chapter 12, Public–Private Partnership Systems in the Republic of Korea, the Philippines, and Indonesia: A Comparative Review, Kang-Soo Kim, Min-Woong Jung, Mee-Soo Park, Yoo-Eun Koh, and Jin-Oh Kim analyze and compare PPP systems in these countries to identify best practices for making this financing modality an effective catalyst for infrastructure development.
Note 1. Developing Asian countries included in the World Bank’s Private Participation in
Infrastructure Database are Armenia, Azerbaijan, Bangladesh, Bhutan, Cambodia, Fiji, Georgia, India, Indonesia, Kazakhstan, Kiribati, the Kyrgyz Republic, the Lao People’s Democratic Republic, Malaysia, Maldives, Mongolia, Myanmar, Nepal, Pakistan, Papua New Guinea, the People’s Republic of China, the Philippines, Sri Lanka, Tajikistan, Thailand, Timor-Leste, Tonga, Uzbekistan, Vanuatu, and Viet Nam.

Realizing the Potential of PPPs to Advance Asia’s Infrastructure Development12
References
ADB (Asian Development Bank). 2017a. Asian Development Outlook 2017 Update. Manila.
———. 2017b. Meeting Asia’s Infrastructure Needs. Manila.
BIS (Bank for International Settlements). 2016. A Spare Tire for Capital Markets: Fostering Corporate Bond Markets in Asia. BIS Papers 85. Basel.
EIU (Economist Intelligence Unit). 2015. Evaluating the Environment for Public–Private Partnerships in Asia-Pacific: The 2014 Infrascope. London.
Jandhyala, Srividya. 2016. International Organizations and Political Risk: The Case of Multilateral Development Banks in Infrastructure Projects.https://ppi.worldbank.org/~/media/GIAWB/PPI/Documents/Misc/The-case-of-multilateral-development-banks-by-Jandhyala2016.pdf.
World Bank. 2017a. Public–Private Partnerships: Reference Guide, Version 3.0. Washington, DC. https://openknowledge.worldbank.org/handle/10986/ 20118.
———. 2017b. Benchmarking PPP Procurement 2017. Washington, DC.
WEF (World Economic Forum). 2017. Global Competitiveness Report 2017–2018. Geneva.

PART I
The Benefits and Risks of Public–Private Partnerships


Minsoo Lee, Raymond Gaspar, Emmanuel Alano, and Xuehui Han
IntroductionAn abundance of theoretical and empirical evidence recognizes the vital role of infrastructure to stimulate and sustain economic growth. Developing Asia’s robust growth has certainly benefited from the strides made in building and upgrading infrastructure. But the region is nowhere close to straddling its huge infrastructure gap, which public resources alone cannot meet. The Asian Development Bank (ADB 2017) estimates that the region’s infrastructure investment gap—measured as the difference between investment needs and current investment—is equivalent to 2.4% of projected annual gross domestic product (GDP) from 2016 to 2020. The private sector, owning vast financial resources, could help close the gap through public–private partnerships (PPPs). Just one example of the private capital that could—if the conditions were right—make a major contribution to infrastructure investment is the estimated $100 trillion in global assets managed by pension funds, sovereign wealth funds, insurance companies, and other institutional investors (Arezki et al. 2016). But infrastructure projects need to be bankable to attract these investments.
The very effectiveness of PPPs for infrastructure development is based on structural and functional features that traditional procurement lacks. These include a life-cycle perspective on infrastructure, innovative financing, a focus on service delivery, and risk-sharing by public and private sector partners. The big question is whether and to what extent these features benefit the overall economy. This chapter looks at the policy implications of this for developing countries in Asia that badly need more infrastructure, but have limited resources and capacity to handle the complex processes of PPP projects.
Guided by the literature on PPPs, this chapter points out the four major channels through which these partnerships can boost economic growth. The first and obvious channel is improving access to infrastructure, particularly to a desired level of quality. The second channel highlights the benefits of building technical and institutional capacity, transparency, and good governance from
CHAPTER 2
The Empirical Evidence and Channels for Effective Public–Private Partnerships

Realizing the Potential of PPPs to Advance Asia’s Infrastructure Development16
partnerships with the private sector. The third channel emphasizes better allocation of public resources. The fourth channel is the potential of PPPs to attract private savings in long-term investments, such as pension and sovereign wealth funds. Using insights from these channels, this chapter examines the relationship between the gradual rise of using PPPs in developing Asia and macroeconomic performance. The chapter then discusses the empirical findings, and recommends policy actions to ensure that infrastructure PPPs deliver the expected benefits.
The Emergence of Infrastructure PPPs in AsiaThe participation of the private sector in infrastructure in Asia has its origins in the wave of privatizations in the 1980s and 1990s. Back then, rising evidence of inefficient public spending, poorly managed state-owned enterprises, and widespread fiscal and debt crises called for a new model of economic development led by the private sector and market liberalization. Henckel and McKibbin (2010) note that the private sector’s involvement in infrastructure, either exclusively or through PPPs, is motivated by inefficiencies in public projects, such as cost blowouts, planning and construction delays, safety problems, and a lack of innovation and technological advancement.
Figure 2.1 shows the gradual rise of PPP transactions in developing regions since the mid-1980s. The World Bank’s Private Participation in Infrastructure Database records 6,124 infrastructure PPP projects, totaling $1.7 trillion from 1985 to 2015 among 139 low- and middle-income countries. Infrastructure PPP projects in developing Asia climbed rapidly during the 1990s. From 1990 to 2015, the region closed more than 3,000 infrastructure PPP projects, totaling $652 billion in committed investment.
Figure 2.1: Infrastructure PPP Projects in Developing Regions, 1985–2015
0100200300400500600
1985 1990 1995 2000 2005 2010 2015
Num
ber o
f pro
ject
s
Developing AsiaEuropeLatin AmericaMiddle East and North AfricaSub-Saharan Africa
Source: World Bank, Private Participation in Infrastructure Database (accessed 20 March 2017).

The Empirical Evidence and Channels for Effective Public–Private Partnerships 17
Within developing Asia, building and upgrading infrastructure via PPPs considerably varies (Figure 2.2). The surge in financial closure of PPPs in 2011 and 2012 came mostly from East Asia and South Asia. PPPs in Central Asia and the Pacific were relatively few over this period, but those in Southeast Asia showed a rising trend, especially in Indonesia, Malaysia, Thailand, the Philippines, and Viet Nam. By country, India and the People’s Republic of China had the highest number of infrastructure PPPs, totaling a combined 2,145 projects in the period. These accounted for more than half of the region’s total number of infrastructure PPP projects
Figure 2.2: Infrastructure PPP Projects in Developing Asia, 1985–2015
050
100150200250300350
1985 1990 1995 2000 2005 2010 2015
Num
ber o
f pro
ject
s
Central AsiaEast AsiaPacificSouth AsiaSoutheast Asia
Source: World Bank, Private Participation in Infrastructure Database (accessed 20 March 2017).
Figure 2.3: Infrastructure PPP Projects by Sector in Developing Asia, 1985–2015
050
100150200250300350
1985 1990 1995 2000 2005 2010 2015
Num
ber o
f pro
ject
s
EnergyInformation and communication technologyTransportWater and sewerage
Source: World Bank, Private Participation in Infrastructure Database (accessed 20 March 2017).
Figure 2.3 breaks down developing Asia’s infrastructure PPPs by sector. Most projects were in energy and transport. Energy investments have declined since 2013, an indication of the sector’s growing maturity and lessening reliance on PPP support.

Realizing the Potential of PPPs to Advance Asia’s Infrastructure Development18
Infrastructure, Macroeconomy, and PovertyThe benefits from PPPs are generally expected to come from building the infrastructure and delivery of essential public services. Infrastructure is widely recognized as one of the critical factors that determine a country’s economic success. Endogenous growth models have been developed—for example, Barro (1990) and Futagami, Morita, and Shibata (1993)—to examine the impact of infrastructure on long-term production and income. Empirical studies also shed light on the positive association between infrastructure investment and economic growth. Aschauer’s (1989) work in this area prompted others to look in more detail at the infrastructure–growth relationship by using sophisticated empirical methods, and using various measures of infrastructure.
Canning and Pedroni (2008) find an optimal level of infrastructure that brings long-term growth. Calderón, Moral-Benito, and Servén (2015), using an infrastructure-augmented production function for output per worker to physical capital, human capital, and a synthetic measure of infrastructure, estimate a long-term output elasticity of infrastructure ranging from 0.07 to 0.10. Calderón and Servén (2010) also find robust evidence that an increase in infrastructure stock and better-quality infrastructure services have a positive impact on long-term growth and a negative impact on income inequality. Kodongo and Ojah (2016), in a study on Sub-Saharan countries covering 2000–2011, find that higher spending on and improved access to infrastructure significantly influences economic growth and development, with lower-income countries in the region benefiting the most.
Asia’s infrastructure–growth story is much the same as for other developing regions. Seethepalli, Bramati, and Veredas (2008) find a significant positive relationship between infrastructure and economic growth in East Asia. Straub and Terada-Hagiwara (2010) find that growing infrastructure stock has had a significant and positive impact on growth in countries in East Asia, South Asia, and the Pacific. Ismail and Mahyideen (2015) find that improvements in transport and information and communication technology infrastructure increased trade flows and economic growth in the Asian economies they studied.
By raising per capita GDP growth and lowering income inequality, infrastructure development—as empirical evidence shows—helps reduce poverty (Calderón and Servén 2004). Han and Wei (2017) find from their analysis of 1960–2010 data that infrastructure helps boost economic growth, especially for low-income countries. Setboonsarng (2010) argues that investments in transport infrastructure reduce poverty indirectly through economic growth. In Indonesia, Kwon (2005) finds that road investments improve poverty-alleviating variables, such as nonfarm employment, real

The Empirical Evidence and Channels for Effective Public–Private Partnerships 19
wages, and agricultural production, in provinces with higher-than-average road density.
Among studies analyzing the distributive impact of infrastructure development, Calderón and Chong (2004) and Calderón and Servén (2004) find that income inequality declines with more and better infrastructure. Calderón and Servén (2014) find positive effects of infrastructure development on income growth and, tentatively, on distributive equity. For urban areas in the People’s Republic of China, Mendoza (2017) observes that certain types of infrastructure, such as waste treatment, green spaces, and energy and water projects, are associated with reduced income inequality.
PPPs and the Macroeconomy
There are only a few empirical studies examining the macroeconomic impact of PPPs. With limited data, attribution or causality cannot be easily drawn out of macro analyses. Project-level analyses apply quasi-experimental approaches to estimate the effect of infrastructure PPP projects on welfare measures, including poverty reduction. But these evaluations do not have well-defined counterfactuals (Dintilhac, Ruiz-Nuñez, and Wei 2015).
Mixed views emerge from the few macro studies of PPPs that have been done. Using the World Bank’s Private Participation in Infrastructure Database, Trujillo et al. (2002) find that private sector participation in transport has a positive effect on income per capita. Using the same database, Rhee and Lee (2007) find a negative but not statistically significant coefficient on PPP investment, after controlling for fully publicly funded infrastructure. For the Republic of Korea, Kim et al. (2011) show that increased capital expenditure in infrastructure PPP investments expanded growth by as much as 0.2% in 2008.
Theoretical procurement models show the conditions that PPPs are desirable options for delivering infrastructure and related services over the traditional mode. PPPs make optimal use of the private sector’s skills, technology, and innovation that are needed throughout a project’s life, especially when fiscal resources are tight (Iossa and Martimort 2015; European PPP Expertise Centre 2015; de Bettignes and Ross 2004; Davies and Eustice 2005; and Henckel and McKibbin 2010). Infrastructure projects done through PPPs are more likely to reach the desired level of performance because contract agreements require private partners to deliver assets on time and within budget, manage project delivery, and maintain and refurbish assets (Davies and Eustice 2005).
Studies argue that PPPs guarantee value for money—broadly defined as the ability to improve the delivery of benefits relative to the associated costs across a range of alternatives. Bundling PPPs help reduce project life-cycle
Realizing the Potential of PPPs to Advance Asia’s Infrastructure Development20
costs (Davies and Eustice 2005; Henckel and McKibbin 2010; and Iossa and Martimort 2015). Bundling also incentivizes private partners to design and build infrastructure at lower overall long-term costs and hand back well-maintained assets to the government at the end of a contract. Iossa and Martimort (2015) further note that bundling different PPP infrastructure phases incentivizes operators to invest more in asset quality compared with traditional procurement.
Because of the many risks involved in infrastructure projects, PPP arrangements help analyze and allocate risks to the party best placed to handle them. Risk allocation strategies in PPP contracts incentivize all parties to fulfill their contract obligations, and PPPs are natural filters for eliminating infrastructure projects that could turn out to be white elephants (Engel 2016; Henckel and McKibbin 2010). Poorly designed PPP contracts can lead to considerable costs that are borne by taxpayers. All aspects of PPPs must be carefully considered to avoid this, and these partnerships must be backed by strong institutions. Indeed, it is worth strengthening institutions for PPPs because doing this will have a beneficial ripple effect on other private endeavors and the general economy.
Channels of PPP Impacts
As well as project contexts, certain macro variables are vital for successfully carrying out infrastructure PPP projects. Much of the recent literature on the determinants of PPP activities revolve around the role of institutions. Yehoue, Hammami, and Ruhashyankiko (2006) find that less corruption and effective rule of law are associated with more PPP projects. Schomaker (2014) finds that a high degree of institutional quality is associated with stronger private sector participation in providing public services. Another important channel is how infrastructure PPPs free up resources for public services in human capital development and social security.
Figure 2.4 shows the different channels through which PPPs, either as an infrastructure project or a public finance tool, can affect macroeconomic performance. PPP contracts that emphasize the quality of infrastructure, particularly delivering a project on time and maintaining it well, strengthen the infrastructure–growth link. The higher-level skills needed for complex PPP contracting could help strengthen institutions, which is deemed crucial for Asia’s economic development. And the technical and institutional capacities, and good governance required for PPPs can be deployed in other public services.

The Empirical Evidence and Channels for Effective Public–Private Partnerships 21
PPPs can co-opt the private sector into national development plans through bankable infrastructure projects, since these partnerships have a huge—but so far largely untapped—potential to attract long-term savings in the form of pension, insurance, and sovereign wealth funds for infrastructure projects offering higher returns for the risk. Matching long-term savings to PPP project will help optimize resource allocation, and contribute to economic growth (Arezki et al. 2016).
The underlying rationale for PPPs to build better-quality infrastructure is a necessary condition for spurring economic growth, and for eventually reaching the poor by expanding wage employment and livelihood opportunities. Low-income households should have access to infrastructure services, and be able to afford them as they generally spend more on basic goods and services. Wallich (2002) notes that, without both, the poor are often at the mercy of more expensive alternatives for safe water and electricity. The Pro-Poor Public–Private Partnership, a UNESCAP initiative, sets up community-based utilities using public and private investments. Among those that have been set up are renewable energy projects in underserved rural communities in Indonesia, the Lao People’s Democratic Republic, and Nepal that provide affordable electricity, as well as incomes and livelihoods (UNESCAP 2014).
Figure 2.4: PPP–Economic Growth–Poverty Nexus
POVERTY REDUCTION
Access to infrastructure
ECONOMICGROWTH
Investments
PPP
InfrastructureOn-time and
on-budget delivery
Better qualityE�ciency
InstitutionsLegal framework
Public sector capacity
Transparency and good
governance
PROJECT CONTEXT
Wage employment and livelihood opportunities
Availability and a�ordability of
goods and services
Access to education, health care, and social protection
Pro-poor PPPs reallocation of public resources
Freed up public resources to deliver equally important public services
PPP = public–private partnership.Source: Authors.

Realizing the Potential of PPPs to Advance Asia’s Infrastructure Development22
Data and Empirical ApproachTwo general approaches are frequently used to analyze the impact of infrastructure, of which PPPs are a subset. The first is the production function, with infrastructure as a key production input; the second is cross-country growth regressions that relate economic outcomes to infrastructure indicators, controlling for other critical growth determinants (Servén 2010).
This chapter uses the second approach by estimating the following growth regression:
,
,
(1)
where , is the real per capita GDP growth of country , at year , captures the conditional convergence using the logarithm of real per capita GDP of country , at year , , and , is a column vector of growth regressors, with PPP investment as percentage of GDP as the variable of interest. The disturbance term,
,
, has orthogonal components: the country and year fixed effects,
, and
, , and the idiosyncratic shocks,
, .
Depending on the availability of data, we arrive at an unbalanced panel involving 19 developing Asian economies over the period 1985–2015. Appendix A2.1 presents the variables used in the analysis, with their definitions and sources.
Growth Determinants
In relation to neoclassical growth theories, the initial level of income assesses evidence of conditional convergence across countries (Barro and Sala-i-Martin 2004). This concept predicts that an economy’s growth rate tends to slow as it approaches steady state growth. A negative partial correlation is, therefore, expected between economic growth and the initial level of income; that is, growth tends to be higher for economies started at lower income per capita (Pritchett and Summers 2014).
Human capital development matters to growth, especially in the long term. Trade openness, the export-led growth model, and, arguably, the significance of globalization are well-researched growth determinants. Inflation primarily affects growth through consumption and production. But the overall effect of inflation tends to be ambiguous because key economic actors behave differently with higher general prices. Here, households tend to consume less, but producers have an incentive to produce.

The Empirical Evidence and Channels for Effective Public–Private Partnerships 23
The role of government can negatively affect economic growth if it distorts private sector decisions and mismanages public finance (Barro and Sala-i-Martin 2004). A higher value of the government consumption ratio leads to a lower steady-state level of output per effective worker and, hence, to a lower growth rate for given values of state variables. Financial development is another well-researched determinant of economic growth. Economies with developed financial systems experience higher growth in relation to their ability to raise funds to support economic activities, notwithstanding their capacity to channel funds for better use.
PPP Investment Data: Sources, Issues, and Adjustments
PPP investment data for developing Asia are taken from the World Banks’s Private Participation in Infrastructure Database. This records contractual arrangements for infrastructure projects in low- and middle-income countries (based on a World Bank classification) that have reached financial closure, whereby private parties have assumed operating risks. The database covers projects in energy, telecommunication, transport, and water and sewerage contracted under management or lease contracts, concessions, new infrastructure projects, so-called greenfield projects, or divestitures. Because the database compiles only PPPs for low- and middle-income economies, PPP investments in Asia’s high-income economies, such as the Republic of Korea and Singapore, are taken from country sources.
The investment amounts in the database and the data gathered from country sources represent the total investment commitments agreed at a PPP project’s financial closure. Because of this, the PPP investments captured in this study may significantly differ to actual investments over a project’s life cycle. Results using this data should, therefore, be interpreted as being in the upper bound of the size of PPPs (Romp and de Haan 2005). Kappeler and Nemoz (2010) and Romp and de Haan (2005) tackle the measurement issue by spreading the amount of investment commitment equally over certain years. Following Kappeler and Nemoz (2010), we spread the total transaction amounts over 5 years to arrive at annualized PPP investment.1 To be comparable across years, we convert the PPP investment series to constant 2011 international dollars.
Another data issue is the risk of incompleteness and inaccuracies. This particularly applies to the World Bank’s Private Participation in Infrastructure Database, which draws its information exclusively from publicly available sources, and assumes that all sources are reliable.
Realizing the Potential of PPPs to Advance Asia’s Infrastructure Development24
Channels for Macroeconomic Impact and Poverty Reduction
We run additional empirical exercises to validate propositions in the framework identifying channels through which PPPs benefit the overall economy. For this, we follow the specification adopted by Cerra et al. (2016) identifying the factors explaining differences in the levels and quality of infrastructure in Latin American and Caribbean countries. The specification is as follows:
,
,
(2)
where ,
,
are measures of infrastructure access and quality including (i) access to electricity (% of total population and % of rural population), (ii) telephone subscriptions per 100 people, (iii) mobile subscriptions per 100 people, (iv) improved water source (% of total population and % of rural population), (v) improved water sanitation (% of total population and % of rural population), (vi) road quality score, and (vii) overall infrastructure quality score. The column vector of independent variables is given by . We are interested in the variable PPP investment as percentage of GDP to determine how PPPs potentially affect both access and quality of infrastructure services, which are identified as channels through which PPPs can deliver macroeconomic benefits. The disturbance term, , has orthogonal components: the country and year fixed effects, and , and the idiosyncratic shocks, .
We also analyze variations in employment that may be associated with fluctuations in PPP investments. Employment created in the delivery of PPP projects could directly affect poverty, and Gutierrez et al. (2007) note that sector productivity and employment patterns may be important for reducing poverty. For this, we estimate the following equation with employment-share growth in major economic sectors as the dependent variable:
,
.
(3)
The column vector of independent variables, , include PPP investment (% of GDP), real per capita GDP, education expenditure (% of GDP), primary completion rate, minimum wage, and share of the working-age population; denotes the disturbance term.
The Empirical Evidence and Channels for Effective Public–Private Partnerships 25
Empirical FindingsWe find evidence that PPPs have positive macroeconomic impacts. This could be attributed to findings in the results that PPPs help improve access to and the quality of infrastructure services. As an extension of the impact of PPPs on economic growth, they could be important tools for poverty eradication efforts in developing Asia.
PPP Investment Booms
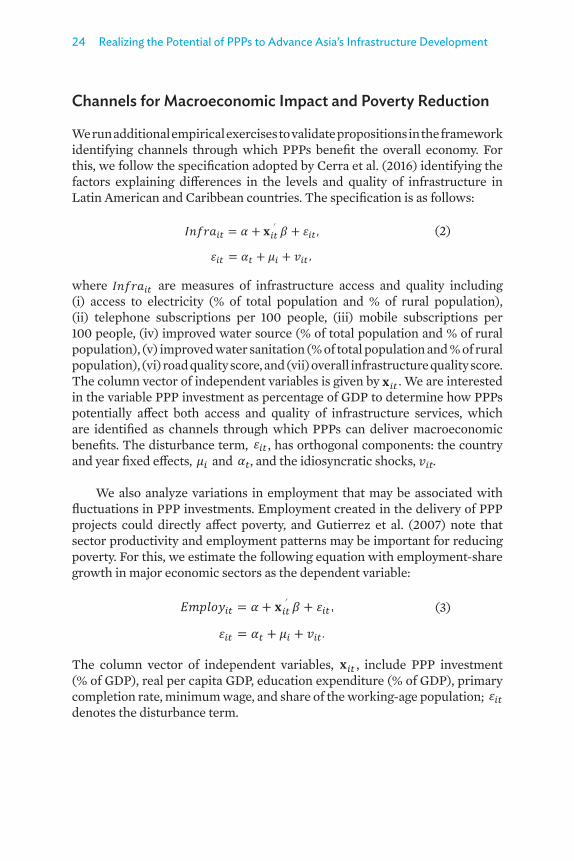
The uneven quality of the data on PPP investments complicates our regression analysis. To overcome this, we conduct an event analysis to look at what happened in years after—relative to years before—a particular investment boom. As Warner (2014) puts it, this type of quantitative exercise is a simple way of establishing the stylized facts about the macroeconomic conditions surrounding an investment boom.
Here, we see that an investment boom—PPP investment (% of GDP) grows for 3 consecutive years—is associated with higher growth. Figure 2.5 shows how real GDP growth per capita is higher after an investment boom relative to the period before it. The positive relationship between PPPs and economic growth could be attributed to the huge capital involved in these projects. Shediac et al. (2008) note that large infrastructure projects generate employment in the short and long term, and crowd in private investment. But the corresponding growth impact in this analysis is rather short-lived. The difference in economic growth reaches more than 2%, but stabilizes 4 years later. Even so, this does not cast doubt on the long-term growth impacts of PPPs, given the expected productivity improvements associated with better infrastructure.
Figure 2.5: Real Per Capita Gross Domestic Product Growth Before and After a PPP Investment Boom
-2
-1
0
1
2
t–4 t–3 t–2 t–1 PPPboom
t+1 t+2 t+3 t+4
Perc
enta
ge p
oint
s
PPP = public–private partnership. Source: Authors.

Realizing the Potential of PPPs to Advance Asia’s Infrastructure Development26
PPP Readiness
Instead of using popular measures of PPPs, such as amount of investment and number of projects, we examine how economic growth relates with capabilities to handle the complexity of these projects for preparation, procurement, and contract management. These measures capture the institutional and capacity improvements that could be attributed to PPP practices. Figure 2.6 shows the positive relationship between economic growth and government capabilities to handle PPPs in different areas.
Figure 2.6: Average Real Per Capita Gross Domestic Product Growth and Capabilities to Manage PPPs
-30369
0 50 100
Perc
ent
PPP preparation score, 0–100
-30369
0 50 100
Perc
ent
PPP procurement score, 0–100
-30369
0 50 100Pe
rcen
t
PPP contract management score, 0–100
PPP = public–private partnership. Source: World Bank. 2016. Benchmarking Public–Private Partnerships Procurement. Washington, DC.
Implementing PPP projects is an opportunity to reexamine regulatory and policy framework to improve governance and public sector capacity. For example, Taipei,China, learning from its first experience with a large PPP project for a high-speed rail system, passed legislation in 2000 to promote private participation in infrastructure projects, which became the institutional framework for PPPs there.
Developing economies in Asia and the Pacific have significantly improved their capacity to handle PPP projects (Figure 2.7). Their regulatory and institutional frameworks, investment climate, and financial facilities are increasingly being geared toward promoting PPPs—and this may have led to the growing use of PPPs for infrastructure in some countries.

The Empirical Evidence and Channels for Effective Public–Private Partnerships 27
Figure 2.7: PPP Readiness Scores in Asia and the Pacific, 2014
0
25
50
75
100RO
K
Japa
n
Indi
a
Phili
ppin
es
PRC
Indo
nesia
Thai
land
Paki
stan
Bang
lade
sh
Kaza
khst
an
Paki
stan
Mon
golia
Arm
enia
PNG
Viet
Nam KG
Z
Tajik
istan
Geo
rgia
Scor
e
Developed PPP market group (60.0–79.9 points)
Nascent PPP market group
(0–29.9 points)
Emerging PPP market group (30.0–59.9 points)
KGZ = Kyrgyz Republic, PNG = Papua New Guinea, PPP = public–private partnership, PRC = People’s Republic of China, ROK = Republic of Korea.Source: Economist Intelligence Unit. 2014. The 2014 Infrascope Index and Report. London.
PPP Investments and Real GDP growth
Table 2.1 shows the results of equation (1) for developing Asia. The coefficient of PPP investment (% of GDP) is found consistently positive and statistically significant across all variations of the baseline model (column 1). This is adjusted to check for possible nonlinearity of the relationship between PPPs and economic growth. To validate claims that using PPPs as a procurement modality rises during periods of severe fiscal constraint, we add an interaction term of PPP with a dummy variable that takes the value of 1 if, at year t, a country records a fiscal deficit of more than 10% of its GDP, indicating the severity of fiscal constraint; otherwise, it takes the value of 0. Column 2 shows no statistically significant results supporting that claim. In columns 3–5, we add institutional variables (corruption, rule of law, and government effectiveness) in the baseline model. The growth literature finds institutional quality as a relevant growth determinant. The addition of these institutional variables does not alter the significance of the coefficient before PPP investment (% of GDP).
We note, however, the potential upward bias of the coefficient before the PPP ratio because of the reverse causality, and this can be seen in the results in Table 2.2.2

Realizing the Potential of PPPs to Advance Asia’s Infrastructure Development28
Table 2.1: PPPs and Economic Growth in Developing Asia
Variable (1) (2) (3) (4) (5)PPP investment (% of GDP)
0.340* 0.342* 0.357* 0.337* 0.359*
(0.197) (0.198) (0.199) (0.198) (0.198)Fiscal balance (% of GDP)
–0.068 –0.048 –0.061 –0.040
(0.105) (0.107) (0.106) (0.107)PPP * fiscal condition dummy
–7.212 –6.089 –7.283 –7.026
(13.510) (13.551) (13.527) (13.459)Corruption index, WGI
2.197
(2.134)Rule of law, WGI
1.668
(2.074)Government effectiveness, WGI
3.330
(2.291)Conditional convergence hypothesis
–17.541*** –17.325*** –17.733*** –17.647*** –18.489***
(3.114) (3.347) (3.370) (3.375) (3.429)Inflation 0.183** 0.192** 0.193** 0.198** 0.219***
(0.078) (0.080) (0.080) (0.080) (0.081)Primary completion rate
0.005 0.003 0.004 –0.005 0.013
(0.042) (0.044) (0.044) (0.045) (0.044)Population growth
–1.249 –1.136 –1.220 –1.333 –1.499
(0.879) (0.898) (0.901) (0.931) (0.929)Private credit (% of GDP), in logs
0.436 0.521 0.534 0.572 0.525
(1.015) (1.042) (1.041) (1.045) (1.038)Gini coefficient 3.268 2.849 2.091 2.569 2.832
(12.182) (12.261) (12.280) (12.281) (12.214)
continued on next page

The Empirical Evidence and Channels for Effective Public–Private Partnerships 29
Variable (1) (2) (3) (4) (5)Government consumption (% of GDP), in logs
–3.094 –3.166 –3.510* –3.604* –3.272*
(1.904) (1.939) (1.968) (2.017) (1.933)Trade (% of GDP), in logs
0.930 0.577 0.657 0.670 0.484
(1.640) (1.817) (1.818) (1.823) (1.811)Public capital stock, annual growth
18.400*** 19.095*** 19.201*** 19.641*** 20.672***
(6.849) (7.030) (7.030) (7.072) (7.087)Constant 133.520*** 133.382*** 138.293*** 137.965*** 143.214***
(25.251) (27.903) (28.302) (28.512) (28.607)
Observations 187 187 187 187 187R2 value 0.452 0.455 0.459 0.457 0.463Number of countries
19 19 19 19 19
GDP = gross domestic product, PPP = public–private partnership, WGI = Worldwide Governance Indicators.Notes: 1. Dependent variable is real per capita GDP growth. 2. Standard errors are in parentheses.*** p<0.01 ** p<0.05 * p<0.1Source: Authors’ estimates.
Infrastructure Access and Quality
Table 2.2 suggests that, as well as increasing access to infrastructure, PPP projects provide incentives for the private partner to enhance the quality of infrastructure services—if, that is, contracts are properly drawn up. Coefficients of the variable of interest are found positive and significant across selected indicators of access to infrastructure services, including energy, telecommunication, water supply, and sanitation. Access to telecommunication, particularly mobile phones, shows higher coefficients than fixed-line telephone and broadband subscriptions. This is in line with the findings of a general trend of increasing telephone connections, and advances in information and communication technology because of private sector participation (John et al. 2015). Infrastructure PPPs are also helping to tackle developing Asia’s rapid urbanization, which requires better access to essential infrastructure.
Table 2.1 continued

Realizing the Potential of PPPs to Advance Asia’s Infrastructure Development30
Tabl
e 2.
2: P
PPs a
nd In
fras
truc
ture
Acc
ess a
nd Q
ualit
y in
Dev
elop
ing
Asia
Vari
able
Ove
rall
Acc
ess
to In
fras
truc
ture
Rur
al A
cces
s to
Infr
astr
uctu
reIn
fras
truc
ture
Qua
lity
Fixe
d-Li
ne
Tele
phon
e Su
bscr
ipti
ons
Mob
ile
Subs
crip
tion
sE
lect
rici
tyIm
prov
ed
Sani
tati
on
Impr
oved
W
ater
So
urce
Ele
ctri
city
Impr
oved
Sa
nita
tion
Impr
oved
W
ater
So
urce
Ove
rall
Infr
astr
uctu
reR
oad
PPP
inve
stm
ents
(%
of G
DP)
0.04
6**
0.13
2***
0.74
0***
0.61
5***
0.79
2***
0.96
5***
0.61
7***
0.49
2***
0.14
8***
0.13
9***
(0.0
19)
(0.0
32)
(0.2
54)
(0.0
96)
(0.12
6)(0
.333
)(0
.150)
(0.10
2)(0
.054
)(0
.051
)
Rea
l per
ca
pita
GD
P–0
.269
0.83
9**
–10.
134*
**4.
534*
**4.
832*
**–4
.741
3.82
2**
7.412
***
1.618
***
1.936
***
(0.2
20)
(0.3
93)
(2.9
31)
(1.12
0)(1
.473
)(3
.841
)(1
.749)
(1.18
2)(0
.555
)(0
.530
)
Infla
tion
–0.0
41–0
.08
0.43
9–0
.510
***
–0.0
590.
586
0.22
4–0
.366
*–0
.051
–0.0
63*
(0.0
34)
(0.0
56)
(0.4
48)
(0.17
3)(0
.228
)(0
.587
)(0
.275
)(0
.186)
(0.0
36)
(0.0
34)
Gov
ernm
ent
cons
umpt
ion
(% o
f GD
P)
–0.0
24–0
.379
–5.8
49**
*–0
.897
–0.8
83–2
.707
–1.2
76–0
.793
–0.0
91–0
.103
(0.16
2)(0
.269
)(2
.166)
(0.8
22)
(1.0
78)
(2.8
39)
(1.2
89)
(0.8
73)
(0.2
30)
(0.2
19)
Tra
de (%
of
GD
P)–0
.445
***
–0.9
10**
*–1
.481
0.92
5–1
.285
–0.8
7–2
.243
*2.
176*
**–0
.065
–0.18
5
(0.14
4)(0
.237
)(1
.913
)(0
.736
)(0
.958
)(2
.507
)(1
.140)
(0.7
79)
(0.2
83)
(0.2
70)
Priv
ate
cred
it (%
of G
DP)
0.19
7***
0.46
9***
4.96
0***
2.69
3***
0.95
2*2.
630*
*0.
135
3.15
0***
0.09
6–0
.175
(0.0
74)
(0.12
2)(0
.987
)(0
.378
)(0
.493
)(1
.294
)(0
.589
)(0
.402
)(0
.131)
(0.12
5)
cont
inue
d on
nex
t pag
e

The Empirical Evidence and Channels for Effective Public–Private Partnerships 31
Vari
able
Ove
rall
Acc
ess
to In
fras
truc
ture
Rur
al A
cces
s to
Infr
astr
uctu
reIn
fras
truc
ture
Qua
lity
Fixe
d-Li
ne
Tele
phon
e Su
bscr
ipti
ons
Mob
ile
Subs
crip
tion
sE
lect
rici
tyIm
prov
ed
Sani
tati
on
Impr
oved
W
ater
So
urce
Ele
ctri
city
Impr
oved
Sa
nita
tion
Impr
oved
W
ater
So
urce
Ove
rall
Infr
astr
uctu
reR
oad
Urb
an
popu
latio
n (%
of t
otal
po
pula
tion)
–0.3
950.
344
57.7
52**
*9.
018*
**23
.669
***
51.0
84**
*15
.776
***
5.46
3**
–3.6
47**
*–2
.570
***
(0.4
70)
(0.7
77)
(6.2
66)
(2.3
93)
(3.11
2)(8
.211
)(3
.789
)(2
.592
)(0
.943
)(0
.900
)
Popu
latio
n de
nsity
–1
.135*
–0.3
2728
.062
***
10.4
43**
*34
.984
***
33.0
90**
*47
.885
***
6.19
9*–3
.003
**–1
.176
(0.6
03)
(1.0
00)
(8.0
23)
(3.10
3)(4
.071
)(1
0.51
4)(5
.061
)(3
.426
)(1
.292
)(1
.233
)
Publ
ic d
ebt
(% o
f GD
P)–0
.05
0.06
6–0
.108
–0.4
21–0
.083
0.25
9–0
.235
0.06
20.
113
0.07
8
(0.0
58)
(0.0
96)
(0.7
70)
(0.5
04)
(0.6
61)
(1.0
08)
(0.7
91)
(0.5
36)
(0.0
86)
(0.0
82)
Rul
e of
law
in
dex
0.21
6*–0
.097
–1.12
5–1
.107*
–2.0
37**
1.847
–3.7
27**
*–1
.806
***
0.09
5–0
.224
(0.12
2)(0
.204
)(1
.619
)(0
.615
)(0
.808
)(2
.122)
(0.9
76)
(0.6
60)
(0.2
63)
(0.2
51)
Con
stan
t12
.535
***
–1.6
19–1
85.9
23**
*–3
8.88
3*–2
11.5
67**
*–2
35.13
4***
–227
.905
***
–43.
523*
*19
.676
**5.
506
(3.8
57)
(6.5
71)
(51.3
00)
(19.
899)
(26.
142)
(67.2
24)
(30.
513)
(20.
631)
(9.15
2)(8
.735
)
Obs
erva
tions
338
334
340
327
329
340
316
314
174
174
R2 v
alue
0.28
30.
766
0.64
20.
822
0.78
10.
498
0.75
60.
884
0.67
10.
509
Num
ber o
f co
untr
ies
2929
2928
2829
2727
2323
GD
P =
gros
s dom
estic
pro
duct
, PPP
= pu
blic
–pri
vate
par
tner
ship
.N
ote:
Sta
ndar
d er
rors
are
in p
aren
thes
es.
***
p<0.
01 *
* p<
0.05
* p
<0.1
Sour
ce: A
utho
rs’ e
stim
ates
.
Tabl
e 2.
2 co
ntin
ued

Realizing the Potential of PPPs to Advance Asia’s Infrastructure Development32
Table 2.3 shows the estimated effect of increasing PPP infrastructure investments in developing Asia. Increasing PPP investments as a percentage of GDP is associated with higher quality infrastructure services, reflecting the innovation and efficiency gains that partnering with the private sector can deliver. Consequently, improved access and quality, alongside public sector reforms to strengthen PPP processes, can deliver additional economic growth. Increasing PPP investments relative to GDP would, on average, result in higher real per capita GDP growth of 0.1 percentage point, keeping other factors constant.
Table 2.3: Effect of Increasing PPP Investments in Developing Asia
Variable
PPP Ratio Increase to
1%
PPP Ratio Increase to
2%
PPP Ratio Increase to
3%
Increase in real per capita GDP growth (percentage point)
0.1 0.3 0.4
Reduction in the number of people without electricity (million)
14 41 69
Reduction in the number of people without proper sanitation (million)
16 47 78
Reduction in the number of people without safe drinking water (million)
12 36 60
GDP = gross domestic product, PPP= public–private partnership.Note: Marginal effect is estimated using the 2015 average PPP ratio; that is, 0.5% of GDP. Source: Authors’ estimates.
The benefits of this growth can reach the poor through expanded wage employment and other livelihood opportunities. PPPs affect employment redistribution across industries and potentially create jobs not only during construction but over the long-term economic life of the infrastructure asset. PPP investments likely help income redistribution by moving agricultural labor into more productive and remunerative industries, as shown in Appendix A2.2. Labor movements from low-productivity and low-earning activities, such as agriculture, into high-productivity and high-earning sectors have been vital to development in Asia (McMillan, Rodrik, and Verduzco-Gallo 2014).

The Empirical Evidence and Channels for Effective Public–Private Partnerships 33
Conclusion and Policy RecommendationsDespite the strides made in building infrastructure in developing Asia, improving access and quality remains a huge agenda. Over 400 million people live without electricity in the region, 300 million without access to safe drinking water, and 1.5 billion lack basic sanitation (ADB 2017). Narrowing developing Asia’s vast infrastructure gap will be essential to make headway on improving this situation, as well as for sustaining growth and for tackling many of the region’s emerging development challenges.
Traditional procurement is still by far the most used method for building and upgrading infrastructure in the region, with more than 90% of infrastructure spending coming from public funds. This is equivalent to 5.1% of GDP annually. Private sector spending in infrastructure is just 0.4% of GDP annually (ADB 2017). Public funds and support from multilateral development banks will not be sufficient to meet the region’s demand for infrastructure. But partnering with the private sector could potentially fill the financing gap. PPPs have proved themselves to be one of the most viable ways to involve the private sector in building and operating infrastructure, including social infrastructure. So far, the increased use of PPPs to finance, build, and operate infrastructure in the region is concentrated in just a few countries, notably India and the People’s Republic of China. But PPPs are starting to gain traction in other countries (Appendix A2.3).
This chapter shows the complex path through which PPPs, either as an infrastructure project or a public finance tool, can bring macroeconomic benefits. We identify four direct channels to do this, based on literature reviews and country experiences. Through PPPs, the infrastructure–growth link becomes stronger, especially when partnership arrangements emphasize the quality of infrastructure services, better maintenance, and delivering projects on time and within budget. Public sectors need to strengthen their institutional capacity to carry out PPPs, and the legal and regulatory frameworks for PPP processes. And transparency and good governance must be second nature in the practice of PPPs. Improvements on all these fronts would free up more public resources and enable more effort to go into other public services where needs are pressing, such as pro-poor interventions (conditional cash transfers, for example). And bankable projects have the potential to move so far hard-to-budge long-term fund investments into infrastructure.
Empirical results of this analysis suggest that PPPs are associated with improved access to infrastructure services and better services, and so affect economic growth and other development outcomes. While the macroeconomic impacts of PPPs may differ from country to country, they are mainly positive. But this optimism is conditional on considerable institutional
Realizing the Potential of PPPs to Advance Asia’s Infrastructure Development34
improvements for PPPs being made, especially on contracts. All PPP legal and regulatory frameworks must ensure that social welfare is the overall goal for infrastructure PPPs, regardless of the different priorities and needs of public and private sector partners.
Countries across the region have significantly improved their handling of infrastructure PPP projects, though most are still at an early stage of developing these partnerships. The exceptions are India, the Philippines, and the Republic of Korea (EIU 2014). To be better equipped to handle PPPs, governments need to develop the technical expertise and capacity to deliver complex PPP projects. World Bank (2016), which assesses how well the governments of 82 economies prepare, procure, and implement PPP projects, finds that most countries in developing Asia lag behind countries in the Organisation for Economic Co-operation and Development, Latin America, and Europe. Further improvements are needed for PPP project preparation and procurement, and for dealing with unsolicited project proposals. If these are not tackled, PPPs may end up being seen as an inferior choice to traditional procurement, making it harder for these partnerships to be more widely adopted and undermining their potential to deliver macroeconomic benefits.
Notes1. This is also adopted by the International Monetary Fund in its estimation of PPP investment
for its Investment and Capital Stock Dataset from 1985 to 2015.2. PPPs are more likely to be undertaken when an economy is in good shape. The need to
prevent infrastructure backlogs and economic overheating during periods of economic growth may favor using PPPs for infrastructure.

The Empirical Evidence and Channels for Effective Public–Private Partnerships 35
Appendix A2.1: Variables, Definitions, and Data Sources for the Analysis
Variable Definition Data Source
Initial level of real per capita GDP
Lagged real per capita GDP (in constant 2010 United States dollars), expressed in logs
World Bank, World Development Indicators
Population growth Annual growth of total population
World Development Indicators
Education (human capital)
Primary completion rate World Development Indicators
Trade openness Trade (exports plus imports) as a percentage of GDP, expressed in logs
World Development Indicators
Inflation rate CPI inflation rate. Transformed to smoothen hyperinflation episodes following Calderón and Servén’s (2010) computation: log((1+ir)*100), where ir is the inflation rate.
World Development Indicators
Income inequality Gini coefficient PovcalNet, World Bank
Financial development Domestic credit to private sector as percentage of GDP, expressed in logsLiquid liabilities as percentage of GDP, expressed in logs
World Bank, Global Financial Development Database; International Monetary Fund, International Financial Statistics
Government size General government consumption expenditure as percentage of GDP, expressed in logs
World Development Indicators
Employment in agriculture
Percentage of total employment, expressed in logs
World Development Indicators
continued on next page

Realizing the Potential of PPPs to Advance Asia’s Infrastructure Development36
Variable Definition Data Source
Employment inindustry
Percentage of total employment, expressed in logs
World Development Indicators
Employment in services Percentage of total employment, expressed in logs
World Development Indicators
Access to electricity Percentage of population, expressed in logs
World Development Indicators
Access to improved water sources
Percentage of population, expressed in logs
World Development Indicators
Access to improved sanitation
Percentage of population, expressed in logs
World Development Indicators
Fixed-line telephone subscriptions
Per 100 people, expressed in logs
World Development Indicators
Mobile subscriptions Per 100 people, expressed in logs
World Development Indicators
Fixed-line broadband subscriptions
Per 100 people, expressed in logs
World Development Indicators
Secondary enrollment rate
Percentage of population at official secondary education age
World Development Indicators
Minimum wage Statutory nominal gross monthly minimum wage or lowest wage that employers are legally obliged to pay employees, in national currency
International Labour Organization Statistical Database
PPP investments in education
PPP investment (US$ million), expressed in logs
Infrastructure Journal (IJGlobal) database
Appendix A2.1 continued
continued on next page
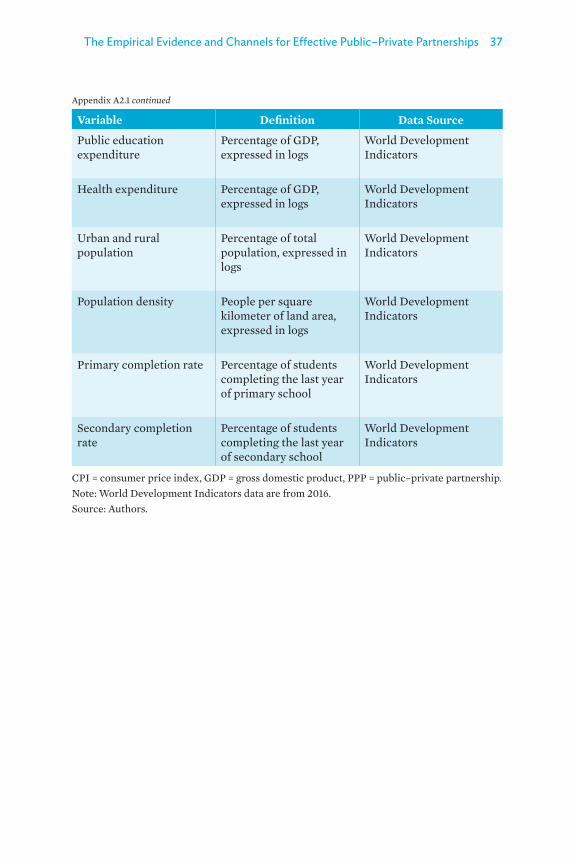
The Empirical Evidence and Channels for Effective Public–Private Partnerships 37
Variable Definition Data Source
Public education expenditure
Percentage of GDP, expressed in logs
World Development Indicators
Health expenditure Percentage of GDP, expressed in logs
World Development Indicators
Urban and rural population
Percentage of total population, expressed in logs
World Development Indicators
Population density People per square kilometer of land area, expressed in logs
World Development Indicators
Primary completion rate Percentage of students completing the last year of primary school
World Development Indicators
Secondary completion rate
Percentage of students completing the last year of secondary school
World Development Indicators
CPI = consumer price index, GDP = gross domestic product, PPP = public–private partnership.Note: World Development Indicators data are from 2016.Source: Authors.
Appendix A2.1 continued

Realizing the Potential of PPPs to Advance Asia’s Infrastructure Development38
App
endi
x A
2.2:
PPP
s and
Sec
tora
l Em
ploy
men
t in
Dev
elop
ing
Asia
Vari
able
Em
ploy
men
t G
row
th in
A
gric
ultu
re
Em
ploy
men
t G
row
th in
In
dust
ry
Em
ploy
men
t G
row
th in
Se
rvic
es
Em
ploy
men
t G
row
th in
A
gric
ultu
re
Em
ploy
men
t G
row
th in
In
dust
ry
Em
ploy
men
t gr
owth
in
Serv
ices
PPP
inve
stm
ents
(% G
DP)
–0.0
550.
080*
*0.
053
(0.0
41)
(0.0
36)
(0.0
34)
PPP
inve
stm
ents
in IC
T (%
of G
DP)
–0.14
4–0
.221
-0.2
22
(0.2
62)
(0.2
68)
(0.2
54)
PPP
inve
stm
ents
in w
ater
(% o
f GD
P)–0
.155
0.05
50.
190*
*
(0.0
93)
(0.0
95)
(0.0
90)
PPP
inve
stm
ents
in e
nerg
y (%
of G
DP)
–0.15
2**
0.15
2**
0.02
2
(0.0
68)
(0.0
69)
(0.0
66)
PPP
inve
stm
ents
in tr
ansp
ort (
% o
f G
DP)
0.33
6***
–0.0
41-0
.094
(0.0
89)
(0.0
91)
(0.0
86)
Rea
l per
cap
ita G
DP
–0.10
10.
270*
*0.
157
–0.19
00.
266*
*0.
113
(0.12
2)(0
.106)
(0.10
1)(0
.115)
(0.11
8)(0
.112)
Edu
catio
n ex
pend
iture
(% o
f GD
P)–0
.013
0.02
1–0
.013
–0.0
130.
015
-0.0
20
(0.0
22)
(0.0
19)
(0.0
18)
(0.0
19)
(0.0
19)
(0.0
18)
Urb
an p
opul
atio
n (%
of t
otal
po
pula
tion)
–0.0
05–0
.005
–0.0
02–0
.007
–0.0
02-0
.002
(0.0
07)
(0.0
06)
(0.0
05)
(0.0
06)
(0.0
06)
(0.0
06)
cont
inue
d on
nex
t pag
e

The Empirical Evidence and Channels for Effective Public–Private Partnerships 39
Vari
able
Em
ploy
men
t G
row
th in
A
gric
ultu
re
Em
ploy
men
t G
row
th in
In
dust
ry
Em
ploy
men
t G
row
th in
Se
rvic
es
Em
ploy
men
t G
row
th in
A
gric
ultu
re
Em
ploy
men
t G
row
th in
In
dust
ry
Em
ploy
men
t gr
owth
in
Serv
ices
Min
imum
wag
e0.
037
–0.0
90**
*–0
.057
**0.
067*
*–0
.088
**-0
.047
(0.0
33)
(0.0
29)
(0.0
28)
(0.0
32)
(0.0
33)
(0.0
31)
Prim
ary
com
plet
ion
rate
0.46
4*–0
.158
–0.2
800.
292
–0.18
3-0
.152
(0.2
53)
(0.2
21)
(0.2
10)
(0.2
27)
(0.2
33)
(0.2
21)
Wor
king
age
pop
ulat
ion
–1.0
030.
248
–1.74
4**
–1.2
050.
071
-2.0
13**
(0.9
34)
(0.8
15)
(0.7
77)
(0.8
20)
(0.8
40)
(0.7
95)
Con
stan
t2.
771
–1.6
737.7
57**
4.95
3–0
.885
8.59
1**
(4.10
9)(3
.588
)(3
.420
)(3
.690
)(3
.781
)(3
.579
)
Obs
erva
tions
8585
8585
8585
R2 v
alue
0.44
50.
564
0.40
90.
636
0.60
70.
474
Num
ber o
f cou
ntri
es13
1313
1313
13
GD
P =
gros
s dom
estic
pro
duct
, IC
T =
info
rmat
ion
and
com
mun
icat
ion
tech
nolo
gy, P
PP =
pub
lic–p
riva
te p
artn
ersh
ip.
Not
e: S
tand
ard
erro
rs a
re in
par
enth
eses
.**
* p<
0.01
**p
<0.0
5 *
p<0.
1So
urce
: Aut
hors
’ est
imat
es.
App
endi
x A
2.2
cont
inue
d
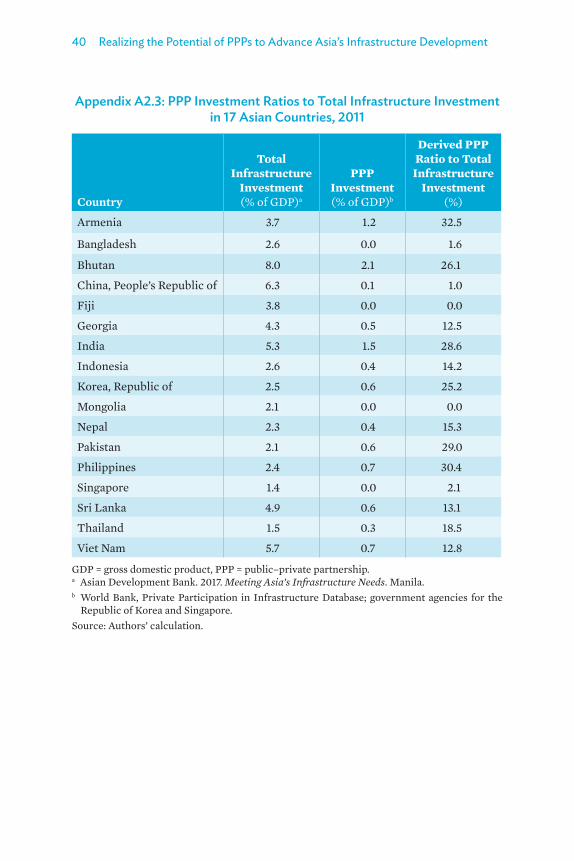
Realizing the Potential of PPPs to Advance Asia’s Infrastructure Development40
Appendix A2.3: PPP Investment Ratios to Total Infrastructure Investment in 17 Asian Countries, 2011
Country
Total Infrastructure
Investment (% of GDP)a
PPP Investment (% of GDP)b
Derived PPP Ratio to Total
Infrastructure Investment
(%)
Armenia 3.7 1.2 32.5
Bangladesh 2.6 0.0 1.6
Bhutan 8.0 2.1 26.1
China, People’s Republic of 6.3 0.1 1.0
Fiji 3.8 0.0 0.0
Georgia 4.3 0.5 12.5
India 5.3 1.5 28.6
Indonesia 2.6 0.4 14.2
Korea, Republic of 2.5 0.6 25.2
Mongolia 2.1 0.0 0.0
Nepal 2.3 0.4 15.3
Pakistan 2.1 0.6 29.0
Philippines 2.4 0.7 30.4
Singapore 1.4 0.0 2.1
Sri Lanka 4.9 0.6 13.1
Thailand 1.5 0.3 18.5
Viet Nam 5.7 0.7 12.8
GDP = gross domestic product, PPP = public–private partnership.a Asian Development Bank. 2017. Meeting Asia’s Infrastructure Needs. Manila. b World Bank, Private Participation in Infrastructure Database; government agencies for the
Republic of Korea and Singapore.Source: Authors’ calculation.

The Empirical Evidence and Channels for Effective Public–Private Partnerships 41
References
Arezki, Rabah, Patrick Bolton, Sanjay Peters, Frederic Samama, and Joseph Stiglitz. 2016. From Global Savings Glut to Financing Infrastructure: The Advent of Investment Platforms. IMF Working Paper No. 16/18. Washington, DC: International Monetary Fund.
Aschauer, David A. 1989. Is Public Expenditure Productive? Journal of Monetary Economics 23 (2): pp. 177–200.
ADB (Asian Development Bank). 2017. Meeting Asia’s Infrastructure Needs. Manila.
Barro, Robert J. 1990. Government Spending in a Simple Model of Endogenous Growth. Journal of Political Economy 98 (5): pp. 103–125.
Barro, Robert J. and Xavier Sala-i-Martin. 2004. Economic Growth. 2nd ed. Cambridge, MA: MIT Press.
Calderón, César and Alberto Chong. 2004. Volume and Quality of Infrastructure and the Distribution of Income: An Empirical Investigation. Review of Income and Wealth 50 (1): pp. 87–106.
Calderón, César and Luis Servén. 2004. The Effects of Infrastructure Development on Growth and Income Distribution. World Bank Working Paper No. WPS3400. Washington, DC: World Bank.
———. 2010. Infrastructure and Economic Development in Sub-Saharan Africa. Journal of African Economies 19 (1): pp. 13–87.
———. 2014. Infrastructure, Growth, and Inequality: An Overview. Policy Research. World Bank Working Paper No. 7034. Washington, DC: World Bank.
Calderón, César, Enrique Moral-Benito, and Luis Servén. 2015. Is Infrastructure Capital Productive? A Dynamic Heterogenous Approach. Journal of Applied Econometrics 30 (2): pp. 177–198.
Canning, David and Peter Pedroni. 2008. Infrastructure, Long-Run Economic Growth and Causality Tests for Cointegrated Panels. Manchester School 76 (5): pp. 504–527.

Realizing the Potential of PPPs to Advance Asia’s Infrastructure Development42
Cerra, Valerie, Alfredo Cuevas, Carlos Goes, Izabela Karpowicz, Troy Matheson, Issouf Zamake, and Svetlana Vtyurina. 2016. Highways to Heaven: Infrastructure Determinants and Trends in Latin America and the Caribbean. IMF Working Paper No. 16/185. Washington, DC: International Monetary Fund.
Davies, Paul and Kathryn Eustice. 2005. Delivering the PPP Promise: A Review of PPP issues and Activity. PricewaterhouseCoopers. http://www.globalclearinghouse.org/InfraDev/assets /10/documents/PWC%20-20Delivering%20the%20PPP%20Promise_A%20Review%20of% 20PPP %20Issues %20and%20Activities%20(2005).pdf.
De Bettignies, Jean-Etienne, and Thomas W. Ross. 2004. The Economics of Public–Private Partnerships. Canadian Public Policy 30(2).
Dintilhac, Clio, Fernanda Ruiz-Nuñez, and Zichao Wei. 2015. The Economic Impact of Infrastructure and Public–Private Partnerships: Literature Review. http://intersector.com/ resource/economic-impact-infrastructure-public-private-partnerships-literature-review/.
EIU (Economist Intelligence Unit). 2014. The 2014 Infrascope Index and Report. London.
Engel, Eduardo. 2016. Public–Private Partnerships: Economic Theory and Public Policy. Presentation at the World Bank Development Economics Vice Presidency Lecture Series, Washington, DC, March 22.
European PPP Expertise Centre. 2015. PPP Motivations and Challenges for the Public Sector: Why (Not) and How? http://www.eib.org/attachments/epec/epec_ppp_motivations_and challenges_en.pdf.
Futagami, Koichi, Yuichi Morita, and Akihisa Shibata. 1993. Dynamic Analysis of an Endogenous Growth Model with Public Capital. The Scandinavian Journal of Economics 95 (4): pp. 607–625.
Han, Xuehui and Shang-Jin Wei. 2017. Reexamining the Middle-Income Trap Hypothesis: What to Reject and What to Revive? Journal of International Money and Finance 73: pp. 41–61.
Henckel, Timo and Warwick McKibbin. 2010. The Economics of Infrastructure in a Globalized World: Issues, Lessons and Future Challenges. Washington, DC: Brookings.

The Empirical Evidence and Channels for Effective Public–Private Partnerships 43
Iossa, Elisabetta and David Martimort. 2015. The Simple Microeconomics of Public–Private Partnerships. Journal of Public Economic Theory 17 (1): pp. 4–48.
Ismail, Normaz Wana and Jamilah Mohd Mahyideen. 2015. The Impact of Infrastructure on Trade and Economic Growth in Selected Economies in Asia. ADBI Working Paper Series No. 553. Tokyo: Asian Development Bank Institute.
John, Prachitha, Ashwin Mahalingam, Akash Deep, and A. Thillairajan. 2015. Impact of Private Sector Participation on Access and Quality of Services: Systematic Review of Evidence from the Electricity, Telecommunications and Water Supply Sectors. Journal of Development Effectiveness 7 (1): pp. 64–89.
Kappeler, Andreas and Mathieu Nemoz. 2010. Public–Private Partnerships in Europe – Before and During the Recent Financial Crisis. Economic and Financial Report 2010/04. European Investment Bank. http://www.eib.org/attachments/efs/efr_2010_v04_en.pdf.
Kim, Jay-Hyung, Jungwook Kim, Sunghwan Shin, and Seung-yeon Lee. 2011. Public–Private Partnership Infrastructure Projects: Case Studies from the Republic of Korea: Volume 1: Institutional Arrangements and Performance. Manila: ADB.
Kodongo, Odongo and Kalu Ojah. 2016. Does Infrastructure Really Explain Economic Growth in Sub-Saharan Africa? Review of Development Finance 6 (2): pp. 105–125.
Kwon, Eunkyung. 2005. Infrastructure, Growth and Poverty Reduction in Indonesia: A Cross-Sectional Analysis. Paper presented at the Asian Development Bank Institute Workshop on Transport Infrastructure and Poverty Reduction, Manila, 18–22 July.
McMillan, Margaret, Dani Rodrik, and Íñigo Verduzco-Gallo. 2014. Globalization, Structural Change, and Productivity Growth, with an Update on Africa. World Development 63: pp. 11–32.
Mendoza, Octasiano Miguel V. 2017. Infrastructure Development, Income Inequality, and Urban Sustainability in the People’s Republic of China. ADBI Working Paper No. 713. Tokyo: ADBI.

Realizing the Potential of PPPs to Advance Asia’s Infrastructure Development44
Pritchett, Lant and Lawrence Summers. 2014. Asiaphoria Meets Regression to the Mean. NBER Working Paper 20573. Cambridge, MA: National Bureau of Economic Research.
Rhee, Chang-Yong and Hangyong Lee. 2007. Public–Private Partnerships in Infrastructure and Macroeconomy: The Experience of Korea. In Performance Evaluation and Best Practice of Public-Private Partnerships, edited by Jay-Hyung Kim. Sejong: Korea Development Institute.
Romp, Ward and Jakob de Haan. 2005. Public Capital and Economic Growth: A Critical Survey. EIB Papers 10 (1).
Schomaker, Rahel. 2014. Institutional Quality and Private Sector Participation: Theory and Empirical Findings. European Journal of Government and Economics 3 (2): pp. 104–117.
Seethepalli, Kalpana, Maria Caterina Bramati, and David Veredas. 2008. How Relevant is Infrastructure to Growth in East Asia? World Bank Policy Research Working Paper Series No. 4597. Washington DC: World Bank.
Servén, Luis. 2010. Infrastructure and Growth. World Bank Research Brief. Washington, DC: World Bank.
Setboonsarng, Sununtar. 2010. Transport Infrastructure and Poverty Reduction. ADBI Research Policy Brief No. 21. Tokyo: ADBI.
Shediac, Richard, Rabih Abouchakra, Mona Hammami, and Mazen Ramsay Najjar. 2008. Public–Private Partnerships: A New Catalyst for Economic Growth. New York: Booz & Company.
Straub, Stéphane and Akiko Terada-Hagiwara. 2010. Infrastructure and Growth in Developing Asia. ADB Economics Working Paper Series No. 231. Manila: ADB.
Trujillo, Lourdes, Noelia Martin, Antonio Estache, and Javier Campos. 2002. Macroeconomics Effects of Private Sector Participation in Latin America’s Infrastructure. World Bank Policy Research Working Paper Series No. 2906. Washington DC: World Bank.
UNESCAP (United Nations Economic and Social Commission for Asia and the Pacific). 2014. 5P Approach: Partnerships for a Resilient Energy Future. http://www.unescap.org/sites/ default/files /5P_Brochure.pdf.
The Empirical Evidence and Channels for Effective Public–Private Partnerships 45
Wallich, Christine. 2002. Soft Hearts and Hard Heads: The Private Sector’s Centrality to Poverty Reduction. In Defining an Agenda for Poverty Reduction: Proceedings of the First Asia and Pacific Forum on Poverty, Vol. 1. Manila: ADB.
Warner, Andrew. 2014. Public Investment as an Engine of Growth. IMF Working Paper No. 148. Washington, DC: IMF.
World Bank. 2016. Benchmarking Public–Private Partnerships Procurements. Washington, DC.
Yehoue, Etienne, Mona Hammami, and Jean-Francois Ruhashyankiko. 2006. Determinants of Public–Private Partnerships in Infrastructure. IMF Working Paper No. 99. Washington, DC: IMF.


CHAPTER 3
Assessing Risk in Public–Private Partnerships
Minsoo Lee, Pilipinas F. Quising, Mai Lin Villaruel, and Xuehui Han
IntroductionPublic–private partnerships (PPPs) can provide real advantages for helping governments close infrastructure gaps and spur economic growth, especially when faced with fiscal constraints. But PPPs come with considerable risks and challenges. Delays and cancellations are a big concern in developing economies, where many countries are grappling with stringent fiscal constraints. Delays and cancellations in infrastructure projects in these countries can impose large efficiency losses, discourage private investment, and disrupt the provision of infrastructure and public services. A noticeable trend since the early 1980s has been rising tensions between contract parties in PPPs, which have caused contracts to run into difficulties or be terminated. In less-developed countries in Latin America and the Caribbean, PPP projects have simply been abandoned because either the private or public sector partner was unable to fulfill contract obligations (Ahmad et al. 2014). Indeed, breach of contract in PPP projects has become widespread globally since the 1990s, and is a major problem for attracting foreign investors to PPPs (Nose 2014).
This chapter estimates the hazard rates of PPPs in developing Asia using survival time hazard analysis. It examines project-related factors, including type of PPP; contract award method; level of government support; macroeconomic factors (growth, debt levels, and the occurrence of natural disasters); and institutional factors (whether there is a dedicated PPP unit, law and order issues, and degree of corruption, for example).
The empirical results suggest policymakers should carefully assess these factors to determine the expected efficiency gains of proposed PPP projects, because project success depends just as much on well-designed contracts as on economic and political conditions, and institutional capacity. We begin by discussing the reasons for failed PPP projects in developing countries globally, and common risks and success factors for PPP projects. We then describe the data and analytical framework for the empirical analysis, present the

Realizing the Potential of PPPs to Advance Asia’s Infrastructure Development48
estimation results, and discuss the policy implications of the results focusing on developing Asia.
Failed PPP Projects in Developing CountriesThe World Bank’s Private Participation in Infrastructure Database defines a cancelled PPP project as one in which the private partner has quit a partnership, either by selling or transferring the economic interest back to the government before fulfilling the contract terms. A distressed PPP project, also using the World Bank’s definition, is when a public sector partner or private sector operator has either requested a contract to be terminated or requested international arbitration to settle a dispute. This chapter uses both definitions in its analysis of project failure. The stakes are high when this happens: public services can get disrupted, it discourages private investment in other PPPs, and—for certain projects—may require higher risk premiums.
The World Bank’s Private Participation in Infrastructure Database shows that 259 PPP projects in developing countries worldwide were cancelled, and 67 were distressed, out of 6,273 PPP projects from 1991 to 2015. This might seem small, but it should be noted that only 216 projects were completed in the period. More than half the cancelled projects were in developing Asia (Figure 3.1). Globally, the cancelled projects had initial investments of $76.4 billion, 4.4% of the $1.7 trillion committed investments.
Figure 3.1: Cancelled PPP Projects by Region, 1991–2015 (% share to total cancelled projects)
Africa2.9
Developing Asia54.5
Europe1.1
Latin America40.8
Middle East0.7
PPP = public–private partnership.Notes:1. Includes only low- and middle-income countries.2. Excludes privatizations and merchant projects that do not include government guarantees or
that operate in a liberalized environment. 3. Projects in the World Bank’s Private Participation in Infrastructure Database must be at least
20% privately owned; state-owned enterprises are considered public.Source: World Bank, Private Participation in Infrastructure Database (accessed 28 March 2017).

Assessing Risk in Public–Private Partnerships 49
For developing Asia, most failed PPPs were in transport and energy (Figure 3.2). Within a sector, information and communication technology had the highest failure rate—25% or 14 failed projects out of 41 covered in the database in the review period.
Figure 3.2: Cancelled PPP Projects by Sector and Project Type by Investment, 1991–2015
(% share total cancelled projects)
Energy23.4
ICT16.3Transport
41.8
Water andsewerage
18.5
SectorOther PPP
1.2
Brownfield56.0
Greenfield42.8
Type of PPP
ICT = information and communication technology, PPP = public–private partnership.
Notes:
1. Other PPP includes management and lease contracts and partial divestitures.2. Includes only low- and middle-income countries. 3. Excludes privatizations and merchant projects that do not include government guarantees or
that operate in a liberalized environment. 4. Projects in the World Bank’s Private Participation in Infrastructure Database must be at least
20% privately owned; state-owned enterprises are considered public.
Source: World Bank, Private Participation in Infrastructure Database (accessed 28 March 2017).
On average, project cancellations in developing Asia occur 5 years after financial closure, which is typically during the final stage of project construction (Figure 3.3).

Realizing the Potential of PPPs to Advance Asia’s Infrastructure Development50
Figure 3.3: Mean Duration of PPP Project Cancellations
0
2
4
6
8
Latin America Europe Developing Asia Africa Middle East
PPP = public–private partnership.
Notes:
1. Duration is measured as the time difference from the financial closure year (that is, the year in which private sponsors legally entered an agreement to invest funds or provide services) through to the year in which the project was cancelled.
2. Includes only the low- and middle-income countries.
Source: World Bank, Private Participation in Infrastructure Database (accessed 28 March 2017).
Factors Affecting PPP Projects Outcomes The benefits of PPPs are many. Realizing them requires good planning, execution, and monitoring. Well-structured PPP projects can deliver dividends over the long term, but these do not materialize by themselves—they have to be drawn out. And even well-structured PPP projects can fail or require expensive restructuring because of unforeseen events or the opportunistic behavior of the contracting parties. Few PPP projects will succeed if they ignore the project, macroeconomic, political, and institutional factors that can affect the project outcomes shown in Figure 3.4. These are not independent of each other, and their influence on outcomes is closely interrelated. The figure shows the causal relationship of these factors, which can affect one or all project partners, and a project’s overall progress.

Assessing Risk in Public–Private Partnerships 51
Figure 3.4: Factors Affecting PPP Project Outcomes
Macroeconomic Conditions Growth Exchange rates Trade Fiscal balance Debt level Climate Country/sovereign risksPPP Project
Outcome
Political/Institutional Indicators Level of corruption Internal conflict Democratic accountability Investment profile Bureaucratic quality
Project Factors Type of PPP Private participation
level Contract Award method Proposal mode Sector multilateral
support Government support
through revenue or capital subsidy, or guarantee Sponsors (foreign
or domestic) Funding (government,
private, foreign, and MDB)
MDB = multilateral development bank, PPP = public–private partnership. Source: Authors.
Formation Requirements for Effective PPPs
For smoother PPP processes, it is important to identify the main success factors for PPP project planning and implementation. Rockart (1982) describes these as a “few key areas of activity,” where favorable results are necessary for project managers to reach their goals. Because of the complexity of PPP projects, careful preparatory work is needed; this includes a comprehensive feasibility study and thorough economic evaluations of a project’s potential (Jamali 2004). Any concerns on transparency and accountability by the public sector partner need to be tackled, and private partners need to be reassured of safe returns on their investments. Sharing the same vision and trust between the parties contributes to successful PPPs.
The challenge is to ensure that the interests of all stakeholders are skillfully negotiated and packaged. Governments need to maintain their involvement through the life of a PPP project, whether as partner or regulator. This is especially necessary for projects where accountability is vital, cost-shifting can be a problem, time frames are long; and where the social aspects of a project are more important than costs (Spackman 2002). A PPP unit is required to fill gaps in projects caused by a lack of coordination between partners, high transaction costs, and institutional shortcomings. PPP units should support competent authorities to get value for money in the procurement and implementation phases of projects (OECD 2012). The

Realizing the Potential of PPPs to Advance Asia’s Infrastructure Development52
Organisation for Economic Co-operation and Development defines a PPP unit as an organization that has been set up with government aid to carry out policy guidance, technical support, capacity building for PPP projects, and project promotion and investment.
The literature identifies an array of factors essential for successful PPP projects. For build–operate–transfer projects, Tiong (1996) identifies six factors for winning these contracts: (i) entrepreneurship and leadership, (ii) identifying the right project, (iii) the private partner’s strength in technical matters, (iv) technical solution advantage, (v) financial package differentiation, and (vi) differentiation in guarantees. For Zhang (2005), the success factors are (i) a favorable investment environment, (ii) a project’s economic viability, (iii) having a reliable concessionaire with strong technical strength, (iv) a sound financial package, and (v) appropriate risk allocation. Samii, van Wassenhove, and Bhattacharya (2002) cite resource dependency, commitment and common goals, good communication and cooperation between partners, and similar working cultures.
Jamali (2004) underscores the importance of governments providing strong regulatory systems for PPPs, which should include protection from expropriation, arbitration procedures, respect for contract agreements, processes for recovering costs, and making profits proportional to project risks. For Di Lodovico (1998), Pongsiri (2002), and Zouggari (2003), transparent and strong regulatory and legal frameworks are prerequisites for the private sector’s participation in PPPs. Strong frameworks also help ensure that PPPs operate efficiently and optimize the use of public resources. ADB (2008) and Trebilcock and Rosenstock (2015) stress the importance of creating a PPP unit to help public partners to disseminate information on PPP projects, and to advise on procurement processes to put them on an equal footing with private partners in PPP negotiations. The World Bank (2007) finds that the efficiency of PPP units is highly correlated with the success of a country’s PPP program. For example, implementing PPP projects in the Philippines markedly improved when the Public–Private Partnership Center, the government’s PPP unit, was reorganized and strengthened in 2010.
Reyes-Tagle and Garbacik (2016) find that effective government institutions increase the chances of countries having active PPP programs, though this has no effect on the level of government spending on PPPs. The authors note that PPPs can be an immediate remedy for fiscal constraints from initial private sector financing. But, without proper institutional safeguards against corruption, unsustainable fiscal liabilities can be created that will worsen a country’s fiscal position.
Assessing Risk in Public–Private Partnerships 53
Risk Factors in Project Implementation
Of the 20 countries covered in the Economist Intelligence Unit’s 2014 Infrascope survey, which ranks the readiness and capacity of PPP projects in Asia and the Pacific, only one—Australia—has a mature PPP environment (EIU 2015). Four countries in the region have developed environments for PPPs: India, Japan, the Philippines, and the Republic of Korea. According to Infrascope, the People’s Republic of China has the highest readiness and capacity ranking among emerging PPP market economies in the region. Taken overall, the Infrascope survey reflects the growing importance of PPPs in Asia and the Pacific, and how some developing countries in the region are getting more experienced and adept in implementing PPPs. That said, the survey highlights a wide range of obstacles undermining PPP projects, including weak legal and regulatory frameworks, poorly prepared or structured projects, lack of capacity to carry out projects in the public and private sectors, and weak financial markets.
Moszoro et al. (2014) show that private investment in infrastructure is highly sensitive to freedom from corruption, rule of law, quality of regulations, and the number of disputes in a sector. Further, PPP enabling-law provisions allowing unsolicited project proposals and for the comingling of public and private funds are particularly useful for facilitating private investment in infrastructure (Albalate, Gel, and Geddes 2015). Ismail and Harris (2014) identify the top five negative factors for getting PPPs off the ground in Malaysia: (i) lack of government guidelines and procedures, (ii) lengthy delays in negotiations, (iii) high user charges, (iv) project delays caused by political opposition and confusion over government objectives, (v) and the evaluation criteria for projects.
The long-term nature of PPP contracts and the many different stakeholders in these partnerships can heighten project risk, making PPPs less attractive to private partners. This is widely discussed in the literature. Nijkamp, van der Burch, and Vidigni (2002) and Scharle (2002) identify obstacles to project success. These include long-term planning horizons, overly complex projects, inappropriate or lacking institutionalized competition rules for public projects, hold-ups caused by a change in the position of public partners, and technocratic implementation practices. Li and Zou (2008) group the identified risks based on project life cycles, from the feasibility study and project design to financing and construction, operation, and transfer. Soomro and Zhang (2013) examine failure factors at different stages for transport PPPs: among them, poor economic and financial assessments for feasibility studies, inappropriate risk allocation between partners during procurement, delayed land acquisitions, and lower user demand once a project is operating.

Realizing the Potential of PPPs to Advance Asia’s Infrastructure Development54
Delayed land acquisitions are a prominent barrier to PPP projects in developing Asia, particularly for the relocation of informal settlers and disputes between landowners and environmental groups. Under the law in the Philippines, acquiring rights-of-way for infrastructure projects must involve a court process. Right-of-way problems and high resettlement costs have delayed infrastructure PPP projects there, including the North Luzon Expressway Project, to improve the transport network between provinces and municipalities in North Luzon.
De Clerck and Demeulemeester (2014) point out that complex procurement procedures for PPP projects are bottlenecks to competition and keeping bidding costs manageable. Several empirical studies, including Carrillo et al. (2008), Chen and Doloi (2008), and Riedl et al. (2013), acknowledge that bidding for PPPs is expensive and that governments should be more selective in their choice of suppliers to reduce the uncertainty of a supplier’s performance. Soomro and Zhang (2013) argue that improper risk allocation is equally harmful to public and private sector partners for achieving project goals.
Harris (2003) examines reasons for the failure of electricity PPP projects, and finds problems in enforcing and maintaining cost recovery pricing policies, and in collecting payments owed by consumers or government off-takers. Water and sewerage PPPs face similar problems. The author finds the main reasons for the cancellation of telecommunication PPP projects are because cellular services are unable to attract enough customers, and because of government changes to the market’s structure.
Jandhyala (2016) identifies two main channels where multilateral development banks (MDBs) can lower PPP project risks. The first is through operational assistance to ensure that project contracts are thoroughly reviewed, and by encouraging greater supervision of project implementation. The second is through policy dialogue to positively influence PPP negotiations and help resolve project disputes between client governments and their private sector partners. PPP projects in which MDBs participate are likely to face lower project risks and be less likely to run into trouble or get cancelled. Applying a logit model to 2,117 infrastructure PPPs projects in 45 developing countries from 1995 to 2009, Jandhyala (2016) finds the odds of project distress with the participation of MDBs is 50% lower than for projects without their participation. Bhattacharyay (2010) finds that MDBs can help facilitate regional cooperation by providing public goods in neighboring countries.
Empirical evidence confirms that macroeconomic factors can determine the success or failure of PPP projects by affecting operations and profitability. Allport et al. (2008) cite an elevated railway PPP project in Thailand that faced

Assessing Risk in Public–Private Partnerships 55
severe financial problems from overly optimistic demand projections and failing to mitigate exchange rate risk. Another good example of macroeconomic risk is Kuala Lumpur’s light rail transit project, which failed because rising inflation during the Asian financial crisis hit profits and the concessionaires were unable to service the loans. The rising frequency and severity of natural disasters, and the effects of climate change, need to be addressed in PPP contracts and managed as a risk in infrastructure PPP projects.
Categorizing these and other hazards is important for managing risk in PPP projects. Ng and Loosemore (2006) group them in two basic categories: general risks (those not directly associated with a project), and project-related risks. Li et al. (2005) classify risks in three categories: (i) macro risks that are exogenous to a project but still have project impacts (for example, socioeconomic and political conditions); (ii) meso risks, which occur within the boundaries of a project (for example, risks related to project demand, design, and construction); and (iii) micro risks from the inherent differences between the public and private sector partners. Salzmann and Mohammed (1999) group risks into four categories: host country risks, investor risks, project risks, and project organization risks. Tah, Thorpe, and McCaffer (1993) categorize project risks based on the factors that affect contractors, and structure these factors into internal and external risks.
Data and Analytical FrameworkThis section discusses the variables used to proxy risk factors and determine the probability of a project failing. The World Bank’s Private Participation in Infrastructure Database is the primary data source for this analysis. The database does not contain all infrastructure projects with private investment, but it has the widest coverage of private investments in developing countries with project-related information. This study excludes full divestitures and merchant projects, whereby private sponsors build new infrastructure in liberalized markets, but get no government revenue or payment guarantees. Based on these criteria, 6,273 PPP projects are considered, including 2,819 PPP projects in developing Asia.
Each project contains the following information: host country, sector of investment, type and degree of private participation, project modality, duration, status, and financing. The project data are complemented with host country macroeconomic, socioeconomic, and political characteristics. The descriptive statistics are in Appendix A3.1. Although the World Bank’s Private Participation in Infrastructure Database tracks infrastructure investments from 1960 to 2016, this study uses projects from 1990 to 2015 to maximize compatibility with nonproject data.

Realizing the Potential of PPPs to Advance Asia’s Infrastructure Development56
The dependent variable is the survival time or duration of PPP infrastructure projects. All projects are grouped into two statuses: survivors (active projects) and failures (projects declared in distress or cancelled). The duration of failures is measured as the number of years from the financial closure year—that is, the year in which private sponsors entered into an agreement to invest funds or provide services—up to the year the project was cancelled or declared in distress. The duration for failures is completed when a project is declared in distress or cancelled.
The duration of survivors is measured by the number of years from the financial closure year up to the end of the measurement period in 2015. Because the duration of survivors has not been completed, and is unknown up to the end of the sample period, durations of survivors are treated as right-censored observations. Of the 2,819 PPP projects in developing Asia, 95% were active, 4% cancelled, and 1% distressed. Cancelled and distressed projects in Asia have an average duration of 4.5 years.
Independent variables include project- and country-specific variables. Control variables for projects include type of projects, project origination, method of awarding contracts, government contract level (national or provincial, for example), direct and indirect government support, level of private participation, and MDB support. For countries, variables include gross domestic product (GDP) growth per capita, terms of trade, trade and debt ratios, political risk, presence of PPP units, and whether there were natural disasters during the study period. These macroeconomic variables provide a measure of a country’s ability to withstand internal and external shocks, which create unexpected situations that can force PPP parties to renege on contract obligations.
To assess the political stability of the countries in this study, the PRS Group’s International Country Risk Guide’s political risk rating data are used.1 Data are annual averages for the duration of a project based on the two components of the guide’s political risk rating: law and order, and corruption. The law component measures the strength and impartiality of a country’s legal system; the order component assesses observance of the law. The corruption variable is an assessment of corruption in the political system. For both variables, the lower the score, the higher the risk, and vice versa.
Nonparametric Analysis: Kaplan-Meier Survival Curves
In survival analysis, it is very useful to look at Kaplan-Meier survival curves before proceeding to more complicated analyses to gain an insight into the intuitive graphical representation of the survival function for all the categorical variables. The Kaplan-Meier estimator is a nonparametric technique for
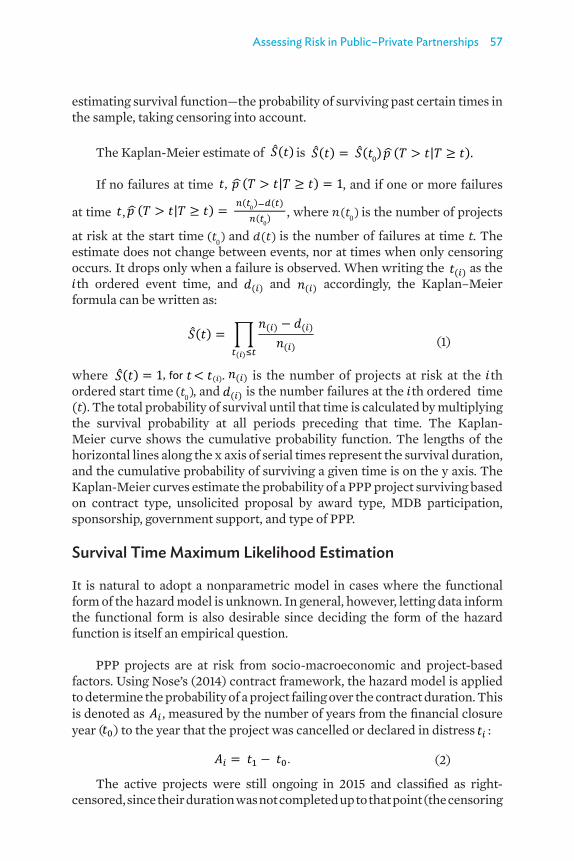
Assessing Risk in Public–Private Partnerships 57
estimating survival function—the probability of surviving past certain times in the sample, taking censoring into account.
The Kaplan-Meier estimate of | .
,
,
| ,
|
,
for
,
is | .
,
,
| ,
|
,
for
,
If no failures at time
| .
,
,
| ,
|
,
for
,
, and if one or more failures
at time
| .
,
,
| ,
|
,
for
,
,
| .
,
,
| ,
|
,
for
,
, where is the number of projects
at risk at the start time and is the number of failures at time t. The estimate does not change between events, nor at times when only censoring occurs. It drops only when a failure is observed. When writing the
| .
,
,
| ,
|
,
for
,
as the
| .
,
,
| ,
|
,
for
,
th ordered event time, and
| .
,
,
| ,
|
,
for
,
and
| .
,
,
| ,
|
,
for
,
accordingly, the Kaplan–Meier formula can be written as:
�̂�𝑆𝑆𝑆(𝑡𝑡𝑡𝑡) = �
𝑛𝑛𝑛𝑛(𝑖𝑖𝑖𝑖) − 𝑑𝑑𝑑𝑑(𝑖𝑖𝑖𝑖)
𝑛𝑛𝑛𝑛(𝑖𝑖𝑖𝑖)𝑡𝑡𝑡𝑡(𝑖𝑖𝑖𝑖)≤𝑡𝑡𝑡𝑡 (1)
where
| .
,
,
| ,
|
,
for
,
.
| .
,
,
| ,
|
,
for
,
is the number of projects at risk at the
| .
,
,
| ,
|
,
for
,
th ordered start time , and
| .
,
,
| ,
|
,
for
,
is the number failures at the
| .
,
,
| ,
|
,
for
,
th ordered time (t). The total probability of survival until that time is calculated by multiplying the survival probability at all periods preceding that time. The Kaplan-Meier curve shows the cumulative probability function. The lengths of the horizontal lines along the x axis of serial times represent the survival duration, and the cumulative probability of surviving a given time is on the y axis. The Kaplan-Meier curves estimate the probability of a PPP project surviving based on contract type, unsolicited proposal by award type, MDB participation, sponsorship, government support, and type of PPP.
Survival Time Maximum Likelihood Estimation
It is natural to adopt a nonparametric model in cases where the functional form of the hazard model is unknown. In general, however, letting data inform the functional form is also desirable since deciding the form of the hazard function is itself an empirical question.
PPP projects are at risk from socio-macroeconomic and project-based factors. Using Nose’s (2014) contract framework, the hazard model is applied to determine the probability of a project failing over the contract duration. This is denoted as
| .
,
,
| ,
|
,
for
,
, measured by the number of years from the financial closure year (
∗
∑ ∗
,
. The
,
2
,
) to the year that the project was cancelled or declared in distress
∗
∑ ∗
,
. The
,
2
,
:
∗
∑ ∗
,
. The
,
2
,
(2)
The active projects were still ongoing in 2015 and classified as right-censored, since their duration was not completed up to that point (the censoring

Realizing the Potential of PPPs to Advance Asia’s Infrastructure Development58
time is denoted as
∗
∑ ∗
,
. The
,
2
,
, which is the same for all contracts). If the duration is not censored, the density of
∗
∑ ∗
,
. The
,
2
,
is simply
∗
∑ ∗
,
. The
,
2
,
and the probability of
∗
∑ ∗
,
. The
,
2
,
is censored if
∗
∑ ∗
,
. The
,
2
,, and therefore the maximum likelihood estimate of can be obtained by maximizing the following log-likelihood function:
∗
∑ ∗
,
. The
,
2
, (3)
where
∗
∑ ∗
,
. The
,
2
,
is a censoring indicator. The covariates of project
∗
∑ ∗
,
. The
,
2
,
in sector
∗
∑ ∗
,
. The
,
2
,
in country
∗
∑ ∗
,
. The
,
2
,
are represented by
∗
∑ ∗
,
. The
,
2
,
. The
∗
∑ ∗
,
. The
,
2
,
are project-specific characteristics, including direct and indirect government support, procurement type, MDB involvement, share of private investment in the contract, proposal mode, and type of PPP.
Macroeconomic conditions,
∗
∑ ∗
,
. The
,
2
,
, include indicators that may affect PPP project operations, such as growth, trade openness, terms of trade, and political and institutional factors, including a country’s corruption and investment profile. The impact of natural disasters is also included, as some empirical findings recognize their effect on the growth of countries at different levels of economic development (Alano and Lee 2016), which can cause an increase in political conflict (Miguel, Satyanath, and Sergenti 2004). The regional fixed effects
∗
∑ ∗
,
. The
,
2
,
and a vector of dummies for sectoral affiliations
∗
∑ ∗
,
. The
,
2
,
need to be included in the likelihood function.
The hazard function
∗
∑ ∗
,
. The
,
2
,
can be estimated with maximum likelihood estimation,
∗
∑ ∗
,
. The
,
2
,
, following a Weibull distribution:2
∗
∑ ∗
,
. The
,
2
,
(4)
where
∗
∑ ∗
,
. The
,
2
,
is the measure of duration dependence.
Empirical ResultsTo complement the empirical distribution function, Kaplan-Meier curves are used to estimate the probability of a PPP project surviving in developing Asia and other developing regions (Figure 3.5). In developing Asia, this is estimated at above 90% during project contract periods; other developing regions have a lower estimated rate, at 77%.

Assessing Risk in Public–Private Partnerships 59
Figure 3.5: Kaplan-Meier Curve Estimates for PPP Projects in Developing Asia and Other Developing Regions
Developing Asia1.0
0.9
0.8
0.70 5 10
Number of years15 20 25
Surv
ival
(%)
Other Developing Regions1.0
0.9
0.8
0.70 5 10
Number of years15 20 25
Surv
ival
(%)
PPP = public–private partnership.
Note: Other developing regions include Latin America, the Caribbean, Sub-Saharan Africa, North Africa, and developing European countries.
Source: Authors.
The Kaplan-Meier curves consistently support the hazard analysis regression results. The survival rate will likely be higher when a local government is the implementing agency for an infrastructure PPP project rather than the national government (Figure 3.6). Solicited projects have a lower hazard rate than unsolicited projects; however, unsolicited projects that underwent competitive bidding have higher survival rates. The presence of a foreign sponsor or the participation of MDBs have a positive impact on a project’s survival rate. Government guarantees help PPP projects to be more viable. And greenfield projects have higher survival rates than other types of private participation.
Using the hazard regression analysis, Table 3.1 shows the baseline survival model of PPP projects with project variables and macroeconomic indicators for developing Asia. Based on the empirical results, more than 80% of PPPs financed by the private sector decrease the hazard rate of a project, although this is not significant. Local government PPP contracts significantly reduce failure rates. Local governments contribute to infrastructure development because they can best determine the kind of infrastructure projects that will benefit their constituents and the local economy.
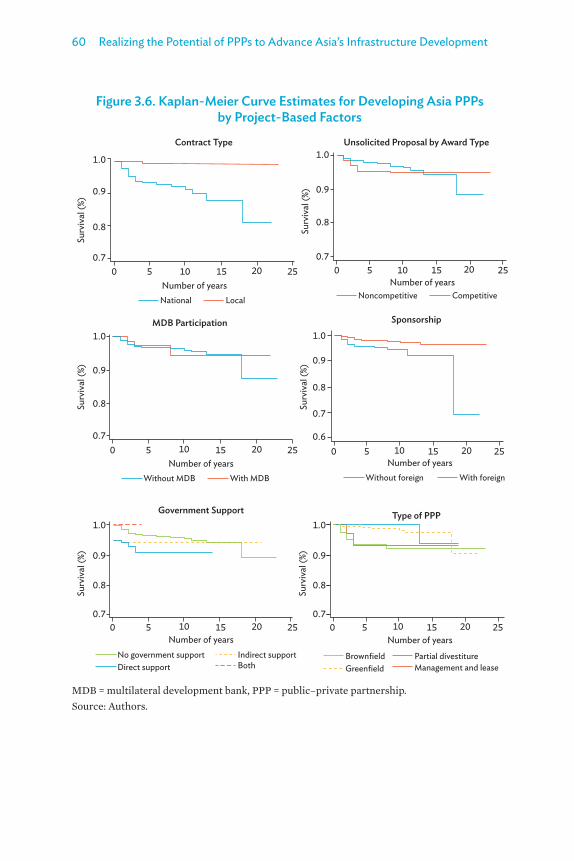
Realizing the Potential of PPPs to Advance Asia’s Infrastructure Development60
Figure 3.6. Kaplan-Meier Curve Estimates for Developing Asia PPPs by Project-Based Factors
Contract Type Unsolicited Proposal by Award Type
MDB Participation Sponsorship
Government Support Type of PPP
1.0
0.9
0.8
0.7
1.0
0.9
0.8
0.7
1.0
0.8
0.9
0.7
0.6
0 5 10Number of years
15 20 25
1.0
0.9
0.8
0.7
1.0
0.9
0.8
0.7
1.0
0.9
0.8
0.7
Surv
ival
(%)
Surv
ival
(%)
Surv
ival
(%)
Surv
ival
(%)
Surv
ival
(%)
Surv
ival
(%)
0 5 10 15 20 25
National Local
0 5 10Number of years
15 20 25
0 5 10 15 20 25 0 5 10 15 20 25
0 5 10 15 20 25
Without MDB With MDB
No government support Indirect supportDirect support Both
Brownfield Partial divestitureGreenfield Management and lease
Number of years
Number of years Number of years
Without foreign With foreign
Number of yearsNoncompetitive Competitive
MDB = multilateral development bank, PPP = public–private partnership.Source: Authors.

Assessing Risk in Public–Private Partnerships 61
Table 3.1: Parametric Hazard Regression for Developing Asia
Variable Coefficients Hazard Ratio
Private participation (private share >80%)
–0.368 0.692
(0.770) (0.533)
Local government contract –4.224*** 0.015***
(0.920) (0.014)
Solicited proposal –2.760*** 0.063***
(0.720) (0.046)
Unsolicited proposal through competitive bidding
–1.888*** 0.151***
(0.666) (0.101)
Multilateral development bank participation
–1.888** 0.151**
(0.784) (0.119)
Foreign sponsor –0.799* 0.45*
(0.467) (0.210)
Base = No government support
Direct government support –0.314 0.731
(0.422) (0.308)
Indirect government support –3.218*** 0.040***
(1.122) (0.045)
Base = Brownfield PPP
Greenfield PPP –3.086*** 0.046***
(0.746) (0.034)
Other PPP –1.274 0.28
(0.808) (0.226)
GDP per capita compounded growth rate
–0.414** 0.661**
(0.190) (0.126)
Terms of trade interaction with G3 growth rate
0.002 1.002
(0.005) (0.005)
% trade to GDP interaction with G3 growth rate
0.002 1.002
(0.003) (0.003)
Ratio of debt to GDP –0.095*** 0.91***
(0.027) (0.024)
Natural disaster occurrence 4.894*** 133.5***
(0.996) (132.9)
continued on next page

Realizing the Potential of PPPs to Advance Asia’s Infrastructure Development62
Variable Coefficients Hazard Ratio
Law and order –4.124** 0.016**
(1.742) (0.028)
Corruption –7.235*** 0.001***
(2.439) (0.002)
Base = No PPP unit
With 1 PPP unit –4.459*** 0.012***
(1.671) (0.019)
More than 1 PPP unit –4.824*** 0.008***
(1.537) (0.012)
/ln_p 1.337
(0.144)
p 3.807
(0.548)
1/p 0.263
(0.038)
Observations 1,201
GDP = gross domestic product, MDB = multilateral development bank, PPP = public–private partnership.
Notes: 1. Other PPP include management and lease contracts and partial divestiture. 2. G3 includes the United States, euro area, and Japan. *** p < 0.01 ** p < 0.05 * p < 0.10Source: Authors.
PPP projects are typically initiated through solicited or unsolicited proposals, and each follows a different process, which often leads to different levels of involvement between parties (AECOM Consult 2007). Solicited PPP projects, initiated by the public sector, have contributed significantly to the success of these projects because they are usually in sync with government development plans. Unsolicited proposals tend to gain less government support because they often do not meet the priority investment requirements of national infrastructure plans (Yun et al. 2015). For governments handling unsolicited proposals, one option to deal with this problem is through competitive bidding in which no bidder has a predefined advantage (World Bank 2002). In line with this, the interaction term between unsolicited projects and competitive schemes has a negative and significant effect on the hazard rate.
Table 3.1 continued

Assessing Risk in Public–Private Partnerships 63
The results show that the involvement of MDBs can significantly increase the success of projects in developing Asia. MDBs can play an important role in reducing funding gaps for infrastructure and, as earlier noted, for facilitating regional cooperation for the provision of public goods in neighboring countries. Further, PPP projects with foreign sponsors can reduce project failures, a result consistent with the findings of Reside (2009).
The results also suggest direct government subsidies and indirect support through guarantees can help PPP projects become more viable. Governments can bear some project risks by providing capital and revenue subsidies or in-kind contributions, such as land, favorable government policies to investment, and incentives (loan guarantees for subsovereign and nonsovereign borrowing, for example). The results confirm that the presence of at least one PPP unit can reduce a project’s hazard rate.
The model also includes different types of PPPs; for example, whether infrastructure was built or upgraded. Compared with projects that improve and expand existing infrastructure (brownfield), new infrastructure projects (greenfield) have negative and significant elasticity with the hazard rate. This differs from the findings of the World Bank (2016) that show greenfield projects are the most susceptible to renegotiation, largely because of their complexity and the risks they can carry, and that greenfield projects are more prone to improper selection criteria and procurement procedures. The results of our study can be explained by greenfield projects having greater design flexibility to meet project requirements and requiring less maintenance.
Theoretical approaches and the literature emphasize the relevance of fiscal, macroeconomic, and political factors in deciding whether to contract out. Intuitively, these factors can affect a project’s operation and outcomes. The results confirm several claims in the literature that robust economic growth leads to good project outcomes because demand for output rises. The average real GDP per capita growth during 1990–2015 had a negative and significant coefficient for the hazard rate; hence, economic development is also significant for project success. For country competitiveness, the positive impact from terms-of-trade growth and trade as percentage of GDP have no significant impact on the viability of PPP projects. Consistent with other findings, the occurrence of natural disasters in a country during contract periods increase the risk of projects failing.
Fiscal factors that influence PPP outcomes are investigated by Checherita (2009) and Hammami, Ruhashyankiko, and Yehoue (2006), among others. Similar to these studies, our results show that a higher ratio of debt to GDP has negative elasticity with a project’s hazard rate, and can significantly contribute

Realizing the Potential of PPPs to Advance Asia’s Infrastructure Development64
to project success. For institutional and political factors, indicators for law and order, and level of corruption, support the notion that more transparency and less corruption can significantly reduce a project’s hazard rate.
Table 3.2 shows the hazard ratio between developing Asia and other developing regions.3 A significant difference between the two regions is that, as the private sector’s share in PPP investments appears to get larger (above 80%), the hazard rate significantly increases, suggesting that a proper mix with public investments will help reduce risks. The participation of MDBs in the preparation of PPP projects may not significantly influence project success.
Table 3.2: Parametric Hazard Regression between Developing Asia and Other Developing Regions
Item Developing AsiaOther Developing
Regions
Variables Coefficients Hazard
ratio Coefficients Hazard
ratioPrivate participation (private share >80%)
–0.368 0.692 1.136* 3.113*(0.770) (0.533) (0.658) (2.048)
Local government contract
–4.224*** 0.015*** 0.024 1.024(0.920) (0.014) (0.467) (0.478)
Solicited proposal –2.760*** 0.063*** –3.042** 0.048**(0.720) (0.046) (1.395) (0.067)
Unsolicited proposal through competitive bidding
–1.888*** 0.151*** –0.581 0.56(0.666) (0.101) (0.506) (0.283)
Multilateral development bank participation
–1.888** 0.151** 0.376 1.456 (0.784) (0.119) (0.450) (0.655)
Foreign sponsor –0.799* 0.450* 0.597 1.816(0.467) (0.210) (0.492) (0.893)
Base = No government support
Direct government support
–0.314 0.731 –1.060 0.346(0.422) (0.308) (0.655) (0.227)
Indirect government support
–3.218*** 0.040*** –0.449 0.638(1.122) (0.045) (0.890) (0.568)
Base = Brownfield PPP Greenfield PPP –3.086*** 0.046*** –1.633*** 0.195***
(0.746) (0.034) (0.477) (0.093) Other PPP –1.274 0.28 –2.006** 0.135**
(0.808) (0.226) (0.812) (0.109)continued on next page

Assessing Risk in Public–Private Partnerships 65
Item Developing AsiaOther Developing
RegionsGDP per capita compounded growth rate
–0.414** 0.661** 0.097 1.102(0.190) (0.126) (0.107) (0.118)
Terms of trade interaction with G3 growth rate
0.002 1.002 0.011*** 1.011***(0.005) (0.005) (0.003) (0.003)
% trade to GDP interaction with G3 growth rate
0.002 1.002 –0.004* 0.996*(0.003) (0.003) (0.002) (0.002)
Ratio of debt to GDP –0.095*** 0.91*** –0.032*** 0.968***(0.027) (0.024) (0.012) (0.011)
Natural disaster occurrence
4.894*** 133.5*** 2.139*** 8.489***(0.996) (132.9) (0.571) (4.850)
Law and order –4.124** 0.016** 1.773** 5.887**(1.742) (0.028) (0.779) (4.587)
Corruption –7.235*** 0.001*** –7.916*** 0.000***(2.439) (0.002) (1.308) (0.000)
Base = No PPP unit With 1 PPP unit –4.459*** 0.012*** 1.161** 3.193**
(1.671) (0.019) (0.483) (1.543) More than 1 PPP
unit –4.824*** 0.008*** –2.161** 0.115**
(1.537) (0.012) (0.884) (0.102)/ln_p 1.337 1.05
(0.144) (0.141) p 3.807 2.858
(0.548) (0.403) 1/p 0.263 0.350
(0.038) (0.049) Observations 1,201 854
GDP = gross domestic product, PPP = public–private partnership.
Notes: 1. Standard errors in parentheses. 2. G3 includes the United States, euro area, and Japan. 3. Other developing regions include Latin America, the Caribbean, Sub-Saharan Africa, North
Africa, the Middle East, and developing European countries.*** p<0.01 ** p<0.05 * p<0.10
Source: Authors.
Table 3.2 continued

Realizing the Potential of PPPs to Advance Asia’s Infrastructure Development66
Policy ImplicationsThere is a big gap between the pace at which infrastructure is being built and upgraded in developing Asia, and the demand for more and better infrastructure that the region’s strong economic growth is creating. Insufficient finance remains a bottleneck to infrastructure across the region. The public sector should continue taking the lead in developing sustainable and resilient infrastructure to support economic development and well-being. But PPPs can bring real advantages to the provision of infrastructure through additional funding, more efficient management, and better public services. These partnerships, however, face considerable risks and challenges. Lack of project preparation and competitive systematic bidding methods, poor governance, misaligned priorities, the underrepresentation of the public sector in decision making, and lack of coordination and cooperation between partners are just some of the risks that PPPs commonly face.
The increased use of PPPs for infrastructure since the mid-1990s has been accompanied by a rise in contract disputes between public and private sector partners. And the cost has been high: the renegotiation and termination of PPP contracts impede infrastructure development, disrupt public services, discourage private investments, and increase risk premiums. That said, the chances of a PPP project in developing Asia surviving are good, estimated at about 90% during the contract period. MDBs can contribute to infrastructure development nationally and regionally, and reduce PPP project risks. Because the involvement of multilateral partners in PPP contracts reduces the risk of disputes, MDBs play an important role in narrowing funding gaps. While MDBs can support the expansion of infrastructure and play a vital role in mitigating risks in infrastructure PPP projects in developing Asia, the public sector should lead the PPP process.
Governments can bear some PPP project risks by providing capital and revenue subsidies. Direct government subsidies and indirect support through guarantees can help projects become more viable. Solicited projects have made a significant contribution to infrastructure development in the region, but unsolicited projects remain a concern because of their higher failure rates. These can, however, be brought down by more competitive bidding processes. Greenfield projects are at a lower risk of cancellation than brownfield ones because greenfield agreements allow governments to divest themselves of design, construction, and market risks.
The results of our empirical analysis confirm the literature showing that robust economic growth leads to good PPP project outcomes, as demand for output rises. The high average real GDP per capita growth during the 1990–2015 analysis period had a negative and significant coefficient for the hazard

Assessing Risk in Public–Private Partnerships 67
rate of PPP projects. For fiscal and institutional factors, higher ratios of debt to GDP have a negative elasticity with the hazard rate of projects. Strong legal systems and a low level of corruption reduce the hazard rate. Beyond the analysis, PPP projects in developing Asia will increasingly be affected by the rising frequency and ferocity of weather disasters, and the impact of climate change. And this will have significant policy implications.
Notes1. The International Country Risk Guide’s rating has 22 variables in three risk categories
(political, financial, and economic) for 140 countries during 1984–2016. This study uses only the political risk rating data.
2. Lee et al. (2018) show that Weibull and Cox proportional hazard models yield very similar results, which is in line with the observation of Adejumo and Ahmadu (2016) that, as the sample size increases, the mean squared errors of the maximum likelihood estimates of proportional hazard function of both the Weibull and Cox proportional hazard models are approximately the same. Model selection tests conducted also revealed that the Weibull distribution is more parsimonious than other models, achieving both a higher log likelihood and a lower Akaike information criterion score.
3. Other developing regions include Latin America, the Caribbean, Sub-Saharan Africa, North Africa, the Middle East, and developing European countries.

Realizing the Potential of PPPs to Advance Asia’s Infrastructure Development68
Appendix A3.1: Descriptive Statistics
Variable Mean Std. Dev. Minimum Maximum
MDB participation 0.06 0.24 0.00 1.00
Solicited proposal 0.30 0.46 0.00 1.00
Interaction of unsolicited proposals and competitive schemes
0.32 0.47 0.00 1.00
Direct government support 0.15 0.36 0.00 1.00
Indirect government support
0.13 0.34 0.00 1.00
Direct and indirect government support
0.00 0.04 0.00 1.00
Greenfield projects 0.67 0.47 0.00 1.00
Management, contract lease, and partial divestitures
0.08 0.28 0.00 1.00
Private participation dummy (private participation > 80% = 1; 0 otherwise)
0.75 0.43 0.00 1.00
Local government contract 0.68 0.47 0.00 1.00
Foreign sponsor 0.66 0.47 0.00 1.00
GDP per capita compounded growth rate
6.28 2.21 −2.58 19.02
Terms of trade compounded growth rate interacted with G3 compounded growth rate
49.96 104.77 –140.52 439.01
% of trade to GDP compounded growth rate interacted with G3 compounded growth rate
–58.58 131.62 –612.55 103.55
Debt-to-GDP ratio 46.55 20.54 5.87 89.41
Natural disaster occurrence ratio
1.11 0.30 0.14 2.00
Law and order 1.18 0.80 0.06 4.05
Corruption 0.68 0.44 0.05 2.15
GDP = gross domestic product, MDB = multilateral development bank.Note: G3 includes the United States, euro area, and Japan.Source: Authors.

Assessing Risk in Public–Private Partnerships 69
References
ADB (Asian Development Bank). 2008. Public–Private Partnership Handbook. Manila.
Adejumo, Adebowale O. and Ahmadu A. Oshioke. 2016. A Study of the Slope of Cox Proportional Hazard and Weibull Models: Simulated and Real Life Data Approach. Science World Journal 11 (3): pp. 31–35.
AECOM Consult. 2007. User Guidebook on Implementing Public–Private Partnerships for Transportation Infrastructure Projects in the United States. Arlington, VA: Federal Highway Administration.
Ahmad, Ehtisham, Amar Bhattacharya, Annalisa Vinella, and Kezhou Xiao. 2014. Involving the Private Sector and PPPs in Financing Public Investments: Some Opportunities and Challenges. Asia Research Centre Working Paper 67. Murdoch, Australia: Asia Research Centre.
Alano, Emmanuel and Minsoo Lee. 2016. Natural Disaster Shocks and Macroeconomic Growth in Asia. ADB Economics Working Paper Series No. 503. Manila: ADB.
Albalate, Daniel, Germà Bel, and Richard R. Geddes. 2015. Do Public–Private Partnership Enabling Laws Increase Private Investment in Infrastructure? http://www.econ.pitt.edu/sites/default/files/Geddes.PPPlaws.pdf.
Allport, Roger, Richard Brown, Stephen Glaister, and Tony Travers. 2008. Success and Failure in Urban Transport Infrastructure Projects. https://www.imperial.ac.uk/media/imperial-college/research-centres-and-groups/centre-for-transport-studies/Success-and-Failure-in-Urban-Transport-Infrastructure-Projects.pdf.
Bhattacharyay, Biswa Nath. 2010. Financing Asia’s Infrastructure: Modes of Development and Integration of Asian Financial Markets. ADBI Working Paper Series No. 229. Tokyo: Asian Development Bank Institute (ADBI).
Carrillo, Patricia, Herbert Robinson, Peter Foale, Chimay Anumba, and Dino Bouchlaghem. 2008. Participation, Barriers and Opportunities in PFI: The United Kingdom Experience. Journal of Management in Engineering 24: pp. 138–145.
Realizing the Potential of PPPs to Advance Asia’s Infrastructure Development70
Checherita, Cristina D. 2009. A Macroeconomic Analysis of Investment under Public–Private Partnerships and Its Policy Implications: The Case of Developing Countries. PhD dissertation, George Mason University.
Chen, Chuan and Hemanta Doloi. 2008. BOT Application in China: Driving and Impeding Factors. International Journal of Project Management 26: pp. 388–398.
De Clerck, Dennis and Erik Demeulemeester. 2014. Towards a More Competitive PPP Procurement Market: A Game-Theoretical Analysis. FEB Research report KBI_1408. Leuven, Belgium: KU Leuven, Faculty of Economics and Business.
Di Lodovico, Amadeo Maria. 1998. Privatization and investment under weak regulatory commitment. PhD dissertation, University of California, Berkeley, CA
EIU (Economist Intelligence Unit). 2015. Evaluating the Environment for Public–Private Partnerships in Asia-Pacific: The 2014 Infrascope. London.
Hammami, Mona, Jean-Francois Ruhashyankiko, and Etienne B. Yehoue. 2006. Determinants of Public–Private Partnerships in Infrastructure. IMF Working Paper No. 06/99. Washington, DC: International Monetary Fund.
Harris, Clive. 2003. Private Participation in Infrastructure in Developing Countries: Trends, Impacts, and Policy Lessons. World Bank Working Paper Series No. 5. Washington, DC: World Bank.
Ismail, Suhaiza and Fatimah Harris. 2014. Challenges in Implementing Public–Private Partnership (PPP) in Malaysia. Procedia: Social and Behavioral Sciences 164 (August): pp. 5–10.
Jamali, Dima. 2004. Success and Failure Mechanisms of Public Private Partnerships (PPPs) in Developing Countries: Insights from the Lebanese Context. International Journal of Public Sector Management 17 (5): pp. 414–430.
Jandhyala, Srividya. 2016. International Organizations and Political Risk: The Case of Multilateral Development Banks in Infrastructure Projects. https://ppi.worldbank.org/~/media/GIAWB/PPI/Documents/Misc/The-case-of-multilateral-development-banks-by-Jandhyala2016.pdf.
Assessing Risk in Public–Private Partnerships 71
Lee, Minsoo, Xuehui Han, Pilipinas F. Quising, and Mai Lin Villaruel. 2018. Hazard Analysis on Public–Private Partnership Projects in Developing Asia. ADB Economics Working Paper Series. Manila: ADB.
Li, Bing, Akintola Akintoye, Peter Edwards, and Cliff Hardcastle. 2005. The Allocation of Risk in PPP/PFI Construction Projects in the UK. International Journal of Project Management 23 (1): pp. 25–35.
Li, Jie and Patrick Zou. 2008. Risk Identification and Assessment in PPP Infrastructure Projects Using Fuzzy Analytical Hierarchy Process and Life-Cycle Methodology. Construction Economics and Building 8 (1).
Miguel, Edward, Shanker Satyanath, and Ernest Sergenti. 2004. Economic Shocks and Civil Conflict: An Instrumental Variables Approach. Journal of Political Economy 112 (4): pp. 725–753.
Moszoro, Marian, Gonzalo Araya, Fernanda Ruiz-Nuñez, and Jordan Schwartz. 2014. Institutional and Political Determinants of Private Participation in Infrastructure. Discussion Paper 2014.15. Paris: Organisation for Economic Co-operation and Development.
Ng, Angie and Martin Loosemore. 2006. Risk Allocation in the Private Provision of Public Infrastructure. International Journal of Project Management 25 (1): pp. 66–76.
Nijkamp, Peter, Marc van der Burch, and Gabriella Vidigni. 2002. A Comparative Institutional Evaluation of Public–Private Partnerships in Dutch Urban Land-Use and Revitalization Projects. Urban Studies 39 (10): pp. 1865–1880.
Nose, Manabu. 2014. Triggers of Contract Breach: Contract Design, Shocks, or Institutions? World Bank Policy Research Working Paper No. 6738. Washington, DC: World Bank.
OECD (Organisation for Economic Co-operation and Development). 2012. Recommendation of the Council on Principles for Public Governance of Public–Private Partnerships. Paris.
Pongsiri, Nutavoot. 2002. Regulation and Public–Private Partnerships. International Journal of Public Sector Management 15 (6): pp. 487–495.
PRS Group. 2012. International Country Risk Guide Methodology. https://www.prsgroup.com/wp-content/uploads/2012/11/icrgmethodology.pdf.

Realizing the Potential of PPPs to Advance Asia’s Infrastructure Development72
Reside, Renato. 2009. Global Determinants of Risk and Stress in Public–Private Partnerships in Infrastructure. ADBI Discussion Paper No. 133. Tokyo: ADBI.
Reyes-Tagle, Gerardo and Karl Garbacik. 2016. Policymakers’ Decisions on Public–Private Partnership Use: The Role of Institutions and Fiscal Constraints. IDB Technical Note 1169. Washington, DC: Inter-American Development Bank.
Riedl, Dominik F., Lutz Kaufmann, Carsten Zimmermann, and Johan L. Perols. 2013. Reducing Uncertainty in Supplier Selection Decisions: Antecedents and Outcomes of Procedural Rationality. Journal of Operations Management 31 (1): pp. 24–36.
Rockart, John F. 1982. The Changing Role of Information System Executive: A Critical Success Factors Perspective. Sloan Management Review 24 (1): pp. 3–13.
Salzmann Astrid Juliane, and Salah Mohamed. 1999. Risk Identification Frameworks for International BOOT Projects. Paper presented at the Profitable Partnering in Construction Procurement Conference, Chiang Mai, Thailand.
Samii, Ramina, Luk van Wassenhove, and Shantanu Bhattacharya. 2002. An Innovative Public–Private Partnership: New Approach to Development.World Development 30 (6): pp. 991–1008.
Scharle, Peter. 2002. Public Private Partnerships as a Social Game. Innovation 15 (3): pp. 227–252.
Spackman, Michael. 2002. Public–Private Partnerships: Lessons from the British Approach. Economic Systems 26 (3): pp. 283–301.
Soomro, Mohsin and Xueqing Zhang. 2013. Failure Links between Public and Private Sector Partners in Transportation Public–Private Partnerships Failures. Journal of Traffic and Logistics Engineering 1 (2).
Tah, Joseph, Antony Thorpe, and Ronald McCaffer. 1993. Contactor Project Risks Contingency Allocation Using Linguistic Approximation. Computing System in Engineering 4 (2–3): pp. 281–293.

Assessing Risk in Public–Private Partnerships 73
Tiong, Robert L. K. 1996. CSFs in Competitive Tendering and Negotiation Model for BOT Projects. Journal of Construction Engineering and Management 122 (3): pp. 205–211.
Trebilcock, Michael and Michael Rosenstock. 2015. Infrastructure Public–Private Partnerships in the Developing World: Lessons from Recent Experience. Journal of Development Studies 51 (4): pp. 335–354.
World Bank. 2002. Unsolicited Proposals: Competitive Solutions for Private Infrastructure. Viewpoint. Washington, DC.
———. 2007. Public-Private Partnership Units: Lessons for Their Design and Use Infrastructure. Washington, DC.
———. 2016. The State of PPPs: Infrastructure Public–Private Partnerships in Emerging Markets and Developing Economies 1991–2015. Washington, DC.
Yun, Sungmin, Wooyong Jung, Seung Heon Han, and Heedae Park. 2015. Critical Organizational Success Factors for Public Private Partnership Projects: A Comparison of Solicited and Unsolicited Proposals. Journal of Civil Engineering and Management 21 (2): pp. 131–143.
Zhang, Xueqing. 2005. Critical Success Factors for Public–Private Partnerships in Infrastructure Development. Journal of Construction Engineering and Management 131 (1).
Zouggari, Mounir. 2003. Public–Private Partnership: Major Hindrances to the Private Sector’s Participation in the Financing and Management of Public Infrastructures via Delegated Management. International Journal of Water Resources Development 19 (2): pp. 123–29.


PART II
Mobilizing Finance for Public-Private Partnerships


CHAPTER 4
Factors Influencing Bank Project Financing of Infrastructure Public–Private Partnership Projects in Developing Asia
Vivek Rao
IntroductionThis chapter examines the factors influencing bank lending for project financing infrastructure public–private partnerships (PPPs) in developing Asia. Given the size of developing Asia’s infrastructure investment gap and the financing requirements to close it, the role of the private sector is becoming increasingly important for meeting the region’s infrastructure needs. The private sector’s role in this effort is largely through PPPs, which require debt and equity investments in project-specific special purpose vehicles (SPVs).
To promote project financing through PPPs, regulatory, legal, institutional, and finance sector reforms are required (Vecchi et al. 2017; OECD 2014). Although PPPs are high on the agenda of several governments and companies, their popularity varies across sectors and locations. Understanding the incentives for stakeholders in a PPP transaction is essential to this issue. PPPs can help overcome some major obstacles to building and upgrading infrastructure, including insufficient funding, poor planning and project selection, inefficient or ineffective service delivery, and inadequate maintenance (World Bank 2014).
Assuming superior technical and servicing capacity by private parties, PPPs can improve the quantity and quality of service delivery, thereby creating better value for money compared with traditional public procurement (Vecchi et al. 2017). For bundled contracts, project sponsors have an incentive to incur high capital costs during construction to reduce operation and maintenance costs, leading to improved productive efficiency. These gains are needed to compensate for the higher costs of private finance resulting from improvements in an infrastructure’s design, construction, and operation. Further, PPPs can be an attractive opportunity for institutional investors, though this depends on the sector, asset, and location. According to the World Economic Forum

Realizing the Potential of PPPs to Advance Asia’s Infrastructure Development78
(WEF), the demands of global institutional investors seeking diversified portfolios with attractive returns incentivized the launch of infrastructure funds, which have contributed to the financialization” of infrastructure. As the WEF argues, “infrastructure project risk-return profiles present an attractive alternative investment—especially with real fixed income returns being near zero in the wake of the global financial crisis” (WEF 2013).
This chapter fills a void in the literature on the determinants of bank lending to infrastructure PPP projects, which are examined for seven countries: India, Indonesia, Malaysia, the Philippines, the Republic of Korea, Thailand, and Viet Nam. This is possibly the only academic contribution that explicitly analyzes how the economic fundamentals of banking (capital levels, profitability, asset riskiness, and cost efficiency) affect infrastructure project finance lending and, through this lending, the amount of debt provided to infrastructure financing in developing Asia.
The foundations of this research and the basis for the empirical analysis are derived from a literature review that focuses on the entire range of issues that can affect bank lending for project-finance type investments in infrastructure PPPs. After the literature review, the chapter discusses the requirements and sources of data, provides broad diagnostics on the data, analyzes the estimation of the empirical model, and discusses policy implications and guidance for further research. The findings suggest that financing infrastructure PPP projects is still in its infancy in the countries covered in this chapter, and that banks are guided more by macroeconomic risk factors and the strength of their balance sheets. By contrast, the comparative analysis of mature PPP markets stresses the transaction-based nature of bank lending.
Literature ReviewBanks typically finance the early stages of infrastructure project finance transactions. Bank loans have several advantages over bonds or other structured instruments because (i) banks provide an important monitoring role; (ii) infrastructure projects require funds to be gradually disbursed and bank lending has the flexibility for this; and (iii) infrastructure projects are more likely to need debt restructuring during unforeseen events, and banks can quickly negotiate this (Esty and Megginson 2003). Banks also take on a higher level of project risk during construction, which lessens in the operation phase when bond financing and other structured instruments are more attractive for long-term investors in this asset class (Gatti 2012).
Several factors that potentially influence bank lending to PPP infrastructure projects emerge from the literature. These include monetary

Factors Influencing Bank Project Financing of Infrastructure PPP Projects 79
policy, bank-specific characteristics, project risks, and national PPP policies, which are discussed in this section. The literature also covers (i) the role of nonfinancial contracts in mitigating project risks; (ii) banks’ nonperforming loans and profitability; (iii) the availability of risk mitigation instruments for infrastructure projects; (iv) the reputation of sponsors and lead arrangers in syndicated project finance transactions; and (v) the depth and liquidity in complementary financing markets, such as the capital markets.
Monetary Policy
In an influential paper, Bernanke and Gertler (1995) point out that the credit channel for monetary transmission works through the supply side, and amplifies the more traditional “money channel.” When a central bank tightens monetary policy by squeezing reserves, it generates a corresponding reduction in the supply of bank loans. But this results in a real contraction only if banks cannot costlessly change the composition of their liabilities by issuing certificates of deposits or bonds, and firms cannot shift to bonds and commercial papers. The money channel emphasizes the impact of monetary tightening on balance sheets and on asset prices, and consequently the market value of wealth.
Kashyap and Stein (1994) show that, as with firms, banks cannot seamlessly generate loanable funds when tighter monetary policy restricts their ability to generate loans from deposits. The alternative avenues for banks to raise funds include large-denomination certificates of deposit, medium-term notes, and other securities that are not subject to regulatory restrictions. The authors point out, however, that these securities are not subject to deposit insurance and similar arrangements, and can only be issued at higher costs and to investors with different risk appetites. Because of capital market imperfections, shocks to the deposit base cannot be frictionlessly offset with other sources of financing, and they, therefore, translate into real effects on lending behavior.
Disyatat (2010) questions the link between bank deposits and the money multiplier (credit channel), suggesting that the ability or willingness of banks to provide credit is influenced more by bank capital and the risk to bank balance sheets. The bank lending channel can also be reinforced by the impact of monetary policy on perceptions of risk and willingness to bear risk. The case for these links has been put forward by Bernanke and Gertler (1995) and Borio and Zhu (2008). The latter call this mechanism the “risk-taking channel.”1 One avenue through which these effects may work is the impact of interest rates on financial buffers or the perceived vulnerability of agents to future economic shocks. For example, policy tightening may raise perceptions that firms are at risk because of increasing tensions on cash flows
Realizing the Potential of PPPs to Advance Asia’s Infrastructure Development80
and weakening balance sheets. Expectations of slower economic activity may raise the risk of bankruptcy. As emphasized earlier, the procyclical behavior of estimates of default probabilities and loss in the event of a default can also be a manifestation of the influence of risk perceptions that is driven in part by monetary policy. The level of interest rates may also influence riskier behavior: when interest rates are low, the search for yield leads to increased investments in riskier assets, as downside risks are downplayed.
The role of monetary policy in response to inflation also affects project financials and bank lending. The impact of inflation, as analyzed by Visconti (2012), occurs through the relative impact on the weighted average cost of capital and the net present value. Given this, inflation unambiguously increases the denominator in the net present value equation and so reduces the net present value. Inflation also increases the cost of debt (as bank debt is floating and indexed to inflation) and, therefore, increases the weighted average cost of capital. Thus, a very real scenario presents itself: with higher inflation, the weighted average cost of capital may exceed net present value, and could result in equity as well as cash burnout.
Bank Factors
PPP infrastructure projects require equity and debt financing. While banks play a significant role in infrastructure financing, they are challenged by inherent asset–liability mismatches because they typically have short-term liabilities and infrastructure financing involves long-term assets (Ma 2016). And since financing requirements are large, loans are often syndicated because of regulated limits on single-party exposure.
Pham (2015) analyzes a broad range of potential factors on the determinants of bank credit, using data on 146 countries during 1990–2013. The results suggest that factors restricting credit supply include nonperforming assets, capital requirements, and bank concentration. The results, however, find no evidence on the impact of return on equity and return on assets on the supply of bank credit. In a related paper, Mirzaei and Mirzaei (2011) show that the ratio of cost to income and the capital ratio are the main determinants of profitability, suggesting that higher levels of capitalization reduce funding costs for banks. A major finding of their study is the significant negative relationship between profitability and the ratio of net loans to short-term deposits. This indicates that lending based on short-term deposits negatively affects the profitability of banks.
Kirti (2017) suggests that the liability structure of banks drives the interest-rate exposure of assets, implying that banks with more floating-rate liabilities make more floating-rate loans. The results establish an important link between

Factors Influencing Bank Project Financing of Infrastructure PPP Projects 81
the funding structure of intermediaries and the types of contracts used by nonfinancial forms. The author shows that banks achieve this by passing on the interest rate risk to firms.2 Two other works advance related arguments. Ivashina, Scharfstein, and Stein (2012) argue that hedging frictions make it advantageous for banks to lend in the same currency as their deposit financing. Hanson et al. (2014) argue that the types of assets intermediaries hold depend on the stability of their funding. More broadly, Kirti (2017) is also connected with the view that there are synergies between deposits and commitments (Kashyap, Rajan, and Stein 2002), and that intermediaries must themselves be incentivized to conduct bank monitoring (Diamond 1984; Holmström and Tirole 1998).
How Project Risks Affect Lenders
The allocation and management of risks in PPP project finance transactions and general-purpose corporate lending differ. Because project finance lenders are dependent on project cash flows, and do not have recourse to the sponsor’s balance sheets, their short-term exposure can put pressure on a project’s early stages and increase the risk of default (Sorge and Gadanecz 2004). This contrasts with corporate finance lending. Here, shorter maturities are considered less risky, suggesting that the standard upward sloping relationship between credit risk and loan maturity may not apply to project finance. The construction and operation phases of infrastructure projects are each characterized by specific risks and mitigants. It is therefore likely that incrementally extending loan maturities after the scheduled time for a project to be operational might drive up ex ante risk premiums, but at a decreasing rate, based on the risk allocation mechanism and availability of mitigants, such as guarantees.
Governments can also use credit-enhancement tools to promote PPP bankability; for example, in a minimum payment guarantee to reduce demand risk where the contracting authority guarantees a minimum revenue. The minimum revenue guarantee is generally enough to cover debt servicing at some level of the debt service coverage ratio or to reach a minimum return. A guarantee that services the principal and interest in the case of default can also be used. This approach is widely used to mitigate default risk, and it reduces the need for lenders to make fresh exposures to stressed projects (Vecchi et al. 2017).3
Corielli, Gatti, and Steffanoni (2010) analyze nonfinancial contracts with third parties that reduce the credit risk to lenders and lower financing costs. These contracts include (i) purchasing agreements that guarantee raw material to SPVs at predefined quantities, quality, and prices (raw material cost and availability risk shifting); (ii) off-take agreements that enable SPVs to

Realizing the Potential of PPPs to Advance Asia’s Infrastructure Development82
sell part or all of their output to parties who commit to buy at predetermined prices and for a given period (market risk shifting); and (iii) operation and maintenance agreements to provide SPVs with a level of maintenance that is compliant with predefined service agreements. The authors find evidence showing that, although nonfinancial contracts lower the risk profile of PPP projects, lenders may be unwilling to reduce rates if the sponsor is a contract counterparty.
The Structure of PPP Project Finance
The project finance structure underlying PPP projects is a response to the agency problem arising from the differing and conflicting interests of various parties—sponsors and investors, lenders, contractors, suppliers, and government—in these partnerships. For the structure of PPP project finance, complex contracts and financing arrangements distribute the different risks among these parties.
In this context, Brealey, Cooper, and Habib (1996) argue that the widespread use of bank finance and the limited use of bond finance in PPP project finance is a response to the agency problem, and the consequent need to closely monitor infrastructure PPP projects in their early stages. The role of bank and bond investors follows the ownership structures of these two types of financing. The concentrated ownership of bank debt encourages lending banks to devote considerable resources to evaluating and monitoring projects on a continuing basis. It also facilitates the renegotiation of the debt should a project company encounter servicing problems. By contrast, the diffused nature of bond ownership makes it difficult to take concerted action if covenants are breached or if they require modification.
The contract structure of PPP project finance also has implications on incentives and project costs. Blanc-Brude, Goldsmith, and Välilä (2006) draw from insights provided by Hart (2003) on bundling and unbundling project contracts to provide evidence confirming that PPP projects cost more than traditionally procured projects. Their empirical results show a 24% increase in the capital costs of PPP projects. On balance, while unbundling will clearly reduce productive efficiency, the reduction in allocative efficiency for bundling may be balanced by improvements in productive efficiency. The ability to contract out investments also plays a role in choosing between bundled and unbundled contracts. Unbundling is superior if the investment associated with productive efficiency can be contracted out, but the investment associated with allocative efficiency cannot be contracted out. The converse is true if the investment for allocative efficiency can be contracted out.

Factors Influencing Bank Project Financing of Infrastructure PPP Projects 83
Methodology and Data This empirical analysis uses data from Thomson One Banker for project information on bank-financed infrastructure PPP deals from 2011 to 2016 in India, Indonesia, Malaysia, the Philippines, the Republic of Korea, Thailand, and Viet Nam. For a project to be included in the dataset, complete information on project name, type, and sector; financial close date; cost; gearing ratio; and borrower name is required. After excluding five all equity-financed projects, the dataset yields 483 projects. Their combined costs total $163.3 billion, with total project debt (calculated by multiplying the cost of a project by its gearing ratio) of $133.3 billion. This corresponds to an average gearing ratio of 82%, which confirms the highly leveraged nature of project finance transactions in the seven Asian countries. Data from Thomson One Banker are then retrieved on loan characteristics (tranches); these include loan amount, maturity, currency, type of security, and banks (mandated arrangers by ultimate parent). The data show that projects are typically funded by more than one tranche, and only information for term loans is retained. The reason is that the tranches of syndicated financing are allocated for construction, and thus capture the essence of projects to support long-term infrastructure investments. Based on this information, consistent data on 413 projects funded by 108 unique banks through 626 term loans are extracted.
Next, data on bank balance sheet items for mandated arrangers are taken from Orbis Bank Focus. These include (i) the tier 1 capital ratio as a proxy for capital adequacy, (ii) the return of average assets as a proxy for earnings quality, (iii) loans (over total assets) and impaired loans (over gross loans) as proxies for asset quality, (iv) the ratio of liquid to total assets as a proxy for liquidity, and (v) the ratio of cost to income as a proxy for efficiency. Balance sheet items are measured during the same year as the project’s financial close. The quality of balance sheet information varies across items. While the return on average assets and the ratio of cost to income are reported by most banks (82%), the tier 1 capital ratio is available for a smaller set of banks (60% of observations). Since no information about each arranger’s participation in a loan tranche is available, it is assumed that banks take equal shares in providing funds.4 Thus, for each project, the balance sheet items of banks are syndicate averages of bank-level items.5 At this stage, loans (and therefore projects), for which balance sheet items are unavailable for all the banks in the syndicate, are removed from the sample. The final sample consists of 244 projects funded by 88 unique banks through 367 loans. These projects represent about 45% of the sample in terms of the total project cost of $74.4 billion and total debt of $57.2 billion.
Table 4.1 breaks down these projects by country, with India accounting for the largest number of projects in the dataset. In terms of economic value,

Realizing the Potential of PPPs to Advance Asia’s Infrastructure Development84
however, country representation differs when considering the number of projects. While India still accounts for almost 50% of total project companies and project debt, the size of projects financed in Indonesia and Viet Nam are, on average, significantly larger.
Table 4.1: Project Finance Deals by Country
Country
Project Cost
($ billion)
Percent of Total Project
CostDebt
($ billion)
Percent of Total
DebtNo. of
Projects
Percent of Total Projects
India 35.0 47.1 27.2 47.5 118 48.4Indonesia 7.3 9.9 5.9 10.3 13 5.3Korea, Republic of 5.6 7.5 4.9 8.6 20 8.2Malaysia 3.8 5.1 3.1 5.4 10 4.1Philippines 3.6 4.9 2.8 4.9 6 2.5Thailand 6.7 9.0 6.0 10.5 72 29.5Viet Nam 12.2 16.4 7.4 12.9 5 2.0Total 74.4 57.2 244
Source: Author’s estimates, based on Thomson One Banker.
Based on the description in Thomson One Banker, the 244 projects are grouped into five sectors. The sector classification in Table 4.2 shows that energy accounts for most projects, followed by transport, mining, and oil and gas. While there are relatively few manufacturing projects, their average size in terms of cost and debt is significantly larger than projects in other sectors. Consequently, manufacturing accounts for about 25% of total cost of the sample projects.
Table 4.2: Project Finance Deals by Sector
Sector
Project Cost
($ billion)
Percent of Total Project
CostDebt
($ billion)No. of
Projects
Percent of Total Projects
Energy 31.7 42.6 26.2 158 64.8Manufacturing 18.6 25.0 11.9 11 4.5Mining, oil and gas 9.8 13.2 7.4 24 9.8Transport 13.7 18.4 11.0 45 18.4Others 0.6 0.8 0.6 6 2.5Total 74.4 57.2 244
PPP = public–private partnership.Note: Most infrastructure PPP projects are project financed, but it is not the case that most project finance deals are for infrastructure PPP projects. Source: Author’s estimates, based on Thomson One Banker.

Factors Influencing Bank Project Financing of Infrastructure PPP Projects 85
Most projects are financed by a single bank. About 25% of projects in the sample have two mandated arrangers. Overall, there are 90 unique syndicates, of which 16 are single banks. Table 4.3 shows the rankings for the top 10 banks in terms of projects funded and debt composition. The leading bank for project lending is Thailand’s Kasikornbank PCL, which financed 54 projects (21 of them as single financer). State Bank of India was the next most-active bank, participating in 43 deals, 34 of them as single financier. In terms of economic value, State Bank of India alone accounts for 24% of total debt in the sample. The involvement of banks headquartered outside the target countries was more limited, with only three banks—Mitsubishi UFJ Financial Group Inc., Standard Chartered Bank PLC, and Sumitomo Mitsui Financial Group Inc.—making it in the rankings.
Table 4.3: Project Finance Deals by Ranking
Ranking by Number of Projects
Ranking by Total amount of Debt Financed
Name of BankNo. of
Projects Name of Bank
Debt Financed ($ billion)
Kasikornbank (Thailand) 54 State Bank of India 13.78
State Bank of India 43 Axis Bank 5.34
Axis Bank (India) 26 Korea Development Bank 2.66
Sumitomo Mitsui Financial Group (Japan)
21 IDBI Bank (India) 1.75
Korea Development Bank (Republic of Korea)
20 Kasikornbank 1.66
Mitsubishi UFJ Financial Group (Japan)
19 Sumitomo Mitsui Financial Group
1.54
Siam Commercial Bank (Thailand)
17 Yes Bank 1.48
Yes Bank (India) 17 Standard Chartered 1.37
Standard Chartered (United Kingdom)
16 Mitsubishi UFJ Financial Group
1.31
Krung Thai Bank (Thailand)
15 China Development Bank
IDBI = Industrial Development Bank of India, UFJ = United Financial of Japan.Source: Author’s estimates, based on Thomson One Banker.

Realizing the Potential of PPPs to Advance Asia’s Infrastructure Development86
The descriptive statistics of project-level variables in Table 4.4 show the average project cost in the sample at $304 million, a gearing ratio of 86.94%, and an original maturity of about 13 years. In the average project, two banks commit funding by 1.5 term loans. For the composition of syndicates, bilateral and multilateral development banks take part, on average, in one out of 10 projects.6 Within each syndicate, about 85% of mandated arrangers are local banks in the country where the project is financed.
Table 4.4: Project-Level Descriptive Statistics for Developing Asian Markets
Variable Mean Median5th
Percentile95th
Percentile
Gearing 86.94 97.26 63.98 100.00
Cost 304.87 109.30 14.80 1,300.40
Maturity (EW) 12.94 13.46 6.18 20.01
Tranches 1.50 1.00 1.00 3.00
Local currency 0.75 1.00 0.00 1.00
Foreign currency 0.25 0.00 0.00 1.00
Syndicate size 1.99 1.00 1.00 5.00
MDB 0.1 0.00 0.00 1.00
Local bank 0.83 1.00 0.00 1.00
Tier 1 11.92 12.31 8.50 15.65
ROAA 1.22 1.25 0.31 2.13
Loans 58.45 60.78 43.51 67.83
NPL 2.84 2.62 0.76 5.65
Liquid assets 11.27 9.91 4.99 23.19
Cost/Income 53.69 53.42 38.30 72.09
EW = equally weighted, MDB = multilateral development bank, NPL = nonperforming loan, ROAA = return on average assets.Source: Author’s estimates, based on Thomson One Banker.
The data shows that local banks have a strong arranger certification requirement for infrastructure, particularly for international and nonlocal lenders that may find it hard to invest in these projects without leveraging on market knowledge provided by the local-mandated lead arranger. Seventy-five percent of projects are financed in local currency; debt financing for the rest involves foreign currency for at least one tranche. The typical arranger in the sample shows a solid tier 1 level of about 12%, but relatively low profitability, as

Factors Influencing Bank Project Financing of Infrastructure PPP Projects 87
measured by a return on average assets of 1.22%. Loans and liquidity account for almost 70% of total assets, and the loan portfolio shows a relatively low degree of riskiness (2.8%). Efficiency in terms of the cost–income ratio is about 54%.
As shown in the literature review, factors influencing bank lending also include macroeconomic and country risk factors. The dataset is complemented with country variables that proxy for economic and institutional conditions. Specifically, gross domestic product (GDP) per capita is used as a proxy for market conditions, inflation for macroeconomic stability, and government debt for government indebtedness, which is also indicative of country risk. Indicators of political stability and regulatory quality—taken from the World Bank’s Worldwide Governance Indicators—are also considered, since both the political environment and institutional quality may affect PPP investments. Country investment in infrastructure PPPs (as a percentage of GDP) is included as an indicator of project finance experience that may favor the financing of these projects; this data comes from the World Bank’s Private Participation in Infrastructure Database. Appendix A4.1, Table A4.1.1 details the variables and the data sources used in this study.
Model EstimationThe hypothesis on what determines bank lending to PPP projects in Asia is tested on the factors that influence bank exposure to projects with varying gearing ratios that measure bank leverage. Specifically, the empirical model is expressed as:
Gearing = α + β1Bank Variables + β2Project Variables + β3Country Variables + ε.
The choice of gearing ratio as the dependent variable is based on the seminal paper by Corielli, Gattti, and Steffanoni (2010) in which the debt–equity ratio is regressed on a set of dependent variables, including ratings and currency risk, to determine the factors affecting project leverage on project finance transactions. SPV managers must decide how much equity is required from sponsors and the level of external debt to achieve financial close. This has a bearing on the cost of debt that SPVs can service. In providing debt, external lenders are guided by exogenous heterogeneous risk factors and the amount of equity cushion required for providing debt.
Consequently, using a variable for project leverage as the dependent variable has several advantages. It captures the role of equity in achieving the financial close of projects, and determines the amount of debt banks are willing to lend per unit of equity. The leverage aspect is also relevant for project finance transactions. Using a variable for project leverage also captures

Realizing the Potential of PPPs to Advance Asia’s Infrastructure Development88
the heterogeneous risk factors across macroeconomic and project-related considerations. Accordingly, three broad factors constitute the independent variables: bank balance sheet items, project variables, and country or macroeconomic factors. Based on the literature review, these factors, which can affect bank lending, are now discussed.
Bank Syndicate Variables
The variables from bank balance sheets that are expected to affect bank lending decisions include nonperforming assets, bank capitalization, return on equity, and return on assets. The expectation is that nonperforming assets will negatively affect bank lending, while higher capitalization, return on equity, and return on assets will positively affect lending. The lending rate, however, is not included because data are not available in most cases. Although data availability is a key constraint, lending decisions more often reflect bank balance sheet variables and the length of the relationships they have with a project sponsor, rather than the lending rate itself. Further, the number of banks in a syndicate may have a positive effect for expanding bank lending, especially where the legal risk is high. A dummy variable for multilateral development banks in a syndicate can indicate whether these institutions provide additional comfort to deposit-taking banks.
Project Variables
Project size is one of the project or transaction-specific variables that influence bank lending. Because it is not possible to get project-specific risk data, loan tenor is used to proxy for project risk. PPP infrastructure projects need longer tenors, though longer tenors expose banks to higher liquidity risk.7
Macroeconomic Factors
The variables just discussed are microeconomic in nature since they are bank- and project-specific. But macroeconomic variables also affect bank lending decisions. For the model estimation, following Hammami, Ruhashyankiko, and Yehoue (2006), GDP per capita is included as an instrument to measure market size and to proxy for the potential for risk diversification. The inflation rate also plays a role in potentially increasing the weighted average cost of capital relative to the net present value, translating into credit risk to lenders. Additional factors reflecting macroeconomic risk include the ratio of government debt to GDP as an indicator of sovereign default, volatility estimates of GDP growth, inflation, and exchange rates.8 In a further effort to focus on the state of the enabling environment for PPP infrastructure projects to reach financial closure and become operational, and on the overall investment climate, the level of investment in PPP projects as percentage of GDP, and indices for political stability and regulatory quality, are included.
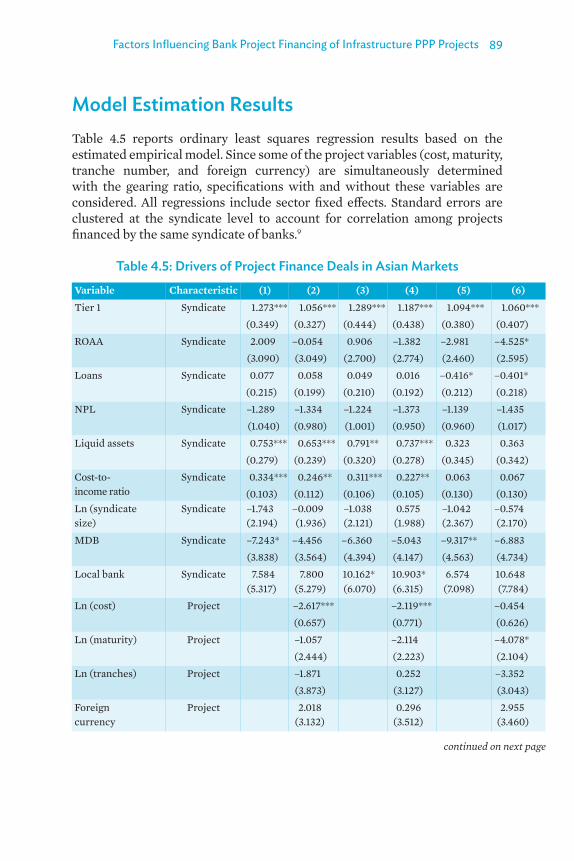
Factors Influencing Bank Project Financing of Infrastructure PPP Projects 89
Model Estimation ResultsTable 4.5 reports ordinary least squares regression results based on the estimated empirical model. Since some of the project variables (cost, maturity, tranche number, and foreign currency) are simultaneously determined with the gearing ratio, specifications with and without these variables are considered. All regressions include sector fixed effects. Standard errors are clustered at the syndicate level to account for correlation among projects financed by the same syndicate of banks.9
Table 4.5: Drivers of Project Finance Deals in Asian Markets
Variable Characteristic (1) (2) (3) (4) (5) (6)
Tier 1 Syndicate 1.273*** 1.056*** 1.289*** 1.187*** 1.094*** 1.060***
(0.349) (0.327) (0.444) (0.438) (0.380) (0.407)
ROAA Syndicate 2.009 –0.054 0.906 –1.382 –2.981 –4.525*
(3.090) (3.049) (2.700) (2.774) (2.460) (2.595)
Loans Syndicate 0.077 0.058 0.049 0.016 –0.416* –0.401*
(0.215) (0.199) (0.210) (0.192) (0.212) (0.218)
NPL Syndicate –1.289 –1.334 –1.224 –1.373 –1.139 –1.435
(1.040) (0.980) (1.001) (0.950) (0.960) (1.017)
Liquid assets Syndicate 0.753*** 0.653*** 0.791** 0.737*** 0.323 0.363
(0.279) (0.239) (0.320) (0.278) (0.345) (0.342)
Cost-to- Syndicate 0.334*** 0.246** 0.311*** 0.227** 0.063 0.067income ratio (0.103) (0.112) (0.106) (0.105) (0.130) (0.130)Ln (syndicate Syndicate –1.743 –0.009 –1.038 0.575 –1.042 –0.574size) (2.194) (1.936) (2.121) (1.988) (2.367) (2.170)
MDB Syndicate –7.243* –4.456 –6.360 –5.043 –9.317** –6.883
(3.838) (3.564) (4.394) (4.147) (4.563) (4.734)
Local bank Syndicate 7.584 7.800 10.162* 10.903* 6.574 10.648(5.317) (5.279) (6.070) (6.315) (7.098) (7.784)
Ln (cost) Project –2.617*** –2.119*** –0.454
(0.657) (0.771) (0.626)
Ln (maturity) Project –1.057 –2.114 –4.078*
(2.444) (2.223) (2.104)
Ln (tranches) Project –1.871 0.252 –3.352
(3.873) (3.127) (3.043)
Foreign Project 2.018 0.296 2.955currency (3.132) (3.512) (3.460)
continued on next page

Realizing the Potential of PPPs to Advance Asia’s Infrastructure Development90
Variable Characteristic (1) (2) (3) (4) (5) (6)
GDP per capita Country 1.229** 1.171**(0.502) (0.484)
Inflation Country 0.574 0.668
(0.758) (0.709)Gov’t debt Country –2.180* –2.114*
(1.195) (1.247)Volatility (GDP) Country –3.623 –2.852
(3.203) (2.966)Volatility Country 9.056*** 9.192**(inflation) (3.300) (3.587)Volatility Country 183.321 304.276(exchange rate) (285.694) (294.645)PPP investment Country 4.840 3.809
(3.457) (3.288)
Political stability Country –12.449 –14.513
(13.122) (13.064)
Regulatory Country 35.627 43.783quality (30.585) (29.708)
Sector FE Country Yes Yes Yes Yes Yes Yes
Quarter FE Country No No Yes Yes Yes Yes
Country FE Country No No No No Yes Yes
Observations Country 244 244 244 244 244 244
Adjusted R2 Country 0.192 0.231 0.271 0.294 0.399 0.404
Syndicate characteristics (%)
Country 69.56 45.15 38.14 29.00 19.39 16.68
Project characteristics (%)
Country 35.09 20.94 10.90
Country characteristics (%)
Country 21.43 19.03
Table 4.5 continued
continued on next page

Factors Influencing Bank Project Financing of Infrastructure PPP Projects 91
Table 4.5 continued
Variable Characteristic (1) (2) (3) (4) (5) (6)
Sector FE (%) Country 30.44 19.75 19.12 14.09 9.05 8.41
Quarter FE (%) Country 42.74 35.96 31.89 29.29
Country FE (%) Country 18.25 15.69
FE = fixed effects, GDP = gross domestic product, LN = natural logarithm, MDB = multilateral development bank, NPL = nonperforming loan, PPP = public–private partnership, ROAA = return on average assets.
Notes:
1. The table presents ordinary least squares regression results to examine the drivers of project finance deals. The sample includes 244 projects financed from 2011 to 2016 in India, Indonesia, Malaysia, the Philippines, the Republic of Korea, Thailand, and Viet Nam.
2. The dependent variable is the gearing ratio. 3. Standard errors (in parentheses) are clustered at the syndicate level to account for correlation
among projects financed by the same syndicate of banks.4. The lower of part of the table reports the R2 decomposition for groups of variables (Shapley
values, %).*** p < 0.01 ** p < 0.05 * p < 0.10
Source: Author’s estimates.
Column (1) in Table 4.5 shows regression results using only syndicate characteristics; column (2) augments the explanatory variables by including project characteristics. The results show a positive and significant association with the tier 1 ratio, the ratio of liquid to total assets, and the ratio of cost to income, while other variables are broadly insignificant. Banks with solid capital or liquid asset bases, as well as less-efficient banks, are more willing to lend to project finance infrastructure PPP transactions.
One explanation of why banks with higher ratios of cost to income lend more is that they may be looking to increase their performance by lending larger amounts, especially as administrative costs tend to be fixed regardless of deal size. Indeed, infrastructure projects provide an opportunity to increase the average size of single loan transactions. The coefficient estimates in columns (1) and (2) imply that a one-standard deviation increase in the (i) tier 1 ratio increases the gearing ratio by 2.9%–3.5%, (ii) ratio of liquid to total assets increases the gearing ratio by 3.8%–4.4%, and (iii) ratio of cost to income increases the gearing ratio by 3.3%–4.4%.
Column (2) shows some evidence that larger projects are less leveraged. Sector fixed effects—estimated from model specifications without the constant term in column (1)—show cross-sector heterogeneity in average gearing ratios of 29.96% for mining, and oil and gas; 33.03% for industry; 36.02% for transport;

Realizing the Potential of PPPs to Advance Asia’s Infrastructure Development92
and 38.39% for energy. Projects outside these sectors are more leveraged, and have an average gearing ratio of 45.91%. All sector fixed effects are significant at the 5% level. Sector fixed effects in column (2) line up consistently with those in column (1), whereby projects in mining, and oil and gas, are the least leveraged (55.70%), and those in other sectors are the most leveraged (71.77%).
Table 4.5 also shows the R2 decomposition for the groups of variables (Shapley values). There is a substantial portion of gearing ratios that country, project, and syndicate characteristics are unable to explain, since quarter fixed effects account for about one-third of the variability in gearing ratios for the most complete specification. Sector fixed effects, however, do not appear to be important. Overall, the financing structure of the sample projects depends substantially on both observable and unobservable country characteristics. Bank balance sheets constitute the third most important source of variation in project finance gearing ratios and about 17% to the overall R2.
The analysis then assesses the robustness of these results to the inclusion of time trends common to project financing and country variables. In columns (3) and (4), quarter fixed effects are incorporated to the specifications in columns (1) and (2). Point estimates and their significance are consistent with those in columns (1) and (2). In columns (5) and (6), time-varying proxies for economic and institutional conditions are included, together with country fixed effects. For the country variables, results show that the gearing ratio depends positively on GDP per capita, which shows that project finance tends to be higher in larger markets where demand and purchasing power are higher; this is in line with Hammami, Ruhashyankiko, and Yehoue (2006).
The regression results also show a negative dependence between gearing ratio and government indebtedness, which can proxy for sovereign default risk. Banks may be unwilling to provide long-term funding under these conditions. Moreover, gearing ratios are positively associated with inflation risk (proxied by the volatility of inflation rates), though these are unaffected by economic and currency risks. Initially, this evidence may be counterintuitive. This is because of the long-term nature of project finance investments, which make them highly exposed to inflation risk. As such, one would expect gearing ratios and inflation risk to be negatively—rather than positively—related. Two explanations are offered for this result. First, it may well be that interest rates on project finance debt are floating or inflation indexed in which case the inflation risk gets mitigated. Second, anecdotal evidence shows that many project finance transactions are exposed to inflation, both for revenue and operational costs, which implies a natural hedge against inflation. But this reasoning is only suggestive, because information is lacking on loan rates and the profit and loss structure of projects.
Factors Influencing Bank Project Financing of Infrastructure PPP Projects 93
The results show no evidence that political stability and institutional quality affect debt investment in project finance deals. One explanation is that the governance indicators used show limited time variation at the country level, and therefore country fixed effects absorb much of the cross-country variation.10
The introduction of country variables gives a different picture on the relevance of bank balance sheets. The tier 1 ratio continues to be positively associated with project gearing ratios and with a relatively stable coefficient. Liquid assets and ratios of cost to income, however, are no longer statistically significant. Since most projects are funded by local banks, this suggests that asset liquidity and cost efficiency tend to move together with local economic conditions. Columns (5) and (6) of Table 4.5 also suggest that banks with larger loan portfolios provide less funds to project finance deals. On the economic magnitude of this effect, a one standard deviation increase in the ratio of loans to assets decreases the gearing ratio by 3.1%–3.2%. Overall, no project variable appears to be a driver of the gearing ratio at standard significance levels.
Policy Implications
The evidence indicates that the volume of debt financing in the seven Asian countries is driven more by their macroeconomic variables (GDP per capita and the ratio of gross debt to GDP) than by variables related to institutional quality and the microeconomic variables referred to in the project characteristics. This result is probably due to the still early adoption of structured finance techniques in these economies compared with advanced economies. Banks—and particularly large ones—only seem comfortable lending for infrastructure within PPP and project financing schemes in emerging economies if countries have reached minimum acceptable conditions for growth, and a reasonable risk profile in terms of the ratio of total debt to GDP. In this sense, the insignificance of project variables shows that banks do not discriminate against projects in different sectors if a country shows a good set of macroeconomic variables. From a policy perspective, this implies that attracting private financing for infrastructure PPP projects through project finance is dependent on policies for sustaining growth.
A special comment must be made on bank-specific variables. While the coefficient of the tier 1 ratio is positive and strongly significant in all the model specifications, the results show weak evidence of a negative relation between the gearing ratio of projects and the ratio of loans to total assets. While these results are interpreted as evidence that well-capitalized arrangers are in a better position to invest more debt in infrastructure projects, it also appears

Realizing the Potential of PPPs to Advance Asia’s Infrastructure Development94
that project finance is a substitute for other lending activities. In fact, a negative coefficient in the ratio of loans to assets shows that the bigger the bank loan portfolio, the lower the gearing ratio is for infrastructure PPP projects in developing Asia. This corroborates the view of policymakers who see actions to strengthen bank capital bases under Basel III and, in the longer term, Solvency II for nonbank intermediaries as fundamental for expanding lending (OECD 2014).
The dominant literature on this issue suggests that strong institutions and a dedicated legal framework are crucial for developing PPPs (Vecchi, Airoldi, and Caselli 2015). It must be stressed, however, that the role of nonfinancial contracts in the context of infrastructure project finance in developing Asia is constrained by a paucity of data.
Comparative Analysis
A comparative analysis was conducted using data from the mature PPP markets of Australia, Canada, and the United Kingdom. The comparison gives some perspective on the results from the analysis of the PPP markets in the seven Asian countries studied. The analysis of the mature PPP markets shows that project-related variables have greater explanatory power than in developing Asia, suggesting the project finance modality is more entrenched in mature markets. For bank syndicate variables, bank profitability and the extent of impaired assets have limited explanatory power. In addition, the tier 1 ratio is no longer significant in this regression. This may be because of the quicker implementation of Basel III capital standards in the countries where the syndicated banks that lend to PPP projects in Australia, Canada, and the United Kingdom are headquartered, which has strengthened their capital bases. Appendix A4.1, Table A4.1.2 describes the drivers of project finance deals in the mature PPP markets.
Conclusions and Guidance for Future ResearchThe analysis in this chapter provides guidance on the role of banks in financing infrastructure in Asia through project finance deals. The findings suggest that macroeconomic risk factors and the strength of bank balance sheets are the key determinants of bank exposure to PPP projects in the current state of the market in developing Asia. In this context, it appears that banks are agnostic among projects belonging to different sectors, if the country shows a good set of macroeconomic variables. This evidence is corroborated by the analysis of advanced PPP markets where project financing norms have gained more traction and acceptability, and where project transactions variables are indeed significant.

Factors Influencing Bank Project Financing of Infrastructure PPP Projects 95
The findings of this study for Asia’s emerging markets have significant implications for developing an enabling framework for the PPP modality for infrastructure. Here, the role of project finance in promoting PPPs is crucial because the project finance technique promotes risk transfer and optimal risk allocation among PPP stakeholders. Several sources suggest the future progress of project finance lending will be based more on the direct role of debt capital markets than on traditional bank lending in both advanced and developing economies. The servicing of bank debt solely through SPV-specific cash flows results in higher credit spreads and so incentivizes project companies to seek alternative sources of finance; for example, through capital market instruments and by retiring bank loans. The role of banks will, therefore, be increasingly limited to financing in the initial PPP project construction phase.
This trend is expected to be accelerated by banks moving toward Basel III capital standards, given the notional comparison between developing Asian and mature PPP markets. Various sources estimate that the funding costs of banks are likely to increase by 60–110 basis points, and empirical estimates indicate the availability of project loans with maturities of over 10 years will be significantly reduced (Ma 2016). The reduction in the tenor of bank financing has further implications on the credit spread, as shorter tenors can put additional liquidity pressure on project SPVs before operations stabilize (Sorge and Gadanecz 2004). Accordingly, project companies will be further motivated to seek out capital market instruments to reduce funding costs and extend debt maturities. The current state of debt capital markets—which is marked by a large pool of available liquid resources, coupled with interest rates at record lows—is a setting that makes this search quicker and easier.
Further to this, the literature observes that project finance is a nexus of contracts, the quality of which has implications for the volume and pricing of infrastructure PPP project finance deals (Corielli, Gatti, and Steffanoni 2010; Subramainan and Tung 2016). The quality of contracts, and the optimality of risk allocation achieved through them, are determining factors in attracting investors to project-specific capital market instrument, especially because bond investors are far removed from projects and do not have the direct project monitoring capacity of banks.11 A careful examination of the contracts underpinning project finance deals, together with a more detailed analysis of country PPP regulations, would enable a better understanding of the determinants of infrastructure financing in developing Asia. This would also provide more guidance on institutional, regulatory, and governance gaps that will need to be filled to enable project SPVs access capital markets.

Realizing the Potential of PPPs to Advance Asia’s Infrastructure Development96
A further area of research, and one that is assuming increasing importance, is the role of guarantees in catalyzing finance, both through banks and bonds. Following Vecchi et al. (2017), the role of commercially provided guarantees that reduce project risk, while maintaining the essential feature of project finance and not encouraging moral hazard by banks, is of considerable interest. Data are scarce on guarantees in project finance transactions in developing Asia and the role of guarantees in achieving the financial close of projects. Several markets have unmitigated risk factors for project delays, and these significantly affect the cost and availability of debt. Research focused on the role of guarantees will shed light on the targeting and pricing of these instruments to expand financing options.

Factors Influencing Bank Project Financing of Infrastructure PPP Projects 97
Notes1. The original discussion on the bank lending channel by Bernanke and Blinder (1988) also
raises the possibility of a link between the perceived riskiness of loans and banks’ supply of loans, but this is not done in the context of changes in monetary policy.
2. Garcia-Appendini, Gatti, and Nocera (2017) analyze how banks’ funding policies using covered bonds can affect the willingness of banks to lend and change the overall asset risk of intermediaries.
3. In a default, lenders may have to make fresh exposures to stressed projects to enable them to make good on accumulating interest payments.
4. Equal sharing is assumed based on the literature; see, for instance, Esty (2001). The author assumes equal commitment on the loan underwriting when estimating the fee distribution among lead and colead arrangers. Gatti et al. (2013) use the same assumption where no data on the composition of the syndicate are provided.
5. In virtually all instances, the composition of the syndicate is the same across tranches for a project. In cases where banks differ across tranches (10 projects), syndicate size is defined as the number of unique banks providing financing across all tranches.
6. The multilateral development banks in the sample are the Asian Development Bank and the International Finance Corporation; the bilateral development banks are China Development Bank, Development Bank of Japan, Netherlands Development Finance Company, KfW IPEX-Bank GmbH, and Korea Development Bank.
7. Because longer-tenor bank loans will be more difficult to come by once Basel III capital standards take effect, the role of debt capital markets will gain further prominence.
8. Following Acemoglu et al. (2003), volatility of GDP growth is measured as the standard deviation of lagged values of GDP growth rates. Volatility of the inflation rate follows the same logic. Volatility of exchange rates is calculated as the standard deviation of the first difference of logarithms of the local currency unit versus the dollar exchange rate (Clark et al. 2004). The volatility estimates use data of the 20 lagged quarters together with the current quarter.
9. Clustering standard errors at the syndicate level implies that correlation of the error term or terms within a syndicate is controlled, which is the level at which the variables or interests are observed. Thus, the possibility that projects (error terms of the study’s projects) are not independently and identically distributed within the same syndicate because of omitted variables at the syndicate level is effectively accounted for.
10. To deal with the problem of limited variation in the governance indicators in the country variables, two sets of regressions are conducted: one without country variables (time-varying, albeit with limited variation, and time-invariant) and one with country variables. Wherever possible, country variables at the quarterly frequency are used to gain more variation over time.
11. Another clear trend emerging in the debt capital market for project finance transactions is the development of various forms of partnerships between traditional bank lenders and institutional investors, where banks provide know-how in screening and monitoring projects, and play a delegated monitoring role on behalf of institutional investors joining a partnership (OECD 2014).

Realizing the Potential of PPPs to Advance Asia’s Infrastructure Development98
Appendix 4.1: Factors Influencing Project Finance in Mature Markets
Table A4.1.1: Sources and Description of Variables
Variable DescriptionCharacteristic,
Units SourceGearing Gearing ratio (debt over
costs)Project, % Thomson One
Banker
GDP Real GDP per capita, YoY change
Country, quarter, %
Datastream
Inflation CPI seasonally adjusted, YoY change
Country, quarter, %
Datastream
Government debt
General government gross debt, % of GDP
Country, year, % Datastream
Volatility (GDP) Rolling standard deviation of GDP (5 previous years and current quarter)
Country, quarter, %
CEIC Data Company, Asian
Development Bank (ADB)
Asia Regional Integration
(ARIC)
Volatility (inflation)
Rolling standard deviation of Inflation (5 previous years and current quarter)
Country, quarter, %
CEIC Data Company, ADB
ARIC
Volatility (exchange rate)
Rolling standard deviation of log changes in local currency– dollar exchange rate (5 previous years and current quarter)
Country, quarter, %
CEIC Data Company, ADB
ARIC
PPP investment Investment in PPP, % of GDP
Country, year, % World Bank Private
Participation in Infrastructure
Database
Political stability Political stability and absence of violence (estimate), lagged year
Country-year, range
(–2.5 to 2.5)
World Bank Worldwide Governance Indicators
continued on next page

Factors Influencing Bank Project Financing of Infrastructure PPP Projects 99
Variable DescriptionCharacteristic,
Units SourceRegulatory quality
Regulatory quality (estimate), lagged year
Country-year, range
(–2.5 to 2.5)
World Bank Worldwide Governance Indicators
Cost Total cost Project ($ million)
Thomson One Banker
Maturity Average maturity across term loans (equal weighting)
Project, years Thomson One Banker
Tranches Number of term loans tranches
Project, range (1–6)
Thomson One Banker
Foreign currency
= 1 when at least one term loan is denominated in foreign currency
Project, dummy Thomson One Banker
Syndicate size Number of mandated arrangers
Syndicate, range (1–25)
Thomson One Banker
MDB = 1 when at least one mandated arranger is a multilateral development bank
Syndicate, dummy
Thomson One Banker
Local bank Fraction of mandated arrangers (over syndicate size) headquartered in the same country of the project
Syndicate, range (0–1)
Thomson One Banker, Orbis
database
Tier 1 Tier 1 ratio Syndicate Orbis database
ROAA Return on average assets Syndicate Orbis database
Loans Net loans over total assets
Syndicate Orbis database
NPL Impaired over gross loans
Syndicate Orbis database
Liquid assets Liquid over total assets Syndicate Orbis database
Cost/Income Cost-to-income ratio Syndicate Orbis database
CPI = consumer price index, GDP = gross domestic product, MDB = multilateral development bank, NPL = nonperforming loan, PPP = public–private partnership, ROAA = return on average assets, YoY = year-on-year.
Sources: See sources column.
Table A4.1.1 continued

Realizing the Potential of PPPs to Advance Asia’s Infrastructure Development100
Table A4.1.2: Project-Level Descriptive Statistics for Mature Markets
Variable Mean Median5th
percentile95th
percentile
Test of Differences
t-test Wilcoxon
Gearing 90.01 100.00 60.00 100.00 2.158** 2.111**
Cost 481.90 184.10 34.00 2,135.60 1.914** 4.289***
Maturity (EW) 11.78 8.99 2.00 26.02 –1.796* –3.083***
Tranches 1.65 1.00 1.00 3.00 1.828* 2.279**
Local currency 0.87 1.00 0 1.00 3.362*** 3.180***
Foreign currency 0.13 0 0 1.00 –3.362*** –3.180***
Syndicate size 3.60 2.00 1.00 10.00 5.416*** 6.682***
MDB 0.16 0 0 1.00 1.585 1.631
Local bank 0.22 0 0 1.00 –19.359*** –13.820***
Tier 1 13.30 12.90 10.60 18.00 5.258*** 6.252***
ROAA 0.37 0.35 -0.18 1.05 –15.736*** –13.137***
Loans 48.27 50.44 24.34 70.61 –8.624*** 8.696***
NPL 3.79 2.80 0.75 8.10 4.372*** 2.806***
Liquid assets 22.49 21.75 11.07 45.11 14.470*** 13.044***
Cost/Income 62.94 61.87 45.17 88.56 7.089*** 8.182***
EW = equally weighted, MDB = multilateral development bank, NPL = nonperforming loan, ROAA = return on average assets.*** p < 0.01 ** p < 0.05 * p < 0.10
Source: Author’s estimates, based on Thomson One Banker database.
Table A4.1.2 shows that projects in mature markets are larger than in developing markets and are more leveraged. Projects in mature markets have shorter maturities, involve more debt tranches, and are financed more in local currencies. These projects are financed by larger syndicates, and with less participation by local banks. Banks funding projects in mature markets are more capitalized, have more nonperforming loans and liquid assets, are less profitable and efficient, and have fewer loans on their balance sheets.
The characteristics of bank balance sheets are, overall, not very important for the model estimation. Table A4.1.3 shows some weak evidence that more profitable banks (column 2) and troubled banks (the ratio of impaired to total loans [columns 3 and 5]) are more likely to lend. One explanation is that banks that fund projects in mature PPP markets are based in countries where the quicker implementation of Basel III capital standards made their capital bases stronger than is the case for banks in Asia’s developing markets.

Factors Influencing Bank Project Financing of Infrastructure PPP Projects 101
Further, the analysis indicates that, in mature markets, project characteristics are more important. Gearing in particular is negatively associated with project size and positively associated with project duration. The evidence accords with the view that the project finance modality is more entrenched in mature markets and that bank lending is transaction-based. For macroeconomic variables, the results show a negative dependence of gearing ratios on government indebtedness, which is consistent with the analysis of developing Asian markets. But unlike the findings in Table 4.5, inflation as well as inflation risk now negatively affect project finance investment. Sector fixed effects for columns (1) and (2) in Table A4.1.2 show gearing ratios at their lowest for other sectors and at their highest for either energy (column 1) or transport (column 2).
Table A4.1.3: Drivers of Project Finance Deals in Mature Markets
Variable Characteristic (1) (2) (3) (4) (5) (6)Tier 1 Syndicate 0.305 0.074 0.061 –0.315 –0.346 –0.661
(0.529) (0.531) (0.692) (0.636) (0.744) (0.675)
ROAA Syndicate 5.421 7.194* 5.893 7.721 6.297 5.576
(4.909) (4.211) (5.106) (4.882) (5.531) (4.914)
Loans Syndicate 0.069 0.072 –0.020 –0.015 0.036 –0.030
(0.152) (0.144) (0.169) (0.144) (0.178) (0.155)
NPL Syndicate 0.832 0.555 0.999* 0.796 1.288* 1.248
(0.561) (0.571) (0.573) (0.562) (0.776) (0.764)
Liquid assets Syndicate 0.024 –0.016 –0.122 –0.129 –0.175 –0.125
(0.177) (0.145) (0.183) (0.154) (0.201) (0.188)
Cost-to-income Syndicate –0.052 0.136 0.013 0.216 0.008 0.158ratio (0.210) (0.226) (0.232) (0.224) (0.257) (0.249)Ln (syndicate Syndicate –2.071 5.076 –1.386 6.180** –0.523 6.189**size) (1.795) (3.227) (1.868) (2.946) (1.927) (2.882)
MDB Syndicate –2.155 –1.526 –1.362 –0.744 –2.542 –1.352(3.704) (3.142) (4.084) (3.433) (4.017) (3.044)
Local bank Syndicate –6.177 –4.921 0.009 2.347 –3.054 1.185(4.123) (4.146) (5.144) (4.845) (4.977) (4.771)
Ln (cost) Project –6.112*** –6.478*** –6.059***(2.124) (1.950) (1.778)
Ln (maturity) Project 3.888*** 4.397*** 5.299***(1.466) (1.553) (1.610)
Ln (tranches) Project –1.030 –1.703 –1.470(2.317) (2.424) (2.525)
continued on next page

Realizing the Potential of PPPs to Advance Asia’s Infrastructure Development102
Variable Characteristic (1) (2) (3) (4) (5) (6)Foreign Project 3.581 2.667 4.172currency (2.861) (3.068) (3.607)
GDP Country –1.168 –1.781(3.955) (3.434)
Inflation Country –9.741** –11.237**(4.820) (4.599)
Government debt Country –5.336** –5.980***(2.538) (2.224)
Volatility (GDP) Country 2.379 0.152(8.471) (7.378)
Volatility Country –57.267** –62.933**(inflation) (27.934) (24.170)Volatility Country –88.768 –578.378(exchange rate) (583.126) (510.647)
PPP investment Country 7.920 5.856(5.140) (4.396)
Political stability Country 61.947 56.247(37.928) (38.372)
Regulatory quality Country –17.738 –38.839(53.789) (48.840)
Sector FE Country Yes Yes Yes Yes Yes Yes
Quarter FE Country No No Yes Yes Yes Yes
Country FE Country No No No No Yes Yes
Observations Country 173 173 173 173 173 173
Adjusted R2 Country 0.004 0.163 (0.015) 0.174 0.107 0.266
Syndicate characteristics (%)
Country 60.10 16.95 18.93 10.45 13.76 8.79
Project characteristics (%)
Country 73.56 46.48 30.11
Table A4.1.3 continued
continued on next page
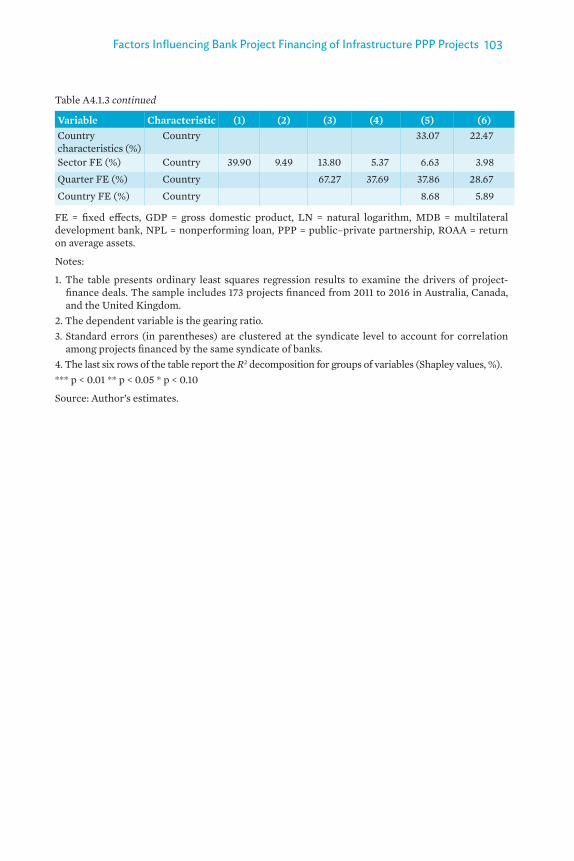
Factors Influencing Bank Project Financing of Infrastructure PPP Projects 103
Variable Characteristic (1) (2) (3) (4) (5) (6)Country characteristics (%)
Country 33.07 22.47
Sector FE (%) Country 39.90 9.49 13.80 5.37 6.63 3.98
Quarter FE (%) Country 67.27 37.69 37.86 28.67
Country FE (%) Country 8.68 5.89
FE = fixed effects, GDP = gross domestic product, LN = natural logarithm, MDB = multilateral development bank, NPL = nonperforming loan, PPP = public–private partnership, ROAA = return on average assets.
Notes:
1. The table presents ordinary least squares regression results to examine the drivers of project-finance deals. The sample includes 173 projects financed from 2011 to 2016 in Australia, Canada, and the United Kingdom.
2. The dependent variable is the gearing ratio. 3. Standard errors (in parentheses) are clustered at the syndicate level to account for correlation
among projects financed by the same syndicate of banks. 4. The last six rows of the table report the R2 decomposition for groups of variables (Shapley values, %).*** p < 0.01 ** p < 0.05 * p < 0.10
Source: Author’s estimates.
Table A4.1.3 continued

Realizing the Potential of PPPs to Advance Asia’s Infrastructure Development104
References
Acemoglu, Daron, Simon Johnson, James Robinson, and Yunyongf Thaicharoen. 2003. Institutional Causes, Macroeconomic Symptoms: Volatility, Crises and Growth. Journal of Monetary Economics 50 (1): pp. 49–123.
Bernanke, Ben and Alan Blinder. 1988. Credit, Money, and Aggregate Demand. American Economic Review 78 (2): pp. 435–439.
Bernanke, Ben and Mark Gertler. 1995. Inside the Black Box: The Credit Channel of Monetary Policy Transmission. Journal of Economic Perspectives 9 (4): pp. 27–48.
Blanc-Brude, Frederic, Hugh Goldsmith, and Timo Välilä. 2006. Ex-Ante Construction Costs in the European Road Sector: A Comparison of Public–Private Partnerships and Traditional Public Procurement. EIB Economic and Financial Report No. 2006/01. Luxembourg: European Investment Bank.
Borio, Claudio and Haibin Zhu. 2008. Capital Regulation, Risk-Taking and Monetary Policy: A Missing Link in the Transmission Mechanism? BIS Working Papers No. 268. Basel: Bank for International Settlements.
Brealey, Richard A., Ian A. Cooper, and Michel A. Habib. 1996. Using Project Finance to Fund Infrastructure Investments. Journal of Applied Corporate Finance 9 (3): pp. 25–39.
Clark, Peter, Natalia Tamirisa, Shang-Jin Wei, Azim Sadikov, and Li Zeng. 2004. A New Look at Exchange Rate Volatility and Trade Flows. IMF Occasional Paper 235. Washington, DC: IMF.
Corielli, Francesco, Stefano Gatti, and Alessandro Steffanoni. 2010. Risk Shifting through Nonfinancial Contracts: Effects on Loan Spreads and Capital Structure on Project Finance Deals. Journal of Money, Credit and Banking 42 (7): pp. 1295–1320.
Diamond, Douglas. 1984. Financial Intermediation and Delegated Monitoring. Review of Economic Studies 51 (3): pp. 393–414.

Factors Influencing Bank Project Financing of Infrastructure PPP Projects 105
Disyatat, Piti. 2010. The Bank Lending Channel Revisited. BIS Working Papers No. 297. Basel: BIS.
Esty, Benjamin C. 2001. Structuring Loan Syndicates: A Case Study of the Hong Kong Disneyland Project Loan. Journal of Applied Corporate Finance 14 (3): pp. 80–95.
Esty, Benjamin C. and William L. Megginson. 2003. Creditor Rights, Enforcement and Debt Ownership Structure: Evidence from the Global Syndicated Loan Market. Journal of Financial and Quantitative Analysis 38 (1): pp. 37–60.
Garcia-Appendini, Emilia, Stefano Gatti, and Giacomo Nocera. 2017. Covered Bonds, Asset Encumbrance and Bank Risk: Evidence from the European Banking Industry. Paper presented at the 2017 FMA Annual Meeting, Boston, May 2017. http://www. fmaconferences.org/Boston/ CoveredBonds_FMA_Boston.pdf.
Gatti, Stefano, ed. 2012. Project Finance in Theory and Practice. Cambridge, MA: Academic Press.
Gatti, Stefano, Stefanie, Kleimeier, William Megginson, and Alessandro Steffanoni. 2013. Arranger Certification in Project Finance. Financial Management 42 (1): pp. 1–40.
Hart, Oliver. 2003. Incomplete Contracts and Public Ownership: Remarks and an Application to Public–Private Partnerships. Economic Journal 113 (March): pp. C69–C76.
Hammami, Mona, Jean-Francois Ruhashyankiko, and Etienne B. Yehoue. 2006. Determinants of Public-Private Partnerships in Infrastructure. IMF Working Paper WP/06/99. Washington, DC: IMF.
Hanson, Samuel, Andrei Shleifer, Jeremy C. Stein, and Robert W. Vishny. 2014. Banks as Patient Fixed-Income Investors. NBER Working Paper No. 20288. Cambridge, MA: National Bureau of Economic Research.
Holmström, Bengt and Jean Tirole. 1998. Private and Public Supply of Liquidity. Journal of Political Economy 106 (1): pp. 1–40.

Realizing the Potential of PPPs to Advance Asia’s Infrastructure Development106
Ivashina, Victoria, David S. Scharfstein, and Jeremy C. Stein. 2012. Dollar Funding and the Lending Behavior of Global Banks. NBER Working Paper No. 18528. Cambridge, MA: NBER.
Kashyap, Anil and Jeremy C. Stein. 1994. Monetary Policy and Bank Lending. In Monetary Policy, edited by Gregory Mankiw. Chicago: University of Chicago Press.
Kashyap, Anil, Raghuram Rajan, and Jeremy C. Stein. 2002. Banks as Liquidity Providers: An Explanation for the Coexistence of Lending and Deposit-Taking. Journal of Finance 57 (1): pp. 33–73.
Kirti, Divya. 2017. Why Do Bank-Dependent Firms Bear Interest-Rate Risk? IMF Working Paper WP/17/3. Washington, DC: IMF.
Ma, Tianze. 2016. Basel III and the Future of Project Finance Funding. Michigan Business & Entrepreneurial Law Review 6 (1): pp. 109–126.
Mirzaei, Ali and Zeynab Mirzaei. 2011. Bank-Specific and Macroeconomic Determinants of Profitability of Middle Eastern Banking. Iranian Economic Review 16 (2): pp. 101–128.
OECD (Organisation for Economic Co-operation and Development). 2014. Private Financing and Government Support to Promote Long-term Investments in Infrastructure. Paris.
Pham, Thi Hong Hanh. 2015. Determinants of Bank Lending. Working Papers, HAL. https://hal.archives-ouvertes.fr/hal-01158241.
Sorge, Marco and Blaise Gadanecz. 2004. The Term Structure of Credit Spreads in Project Finance. BIS Working Papers No. 159. Basel: BIS.
Subramanian, Krishnamurthy and Frederick Tung. 2016. Law and Project Finance. Journal of Financial Intermediation 25 (C): pp. 154–77.
Vecchi, Veronica, Marco Airoldi, and Stefano Caselli. 2015. Closing PPP’s Gaps in Italy: From Legal Microsurgery to Managerial Flow. In Managerial Flow, edited by Veronica Vecchi, Ben Farr-Wharton, Rodney Farr-Warthon, and Manuela Brusoni. Abingdon, United Kingdom: Routledge.
Vecchi, Veronica, Mark Hellowell, Raffaele Della Croce, and Stefano Gatti. 2017. Government Policies to Enhance Access to Credit for Infrastructure-Based PPPs: An Approach to Classification and Appraisal. Public Money and Management 37 (2): pp. 133–140.

Factors Influencing Bank Project Financing of Infrastructure PPP Projects 107
Visconti, Roberto. 2012. Inflation Risk Management in Project Finance Investments. International Journal of Finance and Accounting 1 (6): pp. 198–207.
WEF (World Economic Forum). 2013. Strategic Infrastructure: Steps to Prepare and Accelerate Public–Private Partnerships. Geneva.
World Bank. 2014. Public–Private Partnerships Reference Guide Version 2.0. Washington, DC.


CHAPTER 5
Syndicated Loans in Project Finance: Empirical Evidence from Asian Public–Private Partnership Markets
Michael Timbang and Vivek Rao
IntroductionWhat drives the behavior of banks to take risks and exposure on lending to public–private partnership (PPP) infrastructure projects in developing Asia? This chapter gives a broader perspective on bank lending for infrastructure PPPs by examining the potential for bank loan syndication using project finance. A bank’s gearing ratio intuitively captures the role of equity in achieving financial closure and heterogeneous risk factors across macroeconomic and project-related considerations. But syndicated bank lending provides a different perspective on the role of banks in project finance by focusing on the debt component. This chapter empirically examines the channels by which the degree of bank debt concentration and the likelihood of syndicated lending are underpinned by different factors, particularly the governance functions played by banks on loan syndicate transactions.
The main findings suggest that loan syndication in developing Asia is significantly driven by the rule of law, based on our analysis of seven countries in the region that were chosen for their data availability: India, Indonesia, Malaysia, the Philippines, the Republic of Korea, Thailand, and Viet Nam. Bank lenders to PPP infrastructure projects in these countries are more likely to form a more concentrated syndicate when banks can rely on the efficiency of courts and other institutional remedies to protect and enforce contract arrangements. Moreover, the use of project finance in PPP infrastructure projects in the region may prove to have a beneficial effect on mitigating information asymmetry problems.
Syndicated Loans: A Brief DescriptionA syndicated loan is a debt jointly provided by at least two lenders to a borrower, and characterized by a mix of private and public debt (Dennis and Mullineaux 2000; Lee and Mullineaux 2001). The loan syndication market has features of both commercial and investment banking—a combination

Realizing the Potential of PPPs to Advance Asia’s Infrastructure Development110
of “relationship loans” and “transaction loans,” as Boot and Thakor (2000) put it. For syndicated loans, the lead arranger or bank screens borrowers and monitors their performance in a relationship-like context, and then sells some or all of the loan in a capital market-like context, which involves characteristics of relationship and transaction types of financing (Dennis and Mullineaux 2000).
Members of a loan syndicate are classified as either lead arrangers or participant lenders, and they differ in three ways (Sufi 2007). First, participant lenders do not negotiate directly with the borrower. Lead arrangers collect information and monitor responsibilities, and are responsible for providing lenders with detailed and confidential information on the loan and the borrower’s performance. Lead arrangers also maintain a close relationship with the borrower. Second, lead arrangers unlike participant lenders hold a much greater percentage of the loan. And third, full agreement among all syndicate members is required for renegotiating rights or amending a loan’s financial aspects, such as principal, interest, maturity, and collateral.
Sufi (2007) describes the loan syndication process in the following way: The lead arranger signs an initial loan contract or a preliminary loan agreement with the borrower. The loan contract stipulates the financial details of the loan, such as the amount, interest rate range, covenants, fees, and collateral. The lead arranger then looks for participant lenders to provide part of the loan once the contract has been signed. The loan agreement is finalized once participant lenders decide to become part of a syndicate, and the terms of a syndicated loan are the same for all parties. The borrower pays the lead arranger a fee for arranging and managing the syndicate; this is in addition to the interest and commitment fee income that the lead arranger receives. The lead arranger is the “agent bank” that performs various duties. These include monitoring the borrower’s activities, which may affect the borrower’s credit risk profile, setting the loan terms; administering the drawdown of funds, calculating interest payments, and enforcing financial covenants during the life of the loan.
The market for syndicated loans is a major source of funding for project infrastructure. In developed countries, syndicated loans are widely used as source of financial capital for these projects because a larger share of infrastructure financing comes from debt markets than equity markets (Esty and Megginson 2003). Some countries in developing Asia are starting to use syndicated loans to finance infrastructure projects. From 2011 to 2016, these loans totaled an estimated $56 billion in India, Indonesia, Malaysia, the Philippines, the Republic of Korea, Thailand, and Viet Nam. But this is still small, given the region’s financing gap for infrastructure.

Syndicated Loans in Project Finance—Empirical Evidence from Asian PPP Markets 111
Literature ReviewThe literature on syndicated loans is small, consisting of only several works. Simons (1993) underscores the importance of bank regulatory environments in the form of capital requirements and lending limits as the rationale for the existence of loan syndication markets. The author finds that loan syndications are driven primarily by the capital-constraint considerations of lead arrangers for capital-to-asset ratios, and diversification prospects for loan-to-capital ratios. Godlewski (2008) describes how the characteristics of bank supervision and financial development influence the structure of loan syndicates. The author argues that this is an organizational response to agency problems, and the results of his cross-country analysis confirm that syndicate structure is influenced by the banking environment, which is consistent with reducing agency costs and efficient recontracting objectives.
Esty and Megginson (2003) highlight the significance of legal risk on how banks adjust their syndicate structures to facilitate their governance roles. For bank monitoring and low-cost contracting functions, the authors argue that bank lenders are more likely to create smaller and more concentrated syndicates in countries with strong laws and regulations. But they note that bank lenders also create larger and more diffuse syndicates to deter strategic default when they cannot rely on the rule of law for legal enforcement mechanisms. When banks experience inefficiencies in the legal system, they assume that they are exposed to greater legal risk, which affects their lending behavior.
Lee and Mullineaux (2001) examine the factors that influence the structure of commercial lending syndicates. They investigate the efforts of the lead arranger to influence the percentage share of a loan taken by each participating syndicate member and to manage agency and information asymmetry problems within a loan syndicate. They find that syndicates are more concentrated when the borrower is less transparent (or when there is less financial information available on the borrower), and when the syndicate loan is secured. This is consistent with the observed efforts of lead arrangers to increase the likelihood of monitoring within a group because of potential agency and information asymmetry problems. The authors also find that loan syndicates are driven by credit risk; that is, banks form concentrated loan syndicates when credit risks are high. This implies that the motivation for monitoring by lead arrangers also increases when credit risks rise. But they find that syndicates are diffuse or are less concentrated when lead arrangers are perceived as reputable, and when loans have longer tenors.
Sufi (2007) analyzes the market for syndicated loans, focusing on how syndicate structure and the composition of syndicate members are influenced

Realizing the Potential of PPPs to Advance Asia’s Infrastructure Development112
by information asymmetry between lenders and borrowers. Consistent with moral hazard in monitoring, the author’s empirical findings suggest that the lead arranger holds a greater percentage of a loan and, in turn, forms a more concentrated syndicate when information asymmetry problems in the loan transaction are significantly high. The motivation for monitoring and due diligence encourages the lead arranger and syndicate members to form a more concentrated syndicate.
Dennis and Mullineaux (2000) determine the factors affecting a lender’s decision to form and participate in a loan syndicate and, consequently, the proportion of a loan sold in the event of syndication. Their empirical evidence shows a loan is more likely to be syndicated when the borrower becomes less information-problematic and the syndicate’s lead arranger becomes more reputable, and when loans have longer terms to maturity. Their results also indicate that lead arrangers hold a significant share of information-problematic loans. They conclude that loan syndications, like loan sales, are motivated by capital regulations, and that the liquidity position of the lead arranger influences the likelihood of syndication.
Factors Affecting Loan Syndication
We now examine the factors affecting loan syndication and the motivation for using project finance in more detail, as discussed in the literature.
Information Asymmetry
Banks, as formal financial institutions, perform governance duties in the context of lending. Among these duties, monitoring is one of the most significant (Freixas and Rochet 1997). Banks have comparative advantage in monitoring borrowers because they are considered as delegated monitors, conducting monitoring activities at a lower cost (Diamond 1984). Banks also benefit from economies of scale in monitoring and are leveraged in terms of access-to-borrower information unlike other financial intermediaries, such as individual lenders (Fama 1985). In general, banks conduct monitoring to avoid moral hazard, which arises from a borrower’s opportunistic behavior, and so reduce their exposure to credit risk (Ahn and Choi 2009).
The loan syndication market has information asymmetry problems that lead to adverse selection and moral hazard problems. For syndicated lending, agency problems arise when the lead arranger or agent bank has information about a loan or the borrower that is not available to the participating lenders. This information could cover assessments of the borrower’s management expertise, customer–supplier relationships, and the borrower’s capacity
Syndicated Loans in Project Finance—Empirical Evidence from Asian PPP Markets 113
to adapt to changing market conditions. Because of this, the lead arranger has an incentive to form a loan syndicate where the borrower’s undisclosed information could put the participating lenders at a huge disadvantage (Dennis and Mullineaux 2000). Thus, the structure of loan syndicates can be thought of as an organizational response to agency or information asymmetry problems stemming from the syndication process (Pichler 2001; Godlewski 2008).
According to Sufi (2007), information asymmetry has a significant impact on the structure of syndicated loans and the composition of syndicate members that is consistent with moral hazard in monitoring. The author uses a theoretical framework based on models of agency and moral hazard (Holmstrom 1979; Holmstrom and Tirole 1997). This assumes that “informed lenders” conduct due diligence and monitoring on borrowers with limited public information before “uninformed lenders” participate in a loan syndicate. Here, the due diligence of informed lenders and their monitoring effort is not observable, leading to moral hazard problems.
To enhance the prospects for monitoring and ensure due diligence, Sufi (2007) argues that the lead arranger should retain a larger share of the loan because the arranger has governance responsibilities within the syndicate. The author notes that only a bank with a large financial stake in a loan that depends on the borrower’s ability to pay exerts the necessary effort on governance. In other words, the lead arranger—the informed lender—is forced to maintain a large financial stake in the loan when the problem of information asymmetry is significantly high; that is, when the borrower requires intense monitoring and due diligence, given that the lead arranger’s monitoring and due diligence effort is not observable. This is analogous to Brealey, Cooper, and Habib’s (1996) argument that managers should take equity stakes in businesses to resolve problems of incomplete contracting and costly monitoring. Such a stake ties a manager’s wealth to actions in cases where that wealth largely depends on the performance of the business in which the manager has an equity stake. This strategy, which associates a manager’s “residual claimancy” with the ownership of equity, motivates the manager to perform well.
In the syndicated loan market, corporate borrowers who are subject to monitoring can get financing only after an informed lender takes a significant financial stake in the loan syndicate. This is supported by Lee and Mullineaux (2001), who find that lenders form more concentrated syndicates, with the lead arranger holding a large percentage of the loan, when there is less information about the borrower. Their result underscores the importance of the lead arranger enhancing monitoring within the syndicate. It also highlights the importance of “informed” capital for the financial health of firms that require more monitoring by a financial institution.

Realizing the Potential of PPPs to Advance Asia’s Infrastructure Development114
Legal Risk
Apart from providing valuable monitoring functions, banks also facilitate low-cost recontracting in defaults, and low-cost restructuring can, in turn, encourage borrowers to resort to strategic default. These functions, according to Esty and Megginson (2003), generate three empirical forecasts on syndicated lending on how banks adjust the size and concentration of the syndicate structure in response to legal risk to facilitate their governance roles.1
In the first forecast, the monitoring hypothesis predicts that, when bank monitoring is crucial, banks will form more concentrated syndicates because fewer participating banks will be holding large individual shares of the loan. Fundamentally, bank monitoring is important when the level of legal risk is significantly high, since there is a greater probability for misappropriation of cash flows in countries with high legal risk. Banks, however, have fewer legal rights and cannot rely on the rule of law to enforce contracts in this case. Thus, the opposite is expected: banks will hold larger shares of the loan or lending syndicates will become more concentrated in countries with low legal risk.
In the second forecast, the low-cost recontracting hypothesis predicts that, when economic default is more likely because of financial and macroeconomic conditions, banks will form more concentrated loan syndicates to reduce recontracting costs. Low-cost recontracting, similar to monitoring, relies on the efficiency of legal systems to enforce contracts. And like the monitoring hypothesis, the low-cost recontracting hypothesis predicts that banks will form more concentrated syndicates in countries with low legal risk.
In the third forecast, the deterrence hypothesis predicts an inverse association between legal risk and loan-syndicate concentration. Banks try to avoid strategic default by choosing more diffuse loan structures because it is costlier to default this way. So, banks make it more expensive and burdensome to default, knowing that higher legal risk results in the weak enforcement of contracts.
Esty and Megginson’s (2003) empirical findings suggest that bank lenders tend to create smaller and more concentrated syndicates to facilitate monitoring and low-cost contracting in countries with strong legal environments. In other words, low legal risk or a stronger rule of law is positively associated with a higher concentration of debt. That said, bank lenders tend to create larger and more diffuse syndicates to discourage strategic default when they cannot rely on the courts for legal enforcement mechanisms.
Syndicated Loans in Project Finance—Empirical Evidence from Asian PPP Markets 115
Capital Requirements
The relationship between capital requirements and syndicated lending is an empirical question. Capital constraints are an incentive for bank lenders to participate in loan syndicates. According to Simons (1993), banks constrained by capital requirements will be unwilling to put a sizable loan on their balance sheets because this lowers their capital-to-asset ratios. In which case, banks may opt to participate in a loan syndicate to still pursue lending opportunities. Berger and Udell (1993) and Pennacchi (1988) suggest that capital requirements encourage banks to participate in loan-sale activities.2
Godlewski (2008) notes that capital requirements should positively influence the formation of loan syndicates by motivating “lending limit respect,” in which stronger capital requirements increase the motivation relevance. Capital-to-asset ratios are, therefore, positively associated to a bank’s exposure to loan syndication. The author, however, also observes a negative relation between capital requirements and loan syndication. Capital requirements reduce the number of eligible banks with capital and funding advantages to participate in syndicated lending. Dennis and Mullineaux (2000) argue that as capital-to-asset ratios increase, the prospect for loan syndication falls, provided loan syndications are driven by capital requirements.
Credit Risk
Private and public debt differ in information disclosure, which significantly affects borrower choice and loan decisions. Berlin and Loeys (1988), Berlin and Mester (1992), and Rajan and Winton (1995) find that the loan requests of highly risky borrowers (as perceived by potential lenders) get rejected in capital markets. Because of this, risky borrowers are forced to resort to private lenders with tighter controls. Transaction loans in capital markets are essentially the same as loans that are fully syndicated to many participating lenders (Dennis and Mullineaux 2000). Ahn and Choi (2009) note that the purpose of bank monitoring is to reduce a bank’s credit risk by preventing moral hazard, which results from a borrower’s opportunistic behavior. Consistent with the literature, banks form more concentrated syndicates when the incentive for and prospect of bank monitoring is high.
Lee and Mullineaux (2001) predict that, if the lead arranger tries to intensify bank monitoring by offering bigger shares of riskier loans to participating lenders, syndicate size should decline and syndicate concentration increase. This implies the lead arranger, having governance functions within the syndicate, also enhances incentives to monitor when the credit risk is significantly high.

Realizing the Potential of PPPs to Advance Asia’s Infrastructure Development116
Liquidity
The literature finds that bank liquidity significantly affects loan sales (Pavel and Phillis 1987, Berger and Udell 1993). Pavel and Phillis (1987) note that, if loan sales are “primarily influenced by other factors such as liquidity and diversification, then perhaps asset sales should be encouraged to improve the soundness of the banking system.” Using bank survey data, they find a positive and significant relationship between bank liquidity and the prospects for selling a loan (either outright, through participations and syndications, or securitization). Dennis and Mullineaux (2000) use a loan-growth variable as a rough proxy to measure the liquidity constraints of lead arrangers. A higher liquidity constraint is associated with a higher probability that banks will form and participate in a loan syndicate, other things being equal.
Bank Structure
Cost-efficient banks are less exposed to problems of information asymmetry within a syndicate because of effective risk management, screening, and monitoring. Supervisory mechanisms that enhance transparency on the loan portfolios of banks participating in a loan syndicate have a positive impact on syndicate size and a negative influence on debt concentration (Godlewski 2008). Thus, cost efficiency is expected to be positively related to syndicate concentration because loan syndication involves sharing miscellaneous costs, such as administration and origination costs. Consistent with the literature, a higher ratio of cost to income indicates greater cost inefficiency among banks, which is expected to encourage the formation of larger syndicates, implying a less concentrated loan syndicate.
Loan Maturity
Ahn and Choi (2009) note that loan maturity significantly influences the incentive of banks to strengthen their monitoring functions. A borrower who experiences monitoring in the early stage of a loan period may well have learned ways to avoid these checks and be able to behave opportunistically later in the life of the loan. So, banks may need to strengthen monitoring to avoid this behavior. Doing this will enable bank lenders to monitor effectively a borrower’s performance through earnings, and the borrower’s capacity to pay through the life of the loan, as the likelihood of information or agency problems increases with the length of the loan period.
Long-term debt with loan covenants also increase the likelihood of bank monitoring because of the potential agency costs associated with information asymmetry (Rajan and Winton 1995). Banks also have comparative advantage in having access to information on long-term borrowers (Smith and Ongena 1998), and can reduce duplicative monitoring costs since this type of loan
Syndicated Loans in Project Finance—Empirical Evidence from Asian PPP Markets 117
tends to have longer maturities (Dennis and Mullineaux 2000). In sum, the literature implies a positive relationship between the incentives for banks to conduct monitoring and loan maturity. But it should be noted that several studies suggest a negative relationship, pointing out that short-term debt is more efficient in resolving agency problems in debt financing (Farinha and Santos 2002; Jones, Lang, and Nigro 2005, for example).
Loan Security
Going by the literature, loan collateral can have a positive or a negative impact on the prospects for loan syndication. Bester (1985) and Besanko and Thakor (1987) show that the level of loan collateral signals a borrower’s credit worthiness. The efforts made by a lender to monitor a borrower’s earnings and cash flow assumes less importance when a loan is fully secured. Accordingly, loan collateral significantly reduces the associated problems of information asymmetry between lenders and borrowers, suggesting that loan security increases the likelihood for loan syndication.
Berger and Udell (1990), however, find a significant association between collateral and riskier loans. They find evidence that, when these are compared, secured loans have a higher default risk than unsecured loans. So, in the event of financial distress, lead arrangers are highly motivated to strengthen monitoring and to improve the chances of successful loan restructuring by forming more concentrated loan syndicates. Rajan and Winton (1995) show the positive relationship between collateral and a lender’s monitoring incentive because of potential agency problems. If loan security aims to resolve information asymmetry (that is, moral hazard problems), then riskier borrowers who require intense monitoring will put up more collateral. In this case, forming a large loan syndicate is inefficient because it “dilutes” each lender’s monitoring incentive, suggesting the presence of collateral lowers the prospects for syndicating a loan (Dennis and Mullineaux 2000; Lee and Mullineaux 2001).
Loan-Tranche Size
The incentive to enhance bank monitoring is also influenced by a bank loan’s size. A bank that lends a significant amount to a borrower has a bigger incentive to monitor how a borrower manages earnings and capacity to pay. Khalil and Parigi (1998) show that loan size is a signal for a bank’s incentive to strengthen monitoring, because loan size also affects a borrower’s income reporting. Kang, Shivdasani, and Yamada (2000) also find a positive relation between loan size and a bank’s incentive for monitoring. Lee and Mullineaux (2001) argue that syndicate members with the largest stakes in a loan have a stronger incentive to conduct monitoring than those with smaller stakes. All in all, the literature suggests that the more banks lend, the more they become
Realizing the Potential of PPPs to Advance Asia’s Infrastructure Development118
vulnerable to risk, and are more motivated to strengthen monitoring (Ahn and Choi 2009). This implies that, as loan tranches increase, banks form more concentrated syndicates to observe the conduct of bank monitoring.
Motivations for Using Project Finance
The rise of project finance proves that financing structures are important to project success. According to Kleimeier and Versteeg (2010), project finance is a superior financial instrument because of its features that enable it to become a financing substitute for underdeveloped financial markets. Project finance is, therefore, fundamental for improving investment management and governance, and, consequently, economic growth.
The use of project finance has sharply increased, rising from $12.5 billion in 1991 to $113.4 billion in 2005 (Kleimeier and Versteeg 2010). In the seven Asian countries covered in this chapter, project finance has also grown robustly, totaling $258 billion from 2011 to 2017, reflecting the region’s strong economic growth. Project finance has also become a significant financing vehicle for natural resources and infrastructure.
Esty (2002) defines project finance as “the creation of a legally-independent project company financed with nonrecourse debt for the purpose of investing in a capital asset.” It is important to distinguish between the asset (the project) and the financing structure in this definition. While firms and assets are potentially suitable candidates for project finance because of their specific characteristics, the financing structure itself is developed and organized based on these asset features and the contracting environment. Esty (2002) argues that the net cost of financing these assets is significantly reduced by using project finance. Merton and Bodie (1995) and Kleimeier and Versteeg (2010) find that project finance is designed to reduce project transaction costs, which are driven by the lack of information on potential investments and capital allocation, inadequate corporate governance, risk management, and the inability to mobilize and pool savings, among other factors. The impact of project finance on economic growth and development should, therefore, be more pronounced in countries where financial development is weak, such as low-income countries. This is supported by Kleimeier and Versteeg (2010), who find that growth in low-income countries is buoyed by project finance transactions. This is because transaction costs are significantly larger compared with middle- and high-income countries, where financial markets are more developed.
Project finance is used for new stand-alone complex projects that involve substantial risks and costly problems of information asymmetry. Most of the financing for these projects are nonrecourse syndicated loan tranches.3 During

Syndicated Loans in Project Finance—Empirical Evidence from Asian PPP Markets 119
a project’s initial screening and structuring phase, the loan syndicate’s lead arranger works closely with the project’s sponsors. The lead arranger is also responsible for putting the syndicate together by attracting other banks in the global syndicated loan market to the project (Gatti et al. 2013). The syndicate bears most of the business risks since these loans are nonrecourse. The business risk must, therefore, be significantly reduced to an acceptable level for the loan syndicate, given that these projects are highly leveraged. Here, project finance allows the allocation of project-specific risks—completion and operating risk, revenue and price risk, and the risk of political interference or expropriation—to the parties best able to manage them, making this a key comparative advantage (Brealey, Cooper, and Habib 1996; Kleimeier and Versteeg 2010).
The contractual structures of project finance, which are similar to the features of well-developed financial markets, make them suitable for project finance to be a substitute for underdeveloped financial markets. And, like other financial instruments, project finance works better when sound legal, regulatory, and institutional frameworks are in place. Transaction costs rise when contracts are not respected, and markets do not function well. Adjusting project finance structures to deal with large transaction costs, along with other market failures, is expensive and burdensome, and undermines the rule of law, quality of regulatory environment, and the role of legal institutions in enforcing contracts (Kleimeier and Versteeg 2010).
Project finance is a highly flexible financial structure in the sense that it can be easily adapted to economic and political conditions. Project finance is designed to withstand shocks from political risk and a market’s inability to manage risk, pool savings, and facilitate transactions. As well as these characteristics, Esty (2002) describes the three main motivations for using project finance—agency cost, debt overhang, and risk management. The author argues that these are fundamental for reducing the cost of agency conflicts inside project companies, and the opportunity cost of underinvestment because of the leverage and incremental distress costs in sponsoring firms.
In sum, these characteristics and motivations prove that project finance creates value. For Esty (2002), the best way of understanding this is to recognize that firms bear deadweight costs when they make investment decisions. These costs—transaction costs, agency costs, distress costs, information costs, and taxes—come mainly from capital market imperfections. The author argues that, when total deadweight costs are much lower than the total costs of corporate-financed alternatives, the use of project finance is an efficient alternative. Thus, financing assets separately with nonrecourse loans can create more value than financing assets jointly with corporate debt.

Realizing the Potential of PPPs to Advance Asia’s Infrastructure Development120
Methodology and Data
Empirical Model
We are interested in two questions on loan syndications for project finance for PPP projects in Asia. What influences the extent of loan syndication on project finance? And what influences the likelihood of loan syndication on project finance? To answer these questions, we estimate our empirical model that takes the following form:
Loan Syndicate = α + β1 Legal Risk + β2Information Asymmetry + β3X + β4Z + ε.
Loan syndicate is either debt concentration or the loan syndicate dummy variable. Legal risk is proxied by the rule of law variable. Information asymmetry is proxied by Standard & Poor’s credit rating variable. X is the set of bank-specific characteristics, such as the tier 1 ratio, liquidity, the cost-to-income ratio, the bank regulation variable, and nonperforming loans. Z is the set of loan characteristics, which include loan maturity and tranche size; the loan security dummy variable is equal to 1 if the loan is accompanied by collateral, 0 otherwise. Macroeconomic variables are used to determine the likelihood of loan syndication in a separate regression analysis.
Data Description
The empirical analysis in this chapter uses the same data as in Chapter 4; that is, the data description in general (for example, classification of project deals by country and sector, and the description of bank balance sheets). The methodology and data section in Chapter 4 gives fuller details.
Summary Statistics of Key Variables
For this chapter’s analysis, two dependent variables are constructed to measure the extent and likelihood of project finance deals using bank loan syndication for PPP projects in the sample of the seven Asian countries. The first variable, debt concentration, is measured as the average loan share provided by each bank in the loan transaction. This approach was used by Esty and Megginson (2003) to analyze debt concentration. When no information on each arranger’s participation in a loan tranche is available, which applies to our case, an equal sharing of the loan amount is assumed.4 Table 5.1 shows the average debt concentration in the sample is $134.4 million, with a minimum debt concentration of $580,000 and a maximum of $2.1 billion, which indicates a high concentration of debt among project finance transactions.

Syndicated Loans in Project Finance—Empirical Evidence from Asian PPP Markets 121
Table 5.1: Summary Statistics of Key Variables
Variable MeanStandard Deviation Minimum Maximum
Debt concentration 134.40 238.50 0.58 2048.48
Loan syndication dummy 0.42 0.49 0.00 1.00
Rule of law –0.05 0.37 –0.61 1.02
S&P rating 0.03 0.16 0.00 1.00
Tier 1 ratio 12.89 8.20 7.75 92.15
Liquid-to-total assets 11.41 6.33 2.94 53.94
Bank regulation variable 0.31 32.56 –39.61 113.28
Cost over income 53.77 13.99 16.01 102.17
Nonperforming loans 2.94 1.57 0.01 7.28
Loan maturity (EW) 12.94 4.31 2.43 26.53
Loan security 0.34 0.47 0.00 1.00
Tranche size 160.17 266.79 0.29 2048.48
Repo rate 5.52 2.39 1.50 9.00
Inflation rate 5.35 3.48 –0.90 18.68
Credit default swap 117.68 40.32 43.82 469.78
EW = equally weighted, S&P = Standard & Poor’s. Sources: Author’s estimates, based on Thomson One Banker; Thomson Datastream; World Bank, Worldwide Governance Indicators and World Development Indicators; Bloomberg L.P.; and CEIC Data Company.
The second dependent variable, the loan syndication dummy, is a dummy variable equal to 1 if the loan is provided by more than one bank, and 0 otherwise. Forty-two percent of the projects in the sample are funded via loan syndication. All project deals in Malaysia and Viet Nam were funded by loan syndicates, but only 22% in India.
The main independent variable, legal risk, is proxied by the rule of law index from the World Bank’s Worldwide Governance Indicators Database.5 The rule of law composite index ranges from –2.5 to 2.5, with higher values corresponding to better rule of law. It is important to note that this variable is an inverse scale in proxying for legal risk, which means legal risk decreases as the rule of law index increases. In the seven-country sample, the index average is –0.05, with a minimum score of –0.61 and a maximum score of 1.02, which denotes a higher legal risk.

Realizing the Potential of PPPs to Advance Asia’s Infrastructure Development122
The second independent variable, information asymmetry, is captured by the dummy variable equal to 1 if the project borrower has a Standard & Poor’s senior unsecured debt rating, 0 otherwise. For Lee and Mullineaux (2001) and Godlewski (2008), the logic of using this variable is that higher quality information is available on firms with a credit rating. In the sample, only 3% of the project borrowers had a credit rating, indicating a high level of information asymmetry in the seven countries.
For bank-specific characteristics, the typical arranger in the sample shows a solid tier 1 level of 12.9%, which confirms that the banks in the sample are well-capitalized. Liquidity accounts for 11.4% of total assets, and the loan portfolio shows a low degree of riskiness (2.9%). The nonperforming-loan variable is used to proxy both asset quality and a bank’s supervisory mechanism.6
Bank efficiency in terms of the cost-to-income ratio is about 54%. The ratio is also interacted with the regulatory quality index of the Worldwide Governance Indicators to capture banking regulation.7 While this approach is slightly different from the one used by Godlewski (2008), the interaction of bank efficiency and the regulatory environment should provide a good proxy for banking regulation, as it directly captures the efficiency aspect of the banking structure and the quality of regulations in promoting private sector development, including banks.8
Loan characteristics are also used in the empirical analysis to test whether debt-related variables affect the extent and propensity of banks to participate in loan syndicates. Dennis and Mullineaux (2000) note that “certain characteristics of the loan itself may affect the agent bank’s capacity to syndicate either because the characteristic serves to attenuate agency costs or because it influences the perceived value to the buyer for non-agency-related reasons.” Some of these characteristics include loan maturity and loan collateral, which were discussed in the literature review. In the seven-country sample, the average maturity of a PPP project finance deal is 13 years, spanning 2.4 years–26.5 years. The loan maturity variable is also used to proxy for recontracting adjustments to PPP infrastructure projects.
Loan security is a dummy variable equal to 1 if the loan is collateralized, 0 otherwise. Thirty-four percent of the sample are projects secured through collateral. The loan’s tranche size is also used as an independent variable, because loan size affects a bank’s decision to syndicate a loan. The average tranche size in the sample is $160 million, with a minimum of $300,000 and a maximum of $2 billion.
The dataset is further complemented by country variables that proxy for macroeconomic and financial conditions. The inflation rate is used to proxy
Syndicated Loans in Project Finance—Empirical Evidence from Asian PPP Markets 123
for macroeconomic stability, the repo rate for monetary policy, and the credit default swap spread for a country’s credit risk profile. The average inflation rate in the sample is 5.4%, and the average repo rate is 5.5%. The average credit default swap spread is 117.7.
Empirical EstimatesThis section presents the estimates derived from the empirical model presented in the previous section. We take several steps to understand empirically the extent of bank loan syndication in relation to its primary determinants based on the literature—rule of law, information asymmetry, and other bank- and loan-specific characteristics. First, we examine this relationship while controlling for broad bank- and loan-specific characteristics. Bank variables include the tier 1 ratio, liquidity, and nonperforming loans; loan variables are loan maturity, loan security, and loan-tranche size. The interaction variable of the cost-to-income ratio and the regulatory quality index was also included to capture bank structure and banking regulation.
Table 5.2 shows these specifications and the ordinary least squares regression results of the debt concentration variable on the explanatory variables. We find that regressions have a high degree of explanatory power: all regressions have an R2 of at least 0.70. Regressions are conducted with and without fixed effects to check and control for unobserved heterogeneity across sectors, quarters, and countries. Standard errors are clustered at the project level to account for correlation among projects in the sample.
Table 5.2 shows the coefficients of the rule of law variable in columns 1 to 5 are all positive, implying a strong direct association between the rule of law index and debt concentration (or an inverse relationship between legal risk and debt concentration). Greater rule of law (or a lower legal risk), therefore, increases the extent of loan syndication. This relationship holds even after controlling for bank- and loan-specific characteristics. The same positive relationship robustly holds with and without sector and time (quarter) fixed effects. The coefficient of the legal risk variable in all the specifications are also significant. These results show that, in the seven countries, bank lenders to PPP infrastructure projects are more likely to form a more concentrated syndicate when they can rely on the efficiency of courts and other legal institutions to protect and enforce contract arrangements, which confirms the empirical findings of Esty and Megginson (2003). Bank lenders, however, tend to create larger and more diffuse syndicates to discourage strategic default when they cannot rely on courts for legal enforcement mechanisms. When banks experience inefficiencies in the legal system, they are exposed to greater legal risk, which affects their lending behavior.

Realizing the Potential of PPPs to Advance Asia’s Infrastructure Development124Ta
ble
5.2:
Bas
elin
e Re
gres
sions
on
Deb
t Con
cent
ratio
n
Vari
able
Pro
xy fo
r(1
)(2
)(3
)(4
)(5
)R
ule
of la
wLe
gal r
isk
121.
2***
140.
6***
105.
4**
126.
7**
659.
4*(4
3.86
)(5
2.89
)(4
9.76
)(6
1.63
)(3
87.2
)S&
P ra
ting
Info
rmat
ion
asym
met
ry–5
5.04
–38.
63–2
1.79
–17.
98–1
4.64
(45.
23)
(58.
93)
(51.
59)
(66.
19)
(74.
99)
Tie
r 1
ratio
Bank
cap
italiz
atio
n–7
.101
***
–8.0
46**
*–6
.039
*–6
.670
5.86
4*(2
.535
)(3
.076
)(3
.639
)(4
.184
)(3
.216
)Li
quid
/tot
al a
sset
sLi
quid
ity–5
.241
**–5
.488
**–4
.406
*–4
.797
*–2
.393
(2.2
09)
(2.5
71)
(2.3
34)
(2.5
79)
(1.6
43)
Bank
reg
ulat
ion
Bank
str
uctu
re
–0.6
19–0
.700
–0.4
04–0
.575
–1.5
65(0
.443
)(0
.510
)(0
.511
)(0
.561
)(1
.651
)N
onpe
rfor
min
g lo
ans
Supe
rvis
ory
mec
hani
sm8.
208
8.52
311
.68
11.6
012
.56
(6.3
45)
(7.4
63)
(7.3
43)
(8.8
43)
(8.1
98)
Loan
mat
urity
(EW
)Lo
an c
hara
cter
istic
s–1
.902
–1.2
24–0
.937
–0.1
02–0
.019
(2.7
58)
(2.8
57)
(3.2
39)
(3.2
08)
(2.8
91)
Loan
sec
urity
Loan
cha
ract
eris
tics
–9.1
15–5
.257
–12.
71–6
.845
–3.5
34(1
9.48
)(2
0.27
)(2
1.39
)(2
5.27
)(2
1.26
)T
ranc
he s
ize
Loan
cha
ract
eris
tics
0.65
8***
0.66
5***
0.65
5***
0.66
1***
0.74
0***
(0.1
27)
(0.1
16)
(0.1
38)
(0.1
24)
(0.1
03)
Con
stan
t17
6.2*
*10
3.9
78.0
0–0
.061
–70.
22(6
9.75
)(7
7.15
)(1
25.0
0)(1
37.0
0)(1
02.2
0)Se
ctor
FE
No
Yes
No
Yes
Yes
Qua
rter
FE
No
No
Yes
Yes
Yes
Cou
ntry
FE
No
No
No
No
Yes
Obs
erva
tions
193
193
193
193
193
R2
0.
708
0.71
90.
734
0.74
40.
822
EW =
equ
ally
wei
ghte
d, F
E =
fixe
d eff
ects
, S&
P =
Stan
dard
& P
oor’s
.N
otes
: 1.
The
tabl
e pr
esen
ts o
rdin
ary
leas
t squ
ares
reg
ress
ion
resu
lts to
exa
min
e th
e de
term
inan
ts o
f the
ext
ent o
f ban
k lo
an s
yndi
catio
ns o
n pr
ojec
t fina
nce
deal
s in
Asi
a.
2. T
he d
epen
dent
var
iabl
e is
deb
t con
cent
ratio
n.3.
Sta
ndar
d er
rors
(in
pare
nthe
ses)
are
clu
ster
ed a
t the
pro
ject
leve
l to
acco
unt f
or c
orre
latio
n am
ong
proj
ects
in th
e sa
mpl
e.
***
p <
0.01
**
p <
0.05
* p
< 0
.10So
urce
: Aut
hors
’ est
imat
es.

Syndicated Loans in Project Finance—Empirical Evidence from Asian PPP Markets 125
Table 5.2 shows that the coefficients of the tier 1 ratio in columns (1) to (4) are negative and significant. In turn, this shows that stronger banks with more solid capital bases are less likely to form concentrated loan syndicates on lending, which confirms the inverse relationship between capital requirements and debt concentration in the context of syndicated lending. Consistent with the findings of Simons (1993), a higher capital-to-asset ratio provides an incentive for bank lenders to form and participate in a loan syndicate because they will be unwilling to put a large loan on their balance sheet that will lower their ratios. In which case, banks may opt to participate in a loan syndicate to pursue lending. Godlewski (2008) supports this. The existence of capital requirements should positively influence the formation of loan syndicates through the motivation of “lending limit respect,” where a stronger capital requirement increases the motivation relevance. A higher capital-to-asset ratio, therefore, increases the size of a loan syndicate and decreases its debt concentration.
The coefficients of the liquid-to-total-assets ratio are all negative and significant in columns (1) to (4). The empirical result implies that higher bank liquidity discourages the formation of more concentrated loan syndicates for lending to PPP infrastructure projects in the seven countries. While the relationship between bank liquidity and the level of debt concentration in a loan syndicate have not been established in the literature, some empirical evidence might support our finding. Using bank survey data, Pavel and Phillis (1987) find a positive and significant relationship between bank liquidity and the prospect for selling a loan. In the context of loan syndication, this may imply that higher bank liquidity results in the formation of large, diffuse syndicates. The authors note in this connection that if loan sales are primarily driven by liquidity and diversification prospects, then selling a loan should be encouraged. If this is the case, then higher bank liquidity is associated with a greater chance that banks will form less concentrated (or bigger, diffuse syndicates) in the event of syndication.
Among loan-specific characteristics, the coefficients of loan-tranche size appear to be significant in all the specifications. The robust positive relationship of loan-tranche size and debt concentration is also in line with studies that show the size of bank loans greatly influences the monitoring incentive of banks. A bank that lends a large amount to a borrower has a greater incentive to monitor the borrower’s management of earnings and capacity to pay. Ahn and Choi (2009), as noted earlier, find that, as banks tend to lend bigger loan amounts, they are also more prone to risk and have a greater motivation for monitoring their borrowers. This implies that, as loan-tranche sizes increase, banks form more concentrated syndicates to observe the conduct of bank monitoring. Khalil and Parigi (1998) show that loan size signals a bank’s greater stake in enhancing monitoring prospects because it also affects the income reporting of borrowers. Further, Kang et al. (2000) and

Realizing the Potential of PPPs to Advance Asia’s Infrastructure Development126
Lee and Mullineaux (2001) find a positive relation between the size of a bank loan and a bank’s incentive to do monitoring.
Other explanatory variables in the regressions that are found to affect the debt concentration of loan syndicates in the literature, such as Standard & Poor’s ratings, nonperforming loans, and loan maturity and security, are not significant. And, while the coefficients of the loan maturity variable are not significant, the negative sign of the coefficients confirms our hypothesis that banks are less likely to lend more in a loan syndicate amid lengthening loan tenors, since longer tenors are associated with higher project risk. This empirical result supports research findings that short-term loans are more effective in resolving agency problems in the context of debt financing (Farinha and Santos 2002; Jones, Lang, and Nigro 2005, for example). The negative coefficients of the loan security variable also confirm the association between loan collateral and loan syndication. Because loan collateral signals a borrower’s credit worthiness, the presence of loan collateral accordingly reduces the problems associated with information asymmetry that lead to the formation of large, diffuse loan syndicates.
Special mention of the information asymmetry variable needs to be made. The coefficient of Standard & Poor’s variable is negative, but not significant. The relationship is, however, consistent with the findings in the literature that banks form more concentrated loan syndicates when problems of information asymmetry in loan transactions are potentially severe. The motivation for monitoring and due diligence encourage the lead arranger and syndicate members to form a more concentrated syndicate (Dennis and Mullineaux 2000; Lee and Mullineaux 2001; Sufi 2007). One possible explanation of why the information asymmetry variable is not significant across all the regression specifications is because the dataset contains all project finance transactions, which may have already captured and treated agency cost problems in bank lending.
To assess the robustness of the empirical results, we run the baseline regressions without controlling for loan-specific characteristics. Table 5.3 shows the ordinary least squares estimates of the baseline regression without the loan-specific variables. We find evidence that the regression results on the impact of the ratio of the rule of law index to debt concentration is indeed robust and significant. Other explanatory variables, such as the tier 1 ratio and the liquid-to-assets ratio, also show robust and significant results. Moreover, the bank regulation variable is now significant among these specifications. Columns (1) to (4) show the coefficient of the bank regulation variable is negative and significant at 1%, which confirms the positive relationship between cost efficiency and debt concentration.

Syndicated Loans in Project Finance—Empirical Evidence from Asian PPP Markets 127
Table 5.3: Baseline Regressions without Loan-Specific Characteristics
Variable Proxy for (1) (2) (3) (4) (5)Rule of law Legal risk 231.9*** 187.4** 206.6*** 141.1* 712.3*
(57.26) (75.34) (65.19) (75.21) (414.7)S&P rating Information
asymmetry–4.705 –19.37 2.475 10.37 7.317
(38.66) (57.34) (42.96) (78.87) (120.7)Tier 1 ratio Bank
capitalization–10.28** –14.02* –3.393 –8.569 –10.09
(4.324) (7.250) (4.016) (8.650) (8.169)Liquid/total assets
Liquidity –3.846** –4.899** –2.386 –3.123 –1.471(1.768) (2.396) (2.109) (2.520) (2.482)
Bank regulation
Bank structure
–2.700*** –2.314*** –2.582*** –1.974*** 1.075(0.757) (0.797) (0.795) (0.747) (2.206)
Constant 310.8*** 390.7*** 107.5 189.3 338.3**(76.37) (108.9) (70.61) (134.9) (171.0)
Sector FE No Yes No Yes YesQuarter FE No No Yes Yes YesCountry FE No No No No YesObservations 207 207 207 207 207R2 0.105 0.135 0.178 0.207 0.242
FE = fixed effects, S&P = Standard & Poor’s.Notes:1. The table presents ordinary least squares regression results to examine the determinants of
the extent of bank loan syndications on project finance deals in Asia. 2. The dependent variable is debt concentration.3. Standard errors (in parentheses) are clustered at the project level to account for correlation
among projects in the sample. *** p < 0.01 ** p < 0.05 * p < 0.10Source: Authors’ estimates.
We now investigate the determinants of the likelihood of loan syndication for project finance using the dummy for loan syndication as the dependent variable. For consistency, the same set of explanatory variables in the baseline regression is used to determine the factors that influence the likelihood that banks will form and participate in a loan syndicate. The probit specifications show that, except for bank liquidity, most of the variables used in the baseline regression are not robustly significant. The main explanatory variables, such as the rule of law index, tier 1 ratio, and bank regulation, do not significantly affect the likelihood that banks will form and participate in a loan syndicate. Appendix A5.1 gives the regression specification results.

Realizing the Potential of PPPs to Advance Asia’s Infrastructure Development128
To further examine the factors that influence the likelihood of loan syndication, we run specifications using a set of explanatory variables that may influence a bank’s decision to form and participate in a loan syndicate. Table 5.4 shows the probit specification where the dummy variable is regressed to a set of macroeconomic variables that capture monetary policy (repo rate), macroeconomic stability (inflation rate), and a country’s credit risk profile (credit default swap spread). Loan-specific characteristics, such as loan-tranche size, loan maturity, and loan security, are also included. Regressions are conducted with and without fixed effects.
Table 5.4: Probit Regression on the Likelihood of Loan Syndication
Variable Proxy for (1) (2) (3) (4) (5)Repo rate Monetary
policy–0.211*** –0.220*** –0.103 –0.087 0.597*
(0.073) (0.077) (0.116) (0.118) (0.329)
Inflation rate
Macroeconomic stability
–0.003 –0.005 –0.123 –0.138 0.160
(0.056) (0.059) (0.099) (0.099) (0.132)
Loan maturity (EW)
Recontracting adjustments
–0.013 –0.005 –0.008 0.000 0.001
(0.022) (0.022) (0.023) (0.024) (0.027)
CDS spread Credit risk 0.011*** 0.013*** 0.012*** 0.013*** 0.009*
(0.003) (0.003) (0.003) (0.003) (0.005)
Tranche size Loan characteristics
0.001** 0.001 0.001** 0.001* 0.001
(0.000) (0.000) (0.000) (0.000) (0.000)
Loan security
Loan characteristics
–0.407** –0.514*** –0.186 –0.321 –0.321
(0.195) (0.198) (0.220) (0.225) (0.266)
Constant –0.158 –0.0973 –0.625 –0.708 –9.109***
(0.481) (0.631) (0.613) (0.749) (3.021)
Sector FE No Yes No Yes Yes
Quarter FE No No Yes Yes Yes
Country FE No No No No Yes
Observations 244 244 236 236 228
Prob>chi2 0.000 0.000 0.000 0.000 0.000
Pseudo R2 0.152 0.185 0.249 0.274 0.329
CDS = credit default swap, EW = equally weighted, FE = fixed effects.Notes:1. The table presents probit regression results to examine the determinants of the likelihood of
bank loan syndications on project finance deals in Asia. 2. The dependent variable is the loan syndication dummy variable3. Standard errors (in parentheses) are clustered at the project level to account for correlation
among projects in the sample. *** p < 0.01 ** p < 0.05 * p < 0.10Source: Authors’ estimates.

Syndicated Loans in Project Finance—Empirical Evidence from Asian PPP Markets 129
Columns (1) and (2) in Table 5.4 show the repo rate coefficients are negative and significant at 1%. This implies that tighter monetary policy reduces the prospect for loan syndication. While the result is not robust across all specifications, the empirical result provides some evidence that the bank lending channel may also be affected by the impact of monetary policy in the willingness of banks to take risk (the risk-taking channel) (Bernanke and Gertler 1995; Borio and Zhu 2008). The coefficient sign in column (5), however, is positive and significant at 10% where sector, quarter, and country fixed effects are present. This implies the impact of monetary policy on bank lending in the context of syndicated lending is ambiguous and remains an empirical question.
Table 5.4 also shows the coefficients of the spread variable for credit default swaps are all positive and robustly significant in all the specifications (significant at 1% in four out of five specifications, significant at 10% in one). This robust finding indicates that, because credit default swaps reduce the credit risk exposure of banks to potential lenders, bank lenders are more likely to form and participate in a loan syndicate. Credit default swaps also reduce the incentives of banks to conduct bank monitoring, which in turn encourages the formation of a loan syndicate. This empirical finding is highly consistent with the view that the potential risk to banks caused by agency problems reduces the likelihood of syndication.
Loan-tranche size coefficients are all positive and significant in three out of five regressions. Consistent with the literature, banks are more likely to syndicate a loan when the size of the loan is significantly large. Also, the coefficient for loan security is significant in columns (1) and (2), which confirms the findings in the literature that loan collateral reduces the problems associated with information asymmetry, which in turn encourages the formation of a loan syndicate.
Conclusions and Policy ImplicationsThis chapter examined syndicated bank lending in the context of project finance to PPP infrastructure projects in developing Asia. Overall, the evidence indicates that the extent of bank syndication in the seven countries analyzed (India, Indonesia, Malaysia, the Philippines, the Republic of Korea, Thailand, and Viet Nam) is primarily driven by the level of a country’s legal risk, as well as the capitalization and liquidity levels of banks. The likelihood that banks will form and participate in a loan syndicate is greatly influenced by monetary policy, a country’s risk profile, and bank liquidity, as well as loan-specific characteristics, such as loan-tranche size and loan security.

Realizing the Potential of PPPs to Advance Asia’s Infrastructure Development130
While the volume and leverage of bank financing on project finance in the seven countries are underpinned by their macroeconomic variables, syndicated bank lending is driven by variables related to institutional quality that affect the governance role of banks in response to a country’s legal environment. These findings have a significant policy implication for creating an enabling environment for infrastructure PPPs: attracting private financing for project finance not only depends on policies that support sustained economic growth, but also on the efficiency of the legal system by which banks are given creditor rights, and that project finance contracts are protected and are fully enforced. This supports the recommendation of Vecchi et al. (2017) that strong institutions and a dedicated legal framework are crucial for promoting PPPs.
The empirical findings further suggest that the use of project finance as a financing tool in PPP infrastructure projects may help mitigate information asymmetry problems. The role of project finance in promoting PPPs is crucial because it promotes risk transfer and optimal allocation among PPP stakeholders, and its potential use to mitigate information asymmetry problems warrants further empirical investigation.
Notes1. Legal risk is defined here as the extent to which creditors have legal rights and can rely on
courts for the enforcement of contracts.2. Selling loans without recourse implies syndicating a loan.3. Nonrecourse loans have no or only limited support from sponsors.4. Equal sharing is assumed based on the literature; see, for instance, Esty (2001). The author
assumes equal commitment on the loan underwriting when estimating the fee distribution among lead and colead arrangers. Gatti et al. (2013) use the same assumption where no data on the composition of the syndicate are provided.
5. According to the World Bank, “Rule of law captures perceptions of the extent to which agents have confidence in and abide by the rules of society, and in particular the quality of contract enforcement, property rights, the police, and the courts, as well as the likelihood of crime and violence.” http://info.worldbank.org/governance/wgi/pdf/rl.pdf.
6. Godlewski (2008) introduces the use of a nonperforming loan dummy variable (equal to 1 if a formal definition of nonperforming loan exists, 0 otherwise) to capture bank supervisory mechanisms. The author says, “These regulatory features should have a positive influence on syndicate size as they enhance transparency on participant banks’ loan portfolios through supervisory discipline.”
7. According to the World Bank, “Regulatory quality captures perceptions of the ability of the government to formulate and implement sound policies and regulations that permit and promote private sector development.” http://info.worldbank.org/governance/wgi/pdf/rq.pdf.
8. Godlewski (2008) constructs an interaction variable of minimum capital requirements and a dummy variable equal to 1, if the minimum regulatory capital ratio varies with bank credit risk to capture banking regulation.

Syndicated Loans in Project Finance—Empirical Evidence from Asian PPP Markets 131
Appendix A5.1: Probit Regression on the Loan Syndication Dummy Variable
Variable Proxy for (1) (2) (3) (4) (5)Rule of law Legal risk –0.572 –1.008 –0.729 –1.511* –12.600
(0.573) (0.698) (0.642) (0.772) (9.426)S&P rating Information
asymmetry…. …. …. …. ….
Tier 1 ratio Bank capitalization
0.010 –0.001 0.080 0.070 –0.149(0.041) (0.042) (0.059) (0.065) (0.153)
Liquid/total assets
Liquidity 0.153*** 0.152*** 0.131*** 0.140*** 0.167***(0.038) (0.039) (0.036) (0.039) (0.046)
Bank regulation Bank structure 0.003 0.006 0.003 0.010 –0.021(0.007) (0.007) (0.008) (0.008) (0.020)
Nonperforming loan
Supervisory mechanism
0.040 0.049 0.121 0.161 0.125(0.090) (0.095) (0.106) (0.126) (0.155)
Loan maturity (EW)
Loan characteristics
0.043* 0.054** 0.046 0.062* 0.057(0.026) (0.027) (0.032) (0.034) (0.038)
Loan security Loan characteristics
–0.051 –0.098 –0.175 –0.284 –0.152(0.234) (0.231) (0.284) (0.294) (0.341)
Tranche size Loan characteristics
0.001** 0.001** 0.001* 0.001 0.001(0.000) (0.000) (0.001) (0.001) (0.001)
Constant –2.684*** –3.406*** –4.055*** –5.073*** –4.981**(0.826) (1.072) (1.271) (1.521) (2.133)
Sector FE No Yes No Yes YesQuarter FE No No Yes Yes YesCountry FE No No No No YesObservations 192 192 190 190 166
Prob > chi2 0.000 0.000 0.000 0.000 0.000Pseudo R2 0.233 0.268 0.339 0.394 0.402
… = not available or dropped, EW = equally weighted, FE = fixed effects, S&P = Standard & Poor’s.
Notes:1. The table presents ordinary least squares regression results to examine the determinants of
the likelihood of bank loan syndications on project finance deals in Asia. 2. The dependent variable is the loan syndication dummy variable.3. Standard errors (in parentheses) are clustered at the project level to account for correlation
among projects in the sample. 4. An S&P rating variable that is not equal to 0 predicts success perfectly. S&P rating variable
dropped in the regression result.*** p < 0.01 ** p < 0.05 * p < 0.10
Source: Authors’ estimates.

Realizing the Potential of PPPs to Advance Asia’s Infrastructure Development132
The coefficients of liquid-to-total assets ratio are positive and robustly significant in all the specifications. The empirical result implies that higher bank liquidity is associated with better prospects for loan syndication on lending to Asian public–private partnership infrastructure projects. This is very much in line with the empirical estimates of Pavel and Phillis (1987), where they find a positive and significant relationship between bank liquidity and the prospects for selling a loan.
The coefficients of loan maturity variable are all positive and significant in three out of five specifications. This provides some evidence that loan maturity influences a bank’s decision to form and participate in a loan syndicate. The empirical results also support the view by Dennis and Mullineaux (2000) that, if “avoiding duplicate monitoring costs or potential rent extractions is a relevant consideration, then lengthening a loan’s maturity would enhance its syndication potential.”

Syndicated Loans in Project Finance—Empirical Evidence from Asian PPP Markets 133
References
Ahn, Sungyoon and Wooseok Choi. 2009. The Role of Bank Monitoring in Corporate Governance: Evidence from Borrower’s Earnings Management Behavior. Journal of Banking & Finance 33 (2): pp. 425–434.
Berger, Allen N. and Gregory F. Udell. 1990. Collateral, Loan Quality, and Bank Risk. Journal of Monetary Economics 25 (1): pp. 21–42.
Berlin, Mitchell and Jan Loeys. 1988. Bond Covenants and Delegated Monitoring. Journal of Finance 43 (2): pp. 397–412.
Berlin, Mitchell and Loretta Mester. 1992. Debt Covenants and Renegotiation. Journal of Financial Intermediation 2 (2): pp. 95–133.
Bernanke, Ben and Mark Gertler. 1995. Inside the Black Box: The Credit Channel of Monetary Policy Transmission. Journal of Economic Perspectives 9 (4): pp. 27–48.
Besanko, David and Anjan Thakor. 1987. Collateral and Rationing: Sorting Equilibria in Monopolistic and Competitive Credit Markets. International Economic Review 28 (3): pp. 671–689.
Bester, Helmut. 1985. Screening Vs. Rationing in Credit Markets with Imperfect Information. American Economic Review 75 (4): pp. 850–855.
Boot, Arnoud W. and Anjan V. Thakor. 2000. Can Relationship Banking Survive Competition? Journal of Finance 55 (2): pp. 679–713.
Borio, Claudio and Haibin Zhu. 2008. Capital Regulation, Risk-Taking and Monetary Policy: A Missing Link in the Transmission Mechanism? BIS Working Papers No. 268. Basel: Bank for International Settlements.
Brealey, Richard A., Ian A. Cooper, and Michel A. Habib. 1996. Using Project Finance to Fund Infrastructure Investments. Journal of Applied Corporate Finance 9 (3): pp. 25–39.
Dennis, Steven A. and Donald J. Mullineaux. 2000. Syndicated Loans. Journal of Financial Intermediation 9 (4): pp. 404–426.
Diamond, Douglas. 1984. Financial Intermediation and Delegated Monitoring. Review of Economic Studies 51 (3): pp. 393–414.

Realizing the Potential of PPPs to Advance Asia’s Infrastructure Development134
Esty, Benjamin C. 2001. Structuring Loan Syndicates: A Case Study of the Hong Kong Disneyland Project Loan. Journal of Applied Corporate Finance 14 (3): pp. 80–95.
———. 2002. The Economic Motivations for Using Project Finance. Harvard Business School Journal 28: pp. 1–42.
Esty, Benjamin C. and William L. Megginson. 2003. Creditor Rights, Enforcement and Debt Ownership Structure: Evidence from the Global Syndicated Loan Market. Journal of Financial and Quantitative Analysis 38 (1): pp. 37–60.
Fama, Eugene. 1985. What’s Different About Banks? Journal of Monetary Economics 15 (1): pp. 29–39.
Farinha, Luisa A. and Joao Santos. 2002. Switching from Single to Multiple Bank Lending Relationships: Determinants and Implications. Journal of Financial Intermediation 11 (2): pp. 124–151.
Freixas, Xavier and Jean-Charles Rochet. 1997. Microeconomics of Banking. Cambridge, MA: MIT Press.
Gatti, Stefano, Stefanie Kleimeier, William Megginson, and Alessandro Steffanoni. 2013. Arranger Certification in Project Finance. Financial Management 42 (1): pp. 1–40.
Godlewski, Christophe J. 2008. Banking Environment, Agency Costs, and Loan Syndication: A Cross-Country Analysis. LARGE Working Paper No. 2008-08. Strasbourg: University of Strasbourg.
Holmstrom, Bengt. 1979. Moral Hazard and Observability. Bell Journal of Economics 10 (1): pp. 74–91.
Holmstrom, Bengt and Jean Tirole. 1997. Financial Intermediation, Loanable Funds, and the Real Sector. Quarterly Journal of Economics 112 (3): pp. 663–691.
Jones, Jonathan D., William W. Lang, and Peter J. Nigro. 2005. Agent Bank Behavior in Bank Loan Syndications. Journal of Financial Research 28 (3): pp. 385–402.
Kang, Jun-Koo, Anil Shivdasani, and Takeshi Yamada. 2000. The Effect of Bank Relations on Investment Decisions: An Investigation of Japanese Takeover Bids. Journal of Finance 55 (5): pp. 2197–2218.
Khalil, Fahad and Bruno M. Parigi. 1998. Loan Size as a Commitment Device. International Economic Review 39 (1): pp. 135–150.

Syndicated Loans in Project Finance—Empirical Evidence from Asian PPP Markets 135
Kleimeier, Stefanie and Roald Versteeg. 2010. Project Finance as a Driver of Economic Growth in Low-Income Countries. Review of Financial Economics 19 (2): pp. 49–59.
Lee, Sang Whi and Donald J. Mullineaux. 2001. The Size and Composition of Commercial Lending Syndicates. University of Kentucky Working Paper. doi: 10.2139/ssrn.292874.
Merton, Robert and Zvi Bodie. 1995. A Conceptual Framework for Analyzing the Financial Environment. In The Global Financial System: A Functional Perspective, edited by Dwight Crane, Kenneth Froot, Scott Mason, André Perold, Robert Merton, Zvi Bodie, Erik Sirri, and Peter Tufano. Boston, MA: Harvard Business School Press.
Pavel, Christine A. and David Phillis. 1987. Why Commercial Banks Sell Loans: An Empirical Analysis. Economic Perspectives 11 (3): pp. 3–14.
Pennacchi, George. 1988. Loan Sales and the Cost of Bank Capital. Journal of Finance 43 (2): pp. 375–396.
Pichler, Pegaret. 2001. A Theory of the Syndicate: Form Follows Function. Journal of Finance 56 (6): pp. 2237–2264.
Rajan, Raghuram and Andrew Winton. 1995. Covenants and Collateral as Incentives to Monitor. Journal of Finance 50 (4): pp. 1113–1146.
Simons, Katerina. 1993. Why Do Banks Syndicate Loans? New England Economic Review (January–February): pp. 45–52.
Smith, David C. and Steven Ongena. 1998. Bank Relationships: A Review. In Performance of Financial Institutions: Efficiency, Innovations, Regulations, edited by Patrick Harker and Stavros A. Zenios. Cambridge, United Kingdom: Cambridge University Press.
Sufi, Amir. 2007. Information Asymmetry and Financing Arrangements: Evidence from Syndicated Loans. Journal of Finance 62 (2): pp. 629–668.
Vecchi, Veronica, Mark Hellowell, Raffaele Della Croce, and Stefano Gatti. 2017. Government Policies to Enhance Access to Credit for Infrastructure-Based PPPs: An Approach to Classification and Appraisal. Public Money and Management 37 (2): pp. 133–140.


CHAPTER 6
Determinants of Public–Private Partnerships in Infrastructure in Emerging Economies
Suk Hyun, Donghyun Park, and Shu Tian
IntroductionThis chapter aims to shed useful light on the role that greater access to finance—especially bonds—can play in promoting public–private partnership (PPP) investments in developing countries. Most developing countries still depend heavily on fiscal financing for infrastructure projects although great efforts have been made to use private capital. Our empirical results reconfirm that banks remain the main financiers for infrastructure projects.1 But domestic bond markets with enough depth and liquidity need to be developed to provide long-term funding for private entities looking to invest in infrastructure through PPPs.
Interestingly, our empirical results show a negative impact on the development of domestic bond markets from PPP investments. One possible interpretation of this is that infrastructure financing using government bonds, which dominate bond markets in developing countries, reduces the participation of the private sector by restricting its access to financing through corporate bond markets. Our evidence underlines the importance of well-functioning corporate bond markets in developing countries to make long-term financing available for the participation of the private sector in infrastructure.
After a brief overview of PPPs in infrastructure financing, this chapter reviews the literature that identifies the major determinants of infrastructure PPPs, and describes the data and empirical framework used. We then present our main empirical findings on the determinants of PPPs in 12 selected developing countries.2 From these findings, we identify the main obstacles for attracting private capital for infrastructure investments and discuss the economic and financial market conditions that need to be in place to attract more private investment in infrastructure for developing countries.

Realizing the Potential of PPPs to Advance Asia’s Infrastructure Development138
Overview of PPPs in Infrastructure FinancingThe financial structure of PPPs should minimize financing costs, be bankable, and fulfill contractual obligations by transferring the responsibility of allocating funds for large infrastructure projects to the private sector partner. Neither governments nor private companies alone have the financial resources to build all the infrastructure they need, and to cover all the risks inherent in these projects.
PPPs are at the core of government efforts in developing countries to attract private infrastructure investments. But these investments cannot be made without mitigating the considerable risks inherent in these projects. From the nexus of infrastructure development, economic growth, and financial market development, these risks are generally worth taking.
Governments might not provide private sector sponsors or operators with sufficient incentives to design and monitor their projects carefully, if they show their explicit or implicit readiness to cover losses of failed projects in any event. Contrary to the original intention of PPPs to reduce fiscal burdens, some infrastructure projects in emerging economies have not done this because they had to be rescued by government funds because of social necessity when they failed. In some cases, government support without appropriate risk-sharing mechanisms might have caused moral hazard problems with the private sector partners.
In general, commercial risks are best controlled and absorbed by private partners in PPPs, while political and regulatory risks are best left to governments to deal with. An optimal risk- and profit-sharing mechanism must, therefore, be designed to strike a balance between a project’s public purpose and its viability to attract private financing. Hyun, Nishizawa, and Yoshino (2008) argue that it is essential to design risk-sharing mechanisms to prevent moral hazard, and to strike a balance between a PPP project’s public nature and its commercial viability.
PPPs are mainly financed through three mechanisms: public sector finance, corporate finance, and project finance. When the public sector finances a project, the state or government provides all or part of the capital investment, while the private partner provides know-how. With corporate finance, the private partner finances the project; this mechanism is typically used when private operators are large enough to finance a project from their own resources. Project finance is limited-resource financing through a company, usually called a special purpose vehicle (SPV), which is set up to implement the project.

Determinants of PPPs in Infrastructure in Emerging Economies 139
An SPV functions as a bankruptcy-remote subsidiary for a parent company, and its role is limited to the acquisition and financing of specific project assets. An SPV can raise capital without carrying the debt or other liabilities of the parent company. A subsidiary is often set up and run by the same parties that control the SPV, which builds and operates a project to meet the requirements of a PPP contract. A private partner in a PPP contract often needs an SPV as part of the contract arrangement, especially for large infrastructure projects. The SPV is responsible for funding, usually in the form of project finance in which the main source of payment is based on a project’s future cash flows.
PPPs financed by SPVs have two funding sources: equity and debt. Equity financing is an optimal shareholding structure for governments because they can lower the cost of capital, attract more private participation, and consequently increase the quality and viability of PPP projects. For emerging economies with underdeveloped financial markets, government participation can help secure private investment by correcting market failure (Moszoro 2014). This is because the cost of capital for private partners is on average 100–300 basis points higher than for the public sector (Moszoro and Gąsiorowski 2008). By contrast, PPPs are highly leveraged, with debt financing accounting for 70%–90% of a project’s cost. Debt providers care about downside risks and measures to mitigate risk. Although the contractual arrangement is made between the public and the private partners, it is the lender who sets the parameters to mitigate risk. And this risk evaluation is reflected in the risk premium, which is incorporated in the cost of debt (Singh and Kalidindi 2014).
Many developing countries reformed their infrastructure sectors in the late 1980s and early 1990s to promote competition through liberalization and privatization, to strengthen regulatory environments, and to attract private and foreign actors in the ownership, management, and operation of infrastructure. These countries now need to further harness private sector investment in infrastructure with coordinated reforms for their financial markets. Financing accessibility, especially bond financing, has become an alternative means for infrastructure financing because of rising fiscal burdens and falling bank lending under regulatory changes, such as Basel III.3
How are bank loans and bonds compared in PPP project financing for infrastructure? For loans for PPP projects, banks investigate the creditability of prospective projects and screen safe borrowers from less safe ones. After a loan is made, banks often monitor the borrower’s business to prevent moral hazard. For PPP projects, gathering information and monitoring are conducted on a bilateral basis between borrowers and lenders.
Issuing bonds for infrastructure PPPs is a form of direct financing channeled through capital markets from a broad base of investors. To issue

Realizing the Potential of PPPs to Advance Asia’s Infrastructure Development140
bonds, an issuer’s financial health is scrutinized and rated, and the information can be made public if necessary. Underwriting is vital for disseminating this information to the public, as well as for dealing with risks related to public offerings. Bonds are standardized financial instruments and, importantly, transferable through capital markets. Bond financing suits the financing needs of PPP projects for infrastructure by matching the long gestation periods of these projects, and by financing the large amounts of capital needed for their construction, operation, and maintenance. By contrast, bank financing cannot match the long gestation periods and the funding requirements of capital-intensive infrastructure PPP projects because of single lending limits, credit controls, and concentration risks on bank loans.
Against these backdrops, looking at new avenues to increase private sector participation in infrastructure financing to advance infrastructure development in developing countries is getting increased attention. Our empirical results show that bond financing by the private sector does not contribute to increased PPP investment in infrastructure. And, interestingly, they show that heavy government bond financing for infrastructure projects disincentivizes private investment. Low- and middle-income developing countries still depend on fiscal financing for infrastructure instead of private investment. This might be because of their underdeveloped corporate bond markets, which cannot offer long-term financing for infrastructure.
Literature ReviewThe private and public sectors have their own motivations for using PPPs for infrastructure. The private sector wants to make a profit from building the infrastructure and delivering services. Governments want these projects to be in the public good, and to be more efficient because of private sector participation. For effective PPPs, both sectors must share the same goals of quality, efficiency, and accountability in building infrastructure and delivering services. So, what determines the private sector’s participation in infrastructure?
The literature review examines emerging economies globally, with several studies on African countries providing particularly rich findings to draw implications for Asia (Table 6.1).

Determinants of PPPs in Infrastructure in Emerging Economies 141
Table 6.1: Determinants of Private Participation in Infrastructure Investments from a Literature Review
ResearchSample
Coverage Positive Drivers Negative Drivers
Asante (2000) Ghana Public investmentPrivate investment (lagged variable)Growth of real credit to private sector
Economic growth Macroeconomic and political instability
Zerfu (2001) Ethiopia GDPGDP growthPublic investment in infrastructure
Macroeconomic instability
Ouattara (2004) Senegal GDP per capitaForeign aid
Credit to the private sectorTerms of trade
Hammami et al. (2006)
International economies
Heavy public indebtedness Higher aggregate demand and market sizeMacroeconomic stabilityInstitutional quality
Kinda (2008) International economies
Economic growthPhysical infrastructureBank credit to private sector
Macroeconomic and political instability
Ba, Gasmi, and Um (2010)
37 developing countries(power sector)
PPP experience (lagged variable)Economic growthFinancial development
Foreign exchange risk
Tewodaj (2013) Low- and middle-income countries
Larger services sectorsOpen tradeLarge populationDemocracyFiscal freedomCommon law regime
Foreign aidInflation
Kasri and Wibowo (2015)
48 developing countries with majority Muslim population
PopulationIncomeRegulatory environment
Country risk
GDP = gross domestic product, PPP = public–private partnership.Source: Works cited in this table are listed in this chapter’s Reference section.

Realizing the Potential of PPPs to Advance Asia’s Infrastructure Development142
For Ghana during 1970–1992, Asante (2000) shows that public investment, lagged private investment, and the growth of real credit to the private sector were the major determinants of private investment. Zerfu (2001) finds that gross domestic product (GDP), its growth rate, and public investment in infrastructure significantly promoted private investment in Ethiopia, but macroeconomic instability had the opposite effect.
Ouattara (2004), examining the long-term determinants of private investment in Senegal from 1970 to 2000, finds that public investment, GDP per capita, and foreign aid were positive influences, but credit to the private sector and terms of trade tended to hinder private investment. Hammami et al. (2006), in their empirical analysis of the cross-country and cross-industry determinants of PPPs, find this modality tends to be more common in countries where governments are heavily indebted, and where aggregate demand and market size are large. They find that macroeconomic stability is essential for PPPs. And they emphasize the importance of institutional quality, where less corruption and effective rule of law are associated with more PPP projects.
Kinda (2008), examining the determinants of private investment in infrastructure in 61 developing countries during 1970–2003, finds economic growth and the level of finance sector development, especially bank credit to the private sector, have significantly positive effects. But private investment in infrastructure is negatively associated with macroeconomic and political instability. Ba, Gasmi, and Um’s (2010) empirical analysis of private investment in developing countries’ power sectors during 1990–2007 emphasizes the importance of economic growth and finance sector development. In their dynamic panel model specifications for 37 developing countries, the authors point out that well-developed finance sectors, especially capital markets, are key determinants of private investment in the power sector. Gupta et al. (2001) find that bond markets in most emerging economies do not offer financial and risk-mitigating instruments for infrastructure projects because of their underdeveloped financial markets.
Sharma (2012) analyzes the factors determining infrastructure PPPs during 1990–2008 using the World Bank’s Private Participation in Infrastructure Database, and finds that large, higher-income markets are positively associated with PPPs. Other positive factors include macroeconomic stability, regulatory quality, and good governance. Tewodaj’s (2013) empirical analysis of infrastructure PPPs in low- and middle-income countries during 1995–2008 finds that countries with larger services sectors are more likely to attract PPPs. Low- and middle-income countries that are more open to trade and have high levels of fiscal freedom, countries with larger populations, and democracies are also more likely to attract PPPs. The availability of domestic credit is positively correlated with PPP investment, while foreign aid and

Determinants of PPPs in Infrastructure in Emerging Economies 143
inflation are also significant but negatively associated with PPP investment in these countries. Countries with large services sectors, large populations, and lower tax burdens are significantly and positively correlated with PPP investments.
Kasri and Wibowo (2015) use advanced panel estimators to develop a cross-country analysis of private finance determinants in 48 developing countries with majority Muslim populations during 2005–2011. Their evidence suggests that market conditions such as population, income and purchasing power, and institutional quality are strongly associated with attracting PPPs in these economies, and that country risk is a negative factor.
Data and Empirical AnalysisThe discussion on the data explains the main sources, and describes key stylized facts that emerged from the data. We then describe the empirical models, and briefly explain the variables as well as the empirical results.
Data
The main data source for PPP projects in developing countries is the World Bank’s Private Participation in Infrastructure Database, which records PPP projects from publicly available sources. From the dataset, we specify regression models for 12 low- and middle-income countries which have data available for financial and capital markets during 1995–2015. In line with Hammami et al. (2006) and Ba, Gasmi, and Um (2010), variables drawn from the literature that may explain investments in PPPs in the sample countries have been collected, and they are listed in Appendix A6.1. They include, among others, aggregate demand, size of the economy and its growth rate, finance sector variables, and fiscal condition, as well as institutional factors, such as government stability. Unlike previous studies, several volatility measures, including growth, inflation, and exchange rate volatility, are added to the estimation model. This is because macroeconomic stability is expected to increase private investment in infrastructure, as many empirical studies emphasize. To check for multicollinearity, pairwise correlations of these variables are calculated in Appendix A6.2.
The other sources of data are the Word Bank’s World Development Indicators Database, the International Monetary Fund’s International Financial Statistics, the Bank for International Settlements, and the PRS Group Inc.’s International Country Risk Guide, which is used extensively in econometric studies of investment for measures of institutional quality, and economic, financial, and political risks.

Realizing the Potential of PPPs to Advance Asia’s Infrastructure Development144
Figure 6.1 shows PPP investment and the number of projects have increased in the sample of 12 developing countries since the mid-1990s, especially since 2003. The peak was in 2012, and both investment and number of projects decreased substantially since then because stringent capital requirements made banks more reluctant to extend long-term and risky loans to infrastructure projects after the 2008 global financial crisis. Figure 6.2 shows that average annual PPP investment by economy has tended higher in the 12 countries, especially in Brazil and India.
Figure 6.1: PPP Infrastructure Investment in 12 Emerging Economies, 1995–2015
0
150
300
450
600
0
50
100
150
200
1995 1996 1997 1998 1999 2000 2001 2002 2003 2004 2005 2006 2007 2008 2009 2010 2011 2012 2013 2014 2015
$ bi
llion
Total PPP investment Private PPP investment PPP projects (right side)
Num
ber
PPP = public–private partnership.
Notes:1. Total private participation in infrastructure investment includes private and public
investment, and is the sum of investment in physical assets and payments to governments. It also includes private investment alone in infrastructure projects.
2. The 12 countries were chosen because they had sufficient data for financial and capital markets in the World Bank’s Private Participation in Infrastructure Database.
3. The countries are Argentina, Brazil, Chile, Colombia, India, Indonesia, Malaysia, Mexico, the People’s Republic of China, South Africa, Thailand, and Turkey.
Source: World Bank Private Participation in Infrastructure Database (accessed 15 June 2017).
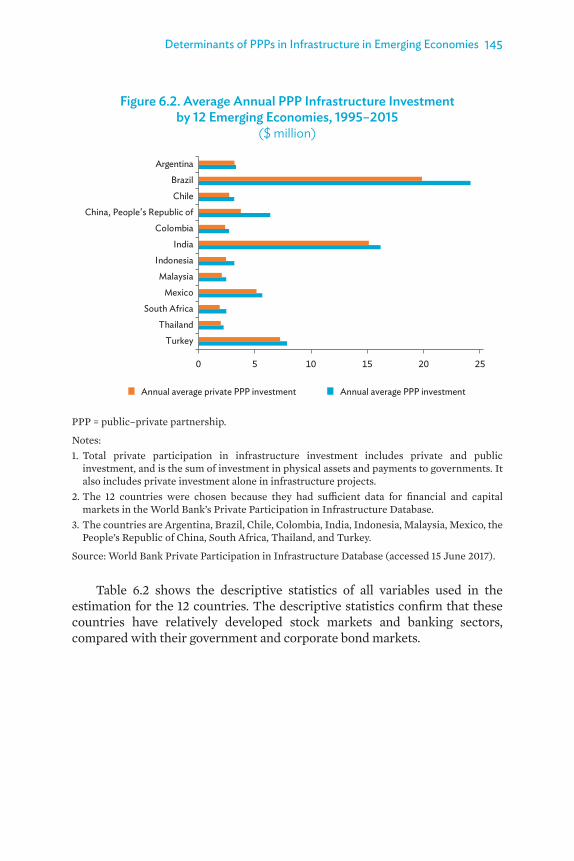
Determinants of PPPs in Infrastructure in Emerging Economies 145
Figure 6.2. Average Annual PPP Infrastructure Investment by 12 Emerging Economies, 1995–2015
($ million)
0 5 10 15 20 25
Turkey
South Africa
Malaysia
India
China, People's Republic of
Brazil
Annual average private PPP investment Annual average PPP investment
Thailand
Mexico
Indonesia
Colombia
Chile
Argentina
PPP = public–private partnership.
Notes:1. Total private participation in infrastructure investment includes private and public
investment, and is the sum of investment in physical assets and payments to governments. It also includes private investment alone in infrastructure projects.
2. The 12 countries were chosen because they had sufficient data for financial and capital markets in the World Bank’s Private Participation in Infrastructure Database.
3. The countries are Argentina, Brazil, Chile, Colombia, India, Indonesia, Malaysia, Mexico, the People’s Republic of China, South Africa, Thailand, and Turkey.
Source: World Bank Private Participation in Infrastructure Database (accessed 15 June 2017).
Table 6.2 shows the descriptive statistics of all variables used in the estimation for the 12 countries. The descriptive statistics confirm that these countries have relatively developed stock markets and banking sectors, compared with their government and corporate bond markets.

Realizing the Potential of PPPs to Advance Asia’s Infrastructure Development146
Table 6.2: Descriptive Statistics
Variable Number Mean Minimum MaximumStandard Deviation
Bond–GDP ratio 212 0.40 0.01 1.21 0.28
PPP–GDP ratio 212 0.01 0.00 0.08 0.01
PIP–GDP ratio 212 0.01 0.00 0.06 0.01
Credit–GDP ratio 212 0.56 0.09 1.61 0.39 Government bonds–GDP ratio 212 0.24 0.00 0.89 0.18
Corporate bonds–GDP ratio 212 0.16 0.00 0.73 0.17 Stock market capitalization–GDP ratio 212 0.74 0.06 3.04 0.62
Log of GDP per capita 212 8.52 6.32 9.67 0.72
GDP growth 212 0.04 –0.11 0.14 0.04
Inflation rate 212 0.08 –0.01 0.88 0.13
GDP growth volatility 212 0.03 0.01 0.08 0.02
Inflation volatility 212 0.34 0.01 6.52 1.31 Real effective exchange rate volatility 212 0.02 0.00 0.15 0.02
Exchange rate regime 212 0.13 0.00 1.00 0.34 Log of government stability index 212 2.08 1.58 2.40 0.19
GDP = gross domestic product, PIP = private investment in PPP, PPP = public–private partnership.Source: Authors’ estimates.

Determinants of PPPs in Infrastructure in Emerging Economies 147
Empirical Framework
The empirical analysis investigates whether more financial market accessibility, especially to bonds, encourages PPP investments after controlling for their known determinants. This analysis goes further than the existing studies that confine their focus to whether economic and institutional developments are major determinants for attracting private investment in infrastructure projects.
While the literature emphasizes the need for developing countries to foster investment in infrastructure projects, there have been very few investigations into the determinants of PPP investment in terms of financial and capital market development, and economic development. This chapter tests whether the level of economic and finance sector development is a key driver of private investment in developing countries’ infrastructure projects, while controlling for other features of a country’s economy.
We estimate a set of model specifications with the level of total investment and private investment in PPP projects as dependent variables to evaluate whether economic and finance sector development is a key determinant of aggregated PPP project investments and private participation in PPP investments in developing countries. In addition to the independent variables of main interest, proxy variables standing for the levels of economic and finance sector development, and the government stability variable from the International Country Risk Guide dataset, are included.
As well as the major variables of interest, the first lagged dependent variable is included as an independent variable to capture potential dynamics because PPP arrangements are more likely in countries with previous PPP experience. After all, PPPs are complex arrangements between two parties. Previous PPP experience reassures private investors about the quality of their PPP counterparts. Arellano and Bover (1995) and Blundell and Bond (1998) show that the system generalized method of moments (GMM) approach allows lagged first differences to be used as instruments for dynamic panel models to correct any bias that might result from the standard GMM estimator. The system GMM estimator proposed by Blundell and Bond (1998), in particular, has become a common tool in applied economic research using panel data because it provides asymptotically efficient inference that assumes a minimal set of statistical assumptions. Blundell and Bond (1998) show that the standard GMM estimator has been found to have poor finite sample properties in cases in which the series are highly persistent. Here, the lagged levels of the series are only weakly correlated with subsequent first differences, consequently leading to weak instruments for the first-differenced equations.

Realizing the Potential of PPPs to Advance Asia’s Infrastructure Development148
To this end, we specify econometric models, including a benchmark panel regression and the difference GMM developed by Arellano and Bover (1995) and Blundell and Bond (1998), for dynamic panel models.4 All regressions include time dummies to capture time-specific global shocks or systemic risks, and country dummies to capture potential country-specific characteristics.
Empirical Results
Tables 6.3–6.6 at the end of the chapter report estimation results using panel fixed effect and difference GMM models in static and dynamic settings. The following looks at the five main findings of the empirical results.
First, an interesting and unexpected finding is the negative and significant impact of bond market development on PPP investment in infrastructure. To further examine this negative influence, we break the bond market down into government and corporate bonds. Here, we find the negative impact is largely driven by dominant government bonds, indicating that government financing reduces the incentive for private investment because of the limited access of small corporate bond markets. Low- and middle-income countries still depend heavily on fiscal financing for infrastructure projects rather than private investment. This might be because of underdeveloped corporate bond markets in developing countries, which cannot provide sufficient long-term financing to the private sector for infrastructure investments.
Infrastructure PPP projects depend on market access to private borrowing, which enables the private partner to source the initial capital for projects upfront. PPP funds are, therefore, ultimately sourced from the capital markets. This means that access to finance plays an essential role in determining the financial viability of PPP projects. The level of financial market development is a key determinant of the ease in which a PPP project can be facilitated. Underdeveloped financial markets are often an obstacle to successful PPP projects. The lack of financial market development by host countries is another problem in this regard (Grimsey and Lewis 2004; Zhang 2001).
While private investors may provide part or all the funding needs of infrastructure PPPs, identifiable revenue streams should be secured for private investors over the term of the partnership. The income stream can be generated by various sources, including fees, tolls, availability payments, shadow tolls, and tax increment financing.5 Through securitization, the future income stream can be sold to the market. Therefore, the availability of well-functioning financial markets with the benefits of low financing costs and diversified financial products are an incentive for the private sector to invest in infrastructure PPPs.

Determinants of PPPs in Infrastructure in Emerging Economies 149
Second, income level measured as GDP per capita is negatively associated with PPP investments—a surprising finding. The viability of infrastructure projects basically depends on future cash flows and financing costs. Large market size and the purchasing power of consumers are good indicators for potential cash flows. But it is a matter of conjecture whether countries with large populations are unable to provide sufficient access to infrastructure and infrastructure services to their citizens because GDP growth is positively related to PPP investment, although it is not statistically significant. In the dynamic panel with fixed effect regressions, economic growth is also positively related with PPP investment, indicating that countries with rapid growth and high demand for infrastructure have more PPP projects.
Third, macroeconomic variables have a direct effect on PPP investments. Exchange rates, for example, can critically affect the viability of projects since many in developing countries are financed with foreign capital in the form of loans and equities from abroad because of underdeveloped domestic financial markets. Currency risk is, therefore, one of the important risks that can stand in the way of increasing PPP investments. Because stable macroeconomic conditions encourage private investment, higher inflation discourages investing in PPPs, as expected. And because infrastructure such as highways, airports, and bridges have long life spans, high inflation is detrimental to investors who cannot hedge inflation for long periods. Macroeconomic stability is more common in countries with low inflation, and therefore stable inflation is essential for countries promoting infrastructure PPPs.
The results of the GMM regressions show pegged exchange rate regimes are positive for PPP investments because these can prevent exchange rate fluctuations, though they are not statistically significant. When infrastructure projects are financed with foreign capital, investors can limit their exposure to foreign exchange risks under pegged exchange rate regimes. But because revenue income from infrastructure projects is denominated in local currency, borrowers cannot avoid a currency mismatch problem.
Fourth, the previous-year volume of PPP investment is positively associated with the current level of PPP investment, and its coefficients are significant at the 1% level in the dynamic model of Tables 6.5 and 6.6. The efficiency might be reflected in public entities with experience in PPP projects, and with the expertise to optimally allocate risk between the public and private sectors. Because PPPs are complex arrangements between two different parties, it is necessary for the public sector to have the expertise to develop these partnerships. Public entities with previous experience in handling PPPs will attract more private investors.
Realizing the Potential of PPPs to Advance Asia’s Infrastructure Development150
Fifth, in the case of bank credit, empirical results seem unclear because more stringent capital requirement regulation under Basel III has made banks reluctant to lend to PPP projects since the global financial crisis. Nevertheless, some results in the GMM and dynamic panel regression confirm that banks remain major fund suppliers to private infrastructure project investments. According to the World Economic Forum (2014), commercial banks provided an estimated 90% of all private debt for infrastructure financing from 1999 to 2009. Underdeveloped capital markets in low-income economies cannot offer long-term financing. These markets often only have a few players, such as government banks and state-owned companies, which reduces pricing efficiency, distorts yields, and ultimately leads to high transaction costs, as noted in Platz (2009).
ConclusionThe determinants for PPPs presented in this chapter go a long way toward identifying further factors that can stimulate infrastructure PPPs. The results show that macroeconomic factors such as economic growth and inflation are the most relevant determinants of an infrastructure PPP investment. For macroeconomic stability, inflation and exchange rate instability could discourage private investment. The results also show the significance of previous PPP experience in promoting new PPPs.
Our new findings indicate that bond market development in the countries studied is not a critical determinant of PPPs. Moreover, PPPs to finance infrastructure, especially from the private sector side, will be crowded out in underdeveloped corporate bond markets dominated by government bonds. The negative impact of underdeveloped bond markets and low-income levels on PPPs should be further examined. But it can be said that countries with larger populations—and therefore greater demand for infrastructure—fail to attract PPP investments of a sufficient size to provide infrastructure services to their citizens.
Most emerging economies still depend on fiscal financing for infrastructure projects because of underdeveloped corporate bond markets and banks being the major financing sources for private sectors.6 Our empirical results reconfirm that banks remain major financiers to infrastructure projects. But banks with short-term liabilities are not well suited to hold long-term assets, such as PPP projects, on their balances sheets. Moreover, revenues from infrastructure projects are usually generated in local currency, while the major financing source is foreign bank lending in foreign currencies. This poses a “double mismatch” in maturity and currency, as was experienced during the Asian financial crisis.
Determinants of PPPs in Infrastructure in Emerging Economies 151
As well as the double-mismatch problem, the decreasing capacity of commercial banks to finance long-term infrastructure projects is further limiting financial access to invest in infrastructure. Since the global financial crisis, commercial bank debt under Basel III has become more difficult to secure and lending terms have worsened, affecting the bankability and value for money of PPP projects. The current financial market conditions have made bond financing pivotal for closing the financing gap for infrastructure investments.
Because of this, domestic bond markets should be developed to increase their depth and liquidity at a level that can provide long-term funding for infrastructure projects to private sector investors. The European Investment Bank and the European Union jointly developed the Project Bond Initiative to facilitate capital market financing for large-scale infrastructure projects. In Asia, regional multilateral development banks, such as the Asian Development Bank, have a catalytic role to play in developing infrastructure bond markets in the region in line with the Asian Bond Markets Initiative.7
Note1. According to WEF (2014), commercial banks provided an estimated 90% of all private debt
for infrastructure financing from 1999 to 2009.2. The 12 countries are Argentina, Brazil, Chile, Colombia, India, Indonesia, Malaysia, Mexico,
the People’s Republic of China, South Africa, Thailand, and Turkey.3. The standard literature on project finance contains detailed explanations of the advantages
and disadvantages of using bond markets rather than bank loans. See, for example, Hoffman (1980) and Yescombe (2002, 2007).
4. Applying the Arellano and Bover (1995) and Blundell and Bond (1998) one-step system for the GMM approach for dynamic panel models to the data augmented through multiple imputation by chained equations is an increasingly popular approach for dealing with missing observations.
5. Tax increment financing is a public financing tool used to subsidize redevelopment, infrastructure, and other community-improvement projects by allocating property tax revenue increments from assessed values within a designated tax increment financing district.
6. Among the few regions and countries where market conditions are largely in place for infrastructure project bond markets are Australia, the Benelux countries, Canada, Germany, Latin America (especially Brazil), Mexico, the United Kingdom, and the United States, according to PwC (2013).
7. The Asian Bond Markets Initiative was launched in 2003 by the ASEAN Plus Three cooperation to strengthen the resilience of Asia’s financial system by developing local currency bond markets as an alternative source to foreign currency-denominated short-term bank loans for long-term investment financing.

Realizing the Potential of PPPs to Advance Asia’s Infrastructure Development152
Tabl
e 6.
3: P
PP D
eter
min
ants
—Pa
nel R
egre
ssio
n w
ith F
ixed
Effe
ct
Vari
able
Dep
ende
nt V
aria
ble
PP
P–G
DP
Rat
ioP
IP–G
DP
Rat
io
Cre
dit–
GD
P ra
tio0.
0149
0.01
540.
0225
0.02
28
(0.6
7)(0
.70)
(1.3
3)(1
.33)
Bond
–GD
P ra
tio–0
.012
3**
–0.0
0936
**
(–3.
03)
(–2.
65)
Gov
ernm
ent b
ond–
GD
P ra
tio–0
.017
9**
–0.0
122*
(–2.
21)
(–1.9
8)
Cor
pora
te b
ond–
GD
P ra
tio–0
.003
15–0
.004
78
(–0.
23)
(–0.
52)
Stoc
k m
arke
t cap
italiz
atio
n–G
DP
ratio
0.00
294
0.00
292
0.00
230
0.00
230
(1.0
8)(1
.01)
(1.0
0)(0
.96)
Log
of G
DP
per c
apita
–0.0
0794
*–0
.009
95*
–0.0
108*
–0.0
0564
–0.0
0792
**–0
.008
33*
(–1.8
1)(–
2.08
)(–
2.03
)(–
1.45)
(–2.
21)
(–2.
04)
GD
P gr
owth
0.02
620.
0278
0.02
930.
0213
0.02
520.
0260
(1.14
)(1
.10)
(1.2
0)(1
.36)
(1.3
8)(1
.39)
Infla
tion
rate
–0.0
293*
*–0
.027
0**
–0.0
314*
*–0
.024
6***
–0.0
202*
**–0
.022
4***
(–3.
00)
(–2.
53)
(–2.
35)
(–4.
00)
(–3.
71)
(–3.4
3)
GD
P gr
owth
vol
atili
ty–0
.026
1–0
.009
17–0
.018
4–0
.022
5–0
.012
9–0
.017
5
(–0.
49)
(–0.
17)
(–0.
33)
(–0.
46)
(–0.
27)
(–0.
35)
cont
inue
d on
nex
t pag
e

Determinants of PPPs in Infrastructure in Emerging Economies 153
Vari
able
Dep
ende
nt V
aria
ble
PP
P–G
DP
Rat
ioP
IP–G
DP
Rat
io
Infla
tion
vola
tility
0.00
0274
0.00
0484
0.00
0325
0.00
0510
0.00
0857
0.00
0778
(0.4
4)(0
.65)
(0.4
0)(0
.86)
(1.4
1)(1
.24)
Rea
l effe
ctiv
e ex
chan
ge ra
te v
olat
ility
0.00
0860
–0.0
0699
–0.0
0070
10.
0195
–0.0
0668
–0.0
0353
(0.0
1)(–
0.09
)(–
0.01
)(0
.36)
(–0.
10)
(–0.
06)
Exch
ange
rate
regi
me
0.00
510
0.00
200
0.00
214
0.00
624*
0.00
253
0.00
260
(1.4
2)(0
.55)
(0.5
8)(1
.87)
(0.7
7)(0
.78)
Log
of g
over
nmen
t sta
bilit
y in
dex
0.01
040.
0078
50.
0081
60.
0067
10.
0045
40.
0047
0
(1.3
0)(1
.51)
(1.6
0)(1
.08)
(1.2
0)(1
.31)
Con
stan
t0.
0690
0.08
110.
0887
*0.
0502
0.06
02*
0.06
40*
(1.4
6)(1
.78)
(1.8
1)(1
.26)
(1.9
4)(1
.80)
Cou
ntry
fixe
d eff
ects
Yes
Yes
Yes
Yes
Yes
Yes
Tim
e fix
ed e
ffect
sYe
sYe
sYe
s Ye
sYe
sYe
s
Obs
erva
tions
212
212
212
212
212
212
Num
ber o
f mar
kets
1313
1313
1313
Adj
uste
d R
20.
182
0.24
50.
245
0.13
20.
229
0.22
6
GD
P =
gros
s dom
estic
pro
duct
, PIP
= p
riva
te in
vest
men
t in
PPP,
PPP
= p
ublic
–pri
vate
par
tner
ship
.N
otes
: 1.
t val
ues a
re c
alcu
late
d fr
om st
anda
rd e
rror
s clu
ster
ed a
t the
cou
ntry
leve
l in
pare
nthe
sis.
2. T
ime
and
coun
try
fixed
effe
cts a
re c
ontr
olle
d.**
* p
< 0.
01 *
* p
< 0.
05 *
p <
0.10
Sour
ce: A
utho
rs’ e
stim
ates
.
Tabl
e 6.
3 co
ntin
ued

Realizing the Potential of PPPs to Advance Asia’s Infrastructure Development154
Tabl
e 6.
4: P
PP D
eter
min
ants
—D
iffer
ence
Gen
eral
ized
Met
hod
of M
omen
ts R
egre
ssio
n
Vari
able
Dep
ende
nt V
aria
ble
PP
P–G
DP
Rat
ioP
IP–G
DP
Rat
io
Cre
dit–
GD
P ra
tio0.
0095
20.
0098
70.
0184
**0.
0189
**
(0.9
5)(0
.97)
(2.2
0)(2
.25)
Bond
–GD
P ra
tio–0
.011
0***
–0.0
0887
***
(–2.
75)
(–2.
63)
Gov
ernm
ent b
ond–
GD
P ra
tio–0
.013
7*–0
.011
5**
(–1.9
5)(–
1.98)
Cor
pora
te b
ond–
GD
P ra
tio–0
.006
72–0
.004
59
(–0.
66)
(–0.
54)
Stoc
k m
arke
t cap
italiz
atio
n–G
DP
ratio
4.02
e–05
0.00
0128
0.00
0901
0.00
0903
(0.0
1)(0
.04)
(0.3
6)(0
.36)
Log
of G
DP
per c
apita
–0.0
0658
*–0
.008
28**
–0.0
0867
**–0
.004
51–0
.007
01**
–0.0
0740
**
(–1.7
3)(–
2.15
)(–
2.19
)(–
1.41)
(–2.
17)
(–2.
24)
GD
P gr
owth
0.02
190.
0251
0.02
600.
0157
0.02
390.
0249
(0.8
2)(0
.93)
(0.9
6)(0
.71)
(1.0
8)(1
.11)
Infla
tion
rate
–0.0
289*
**–0
.028
0***
–0.0
299*
**–0
.024
9***
–0.0
217*
**–0
.023
5***
(–3.
51)
(–3.
11)
(–3.
01)
(–3.
73)
(–2.
97)
(–2.
94)
GD
P gr
owth
vol
atili
ty0.
0220
0.02
640.
0227
0.02
100.
0042
20.
0001
55
(0.3
3)(0
.39)
(0.3
3)(0
.37)
(0.0
7)(0
.00)
cont
inue
d on
nex
t pag
e

Determinants of PPPs in Infrastructure in Emerging Economies 155
Vari
able
Dep
ende
nt V
aria
ble
PP
P–G
DP
Rat
ioP
IP–G
DP
Rat
io
Infla
tion
vola
tility
–0.0
0030
6–0
.000
141
–0.0
0018
90.
0003
370.
0005
460.
0004
94
(–0.
49)
(–0.
22)
(–0.
29)
(0.6
4)(1
.00)
(0.8
9)
Rea
l effe
ctiv
e ex
chan
ge ra
te
vola
tility
–0.0
133
0.00
149
0.00
522
0.00
517
–0.0
0228
0.00
112
(–0.
26)
(0.0
3)(0
.09)
(0.12
)(–
0.05
)(0
.02)
Exch
ange
rate
regi
me
0.00
502*
0.00
251
0.00
259
0.00
683*
**0.
0031
10.
0031
7
(1.8
6)(0
.87)
(0.8
9)(3
.06)
(1.3
0)(1
.31)
Log
of g
over
nmen
t sta
bilit
y in
dex
0.00
584
0.00
554
0.00
577
0.00
306
0.00
333
0.00
354
(1.15
)(1
.09)
(1.13
)(0
.73)
(0.7
9)(0
.83)
Cou
ntry
fixe
d eff
ects
Yes
Yes
Yes
Yes
Yes
Yes
Tim
e fix
ed e
ffect
sYe
sYe
sYe
sYe
sYe
sYe
s
Obs
erva
tions
199
199
199
199
199
199
Num
ber o
f mar
kets
1313
1313
1313
F va
lue
4.07
54.
143
3.98
43.
243
3.54
43.4
28
GD
P =
gros
s dom
estic
pro
duct
, PIP
= p
riva
te in
vest
men
t in
PPP,
PPP
= p
ublic
–pri
vate
par
tner
ship
.N
otes
: 1.
t val
ues a
re c
alcu
late
d fr
om st
anda
rd e
rror
s clu
ster
ed a
t the
cou
ntry
leve
l in
pare
nthe
sis.
2. T
ime
and
coun
try
fixed
effe
cts a
re c
ontr
olle
d.**
* p
< 0.
01 *
* p
< 0.
05 *
p <
0.10
Sour
ce: A
utho
rs.
Tabl
e 6.
4 co
ntin
ued
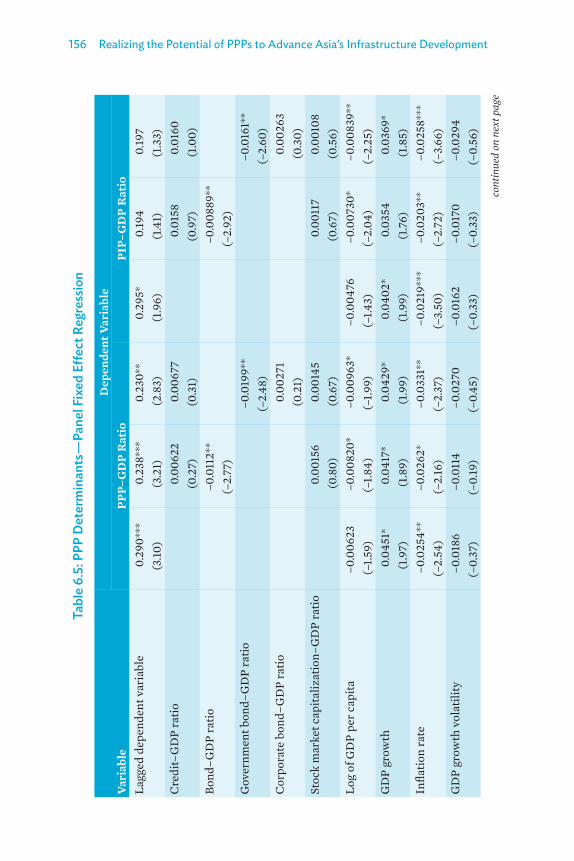
Realizing the Potential of PPPs to Advance Asia’s Infrastructure Development156
Tabl
e 6.
5: P
PP D
eter
min
ants
—Pa
nel F
ixed
Effe
ct R
egre
ssio
n
Vari
able
Dep
ende
nt V
aria
ble
PP
P–G
DP
Rat
ioP
IP–G
DP
Rat
ioLa
gged
dep
ende
nt v
aria
ble
0.29
0***
0.23
8***
0.23
0**
0.29
5*0.
194
0.19
7(3
.10)
(3.2
1)(2
.83)
(1.9
6)(1
.41)
(1.3
3)C
redi
t–G
DP
ratio
0.00
622
0.00
677
0.01
580.
0160
(0.2
7)(0
.31)
(0.9
7)(1
.00)
Bond
–GD
P ra
tio–0
.011
2**
–0.0
0889
**(–
2.77
)(–
2.92
)G
over
nmen
t bon
d–G
DP
ratio
–0.0
199*
*–0
.016
1**
(–2.
48)
(–2.
60)
Cor
pora
te b
ond–
GD
P ra
tio0.
0027
10.
0026
3(0
.21)
(0.3
0)St
ock
mar
ket c
apita
lizat
ion–
GD
P ra
tio0.
0015
60.
0014
50.
0011
70.
0010
8(0
.80)
(0.6
7)(0
.67)
(0.5
6)Lo
g of
GD
P pe
r cap
ita–0
.006
23–0
.008
20*
–0.0
0963
*–0
.004
76–0
.007
30*
–0.0
0839
**(–
1.59)
(–1.8
4)(–
1.99)
(–1.4
3)(–
2.04
)(–
2.25
)G
DP
grow
th0.
0451
*0.
0417
*0.
0429
*0.
0402
*0.
0354
0.03
69*
(1.9
7)(1
.89)
(1.9
9)(1
.99)
(1.7
6)(1
.85)
Infla
tion
rate
–0.0
254*
*–0
.026
2*–0
.033
1**
–0.0
219*
**–0
.020
3**
–0.0
258*
**(–
2.54
)(–
2.16
)(–
2.37
)(–
3.50
)(–
2.72
)(–
3.66
)G
DP
grow
th v
olat
ility
–0.0
186
–0.0
114
–0.0
270
–0.0
162
–0.0
170
–0.0
294
(–0.
37)
(–0.
19)
(–0.
45)
(–0.
33)
(–0.
33)
(–0.
56)
cont
inue
d on
nex
t pag
e

Determinants of PPPs in Infrastructure in Emerging Economies 157
Vari
able
Dep
ende
nt V
aria
ble
PP
P–G
DP
Rat
ioP
IP–G
DP
Rat
ioIn
flatio
n vo
latil
ity–0
.000
162
5.76
e–05
–0.0
0014
70.
0001
830.
0006
040.
0004
24(–
0.36
)(0
.08)
(–0.
19)
(0.4
6)(1
.05)
(0.7
5)R
eal e
ffect
ive
exch
ange
rate
vol
atili
ty0.
0007
450.
0052
40.
0175
0.02
430.
0083
10.
0190
(0.0
1)(0
.06)
(0.2
0)(0
.41)
(0.11
)(0
.26)
Exch
ange
rate
regi
me
0.00
482
0.00
262
0.00
297
0.00
530
0.00
271
0.00
298
(1.5
3)(0
.78)
(0.8
6)(1
.77)
(0.8
7)(0
.92)
Log
of g
over
nmen
t sta
bilit
y in
dex
0.00
364
0.00
327
0.00
372
0.00
176
0.00
174
0.00
201
(0.6
5)(0
.71)
(0.8
4)(0
.35)
(0.4
3)(0
.54)
Con
stan
t0.
0572
0.07
640.
0881
*0.
0465
0.06
40*
0.07
31**
(1.3
3)(1
.76)
(1.9
9)(1
.24)
(1.9
2)(2
.20)
Cou
ntry
fixe
d eff
ects
Yes
Yes
Yes
Yes
Yes
Yes
Tim
e fix
ed e
ffect
sYe
sYe
sYe
sYe
sYe
sYe
sO
bser
vatio
ns19
919
919
919
919
919
9N
umbe
r of m
arke
ts13
1313
1313
13A
djus
ted
R2
0.22
10.
248
0.25
20.
179
0.22
70.
230
GD
P =
gros
s dom
estic
pro
duct
, PIP
= p
riva
te in
vest
men
t in
PPP,
PPP
= p
ublic
–pri
vate
par
tner
ship
.N
otes
: 1.
t val
ues a
re c
alcu
late
d fr
om st
anda
rd e
rror
s clu
ster
ed a
t the
cou
ntry
leve
l in
pare
nthe
sis.
2. T
ime
and
coun
try
fixed
effe
cts a
re c
ontr
olle
d.**
* p
< 0.
01 *
* p
< 0.
05 *
p <
0.10
Sour
ce: A
utho
rs.
Tabl
e 6.
5 co
ntin
ued

Realizing the Potential of PPPs to Advance Asia’s Infrastructure Development158
Tabl
e 6.
6: P
PP D
eter
min
ants
—Sy
stem
Gen
eral
ized
Met
hod
of M
omen
ts R
egre
ssio
n
Vari
able
Dep
ende
nt V
aria
ble
PP
P–G
DP
Rat
ioP
IP–G
DP
Rat
io
Lagg
ed d
epen
dent
var
iabl
e0.
343*
**0.
242*
**0.
247*
**0.
314*
**0.
187*
*0.
190*
*
(4.4
8)(3
.13)
(3.19
)(3
.87)
(2.2
8)(2
.31)
Cre
dit–
GD
P ra
tio0.
0215
**0.
0224
**0.
0224
***
0.02
39**
*
(2.4
5)(2
.49)
(3.14
)(3
.28)
Bond
–GD
P ra
tio–0
.010
5***
–0.0
0826
**
(–2.
65)
(–2.
57)
Gov
ernm
ent b
ond–
GD
P ra
tio–0
.015
8**
–0.0
144*
*
(–2.
14)
(–2.
38)
Cor
pora
te b
ond–
GD
P ra
tio–0
.002
110.
0012
5
(–0.
20)
(0.15
)
Stoc
k m
arke
t cap
italiz
atio
n–G
DP
ratio
–0.0
0018
57.5
9e–0
50.
0002
350.
0001
55
(–0.
07)
(0.0
3)(0
.11)
(0.0
7)
Log
of G
DP
per c
apita
–0.0
0293
–0.0
0518
*–0
.005
93*
–0.0
0148
–0.0
0380
*–0
.005
00**
(–1.1
9)(–
1.90)
(–1.9
7)(–
0.74
)(–
1.75)
(–2.
08)
GD
P gr
owth
0.01
010.
0161
0.01
750.
0170
0.02
260.
0249
(0.4
1)(0
.68)
(0.7
3)(0
.85)
(1.18
)(1
.29)
Infla
tion
rate
–0.0
121
–0.0
139*
–0.0
182*
*–0
.014
2**
–0.0
151*
*–0
.018
8***
(–1.4
1)(–
1.78)
(–2.
16)
(–2.
02)
(–2.
40)
(–2.
69)
cont
inue
d on
nex
t pag
e

Determinants of PPPs in Infrastructure in Emerging Economies 159
Vari
able
Dep
ende
nt V
aria
ble
PP
P–G
DP
Rat
ioP
IP–G
DP
Rat
io
GD
P gr
owth
vol
atili
ty–0
.027
8–0
.031
2–0
.039
9–0
.022
1–0
.021
8–0
.035
4
(–0.
36)
(–0.
43)
(–0.
54)
(–0.
35)
(–0.
37)
(–0.
59)
Infla
tion
vola
tility
0.00
0503
0.00
0437
0.00
0460
0.00
0554
0.00
0567
0.00
0521
(0.7
2)(0
.66)
(0.6
9)(0
.96)
(1.0
6)(0
.96)
Rea
l effe
ctiv
e ex
chan
ge ra
te v
olat
ility
–0.0
309
–0.0
420
–0.0
345
0.00
380
–0.0
0599
–0.0
0286
(–0.
53)
(–0.
73)
(–0.
60)
(0.0
8)(–
0.13
)(–
0.06
)
Exch
ange
rate
regi
me
0.00
568*
0.00
141
0.00
144
0.00
617*
*0.
0023
30.
0023
7
(1.8
8)(0
.46)
(0.4
7)(2
.46)
(0.9
4)(0
.95)
Log
of g
over
nmen
t sta
bilit
y in
dex
0.00
376
0.00
300
0.00
380
0.00
0902
0.00
0497
0.00
0813
(0.7
7)(0
.63)
(0.8
0)(0
.23)
(0.13
)(0
.21)
Cou
ntry
fixe
d eff
ects
Yes
Yes
Yes
Yes
Yes
Yes
Tim
e fix
ed e
ffect
sYe
sYe
sYe
sYe
sYe
sYe
s
Obs
erva
tions
186
186
186
186
186
186
Num
ber o
f mar
kets
1313
1313
1313
F va
lue
6.01
06.
448
6.07
85.
467
6.35
85.
907
GD
P =
gros
s dom
estic
pro
duct
, PIP
= p
riva
te in
vest
men
t in
PPP,
PPP
= p
ublic
–pri
vate
par
tner
ship
.N
otes
: 1.
t val
ues a
re c
alcu
late
d fr
om st
anda
rd e
rror
s clu
ster
ed a
t the
cou
ntry
leve
l in
pare
nthe
sis.
2. T
ime
and
coun
try
fixed
effe
cts a
re c
ontr
olle
d.**
* p
< 0.
01 *
* p
< 0.
05 *
p <
0.10
Sour
ce: A
utho
rs.
Tabl
e 6.
6 co
ntin
ued
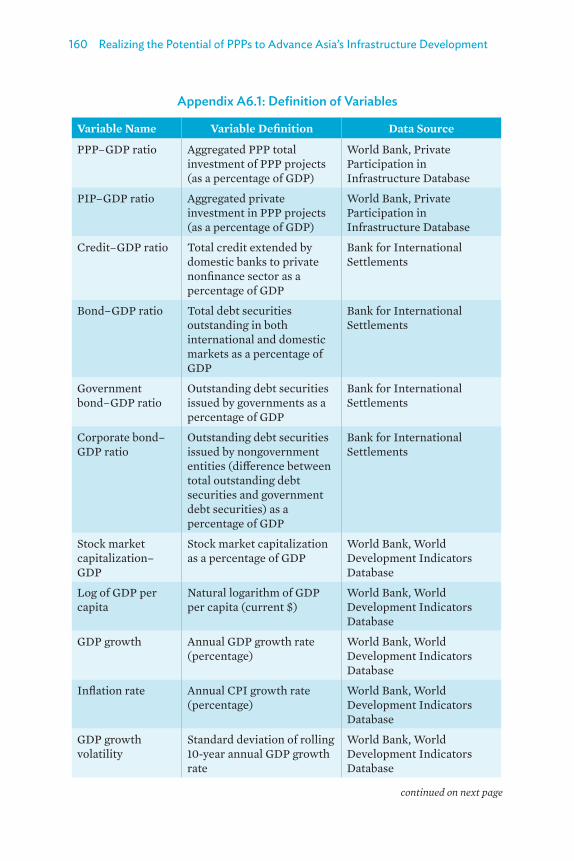
Realizing the Potential of PPPs to Advance Asia’s Infrastructure Development160
Appendix A6.1: Definition of Variables
Variable Name Variable Definition Data Source
PPP–GDP ratio Aggregated PPP total investment of PPP projects (as a percentage of GDP)
World Bank, Private Participation in Infrastructure Database
PIP–GDP ratio Aggregated private investment in PPP projects (as a percentage of GDP)
World Bank, Private Participation in Infrastructure Database
Credit–GDP ratio Total credit extended by domestic banks to private nonfinance sector as a percentage of GDP
Bank for International Settlements
Bond–GDP ratio Total debt securities outstanding in both international and domestic markets as a percentage of GDP
Bank for International Settlements
Government bond–GDP ratio
Outstanding debt securities issued by governments as a percentage of GDP
Bank for International Settlements
Corporate bond–GDP ratio
Outstanding debt securities issued by nongovernment entities (difference between total outstanding debt securities and government debt securities) as a percentage of GDP
Bank for International Settlements
Stock market capitalization–GDP
Stock market capitalization as a percentage of GDP
World Bank, World Development Indicators Database
Log of GDP per capita
Natural logarithm of GDP per capita (current $)
World Bank, World Development Indicators Database
GDP growth Annual GDP growth rate (percentage)
World Bank, World Development Indicators Database
Inflation rate Annual CPI growth rate (percentage)
World Bank, World Development Indicators Database
GDP growth volatility
Standard deviation of rolling 10-year annual GDP growth rate
World Bank, World Development Indicators Database
continued on next page

Determinants of PPPs in Infrastructure in Emerging Economies 161
Variable Name Variable Definition Data Source
Inflation volatility Standard deviation of rolling 10-year annual CPI price change
World Bank, World Development Indicators Database
Real effective exchange rate volatility
Standard deviation of monthly prices changes of real effective exchange rate
Calculated from Bank for International Settlements data
Exchange rate regime
Exchange rate regime according to standard Shambaugh (2004)a classification (1 = peg, 0 = nonpeg)
Shambaugh (2004)
Log of government stability index
Natural logarithm of ICRG government stability index
ICRG dataset
CPI = consumer price index, GDP = gross domestic product, ICRG = International Country Risk Guide, PIP= private investment in PPP, PPP = public–private partnership.a Jay Shambaugh. 2004. The Effect of Fixed Exchange Rates on Monetary Policy. Quarterly
Journal of Economics 119 (1): pp. 301–352.Source: Data sources cited.
Table A6.1 continued

Realizing the Potential of PPPs to Advance Asia’s Infrastructure Development162
App
endi
x A
6.2:
Cor
rela
tion
Mat
rix fo
r Exp
lana
tory
Var
iabl
es
Pear
son
Cor
rela
tion
(1)
(2)
(3)
(4)
(5)
(6)
(7)
(8)
(9)
(10)
(11)
(12)
(13)
(14)
(15)
Bond
–GD
P ra
tio (1
)1.
000
PPP–
GD
P ra
tio (2
)–0
.254
1.
000
PIP–
GD
P ra
tio (3
)–0
.217
0.
961
1.00
0
Cre
dit–
GD
P ra
tio (4
)0.
329
0.10
7 0.
109
1.00
0
Gov
ernm
ent b
ond–
GD
P ra
tio (5
)0.
826
–0.2
04
–0.1
63
–0.0
89
1.00
0
Cor
pora
te b
ond–
GD
P ra
tio (6
)0.
804
–0.2
09
–0.1
91
0.64
5 0.
329
1.00
0
Stoc
k m
arke
t cap
italiz
atio
n–G
DP
ratio
(7)
0.24
3 0.
158
0.12
8 0.
522
0.07
4 0.
329
1.00
0
Log
of G
DP
per c
apita
(8)
0.30
4 –0
.012
0.
030
0.05
5 0.
192
0.30
5 0.
047
1.00
0
GD
P gr
owth
(9)
–0.0
89
0.01
2 0.
015
0.20
1 –0
.143
0.
003
0.06
1 –0
.249
1.
000
Infla
tion
rate
(10)
–0.2
62
–0.0
83
–0.1
23
–0.3
26
–0.1
51
–0.2
79
–0.2
36
–0.1
60
–0.0
67
1.00
0
GD
P gr
owth
vol
atili
ty (1
1)–0
.120
0.
015
0.02
5 –0
.292
–0
.015
–0
.184
–0
.365
0.
055
–0.1
67
0.23
0 1.
000
Infla
tion
vola
tility
(12)
–0.0
49
0.18
1 0.
201
–0.1
93
0.07
3 –0
.158
–0
.189
0.
003
–0.1
12
–0.0
35
0.16
4 1.
000
Rea
l effe
ctiv
e ex
chan
ge ra
te
vola
tility
(13)
–0.0
02
–0.0
51
–0.0
62
–0.2
67
0.18
1 –0
.193
–0
.150
–0
.126
–0
.463
0.
327
0.11
1 0.
046
1.00
0
Exch
ange
rate
regi
me
(14)
–0.0
07
0.05
9 0.
087
0.37
0 –0
.115
0.
109
–0.0
62
–0.0
13
0.14
4 –0
.188
0.
204
0.26
1 –0
.264
1.
000
Log
of g
over
nmen
t sta
bilit
y in
dex
(15)
–0.1
77
0.19
7 0.
128
0.17
5 –0
.178
–0
.108
0.
074
–0.1
21
0.21
2 –0
.081
0.
067
0.03
7 –0
.130
0.
331
1.00
0
GD
P =
gros
s dom
estic
pro
duct
, PIP
= p
riva
te in
vest
men
t in
PPP,
PPP
= p
ublic
–pri
vate
par
tner
ship
.So
urce
: Aut
hors
’ est
imat
es
Determinants of PPPs in Infrastructure in Emerging Economies 163
References
Arellano, Manuel and Olympia Bover. 1995. Another Look at the Instrumental Variable Estimation of Error-Components Models. Journal of Econometrics 68: pp. 29–51.
Asante, Yaw. 2000. Determinants of Private Investment Behaviour in Ghana. African Economic Research Consortium Research Paper 1000. Nairobi: African Economic Research Consortium.
Ba, Lika, Farid Gasmi, and Paul Noumba Um. 2010. Is the Level of Financial Sector Development a Key Determinant of Private Investment in the Power Sector? World Bank Policy Research Working Paper WPS5373. Washington, DC: World Bank.
Blundell, Richard W. and Stephen R. Bond. 1998. Initial Conditions and Moment Restrictions in Dynamic Panel Data Models. Journal of Econometrics 87: pp. 115–143.
Grimsey, Darrini and Mervyn K. Lewis. 2004. Public Private Partnerships: The Worldwide Revolution in Infrastructure Provision and Project Finance. Cheltenham, United Kingdom: Edward Elgar.
Gupta, L.C. and C.P Gupta. 2001. Financing Infrastructure Development: A holistic approach with special reference to the power sector. Delhi: Society for Capital Market Research & Development Report.
Hammami, Mona, J. Jean-Francois Ruhashyankiko, and Etienne B. Yehoue. 2006. Determinants of Public–Private Partnerships in Infrastructure. IMF Working Paper 62424. Washington, DC: International Monetary Fund (IMF).
Hoffman, Scott. 1998. The Law and Business of International Project Finance. London: Kluwer Law International.
Hyun, Suk, Toshiro Nishizawa, and Naoyuki Yoshino. 2008. Exploring the Use of Revenue Bond for Infrastructure Financing in Asia. JBICI Discussion Paper No.15. Tokyo: Japan Bank for International Cooperation Institute.
Kasri, Rahmatina A. and Farid A. Wibowo. 2015. Determinants of Public–Private Partnerships in Infrastructure Provision: Evidence from Muslim Developing Countries. Journal of Economic Cooperation and Development 36 (2): pp. 1–34.
Realizing the Potential of PPPs to Advance Asia’s Infrastructure Development164
Kinda, Tidiane. 2008. Infrastructure and Private Capital Flows in Developing Countries. Munich Personal RePEc Archive Paper 19158. http://mpra.ub.uni-muenchen.de/19158/.
Moszoro, Mariah. 2014. Efficient Public–Private Capital Structures. Annals of Public and Cooperative Economics 85 (1): pp. 103–126.
Moszoro, Mariah and Pawel Gąsiorowski. 2008. Optimal Capital Structure of Public–Private Joint Ventures. IMF Working Paper No. 08/1. Washington, DC: IMF.
Ouattara, Bazoumana. 2004. Modelling the Long Run Determinants of Private Investment in Senegal. Centre for Research in Economic Development and International Trade Research 04/05. Nottingham, United Kingdom: University of Nottingham
Platz, Daniel. 2009. Infrastructure Finance in Developing Countries: The Potential of Sub-Sovereign Bonds. Department of Economic and Social Affairs Working Paper 76. New York: United Nations.
PwC (PricewaterhouseCoopers). 2013. Capital Markets: The Rise of Non-Bank Infrastructure Project Finance. http://www.pwc.com/capitalprojectsandinfrastructure.
Shambaugh, Jay. 2004. The Effect of Fixed Exchange Rates on Monetary Policy. Quarterly Journal of Economics 119 (1): pp. 301–352.
Sharma, Chandan. 2012. Determinants of PPP in Infrastructure in Developing Economies. Transforming Government: People, Process and Policy 6 (2): pp. 149–166.
Singh, Laishram and Satyanarayana Kalidindi. 2014. Criteria Influencing Debt Financing of Indian PPP Road Projects: A Case Study. Journal of Financial Management of Property and Construction 14 (1): pp. 34–60.
Tewodaj, Mengistu. 2013. Determinants of Private Participation in Infrastructure in Low and Middle Income Countries. RAND Corporation. Santa Monica, CA: Pardee RAND Graduate School.
WEF (World Economic Forum). 2014. Infrastructure Investment Policy Blueprint. Geneva: Switzerland.
Yescombe, Edward. R. 2002. Principles of Project Finance. Cambridge, MA: Academic Press.

Determinants of PPPs in Infrastructure in Emerging Economies 165
Yescombe, Edward R. 2007. Public–Private Partnerships: Principles of Policy and Finance. Oxford: Butterworth-Heinemann.
Zerfu, Daniel. 2001. Macroeconomic Determinants of Private Investment in Ethiopia. Paper prepared for the Conference on Development Policy in Africa: Public and Private Perspectives, Oxford University, Centre for the Study of African Economies.
Zhang, Xueqing. 2001. Procurement of Privately Financed Infrastructure Projects. PhD thesis. Hong Kong, China: University of Hong Kong.


CHAPTER 7
Risk Mitigation and Sovereign Guarantees for Public–Private Partnerships in Developing Economies
Alexander N. Jett
IntroductionWhat hinders private sector investment in infrastructure projects—and what measures are available to overcome these obstacles—have important implications for setting public–private partnership (PPP) policies. Financing infrastructure involves a wide array of risks, the severity of which varies by sector. The presence of these risks may deter private sector investment in infrastructure. At the core of the PPP procurement model is the concept that PPP contracts allocate risks to the party most capable of managing them (IISD 2015). This functional feature of PPPs is a prerequisite for the increased involvement of the private sector in the delivery of infrastructure services. A major reason why there are relatively few infrastructure PPPs in developing Asia is that the private sector is not confident that governments will fulfill their contractual obligations. So, simply restructuring projects to shift more risks to the government may still fail to attract investors.
The two main measures of risk in an investment environment for sovereign entities are country and sovereign risks. These closely related concepts are prevalent in most countries in developing Asia and can deter the development of PPPs by making projects less financially viable. The Organisation for Economic Co-operation and Development (OECD) assesses country risk based on three general risk indicators: the payment experience of the participants and a country’s financial and economic situation. Standard & Poor’s (S&P) sovereign risk, however, refers to the capacity and willingness of a government to service its debt in accordance with the agreed terms. Country risk is broader because it incorporates credit risk exposures from other creditors within a country. Countries considered high risk by the OECD and S&P measures need some form of guarantee or additional government support to backstop their sovereign obligations. Based on these measures, a large percentage of the borrowing member countries of the Asian Development Bank (ADB) are classified as risky.

Realizing the Potential of PPPs to Advance Asia’s Infrastructure Development168
To mitigate these risks, tools are available that can promote the use of PPPs and make infrastructure projects attractive to private investors. Traditionally, this has been done through financial and legal transaction structuring and applying risk allocation, but governments in riskier countries should go further by providing sovereign guarantees or government support agreements. If these do not gain investor confidence, then multilateral development banks (MDBs) can play an important role by offering risk-mitigation tools such as credit-enhancement products.
This chapter examines country and sovereign risks in infrastructure PPP financing, and the complementary roles of governments and MDBs in mitigating these risks. Using case studies and the shadow bid financial model for a sample project, the potential financial benefits from mitigating measures involving governments and MDBs are presented.1 The chapter closes by describing implications for policymakers interested in reducing risks of government counterparties.
Risks in Investing in Infrastructure PPPs Table 7.1 shows the results of a 2016 survey by ADB’s Independent Evaluation Department of infrastructure investors in Asia ranking their risk perceptions (IED 2017).2 Most of the responses were from guarantors, who included export credit agencies, export-import banks, MDBs, bilateral development banks, specialized multilateral insurers, and private insurers. These institutions were overrepresented in the sample, while project sponsors and equipment providers may be underrepresented.
Table 7.1: ADB Survey Results on Infrastructure Investor Risk Perceptions in Asia
Risk
Percentage of Respondents Indicating
the Risk Is High
Payment risk on subsovereign borrowers/guarantors 68
Breach of contract 67
Payment risk on sovereign borrowers/guarantors 62
Country or political risks 59
ADB = Asian Development Bank.
Note: The survey participants were asked what they thought were the most important risks or challenges in financing or investing in infrastructure projects in Asia.
Source: Independent Evaluation Department. 2017. Boosting ADB’s Mobilization Capacity: The Role of Credit Enhancement Products. Manila: ADB.

Risk Mitigation and Sovereign Guarantees for PPPs in Developing Economies 169
The top three risks in Table 7.1 refer to governments, at the sovereign or subsovereign level, failing to meet their contractual obligations, especially their payment obligations. The top risk refers specifically to subsovereign borrowers. Since PPPs generally contain either direct payment obligations from governments, such as availability payments or contingent payment obligations, a negative perception of payment risk from government would be an obvious deterrent to private investors. The fourth risk more broadly states country or political risks, such as war, expropriation, civil disturbance, and breach of contract. In sum, the four highest risks relate to the sovereign counterparty in a PPP contract as opposed to commercial risks.
Figure 7.1 shows that 41% of ADB’s 39 borrowing member countries are in the highest risk category based on the OECD’s country risk classification (that is, categories 6 and 7).3 Considered equally risky are the 31% of countries that do not have an investment grade credit rating. The OECD’s rating categories recommend minimum risk premiums for export credits, including guarantees. A higher risk category rating may ultimately translate into a higher interest rate, which reduces the financial viability of PPPs. A proxy for the interest rate can be derived directly from the risk premium charged by export credit agencies, which is based on this classification. More importantly, many banks will not lend to category 6 or 7 countries or, if they do, will either apply special scrutiny or only lend to PPPs that have hard currency revenues, such as oil wells and international airports.
Figure 7.1: Risk Profile of ADB’s 39 Borrowing Member Countries (%)
31
41
28
Country Risk (OECD)
Unrated (risky)Category 6 or 7 (highest risk)Categories 1–5
5926
15
Sovereign Risk (S&P)
Unrated (not investment grade)Below investment grade (BBB–)At or above investment grade
OECD = Organisation for Economic Co-operation and Development, S&P = Standard & Poor’s.
Sources: OECD country risk classifications and S&P global ratings.

Realizing the Potential of PPPs to Advance Asia’s Infrastructure Development170
Using the S&P’s sovereign risk definition, even more ADB borrowing member countries are considered risky (S&P Global Ratings 2017). In 2015, 26% of ADB’s borrowing member countries were below investment grade (BBB–), while 59% were unrated and would, therefore, be considered risky by international lenders. S&P measures sovereign creditworthiness by scoring five key areas: institutional (how a government’s institutions and policymaking affect a sovereign’s credit fundamentals); economic (economic diversity and volatility, income levels, and growth prospects); external (external liquidity and international investment position); fiscal (fiscal performance and flexibility, and debt burden); and monetary (a monetary authority’s ability to fulfill its mandate while sustaining a balanced economy and attenuating any major economic or financial shocks).
There is evidence that macroeconomic factors affect the bankability of PPP projects. Hammami, Ruhashyankiko, and Yehoue (2006), using the World Bank’s Private Participation in Infrastructure Database, conclude that macroeconomic stability achieved through price stability, together with conducive market conditions, are associated with more projects being committed. A survey on the implementation of PPP infrastructure projects in Nigeria found that poor project bankability; unstable economic policies; and the weak financial, technical, and managerial capabilities of concessionaires were the main factors preventing projects from reaching financial close (Babatunde and Perera 2017).
Reducing risk profiles and having higher credit ratings can attract private investment since these drive investment decisions. Sovereign and country risks play an important role in predicting the number of PPPs reaching financial close and the size of private investments. In their empirical analysis using Euromoney’s measure of country risk, Araya, Schwartz, and Andrés (2013) find that private sector participation in infrastructure projects is sensitive to country risk; that is, risk ratings are a generally reliable predictor of PPP investments in developing countries. An improvement in country risk scores has a positive effect, from 21% to 41%, on the probability of having PPP commitments as well as investments in dollar terms.4 Interestingly, the authors find the result consistent with all infrastructure sectors.
Using both OECD measures of country risk and S&P’s definition of sovereign risk as independent variables, a regression analysis that uses the same methodology (Appendix A7.1 presents the regression framework) finds similar results to Araya, Schwartz, and Andrés (Table 7.2). Countries with higher country risk and lower S&P ratings can adversely affect the number of infrastructure PPPs reaching financial close (models 1 and 2 in Table 7.2). When macroeconomic indicators are introduced (models 3 and 4), the S&P rating loses significance. This result is intuitive since the rating is largely
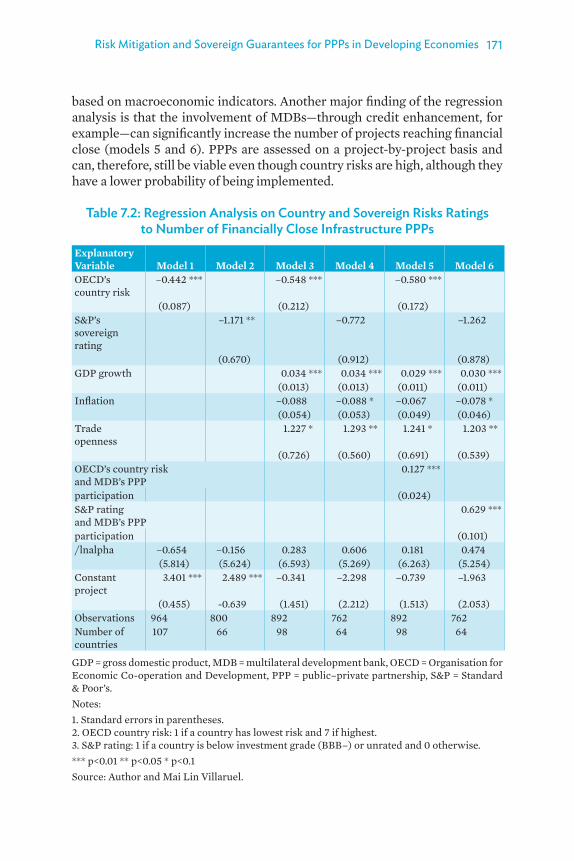
Risk Mitigation and Sovereign Guarantees for PPPs in Developing Economies 171
based on macroeconomic indicators. Another major finding of the regression analysis is that the involvement of MDBs—through credit enhancement, for example—can significantly increase the number of projects reaching financial close (models 5 and 6). PPPs are assessed on a project-by-project basis and can, therefore, still be viable even though country risks are high, although they have a lower probability of being implemented.
Table 7.2: Regression Analysis on Country and Sovereign Risks Ratings to Number of Financially Close Infrastructure PPPs
Explanatory Variable Model 1 Model 2 Model 3 Model 4 Model 5 Model 6OECD’s country risk
–0.442 *** –0.548 *** –0.580 ***
(0.087) (0.212) (0.172) S&P’s sovereign rating
–1.171 ** –0.772 –1.262
(0.670) (0.912) (0.878)GDP growth 0.034 *** 0.034 *** 0.029 *** 0.030 *** (0.013) (0.013) (0.011) (0.011)Inflation –0.088 –0.088 * –0.067 –0.078 * (0.054) (0.053) (0.049) (0.046)Trade openness
1.227 * 1.293 ** 1.241 * 1.203 **
(0.726) (0.560) (0.691) (0.539)OECD’s country risk and MDB’s PPP
0.127 ***
participation (0.024) S&P rating and MDB’s PPP
0.629 ***
participation (0.101)/lnalpha –0.654 –0.156 0.283 0.606 0.181 0.474 (5.814) (5.624) (6.593) (5.269) (6.263) (5.254)Constant project
3.401 *** 2.489 *** –0.341 –2.298 –0.739 –1.963
(0.455) -0.639 (1.451) (2.212) (1.513) (2.053)Observations 964 800 892 762 892 762Number of countries
107 66 98 64 98 64
GDP = gross domestic product, MDB = multilateral development bank, OECD = Organisation for Economic Co-operation and Development, PPP = public–private partnership, S&P = Standard & Poor’s.Notes: 1. Standard errors in parentheses. 2. OECD country risk: 1 if a country has lowest risk and 7 if highest. 3. S&P rating: 1 if a country is below investment grade (BBB–) or unrated and 0 otherwise.*** p<0.01 ** p<0.05 * p<0.1Source: Author and Mai Lin Villaruel.

Realizing the Potential of PPPs to Advance Asia’s Infrastructure Development172
Government Support to Reduce Risk in Infrastructure PPPs Even though investors face high risks with infrastructure PPP projects in developing countries, measures can be taken to reduce and share these risks. Risk allocation is a vital element in structuring PPP projects in developed and developing countries. The literature suggests that risks should be allocated to the party best able to affect the risk factor, influence the sensitivity of a project to the risk, and absorb the risk (Irwin 2007).
Because of the high risk, governments offer many forms of support for PPPs in Asia. The most common are land acquisition and resettlement costs, minimum demand and revenue guarantees, payment obligation guarantees, currency inconvertibility and transferability risk guarantees, and credit guarantees. Other forms of support include viability gap funding and grant funding at financial close to be used during construction (though this is usually limited to a percentage of a project’s capital cost and given on a case-to-case basis). Figure 7.2 shows the modalities for allocating demand risk in PPP projects, with the highest risks for the private investor at the top of the chart. For investors, there is generally a direct relationship between risk and return. The figure shows the conceptual relationship between demand risk and the cost of capital, with availability or capacity payments allocating the least amount of risk to private investors. Full demand risk for greenfield projects without reliable data has the highest amount of risk for investors.
Figure 7.2: Modalities for Allocating Demand Risk in PPP Projects
Risk
s for
the
priv
ate
inve
stor
Cost of capital
Availability or capacity payments
Minimum revenue guarantees
Full demand risk (greenfield)
Full demand risk (brownfield)
Source: Author.
Typically, one would expect projects to have a lower cost of capital when risks are reduced through government commitments to mitigate them through minimum revenue guarantees or availability payments. This lower cost of capital should translate into lower project costs, and ultimately benefit the government.

Risk Mitigation and Sovereign Guarantees for PPPs in Developing Economies 173
This is generally the case, but these commitments are only as good as the level of adherence to them by the government counterparty handling the PPP. As Timothy Irwin has put it, the government counterparty must be able to absorb the risk (Irwin 2007). The government counterparty could be a state-owned utility or bulk power supplier for a power PPP, a municipal utility for a water PPP, or a government contracting agency for a transport PPP.
Governments can improve the domestic investment climate by fostering greater transparency; combating corruption, particularly at the sector level; and improving investor and creditor rights and protection. Doing this can significantly reduce economic and political risks that would otherwise result in extremely high-risk premiums (Schwartz, Ruiz-Nuñez, and Chelsky 2014). In the absence of improving the domestic investment climate, governments can offer explicit guarantees or performance undertakings. In Bangladesh, for example, the allocation of risk in power PPPs is designed to deal with skepticism in the private sector over creditworthiness and the ability of government counterparties to meet payments. Many power infrastructure projects in Bangladesh that reached financial close relied on the government recognizing the payment obligations of government counterparties as sovereign obligations in project agreements (ADB 2017).
Private investors, however, are sometimes unwilling to accept sovereign guarantees or similar support mechanisms because of poor credit ratings or high country-risk profiles. In the “weakest link” credit model used by many project finance rating methodologies, the sovereign rating is a ceiling beyond which the project cannot be rated, except with special justification. S&P, for example, states this in its methodology for project finance transactions.
The Role of Multilateral Development Banks in Sovereign Risk MitigationSubstantial debt financing is available for infrastructure projects in countries with investment grade credit ratings, but there is not much investor appetite for PPPs in countries below investment grade and in emerging markets generally. Credit support for infrastructure PPPs projects can be used to mitigate sovereign, macroeconomic, and project-specific risks, which could benefit PPP projects with weak credit profiles (OECD 2017).
Because a government’s sovereign guarantees may not be enough to make projects financially viable, MDBs can be catalysts for investment. As the regression analysis indicates, there is empirical evidence to support the role of MDBs in providing credit enhancement. Credit enhancement products

Realizing the Potential of PPPs to Advance Asia’s Infrastructure Development174
offered by MDBs can be an efficient, targeted form of intervention. They can lower risks to investment opportunities in difficult sovereign environments so that projects become attractive for risk-averse investors and crowd in private capital to finance infrastructure in developing countries (Moody’s Investors Service 2017). Many credit-enhancement tools are already available in the market as well as through international financial institutions. ADB (2017) identified comprehensive guarantees covering commercial and political risks as the most important form of credit guarantee (high importance), followed by extended political risk guarantees.
The private sector operations of MDBs offer guarantees, syndications, and risk transfers for private insurers. These cover many risks, including political risk and breach of contract for government payments or reimbursement to lenders in case a project is terminated. These products are typically marketed to sponsors with lenders as the ultimate beneficiary. Private investors see significant value as well as an untapped demand for using these products, especially in lower-income countries trying to increase private participation in infrastructure (Moody’s Investors Service 2017). This implies that they could be used more often.
Sovereign partial risk guarantees are another tool that MDBs can use to tackle country risk. These guarantees disburse funds according to preestablished triggers that are legally binding on both the grantor (typically a state-owned enterprise or government agency) and the concessionaire (PPP project company). They also require a sovereign counter indemnity from the government, which defines the government’s obligation as well as the penalties that MDBs can apply for noncompliance. Table 7.3 compares guarantee products from the World Bank and ADB, that can be used to backstop government payment obligations in a PPP contract and describes the pricing of the products (if published along with the main beneficiaries). These products were developed by MDBs to cover a wider range of risks than those typically used by the private insurance market, particularly government default on their contractual obligations. In this sense, sovereign partial risk guarantees cover an area between traditional political risk and commercial risk, though they are not a form of political risk insurance (Matsukawa and Habeck 2007). Figure 7.3 outlines the triggering mechanism for sovereign partial risk guarantees with a letter of credit.

Risk Mitigation and Sovereign Guarantees for PPPs in Developing Economies 175
Table 7.3: World Bank and ADB Guarantee Options for Government Payment Obligations
Item World Bank
IDA PRG
ADB Sovereign PRG /PCG
MIGA Breach of Contract ADB
Guarantee fee 75 bps 50 bps Market Market
Commitment fee 0 bps 15 bps … …
MOF requirement Counter indemnity
Counter indemnity
None None
Arbitration None None Yes Yes
Credit rating of guarantor
AAA AAA Shadow rated
AAA
Ultimate beneficiary Sponsors and lendersa
Sponsors and lendersa
Sponsors and lenders
Lenders
… = not available, ADB = Asian Development Bank, bps = basis points, IDA = International Development Association, MIGA = Multilateral Investment Guarantee Agency, MOF = ministry of finance, PCG = partial credit guarantee, PRG = partial risk guarantee.Note: An obligor-rated AAA has extremely strong capacity to meet financial commitments. AAA is the highest issuer credit rating assigned by Standard & Poor’s. a Through a letter of credit, the beneficiary would technically be the letter of credit issuing
bank.
Sources: Author; ADB (2011); World Bank (2018).
Sovereign partial risk guarantees have two main advantages over traditional insurance. The first is pricing. The sovereign counter indemnity and guarantee agreement ensures that projects can be priced at a similar interest rate to sovereign loans offered by MDBs. The second is timing. In traditional political risk insurance, the sponsor needs to have an arbitral award to receive payment. A sovereign partial risk guarantee with a letter of credit has the advantage of paying out automatically based on preestablished triggers defined in the PPP contract. These triggers can be linked to key performance indicators that are verified by an independent engineer, whose verification is legally binding on both the government and private partner.

Realizing the Potential of PPPs to Advance Asia’s Infrastructure Development176
Figure 7.3: Sovereign Partial Risk Guarantee Using a Letter of Credit for a PPP
Ministry of Finance
LC issuing bankProject companyPPP
Multilateraldevelopment bank
Shareholders Lenders
1. Annuity payment obligation(PPA or availability payment)
2. Standby LC
3. Reimbursement agreements
4. Guarantee
Government ministry or state-owned
enterprise
5.Counter indemnity
LC = letter of credit, PPA = power purchase agreement, PPP = public–private partnership.Note: A default in the payment obligation of the government or state-owned enterprise will result in the on-demand payment of the LC, and the LC issuing bank will then seek reimbursement. The guarantee is called if the reimbursement is not paid within the reimbursement period. The counter indemnity is then called if it is not reimbursed within a period specified by the multilateral development bank; for example, 90 days. Source: Author.
Case Study: Making a Kenya Power Project Viable Using Partial Risk Guarantees
The following looks at how a sovereign partial risk guarantee was used for a PPP power project in Kenya. Kenya Power (previously Kenya Power and Lighting Company) is a professionally managed power utility, majority owned by the Government of Kenya and traded on the Nairobi Securities Exchange. After the 2008 global financial crisis, Kenya Power found it difficult to attract investors for power projects—a situation aggravated by the political unrest after the 2007 elections.
Despite this difficult operating environment, the company steadily improved its performance and, by 2010, had several power purchase agreements with independent power producers. But, because of droughts from 2009 to 2011, it did not have enough energy from its hydropower plants and had to contract emergency generation at a very high price—$0.321 per kilowatt-hour.
Having to use emergency generation was a heavy financial burden on Kenya Power, which decided to contract new thermal and geothermal generation capacity to reduce the reliance on emergency generation in the medium term.

Risk Mitigation and Sovereign Guarantees for PPPs in Developing Economies 177
It earmarked four independent power producers to provide a solution to its power shortage (Kaçaniku and Izaguirre-Bradley 2015). Kenya’s Thika Power Ltd. was one of these producers, and it was slated to design, build, operate, and maintain an 87-megawatt combined-cycle diesel plant. Revenue for Thika Power was to come from 20-year power purchase agreement with Kenya Power, the government counterparty for the power purchase agreement.
Because Kenya Power faced a cash shortage, and because of the election unrest, the Thika power project would not have been viable without credit enhancement from MDBs. The World Bank Group, through the Multilateral Investment Guarantee Agency (MIGA) and the International Development Association (IDA), provided a credit-enhancement package to bolster financing for Thika Power and the other three projects.
For credit enhancement, MIGA provided political risk insurance to cover termination payments for commercial lenders and sponsor equity, and IDA provided the partial risk guarantee with a letter of credit to cover Kenya Power’s payment obligations under the power purchase agreement (Figure 7.4).
Figure 7.4: Partial Risk Guarantee Structure for Thika Power
Concession grantorGovernment of Kenya
O�takerKP
LC issuing bankProject companyThika Power
IBRD/IDA
ShareholdersMelec Power Generation (90%)Africa Energy Resources (10%)
Lenders/Guarantors
Reimbursementagreements
Power purchaseagreement
International Finance Corporation African Development Bank
ABSA CapitalMIGA Political Risk Guarantee
Sovereign partial risk guaranteeStandby LC
Counter indemnity
IBRD = International Bank for Reconstruction and Development, IDA = International Development Association, KP = Kenya Power, LC = letter of credit, MIGA = Multilateral Investment Guarantee Agency.
Source: Author.
MIGA’s political risk insurance covered commercial lenders in case of termination and protected sponsors from political risk events, and had a term of 15 years to encourage longer-term lending. IDA’s partial risk guarantee

Realizing the Potential of PPPs to Advance Asia’s Infrastructure Development178
covered payment risk from Kenya Power. The letter of credit covered 3 months of capacity and energy payments and 2 months of fuel payments; the coverage was offered on a rolling basis. It would pay out automatically whether the payment was missed because of either Kenya Power’s default or government interference. The letter of credit would also pay if there was a force majeure event preventing Kenya Power from meeting its obligations. The company had 12 months to repay the bank issuing the letter of credit before the guarantee was called. This mechanism ensured continuity for the 15-year period of support.
Thika Power and the other independent power producers receiving IDA’s partial credit guarantees were the first independent power producers in Kenya to attract long-term commercial financing. Of the total $623 million funding for the four projects, $181 million was provided by commercial banks. For Thika Power, MIGA insured up to €81 million ($94 million). This supported local investors and added 298 megawatts of critically needed generation capacity.
An important factor for the success of this transaction was the two types of support provided by the multilateral agencies to the projects—MIGA covering the termination payment and IDA’s partial risk guarantee through the letter of credit, which covered power purchase agreement payments and, through its triggering mechanism, ensured timely payments. Payment was due on demand on the basis of the verification process in the contract and did not need an arbitral award from an international court (Government of Kenya and IDA 2012).
Another success factor was that the guarantee cover reduced the government’s contingent liabilities. If IDA’s partial risk guarantee cover had not been given, the government would have had to provide an explicit sovereign guarantee to cover all of Kenya Power’s obligations for the duration of the power purchase agreement. The alternative would have been for Kenya Power to provide its own cash collateral, which would have further strained its finances. Both options would have cost much more than the $35 million and €7.7 million ($9.1 million) in the letters of credit.
This case study shows several advantages of using sovereign partial risk guarantees, which in this case helped catalyze $623 million for four independent power producers in Kenya. A disadvantage of this product, however, is that a counter indemnity may be hard to obtain from governments who, possibly along with private sponsors, may not be aware of the advantages of sovereign guarantees. This makes capacity building necessary. Outside of this product, other solutions are available to deal with sovereign counterparty risk in PPP transactions.

Risk Mitigation and Sovereign Guarantees for PPPs in Developing Economies 179
Case Study: How a Turkish Hospital PPP Broke the Sovereign Ceiling
Turkey’s Elaziğ Hospital PPP shows how two different instruments—a European Bank for Reconstruction and Development (EBRD) standby liquidity facility and extended political risk insurance from MIGA—were used to tackle the ability and willingness to pay of government counterparties. Elaziğ Hospital is a 1,038-bed complex comprising two hospitals and one clinic (Moody’s Investors Service 2016). The project site was delivered in October 2016 and construction was supposed to have been completed in September 2018. The bond issued to fund the PPP project totaled €282 million ($335 million). The availability payments are to be paid by the Ministry of Health for services provided by the project company, ProjectCo. To finance the project, two types of bonds rated by Moody’s Investors Service were used: A1 bonds, which are credit enhanced, and A2 bonds, which are not.
The bonds benefited from two types of risk mitigation: MIGA’s extended political risk insurance coverage, which includes classic coverage (transfer restriction and expropriation) and breach of contract. And a subordinated liquidity facility from the ERBD, which covers ProjectCo in case of a breach of contract by the Ministry of Health.
Because of the level of risk mitigation provided by MDBs, this project was rated Baa2; that is, above Turkey’s Ba1 sovereign ceiling. This is unusual in PPP projects generally, and it is even more unusual in social sector PPPs. Historically, ratings above the sovereign occur in mineral or oil extraction, which tend to have the characteristics—insulation and offshore, hard currency revenue—needed for a higher rating.
A major factor for this PPP’s success was the credit enhancement provided by MIGA and the ERBD, which was not affected by Turkey’s sovereign environment. To break through a sovereign ceiling, a project must have better credit fundamentals than the sovereign and be insulated from domestic macroeconomic and financial disruptions.
Multilateral support for Turkey’s health sector was also a factor for the higher ratings. This showed that upstream loans and technical assistance can have material impact on the bankability of PPPs. It should be noted that the European Investment Bank uses a similar mechanism to the liquidity facility used by the ERBD in this project—an unfunded letter of credit that can cover up to 20% of a project’s cost during either the construction or operation phases. This facility can also raise projects below investment grade to investment grade (EIB 2012).

Realizing the Potential of PPPs to Advance Asia’s Infrastructure Development180
Estimating the Benefits of a Multilateral Development Bank Partial Risk GuaranteeLarge infrastructure projects are even more costly once risk-adjusted, while guarantees and complementary support from MDBs also increase PPP project costs by charging fees. The question is how to keep these costs as low as possible to reduce the cost of risk-adjusted PPP projects. Using a shadow bid financial model, this section presents the potential financial benefits, especially to governments, of an MDB partial risk guarantee. The model involves developing a shadow bid that provides an estimate of the annual service payments—the amount of revenue to cover all expected costs and provide the private partner with an attractive return—that the private sector would need to estimate before investing in a PPP project.
In a PPP project relying on government payments, the financial benefit to the government of using an MDB partial risk guarantee comes from a reduction in debt costs, enabling the project to raise financing at more favorable terms. The benefit will vary with the involvement of a sovereign counter indemnity by the host country. The sovereign country indemnity governs the repayment obligations in case the guarantee is called, and it allows the guarantee to be governed under similar conditions to sovereign loans with cross-default and cross-acceleration provisions. It also reduces the pricing of the guarantee when compared with private insurance markets.
The following is an example of how an MDB partial risk guarantee can reduce the total cost to the government. In this scenario, the infrastructure PPP project’s shadow bid financial model has the following specifications: a debt to equity ratio of 61:39, with 65% of total debt in United States dollars, which accounts for 40% of total funding (debt and equity). The total project cost is $300 million, and the country is below investment grade at BB– on S&P’s rating. The rest of the debt consists of local currency lending from a state-owned financial institution (30%) and approximately (5%) from local commercial lenders. These project specifications were chosen because they represent a typical financial structure for which a guarantee may need to be provided in ADB’s borrowing member countries, including a high amount of equity relative to developed markets and mixed financing in local and hard currencies. The partial risk guarantee provided by MDBs is estimated to reduce the cost of debt by 125 basis points for the hard currency portion of the lending. In most financial models, reducing the cost of debt will increase the project’s equity internal rate of return. This is not realistic, however, because bidders would not require a higher return for a project that has a reduced risk. So, instead of increasing the project’s equity internal rate of return, government annuity payments are adjusted downward, assuming the same rate of return and reflecting the reduced cost of funding. This is illustrated in Figure 7.5.

Risk Mitigation and Sovereign Guarantees for PPPs in Developing Economies 181
Figure 7.5: Government Annuity Payments with and without Multilateral Development Bank Sovereign Partial Risk Guarantees
120
90
60
30
–1 2 3 4 5 6 7
Year of operation
8 9 10 11 12 13 14 15 16 17
$ m
illio
n
Government annuity payments (base case) Government annuity payments (PRG) Cost of the PRG
PRG = partial risk guarantee.Source: Author’s calculations.
As Figure 7.5 shows, there is clearly an effective reduction in government annuity payments. The payments are higher under the base-case scenario relative to an MDB’s partial risk guarantee. Figure 7.6 shows the reduction totaled $40 million, but it is associated with the total cost of the sovereign partial risk guarantee, amounting to $7.2 million during the years of operation. This cost is calculated based on ADB’s published figures of a guarantee fee of 50 basis points and a commitment fee of 15 basis points. Thus, under the guarantee terms, a government could save $32.8 million (approximately 13% of the capital expenditure) from a project, which could lead to increased social benefits by allocating these savings to equally important public services. This example is illustrative and real savings can only be demonstrated by actually seeing the results of the tendering.
Figure 7.6: Estimated Financial Benefits of a Sovereign Partial Risk Guarantee
4
3
2
1
01 2 3 4 5 6 7 8 9 10 11 12 13 14 15 16 17
$ m
illio
n
Year of operation
Reduction of government annuity payments Cost of the PRG
PRG = partial risk guarantee.Source: Author’s calculations.

Realizing the Potential of PPPs to Advance Asia’s Infrastructure Development182
It is important to note that the estimated financial benefits fully accrue to the government only if a partial risk guarantee is made available before bidding. This could be done through a letter of interest or as a stapled financing package offered by MDBs. This allows bidders to adjust their bids according to a project’s reduced risk profile. When these guarantees come after the bidding, the financial benefits accrue largely to sponsors and lenders. The government, however, still benefits since this increases the likelihood of a project reaching financial close.
If a PPP project has a partial risk guarantee by an MDB but is not backed by a sovereign counter indemnity, the total cost of the guarantee for the years of operation would be higher at $18.2 million (Figure 7.7). In this case, the financial benefits from credit enhancement by an MDB tend to be lower, at $21.8 million or approximately 8% of capital expenditure. But, because many governments are not willing to offer sovereign counter indemnity, the net financial benefits of nonsovereign partial risk guarantees should be considered.
Figure 7.7: Estimated Financial Benefits of a Nonsovereign Partial Risk Guarantee
1 2 3 4 5 6 7 8 9 10 11 12 13 14 15 16 17
$ m
illio
n
Year of operation
Reduction of government annuity payments Cost of the PRG nonsovereign4
3
2
1
0
PRG = partial risk guarantee.
Source: Author’s calculations.
In practice, the net financial benefits are expected to be larger than the examples presented for two main reasons. First, the model only considers effects that are certain. In the scenarios, debt will be reduced by an MDB guarantee and after receiving a guarantee, a sponsor, would at the very least demand a similar investment return. In reality, sponsors tend to bid more aggressively, thereby reducing their return in proportion to the reduction in risk. Second, the model assumes a constant debt-to-equity ratio. The level of debt is expected to increase as debt providers could cover a higher percentage of debt. A higher leverage would lower project costs for governments because debt is cheaper than equity. These effects would further reduce the

Risk Mitigation and Sovereign Guarantees for PPPs in Developing Economies 183
government annuity payment. It should be noted that, in some countries, the amount of equity is mandated by law or regulation, which means the second argument would not apply.
Conclusion and Policy ImplicationsSovereign risk mitigation is often needed to catalyze PPPs in developing countries with high credit risk ratings. In developing Asia, a large percentage of countries borrowing from MDBs are considered risky. Sovereign risk and country risk are associated with the financial closure of infrastructure PPP projects. Reducing these risks through guarantees provided by MDBs is a solution, but this is only one of many options that include private insurance and letters of credit. The case studies from Kenya and Turkey show that, in projects with a dedicated source of revenue and high demand for services, credit enhancement from MDBs helped to enable financial close.
Key risks for private investors include dealing with a government counterparty’s payment timeliness and its willingness to pay. Risk mitigation instruments such as MDB-issued letters of credit and partial risk guarantees that are not affected by a country’s macro environment are beneficial, and, in some cases, they can raise the credit rating of the project above the sovereign ceiling. The Elaziğ Hospital PPP showed that proper risk mitigation can be used outside traditional sectors, such as power, and are also effective in social sectors. Further, the upstream support to Turkey’s health sector by the EBRD was considered a material factor determining the project’s credit rating. This implies that MDBs should continue their engagement in upstream capacity building since this can have a material impact on PPP investments downstream.
Another policy implication is that there are ways to reduce risk that should be taken before turning to credit enhancement. These include improving domestic investment conditions through increased transparency, practicing risk allocation, and using government support where needed. When credit enhancement is used by MDBs, the empirical analysis shows it can be a significant factor in attracting investment. But, for the financial benefits of these interventions to accrue to the government, they must be in place before bidding. This implies that there should be early dialogue between government and MDBs during the transaction advisory stage.

Realizing the Potential of PPPs to Advance Asia’s Infrastructure Development184
Notes1. A shadow bid model is a financial model used before bidding. It estimates all project costs,
including the cost of financing, and it can be used by advisors to governments to establish benchmarks.
2. The 2016 survey polled 183 institutions and received 78 responses. Institutions included guarantors (39 respondents), commercial banks (15 respondents), financial services organizations (15 respondents), and project sponsors and equipment suppliers (9 respondents).
3. ADB’s country risk assessment model also gives qualitative assessments of countries’ political risk on a scale from 1 (lowest) to 7 (highest).
4. Euromoney’s country risk index is the weighted average of the following indicators: political risk (25%), economic performance (25%), debt indicators (10%), debt in default or rescheduled (10%), credit ratings (10%), access to bank finance (5%), access to short-term finance (5%), access to capital markets (5%), and discount on forfeiting (5%).

Risk Mitigation and Sovereign Guarantees for PPPs in Developing Economies 185
Appendix A7.1: Regression FrameworkThis chapter ran a panel regression model to explore the effect of the Organisation for Economic Co-operation and Development’s (OECD) country risk classifications and Standard & Poor’s (S&P) sovereign ratings on the number of financially closed infrastructure public–private partnerships (PPPs). The PPP projects are taken from the World Bank’s Private Participation in Infrastructure Database and complemented with data from the World Development Indicators, with variables including gross domestic product (GDP) growth, inflation, and country trade openness.
Following Araya, Schwartz, and Andres (2013), a Poisson regression model was used.
ln(
∗
∑ ∗
,
. The
,
2
,
i ) = β0 + β1Risk measuresi + β2GDP growthit–1 + β3Inflationit–1 + β4Trade opennessit–1 + εit ,
where
∗
∑ ∗
,
. The
,
2
,
i is the number of projects in country , from 1991 to 2015. Risk measuresi are the OECD’s country risk classification or S&P’s sovereign ratings. Most econometric specifications dealing with GDP and investments suffer from endogeneity. This is addressed by assuming the investments are being affected by previous year events. GDP growthit–1 is GDP growth for country , in the year t-1, and is expected to have a positive impact on investments in PPPs. Inflationit–1 captures the monetary instability for country , in the year t-1 and is expected to have a negative impact. Trade opennessit–1 is a proxy for the openness of the country calculated as the sum of exports and imports over the GDP for country , in the year t-1; it is expected to have a positive impact on investments. Inflation and openness are log transformed.
To test the participation of multilateral development banks (MDBs) in catalyzing the private financing of infrastructure projects through various schemes, including credit enhancement products, a dummy variable 1 was introduced, if an MDB participates in any of the PPP projects of a given country or 0 otherwise. The interaction variable between PPP participation of MDBs and the OECD’s credit risk and S&P’s rating was introduced in the model.
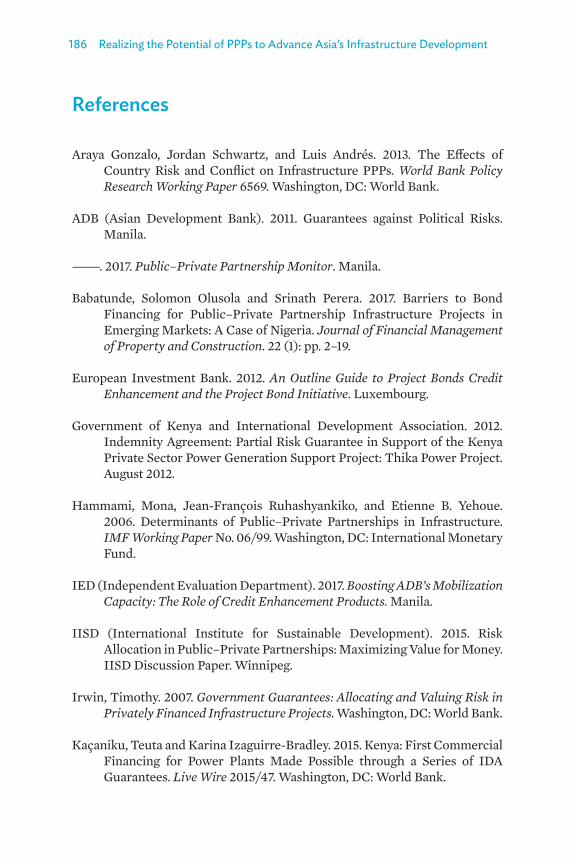
Realizing the Potential of PPPs to Advance Asia’s Infrastructure Development186
References
Araya Gonzalo, Jordan Schwartz, and Luis Andrés. 2013. The Effects of Country Risk and Conflict on Infrastructure PPPs. World Bank Policy Research Working Paper 6569. Washington, DC: World Bank.
ADB (Asian Development Bank). 2011. Guarantees against Political Risks. Manila.
———. 2017. Public–Private Partnership Monitor. Manila.
Babatunde, Solomon Olusola and Srinath Perera. 2017. Barriers to Bond Financing for Public–Private Partnership Infrastructure Projects in Emerging Markets: A Case of Nigeria. Journal of Financial Management of Property and Construction. 22 (1): pp. 2–19.
European Investment Bank. 2012. An Outline Guide to Project Bonds Credit Enhancement and the Project Bond Initiative. Luxembourg.
Government of Kenya and International Development Association. 2012. Indemnity Agreement: Partial Risk Guarantee in Support of the Kenya Private Sector Power Generation Support Project: Thika Power Project. August 2012.
Hammami, Mona, Jean-François Ruhashyankiko, and Etienne B. Yehoue. 2006. Determinants of Public–Private Partnerships in Infrastructure. IMF Working Paper No. 06/99. Washington, DC: International Monetary Fund.
IED (Independent Evaluation Department). 2017. Boosting ADB’s Mobilization Capacity: The Role of Credit Enhancement Products. Manila.
IISD (International Institute for Sustainable Development). 2015. Risk Allocation in Public–Private Partnerships: Maximizing Value for Money. IISD Discussion Paper. Winnipeg.
Irwin, Timothy. 2007. Government Guarantees: Allocating and Valuing Risk in Privately Financed Infrastructure Projects. Washington, DC: World Bank.
Kaçaniku, Teuta and Karina Izaguirre-Bradley. 2015. Kenya: First Commercial Financing for Power Plants Made Possible through a Series of IDA Guarantees. Live Wire 2015/47. Washington, DC: World Bank.

Risk Mitigation and Sovereign Guarantees for PPPs in Developing Economies 187
Matsukawa, Tomoko and Odo Habeck. 2007. Review of Risk Mitigation Instruments for Infrastructure Financing and Recent Trends and Developments. Trends and Policy Options 4. Washington, DC: World Bank.
Moody’s Investors Service. 2016. ELZ Finance SA Presale Report: Elaziğ Hospital PPP Exceeds Turkey’s Sovereign Rating with Strong Multilateral Support. New York.
———. 2017. Credit enhancements from Multilaterals Will Help to Address the Infrastructure Gap. https://www.researchpool.com/provider/moodys-investors-service/global-infrastructure-focus-october-2017.
OECD (Organisation for Economic Co-operation and Development). 2017. Selected Good Practices for Risk Allocation and Mitigation in Infrastructure in APEC. Paris.
Schwartz, Jordan Z., Fernanda Ruiz-Nuñez, and Jeff Chelsky. 2014. Closing the Infrastructure Finance Gap: Addressing Risk. Sydney: Reserve Bank of Australia.
S & P Global Ratings. 2017. Sovereign Risk Indicators 2017 Estimates. http://www.sprating.com/sri/.
World Bank. 2018. World Bank Guarantee Pricing. HYPERLINK “http://www.worldbank.org/en/programs/guarantees-program” \l “5” http://www.worldbank.org/en/programs/guarantees-program#5

PART III

PART III
Lessons from the Experience of Using Public-Private Partnerships
in Developing Asia


CHAPTER 8
Delivering Economic Benefits from Public–Private Partnerships: The Experience of the Republic of Korea
Jungwook Kim and Suhyeon Wi
Introduction The public–private partnership (PPP) modality can enhance the cost efficiency and quality of infrastructure, delivering benefits to the public, government, and private sector. Although these benefits are widely recognized, evidence is lacking on the actual contribution PPPs make to the economy. PPP projects can deliver significant economic benefits, but only if they are well-executed and strong legal, regulatory, and institutional frameworks are in place for these partnerships. This chapter examines the economic effects of infrastructure PPPs in the Republic of Korea and, based on that experience, highlights some lessons learned for other countries in Asia looking to increase the use of PPPs to close their infrastructure gaps.
The Republic of Korea started using the PPP modality as a response to a sharp decline in public and private investment in infrastructure in the late 1990s because of the Asian financial crisis, although its importance for closing infrastructure gaps was recognized earlier in that decade. The Public–Private Partnerships in Infrastructure Act of 1994 was revised in 1998 to strengthen risk-sharing mechanisms in PPP minimum revenue guarantees and construction subsidies, and to assign more infrastructure projects for these partnerships. Since 1998, the country has carried out more than 600 PPP projects.
This engagement with PPPs has, by and large, been a success and has contributed to delivering economic and social welfare benefits. A key reason for this is the country’s strong legal, regulatory, and institutional frameworks to facilitate infrastructure PPP projects. This chapter looks at how good governance and having clear options to resolve the disputes, that are often inevitable in such partnerships, have been essential to that success. The chapter also examines the factors that have been important for shaping the county’s PPP landscape, including fiscal soundness, unsolicited project proposals, and the refinancing and renegotiation of PPPs.

Realizing the Potential of PPPs to Advance Asia’s Infrastructure Development192
Expected Economic Effects of Infrastructure PPPsPPPs are expected to have positive economic effects because they channel private resources into infrastructure spending. PPPs can ease budget constraints and help close demand–supply gaps for infrastructure—a pressing problem for many developing countries in Asia. All in all, PPPs are a good pathway for governments with limited fiscal resources to build more infrastructure. When well executed, infrastructure PPP projects have the same economic benefits as projects financed by traditional procurement in enhancing productivity and delivering social welfare benefits. PPPs have the added benefit of allocating financial risk to the party best able to manage them, and they can actively drive value for money and increase the efficiency of projects.
Even though private investment in infrastructure is increasing, it is not easy to gauge its contribution to economic growth. Using the World Bank’s Private Participation in Infrastructure Database, Lee and Rhee (2007) show the relationship between PPP projects and economic growth. They find that infrastructure and total investment have positive impacts on economic growth, but that PPP infrastructure investments do not have a significant relationship with economic growth. Using monthly time series data on the value of construction investment in the Republic of Korea, the authors find that an increase in PPP investment is associated with a decrease in public investment in both the short and long term, and only an increase for private investment in the short term. This indicates a crowding-out effect of PPPs on public investment. Even so, they conclude, this does not necessarily mean that PPPs have no role to play in providing infrastructure. Indeed, were it not for PPPs, infrastructure investment would have fallen significantly in the Republic of Korea during 2000–2006, the period covered in their study. Because PPPs were then at an early stage, a balanced evaluation of their impact on the economy had to wait until more projects were available for study.
Campos et al. (2003), studying macroeconomic variables in 21 Latin American countries during 1985–1998, found a negative correlation between infrastructure PPP projects and government spending on transport. The findings of this study and Lee and Rhee (2007) suggest that, although PPPs may not have increased infrastructure investments, they contributed to maintaining these investments at a certain level. In the Republic of Korea, infrastructure investment would have fallen sharply had the government not promoted PPPs. Figure 8.1 shows the structural flow of the economic contribution of PPP projects.
Delivering Economic Benefits from PPPs—The Experience of the Republic of Korea 193
Figure 8.1: The Economic Contribution of PPPs
Growth e�ect Welfare e�ect
PPP projects
Using private investment resources
Introducing creativity and e�ciency in the private sector
Value for money E�ciency e�ect
PPP = public–private partnership.
Source: Asian Development Bank and Korea Development Institute. 2011. Public–Private Partnership Infrastructure Projects: Case Studies from the Republic of Korea. Manila and Seoul.
The allocation of risk and improving service quality through a PPP can be achieved through higher value for money and efficiency. ADB and KDI (2011) show that PPPs can have positive ripple effects on an economy by contributing to growth through private capital inputs, enhancing social welfare by the prompt delivery of services and the early realization of social benefits, and reducing fiscal burdens through better value for money. And, when PPP’s use advanced financial techniques, they can contribute to developing financial markets.
Evidence on the Economic Effects of PPPsMany developing countries lack a solid body of empirical evidence on the economic effects of PPPs because not enough of these projects have been carried out to accumulate this evidence, there is a lack of resources, and data remains inadequate for this analysis. The Republic of Korea, however, has this evidence from surveys on the effects of various types of infrastructure PPPs, and these are presented in the following section.

Realizing the Potential of PPPs to Advance Asia’s Infrastructure Development194
Korea Development Institute Survey Results
In 2014, the Korea Development Institute surveyed the quality of 16 build–transfer–operate (BTO) infrastructure projects, involving 57 respondents from ministries, government agencies, and operators (KDI 2014).1 Respondents rated the quality of these projects as being higher than similar government-funded projects, with PPPs scoring on governance, facility maintenance, and the early delivery of facilities, particularly for road and rail projects (Table 8.1). Creativeness and efficiency got the most positive responses, except for port construction. On the downside, 71% of respondents said service fees were too high for private finance initiative projects.
Table 8.1: Korea Development Institute 2014 Survey on Build-Transfer-Operate Projects
(% of respondents)
SectorPrefer Public
Project No PreferencePrefer PPP
Project
Environment 16.7 66.7 16.7
Road 0.0 50.0 50.0
Rail 0.0 87.5 12.5
Harbor 0.0 100.0 0.0
Total 7.1 75.0 17.9
PPP = public–private partnership.
Source: Korea Development Institute. 2014. Comprehensive Evaluation on Public–Private Partnership Projects in Korea. Sejong.
A Korea Development Institute survey on 429 build–transfer–lease (BTL) infrastructure projects polled 54 government officials involved in these projects and operators, and 600 users of the finished infrastructure (KDI 2014). Respondents were asked whether they preferred PPPs to government-funded BTL projects. Most respondents said projects were built quicker using PPPs and that the expected benefits were achieved, especially for sewerage systems. Respondents also recognized the contribution of the creativeness and efficiency of the private partners. In the user survey, PPP project facilities were seen as better than government-funded ones (Table 8.2). Fifty-one percent of respondents were satisfied with the level of fees for using BTLs, and this rose to 70.7% for cultural and tourism facilities in certain areas. Most PPP facilities were evaluated as superior to government-funded facilities, with PPPs for military housing, cultural and tourism facilities, and schools scoring particularly highly. Noticeable features of PPP projects were a diversity of facilities and well-constructed interiors.

Delivering Economic Benefits from PPPs—The Experience of the Republic of Korea 195
Table 8.2: Comparison Result on Characteristics of Build-Transfer-Lease Projects
Criteria Observations Average Standard Deviation
Appearance 598 2.159 1.182
Convenience 598 2.331 1.127
Diversity of facilities 597 2.437 1.136
Function 595 2.385 1.094
Environment 597 2.588 1.136
Sanitary 596 2.455 1.149
Security 596 2.622 1.133
Note: Average response to a six-point scale survey.
Source: Korea Development Institute. 2014. Comprehensive Evaluation on Public–Private Partnership Projects in Korea. Sejong.
In the survey of government officials and operators, respondents said infrastructure BTL projects using the PPP modality saved on construction time and achieved their targeted benefits. On the downside, respondents felt the Ministry of Economic and Finance should improve its knowledge of laws applying to PPPs (31.5% of respondents), and that operators needed to forge strong partnerships with the ministry, which oversees BTL projects (37.0%). In sum, both surveys show that user satisfaction was greater for PPPs than government-funded infrastructure. But the results differed for type of facility. Overall, however, the results indicate that BTO and BTL infrastructure done through PPPs deliver higher-quality services.
Impact on Growth from Private Investment in Infrastructure
Private investment in infrastructure in the Republic of Korea totaled W106 trillion ($98.33 billion) at the end of 2016 according to the Ministry of Economy and Finance. Table 8.3 shows private investment in BTO infrastructure projects and its contribution to gross domestic product growth from 2001 to 2012. Table 8.4 shows the same for BTL projects for 2005 to 2012.

Realizing the Potential of PPPs to Advance Asia’s Infrastructure Development196
Table 8.3: Effect on Growth from Build-Transfer-Operate Projects in the Republic of Korea
(won trillion)
YearNominal
GDP
Total Project Cost of BTO
Projects
Private Investment
in BTO Projects
Contribution to GDP
GDP Growth Effect
(%)2001 651.42 1.83 1.36 107 0.1652002 720.54 2.33 1.71 150 0.2082003 767.11 2.27 1.63 161 0.2092004 826.89 2.98 2.12 180 0.2182005 865.24 4.08 2.78 232 0.2682006 908.74 5.13 3.42 299 0.3292007 975.01 5.46 3.70 341 0.3492008 1,026.45 5.86 4.10 381 0.3712009 1,065.04 5.00 3.49 370 0.3482010 1,173.28 3.36 2.47 291 0.2482011 1,235.16 3.46 2.51 246 0.1992012 1,272.46 3.53 2.72 249 0.195
BTO = build–transfer–operate, GDP = gross domestic product.Source: Korea Development Institute. 2014. Comprehensive Evaluation on Public–Private Partnership Projects in Korea. Sejong.
Table 8.4: Effect on Growth from Build-Transfer-Lease Projects in the Republic of Korea
(won trillion)
YearNominal
GDP
Total Project Cost of BTL
Projects
Private Investment
in BTL Projects
Contribution to GDP
GDP Growth Effect
(%)2005 865.24 0.0044 0.0044 0.15 0.00017
2006 908.74 0.81 0.81 33 0.037
2007 975.01 2.19 2.19 139 0.143
2008 1,026.45 3.58 3.56 276 0.269
2009 1,065.04 3.63 3.60 340 0.319
2010 1,173.28 3.88 3.85 364 0.310
2011 1,235.16 4.17 4.15 389 0.315
2012 1,272.46 3.77 3.77 384 0.302
BTL = build–transfer–lease, GDP = gross domestic product.Source: Korea Development Institute. 2014. Comprehensive Evaluation on Public–Private Partnership Projects in Korea. Sejong.
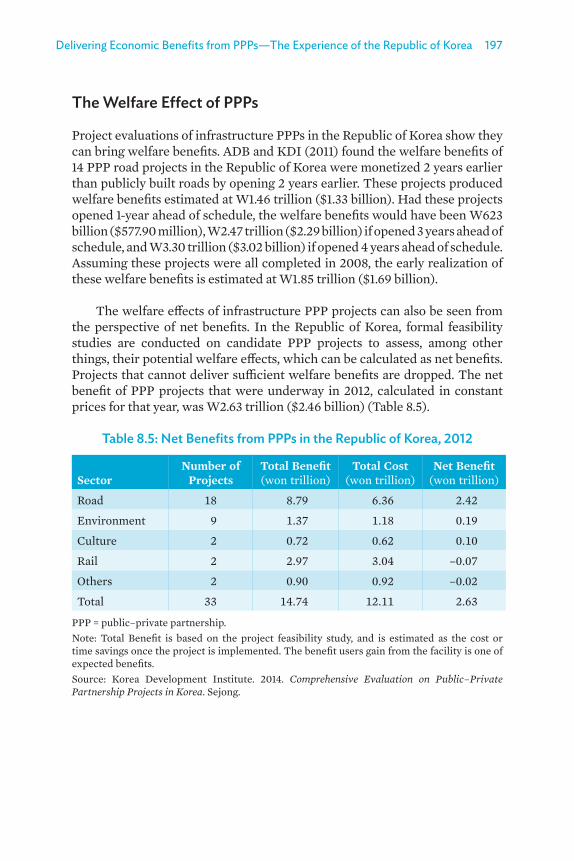
Delivering Economic Benefits from PPPs—The Experience of the Republic of Korea 197
The Welfare Effect of PPPs
Project evaluations of infrastructure PPPs in the Republic of Korea show they can bring welfare benefits. ADB and KDI (2011) found the welfare benefits of 14 PPP road projects in the Republic of Korea were monetized 2 years earlier than publicly built roads by opening 2 years earlier. These projects produced welfare benefits estimated at W1.46 trillion ($1.33 billion). Had these projects opened 1-year ahead of schedule, the welfare benefits would have been W623 billion ($577.90 million), W2.47 trillion ($2.29 billion) if opened 3 years ahead of schedule, and W3.30 trillion ($3.02 billion) if opened 4 years ahead of schedule. Assuming these projects were all completed in 2008, the early realization of these welfare benefits is estimated at W1.85 trillion ($1.69 billion).
The welfare effects of infrastructure PPP projects can also be seen from the perspective of net benefits. In the Republic of Korea, formal feasibility studies are conducted on candidate PPP projects to assess, among other things, their potential welfare effects, which can be calculated as net benefits. Projects that cannot deliver sufficient welfare benefits are dropped. The net benefit of PPP projects that were underway in 2012, calculated in constant prices for that year, was W2.63 trillion ($2.46 billion) (Table 8.5).
Table 8.5: Net Benefits from PPPs in the Republic of Korea, 2012
SectorNumber of
ProjectsTotal Benefit(won trillion)
Total Cost(won trillion)
Net Benefit(won trillion)
Road 18 8.79 6.36 2.42
Environment 9 1.37 1.18 0.19
Culture 2 0.72 0.62 0.10
Rail 2 2.97 3.04 –0.07
Others 2 0.90 0.92 –0.02
Total 33 14.74 12.11 2.63
PPP = public–private partnership.Note: Total Benefit is based on the project feasibility study, and is estimated as the cost or time savings once the project is implemented. The benefit users gain from the facility is one of expected benefits.Source: Korea Development Institute. 2014. Comprehensive Evaluation on Public–Private Partnership Projects in Korea. Sejong.

Realizing the Potential of PPPs to Advance Asia’s Infrastructure Development198
Enhancing Value for Money through PPPs
ADB and KDI (2011) show the results of several value-for-money tests for private financial initiatives from 66 BTO projects and 11 BTL projects during 2005–2012, valued at a combined W891 billion ($815 million). Table 8.6 shows value-for-money tests for 72 PPP projects during 2005–2012, finding that 48% of the projects provided value for money—a total W2.64 trillion ($2.42 billion).2 Table 8.7 shows value for money by sector, with railways providing by far the most value. Table 8.8 gives the estimated value for money for private financial initiative projects.
Table 8.6: Value-for-Money Results for PPP Projects in the Republic of Korea, 2005–2012
YearNumber of Tests (BTL and BTO)
Number of Projects with Positive Value
for MoneyValue for Money
(won trillion)2005 15 5 0.372006 20 15 5.212007 18 10 4.422008 35 19 7.372009 29 14 7.422010 18 4 0.922011 11 2 0.132012 4 3 0.59Total 150 72 26.44
BTL = build–transfer–lease, BTO = build–transfer–operate, PPP = public–private partnership.Source: Korea Development Institute. 2014. Comprehensive Evaluation on Public–Private Partnership Projects in Korea. Sejong.
Table 8.7: Value for Money by Sector in the Republic of Korea
SectorNumber of Tests (BTL and BTO)
Number of Projects with Positive Value
for Money
Value for Money Amount
(won trillion)Rail 22 11 13.26Road 52 31 10.45Environment 52 21 1.48Culture 11 4 0.54Port 2 1 0.53Others 11 4 0.18Total 150 72 26.44
BTL = build–transfer–lease, BTO = build-transfer-operate.Source: Korea Development Institute. 2014. Comprehensive Evaluation on Public–Private Partnership Projects in Korea. Sejong.

Delivering Economic Benefits from PPPs—The Experience of the Republic of Korea 199
Table 8.8: Estimated Value for Money for PPPs in the Republic of Korea
ItemNumber of
Projects
Value for Money Amount
(won trillion)
Ex ante VFM for PFI BTO 66 0.89
BTL 30 0.09
Total 96 0.99
Ex ante (additional) VFM for PFI alternative
BTO 66 1.55
Ex post (additional) VFM for PFI
BTO 11 0.14
BTL 84 0.17
Total 95 0.31
BTL = build–transfer–lease, BTO = build-transfer-operate, PFI = private finance initiative, PPP = public–private partnership, VFM = value for money. Source: Asian Development Bank and Korea Development Institute. 2011. Case Studies from Korea on Public–Private Partnership Infrastructure Project. Manila and Seoul.
Enhancing Efficiency by Reducing Time and Cost Overruns
Infrastructure PPP projects can score on cost and time efficiency over traditionally procured projects. PPP infrastructure projects in some advanced economies have shown they can reduce cost and time overruns compared with government-funded projects. McDonald (2002) found that traditional public procurement projects suffered cost overruns of 24%–66% and time overruns of 4%–39% during construction in the United Kingdom, but PPP projects were more efficient in both. In his sample, 78% of PPP projects were within budget, compared with 27% of government-funded projects.
Financing PPPs through the Capital Markets Several Asian countries, including the Republic of Korea, Malaysia, and Thailand, have well-developed domestic capital markets, and were early users of infrastructure and corporate bonds, and listed equities, for financing PPPs in the region. Overall, however, considerable differences exist in the depth, liquidity, and structure of capital markets among Asian countries. This section examines how the Republic of Korea has financed PPPs in the capital market.
Infrastructure bonds were not much used in the Republic of Korea during the early phase of PPPs. Out of 203 BTO projects implemented by 2009, only seven were partly financed by these bonds (Table 8.9). One reason for

Realizing the Potential of PPPs to Advance Asia’s Infrastructure Development200
their low use is the country’s practice of funding infrastructure projects in a sequence, corresponding to the progress of construction and future equity sales. Table 8.10 shows infrastructure bond issuance for PPPs during 2012–2017 when 18 bonds were issued, totaling W3 trillion ($2.81 billion). At 21.7% of the combined cost of the 18 projects, this is a significantly high level and an indication of the financial market’s recognition of the characteristics of PPP projects, such as profitability and riskiness. This clearly shows that the depth and sophistication of financial markets can affect the implementation of PPPs.
Table 8.9: Infrastructure Bond Issuance in the Republic of Korea, 2009
Item
Sector
TotalAirport Road Rail
Number of projects 2 3 2 7
Amount of bond issuance (won trillion) 0.15 1.63 1.60 3.38
Amount of issuance/total project cost (%) 74.75 35.06 35.23 ….
… = not available. Source: Asian Development Bank and Korea Development Institute. 2011. Case Studies from Korea on Public–Private Partnership Infrastructure Project. Manila and Seoul.
Table 8.10: Bond Issuance for PPP Projects in the Republic of Korea, 2012–2017
Project TypeAmount (A)
(won trillion) Issue Date
Interest Rate(%)
Total Project Cost (B)
(won trillion)A/B(%)
Road 0.13 Jun 2012 4.85 0.48 27.20
Road 0.12 Jul 2013 4.25 0.48 24.87
Road 0.06 Nov 2013 4.10 0.20 29.59
Road 0.30 Oct 2013 4.03 0.86 34.84
Rail 0.18 Jun 2014 4.30 0.96 18.62
Environment 0.02 Jul 2015 3.50 0.08 31.17
Road 0.30 Jul 2015 3.33 2.27 13.21
Road 0.11 Nov 2015 3.39 0.15 72.88
Road 0.10 Dec 2015 3.60 1.33 7.52
Logistics 0.09 Jan 2016 3.40 0.16 56.38
continued on next page

Delivering Economic Benefits from PPPs—The Experience of the Republic of Korea 201
Project TypeAmount (A)
(won trillion) Issue Date
Interest Rate(%)
Total Project Cost (B)
(won trillion)A/B(%)
Rail 0.40 Apr 2017 3.10 1.40 28.49
Rail 0.40 Apr 2017 2.77 1.04 38.42
Road 0.27 Apr 2017 3.20 0.51 52.78
Rail 0.15 Apr 2017 3.30 0.87 17.23
Road 0.14 May 2017 3.31 0.20 66.59
Sports center 0.02 Jun 2017 3.72 0.03 74.13
Road 0.14 Aug 2017 3.90 1.89 7.40
Road 0.10 Sep 2017 3.00 1.04 9.62
Source: Public and Private Infrastructure Management Center, Republic of Korea.
While it is true that PPP projects enable governments to implement social infrastructure projects despite limited financial resources, it is neither possible nor recommended to rely entirely on PPPs for infrastructure. When governments borrow to finance infrastructure through PPPs, these loans need to be paid off in the medium and long term, and governments cannot increase the amount of future liability indefinitely. Insufficient government financial resources, which often happen because of past heavy investment, can lead to a drop in public spending on infrastructure, which in turn can hurt gross domestic product growth and affect a government’s ability to repay debt. Because of infrastructure’s effect on growth, many developing countries in Asia are promoting PPPs rather than cutting infrastructure spending when financial resources are tight.
Indeed, the increased interest in PPPs for building and upgrading infrastructure puts a spotlight on the need for clear budgeting and accounting rules for PPP projects (Box 8.1). However, standards are lacking. Because of this, PPPs can be used to circumvent safety ceilings and fiscal rules on spending, thereby creating an incentive to move public investments off government balance sheets. This could include allocating spending to future budgets, thereby increasing government liabilities, and providing guarantees for private financing. Regardless of how this is done, taxpayers bear the risk of high liability in the future from these practices. Therefore, governments need to incorporate procedures in their budgeting systems to deal with these risks as they apply to PPP projects. There is no one-size-fits-all procedure for this, and procedures will need to be calibrated to specific country requirements. Governments everywhere should continuously update their
Table 8.10 continued on next page

Realizing the Potential of PPPs to Advance Asia’s Infrastructure Development202
national budgeting systems to ensure affordability, value for money, and long-term fiscal sustainability. They should also develop the process of connecting accounting and budgeting rules that affect the choice of mode of service delivery and procurement options based on value for money.
Box 8.1: Accounting Standards for Public–Private PartnershipsGovernments promote infrastructure public–private partnership (PPP) projects because they lack the resources to carry out these projects themselves, and to benefit from the creativity and efficiency of the private sector. But to what extent should PPPs replace government-funded infrastructure investments? The answer is that, in using this modality, governments must maintain fiscal stability.
This is one reason why it is important to have comprehensive accounting standards for treating PPPs in national budgets and to have comparable international statistics. But these are lacking everywhere. Even developed countries and regions, such as the European Union, do not have clear accounting standards on PPPs.
The view of Eurostat, which provides statistical information to European Union institutions, is that PPP assets should be classified outside the government sector if both of the following conditions are met: the private partner bears the construction risk, and either the availability or demand risk.
The party carrying the risk, however, is not always easy to define because types of contract design vary. In many cases, it is not possible to classify a PPP as being on or off government books. Eurostat research, in collaboration with the European PPP Expertise Centre and the European Investment Bank, underscores the need for revising these criteria to conform to international public sector accounting standards. Within the accounting profession, efforts are underway to give guidance on comprehensive standards for this, but more is needed.
Sources: Eurostat. 2009. New Developments in PPPs. Financial Accounts Working Group. Luxembourg; Jay-Hyung, Kim Jungwok Kim, Sunghwan Shin, and Seung-Yeon Lee. 2011. Public–Private Partnership Infrastructure Projects: Case Studies from the Republic of Korea. Seoul: Korea Development Institute.
Unsolicited PPP Project ProposalsUnsolicited projects are widely used in emerging economies, with the Republic of Korea having one of the world’s highest ratios of solicited to unsolicited projects. As of March 2015, 54.1% of 222 BTO projects started out as unsolicited project proposals, accounting for 58.2% of total investment in BTO projects. Table 8.11 shows the extent of the use of unsolicited project proposals in four emerging economies: Chile; the Republic of Korea; South Africa; and Taipei,China.

Delivering Economic Benefits from PPPs—The Experience of the Republic of Korea 203
Table 8.11: Unsolicited Proposals for PPP Projects in Four Emerging Economies
Economy PeriodPresented
(A)Accepted
(B)
Under Review
(C)
Acceptance Ratio
( B ) A-C
Chile March 1995–December
2006
200+ 26 38 0.16
Republic of Korea
July 1999– April 2006
141 101 7 0.75
South Africa 1999–2006 4 0 3 0.00Taipei,China March 2002–
May 2006193 29 22 0.17
PPP = public–private partnership. Sources: J. T. Hodges and G. Dellacha. 2007. Unsolicited Infrastructure Proposals: How Some Countries Introduce Competition and Transparency. Public–Private Infrastructure Advisory Facility Working Paper No. 1. Washington DC; and authors’ calculation.
Flexible and inventive project approaches are a positive side to unsolicited project proposals, and they impose less of a financial burden on ministries. Lower priority projects tend to be put forward as unsolicited proposals, as there might be fewer financial incentives for the private sector alone to implement them. Given this, governments should evaluate the importance of unsolicited proposals in terms of their national plans and priorities.
Because solicited projects take considerable time and costs to push through, unsolicited PPP proposals have been actively sought by the government in the Republic of Korea. But it still puts more effort into solicited projects because they align better to the country’s national economic plan and its priorities for infrastructure. Table 8.12 shows the acceptance ratios for unsolicited PPP project proposals from 2009 to 2016. Value-for-money tests and competitive bidding processes are applied to unsolicited project proposals, and this has resulted in getting value for money from unsolicited project proposals. In this way, the government tries to secure efficiency and fiscal soundness in PPPs from unsolicited projects.

Realizing the Potential of PPPs to Advance Asia’s Infrastructure Development204
Table 8.12: Acceptance Ratio for Unsolicited PPPs in the Republic of Korea, 2009–2016
YearPresented
(A)Accepted
(B)
Under Review
(C)
Acceptance Ratio
( B ) A-C
2009 35 13 0 0.371
2010 18 6 0 0.330
2011 15 5 0 0.330
2012 14 5 0 0.357
2013 19 6 0 0.316
2014 8 3 0 0.375
2015 14 4 6 0.500
2016 24 0 21 0.000
Total 147 42 27 0.350
PPP = public–private partnership. Source: Authors’ calculation based on data from the Public and Private Infrastructure Investment Management Center, Republic of Korea.
The expectation that new PPP projects will continually come on stream has helped maintain private sector interest in infrastructure projects and programs in the Republic of Korea. Even so, the government still lacks the technical and financial capacities to manage projects that started out as unsolicited proposals. Because these projects can encourage innovation in the private sector, the lesson for developing Asia from the Republic of Korea’s experience in dealing with unsolicited project proposals is that countries need to build this capacity in their agencies working on PPPs.
Governance Issues Affecting PPP ProcessesGood governance is needed for all phases of a PPP project’s life cycle, and its lack in any one of these phases may result in a project failing. Figure 8.2 shows the major steps for the governance of PPPs at key project phases. The following section briefly looks at how governance issues affected a couple of high-profile infrastructure PPPs in the Republic of Korea at certain project phases.

Delivering Economic Benefits from PPPs—The Experience of the Republic of Korea 205
Figure 8.2: Major Governance Issues for PPPs
Project Phase
Project preparation
Tendering process
Contract award
Construction
Operation and management
Governance
Evaluation
Negotiation
Land acquisition,construction, management
Dispute resolution
Supervision, renegotiation/
refinancing
Feasibility studyValue-for-money test
PPP = public–private partnership.Source: Authors.
Project Preparation
In preparing a PPP project, the public sector identifies and appraises candidate projects through, among other things, feasibility studies and value-for-money tests. A notable feature of the early years of PPPs in the Republic of Korea was the absence of these mechanisms, and this has also affected some recent projects. Demand and revenue of the Incheon International Airport Railway Project, completed in 2007, were overestimated in the preparation phase because no value-for-money test was done. This case underscores the importance of having governance mechanisms in place at the pre-tender stage and having the capacity to implement them.
Tendering and Contract Award
PPPs require clear and transparent procurement measures, and independent experts who can appraise the value and quality of bids. And, because PPP contracts are complex, managing PPP agreements requires a high level of expertise. Poorly defined project terms or an unqualified private partner can prolong negotiations before a contract award can be made or result in no agreement being reached. A case in point is the Hwado–Yangpyeong Expressway Project, which failed to reach final agreement after 8 months of negotiations because of concerns over the financial soundness of the private partner even though this party was selected as the preferred bidder. The lesson here is that the right criteria must be used to select a preferred bidder

Realizing the Potential of PPPs to Advance Asia’s Infrastructure Development206
in a trustworthy procurement system. Assistance to build the capabilities to do this can be provided by legal and accounting professionals in the private sector or from multilateral development banks.
Operation and Management: Settling PPP Disputes
Because of the complexity of PPP projects and the way risk is allocated, disputes among stakeholders are frequent. KDI (2014), in a survey, found 69% of PPP stakeholders in the Republic of Korea experienced disputes and that these took a long time to resolve. Table 8.13 shows dispute resolution periods for PPPs in three infrastructure sectors in 2014.
Table 8.13: Average Dispute Resolution Periods for PPPs in the Republic of Korea, 2014
Sector Under 3 Months
3–6 Months
6–2 Months
1–2 Years 2 Years Total
Environment 25.0 25.0 0.0 50.0 0.0 100.0
Road 50.0 0.0 50.0 0.0 0.0 100.0
Harbor 0.0 0.0 33.3 0.0 66.7 100.0
Total 22.2 11.1 22.2 22.2 22.2 100.0
PPP = public–private partnership.Source: Korea Development Institute. 2015. Collection of Education Material for Public–Private Partnerships. Vol. 6. Sejong.
There are essentially four ways of resolving a PPP dispute—negotiation, mediation, arbitration, and court adjudication—and each has its own characteristics (Table 8.14).

Delivering Economic Benefits from PPPs—The Experience of the Republic of Korea 207
Table 8.14: Dispute Resolution Processes
Feature Negotiation Mediation ArbitrationCourt
Adjudication
Voluntary/ involuntary
Voluntary Voluntary Voluntary Compulsory
Third party engagement
No Mediator Agent Judge
Degree of formality
No restriction No restriction By processes and standards
determined by consent
among involved parties
Under legal enforcement
Nature of proceeding
Unlimited submission of
evidence
Unlimited submission of
evidence
Prove claim from each
party
Prove claim from each
party
Outcome Consensus Consensus Award Court ruling
Binding Settlement by contract
Settlement by contract
Executive force
Executive force
Private/public process
Private Private Private (and public if needed)
Public
Source: Korea Development Institute. 2015. Collection of Education Material for Public–Private Partnerships. Vol. 6. Sejong.
Negotiation. This is the most common form of dispute resolution of the four methods. It has the benefit of costing less than the others, it can prevent sensitive information from getting out, and amicable relationships between PPP partners have a better chance of being maintained than in the other methods.
Mediation. Mediators use diverse techniques to help disputing parties find an optimal solution in a dispute, but they have no decision-making authority. For mediation to work, mediators must be seen by both parties as fair and neutral.
Arbitration. This is a method for resolving a dispute without going to court. Opposing parties refer their dispute for arbitration and agree to be bound by the arbitration decision, which is binding on the parties. An arbitration ruling impedes the right of access to court adjudication.

Realizing the Potential of PPPs to Advance Asia’s Infrastructure Development208
Court adjudication. This tends to incur considerable costs and time before a ruling is made, and—an additional drawback—a ruling can be made regardless of field of expertise.
PPP disputes have multiple causes, including how laws and regulations affecting partnerships are interpreted, financing arrangements, and which technologies are used in a project. Figure 8.3 shows that voluntary dispute resolution methods rather than going to court are preferred in the Republic of Korea when the amounts involved are relatively small.
Figure 8.3: Performance of PPP Dispute Mediation in the Republic of Korea
52.3
16.6
0.43 1.2 3.44.3
-10
0
10
20
30
40
50
60
2011 2012 2013 2014 2015 2016
Fail on mediation Completion of mediation
PPP = public–private partnership. Source: Public and Private Infrastructure Investment Management Center, Republic of Korea.
The Republic of Korea’s experience in resolving PPP disputes offers useful pointers for countries working to improve their dispute resolution methods. Because settlements in negotiation, mediation, and arbitration processes are not binding, PPP disputes tend not to be resolved through those channels in the Republic of Korea. Because a dispute between public and private sectors is basically a zero-sum game, it is seldom possible to satisfy both parties through these resolution methods. For negotiation and mediation, a consensus on how to solve a dispute is needed among the parties, but getting one is often difficult. For arbitration, an unsatisfied party can ignore the decision and opt to go to court to resolve the dispute. As a result, many PPP disputes in the Republic of Korea end up in court, although smaller disputes, as earlier noted, often get settled out of court using one of the other three methods. Since 2012, the Dispute Mediation Committee, which is under the Ministry of Economy and Finance, has heard seven PPP cases, with four of them each involving less than W4.37 billion ($4 million) and being resolved outside court.

Delivering Economic Benefits from PPPs—The Experience of the Republic of Korea 209
Legal and Institutional Frameworks for PPPsThe Republic of Korea’s effective legal and institutional frameworks, coupled with its well-developed financial markets, are recognized as the main drivers of the country’s economic growth (Kim et al. 2011). The legal framework for PPPs was established by the Public–Private Partnerships in Infrastructure Act of 1994 to tackle a shortage of roads, railways, airports, and other infrastructure. The government, at that time, recognized that the private sector had to be co-opted to help develop the country’s infrastructure. The legal framework defines the eligible infrastructure for these partnerships, procurement types and processes, the roles of the parties, policy support, project implementation procedures, regulations for financing and refinancing projects, and risk management mechanisms. An important aspect of the institutional setting for PPPs is that the roles of government agencies involved in the procurement of these projects are clearly identified and set out in laws, regulations, and guidelines.
Strong legal frameworks and institutional settings are crucial to the success of PPPs and their ability to contribute to economic growth and social development.3 These make it easier to carry out complex and long-term projects, reduce transaction costs, ensure regulatory controls, and provide legal and economic mechanisms to resolve contract disputes. Most developing countries in Asia experience difficulties in implementing PPPs because of a lack of capacity to handle these types of projects in the public sector. Typical problems include (i) poor project selection and preparation, which deters investors; (ii) overlaps in newly introduced regulatory frameworks for PPPs with existing regulations, which also deal with the construction of infrastructure facilities; (iii) implementation delays, especially in land acquisitions; (iv) unfamiliarity of local governments with PPP mechanisms; and (v) lack of coordination between central and local governments on PPP projects.
Based on the Republic of Korea’s experience, the following suggestions are offered to developing countries in Asia for tackling these problems. First, clear institutional frameworks for PPPs need to be set up. In many countries, numerous agencies play big roles in implementing PPP projects, but there is often a lack of coordination among them. Potential investors, for their part, prefer a one-stop service covering all phases of a project’s planning, construction, operation, and monitoring to reduce costs and time incurred by regulatory and administrative processes from numerous agencies handling PPPs. The solution is a dedicated public sector PPP unit. Both the Asia-Pacific Economic Cooperation and the Organisation for Economic Co-operation and Development underscore the importance of these units for establishing robust quantitative and qualitative methods to identify and assess potential

Realizing the Potential of PPPs to Advance Asia’s Infrastructure Development210
PPP projects (APEC 2008; OECD 2010). In the Republic of Korea, the Public and Private Infrastructure Investment Management Center, an independent organization, conducts policy and strategy research on PPPs; provides technical support to the Ministry of Economy and Finance, which develops and implements PPP policies; promotes PPP projects to foreign investors; and develops education programs on PPP systems.
Second, sound legal systems are needed for carrying out PPP projects. It is crucial to have a solid regulatory system in a legal framework. It may be better to have a single piece of legislation—a PPP act—that covers all aspects of implementing and operating PPP projects, rather than this being fragmented and spread across various laws and regulations. PPP acts should specify the responsibilities of all key participants in a PPP and the rules for their participation. A sound legal framework for PPPs can provide stability during administration changes, which will boost the private sector’s confidence in government PPP plans. PPP acts should specify the responsibilities of all key participants in a PPP and the rules for their participation.
While drawing up a legal framework for PPPs, detailed guidelines need to be legislated. In the Republic of Korea, these guidelines are set out in the Public–Private Partnerships in Infrastructure Act and the Public and Private Infrastructure Investment Management Center’s 13 guidelines that cover sectors and PPP methods. These include guidelines on conducting feasibility tests on BTO and BTL projects, refinancing projects, and for the environment sector and road infrastructure. Transparency, objectivity, and consistency are vital in the formulation of these guidelines, which can be used for the entire life cycle of a PPP project. These guidelines are especially important for giving private investors a clear understanding of their responsibilities as partners in government projects. Beyond their current application, these guidelines could also cover value-for-money, drawing up requests for project proposals, output specifications, and tender evaluations.
Third, government guarantees to provide private partners with appropriate profits and to share risks can be effective in getting PPP projects off the ground. Revenue guarantees sweeten the risk sharing and have proved to be effective in attracting private partners. But long-term revenue guarantees carry fiscal risks and need to be set cautiously. In the Republic of Korea, transport PPP projects largely relied on minimum revenue guarantees, but these became a heavy fiscal burden and were aggravated by overly optimistic demand forecasts. These guarantees were dropped for PPPs in 2009, leaving, in 2011, guarantees totaling W3.15 trillion ($2.9 billion) for 36 PPP projects. When the scheme was ended, private sector participation in transport infrastructure significantly declined.
Delivering Economic Benefits from PPPs—The Experience of the Republic of Korea 211
ConclusionThe Republic of Korea’s experience in PPPs has largely been a success story. The use of PPPs for infrastructure since the mid-1990s has delivered significant positive economic and social benefits through the channels of capital inflows, increasing social welfare benefits and better delivery of services, and reducing fiscal burdens through better value for money. That said, there have been bumps along the way, such as the impact on transport PPPs from scrapping government minimum revenue guarantees, as discussed earlier.
As a fiscal stimulus measure, PPPs have been shown to have had only a limited effect. Many countries, including France, the Republic of Korea, and Thailand, promoted PPPs for fiscal stimulus to help recover from the 2008 global financial crisis. But research shows this can crowd out public investment and because PPP investments tend to just replace government spending, they offer very little—if any—fiscal stimulus.
The Republic of Korea’s experience with PPPs highlights several challenges in using this financing modality for infrastructure. Because supporting private investment in infrastructure requires the government to borrow money from future budgets, PPPs are inevitably a challenge for fiscal management. There is also an inherent tension in PPP agendas. The Republic of Korea initially put a high priority on promoting a PPP market, but later shifted its focus to fiscal discipline—and the government is having a hard time reinvigorating the PPP market.
Another challenge has been setting tariffs on PPP infrastructure projects. Tariffs for transport infrastructure, for example, tend to be higher for government-funded transport projects than in other sectors, since there needs to be sufficient incentives for the private sector to get involved. Users may bear a bigger share of a transport project’s life-cycle cost than for purely government-funded infrastructure projects.
And at the end of the day, PPPs are not a must-have solution but an option for building and upgrading infrastructure. The reason they are being promoted is because they can mobilize needed resources from the private sector, maximize value for money, bring creativity and efficiency to a project, and be a source of fiscal stimulus. That said, countries should be clear on why they are promoting the PPP modality for infrastructure.

Realizing the Potential of PPPs to Advance Asia’s Infrastructure Development212
Notes1. The Korea Development Institute is the largest economic policy research institute in the
Republic of Korea. 2. Value-for-money is computed as the difference between the expected fiscal burden of
government-funded projects and PPP projects. PPPs are preferred when value-for-money is positive because they incur less fiscal burden.
3. As the European Commission puts it, “It is essential for governments to develop clear legal and regulatory formats that identify the various steps in the process, together with rights and obligations of all involved” (European Commission 2003).

Delivering Economic Benefits from PPPs—The Experience of the Republic of Korea 213
References
ADB (Asian Development Bank) and KDI (Korea Development Institute). 2011. Public–Private Partnership Infrastructure Projects: Case Studies from the Republic of Korea. Manila and Seoul.
APEC (Asia–Pacific Economic Cooperation). 2008. Joint Ministerial Statement. 15th Finance Ministers’ Meeting. Peru.
Campos, Javier, Antonio Estache, Noelia Martin, and Lourdes Trujillo. 2003. Macroeconomic Effects of Private Sector Participation in Infrastructure. Washington, DC: World Bank.
European Commission. 2003. Guidelines for Successful Public–Private Partnerships. Brussels.
Eurostat. 2009. New Developments in PPPs. Financial Accounts Working Group. Luxembourg.
Hodges, John T. and Georgina Dellacha. 2007. Unsolicited Infrastructure Proposals: How Some Countries Introduce Competition and Transparency. PPIAF Working Paper No. 1. Nairobi: Public–Private Infrastructure Advisory Facility.
KDI (Korea Development Institute). 2014. Comprehensive Evaluation on Public–Private Partnership Projects in Korea. Sejong: KDI.
———. 2015. Collection of Education Material for Public–Private Partnership. Vol. 6. Sejong.
Kim, Jay-Hyung, Jungwook Kim, Sunghwan Shin, and Seung-Yeon Lee. 2011. Public–Private Partnership Infrastructure Projects: Case Studies from the Republic of Korea. Seoul: KDI.
Lee, Hangyong and Chang-Yong Rhee. 2007. Private Participation in Infrastructure and Macroeconomy: The Experience of Korea. Seoul: KDI.
McDonald, Mott. 2002. Review of Large Public Procurement in the UK: The Mott McDonald Report. Sydney: Infrastructure Australia.
OECD (Organisation for Economic Co-operation and Development). 2010. Dedicated Public–Private Partnership Units. Paris: OECD.


CHAPTER 9
Public–Private Partnerships versus Traditional Procurement: A Comparison of Financing Modalities in the Republic of Korea
Hojun Lee and Kiwan Kim
IntroductionThe Republic of Korea is well known for achieving, in a short time, substantial success in using public–private partnerships (PPPs) as a mode of infrastructure financing. The PPP system was rapidly promoted when the national treasury nearly went bankrupt after the Asian financial crisis. Given big constraints to the country’s infrastructure budget, the emphasis on PPPs during the crisis was to push through as many PPP projects as possible. Since then, the government has made a big effort to promote PPPs to relieve the financial burden on social infrastructure funding and to tap the private sector’s creativeness and efficiency for these partnerships.
Despite the rapid promotion of the PPP system, there has been no study examining the theoretical basis or empirical evidence on whether and how PPPs in the Republic of Korea are making public investments more efficient than traditional procurement. This chapter aims to help fill that gap by analyzing and comparing the country’s experience in financing public infrastructure through PPPs and traditional procurement to examine whether these partnerships have developed as they were originally intended, and whether they are moving in the right direction without causing negative side effects.
This chapter begins with a brief look at the basic structure of a typical PPP project in the Republic of Korea. We then review models of typical PPP structures based on Hart (2003) and Iossa and Martimort (2015), and examine from a social welfare perspective what aspects of PPPs can bring efficiency gains. For this, we use PPP models that have been revised to reflect the Republic of Korea’s actual situation and compare them with an ideal PPP system to show the gap between the two. We examine whether the results from our theoretical models can be validated by actual data of 33 PPP road projects in the country. We close with a discussion on the policy implications of this chapter and how the Republic of Korea can overcome the limits of its own PPP system.

Realizing the Potential of PPPs to Advance Asia’s Infrastructure Development216
Basic Structure of a PPP in the Republic of KoreaA special purpose vehicle (SPV), a legal entity that acts as the concessionaire, needs to be established to implement a PPP project in the Republic of Korea. SPVs are generally made up of construction companies, financial investors, and professional operators who recover their investment from profits on construction, dividends, or interest payments. After being set up, an SPV needs authorization from the competent authority—the procurement agency—to initiate a design–build–finance–operate process.
In a traditional procurement, the competent authority selects a private firm to design and build a project. After financing the project, the government can either manage and operate the facility itself or select an operator to do this. In a PPP project, the whole implementation process is granted to a single entity. Figure 9.1 shows a typical PPP structure in the Republic of Korea. The competent authority can be a public sector entity, such as a local government or line ministry responsible for implementing a PPP project. It should consider, among other things, the feasibility of proposed projects and their consistency with long-term policy directions.
Figure 9.1: Basic Structure of a PPP in the Republic of Korea
Professional operator(maintenance, operation)
Competent authority
Financial
Equity
Equity
Construction
Operation rights
Dividend/interest payment
Equity/loan
SPV Construction company
Operating companyFinancial Institution
Grants operational rights
Transfers the ownership
of the facility
Construction company
(design, build)
SPV = special purpose vehicle.
Source: Korea Development Institute, Private Infrastructure Investment Management Center.
Among eligible PPP procurement methods, the build-transfer-operate (BTO) and build–transfer–lease (BTL) methods are the most frequently chosen in the Republic of Korea. When the construction phase of a PPP project is completed, its ownership is transferred to the government for both

PPPs versus Traditional Procurement—Financing Modalities in the Republic of Korea 217
BTOs and BTLs. The big difference between these two methods is how SPVs recover their investment. In BTO projects, SPVs directly collect user fees, as in the case of toll roads. In BTL projects, concessionaires operate a facility and receive government payments; these include a lease payment and operation costs for a fixed period. BTLs are frequently used for PPPs for schools and other education facilities.
The PPP system is characterized by its procurement procedures in which design, building, financing, and operating tasks are bundled, and the SPV decides how to maximize the benefit to shareholders. In a traditional procurement, these tasks are dealt with by private contractors under the concession of a government procurement agency.
Theoretical Model of Procurement Contracts1 Here, we examine the characteristics of a PPP project with the theoretical models reflecting the basic structure of a PPP in the Republic of Korea, as just discussed. We consider a principal–agent model in which a principal and an agent are risk-neutral to enable us to investigate the source of efficiencies in PPP projects.
Benchmark Model and the First Best Result
Consider a government (G) implements an infrastructure project which consists of design, build, and operate procedures. For the benchmark model, we assume that private construction company (C) oversees the design and construction of a facility, and a private operating company (O) oversees the operation. We assume the discount rate is 0 in the model. The economic benefit of the infrastructure project, B, is affected by C’s effort during the construction period, e, which is the private information of C. B is observable by both G and C after it is realized at the end of operation period, but it is noncontractible. Thus, we assume that G can only prove whether B is greater than criterion B0, not the exact amount of B. The nonverification assumption is to reflect common practice in the real world where the exact amount of a project’s benefit cannot be measured. Only the quality of the infrastructure is assessed by various objective criteria.2 Thus, the amount of B is determined as follows: the effort, e, incurs the disutility, to C.
B = B0 + e + ε, ε~N(0, σ2). (1)
The construction cost (CC) is affected by , the effort of C to lower the cost with the quality retained. CC is also affected by the level of effort, e, to increase the quality of the infrastructure, and the disutility, 2( ), is incurred
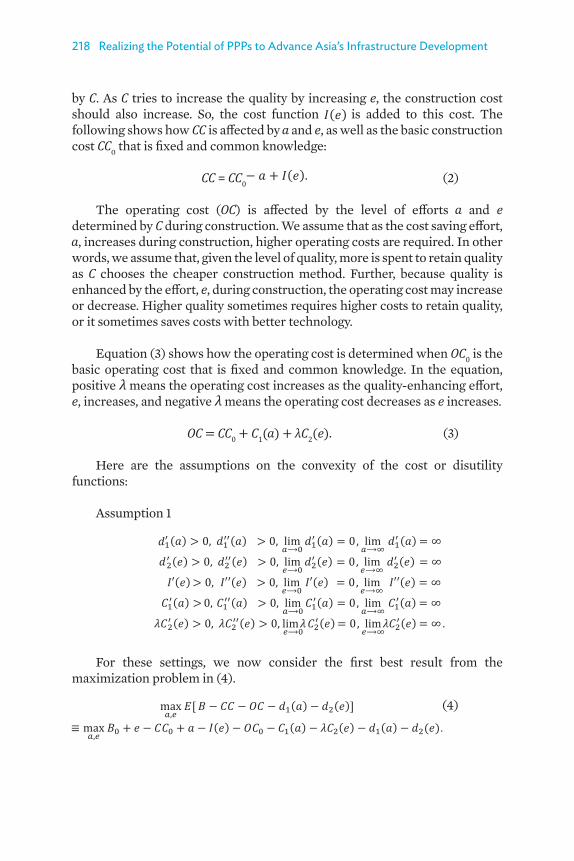
Realizing the Potential of PPPs to Advance Asia’s Infrastructure Development218
by C. As C tries to increase the quality by increasing e, the construction cost should also increase. So, the cost function is added to this cost. The following shows how CC is affected by and e, as well as the basic construction cost CC0 that is fixed and common knowledge:
CC = CC0 (2)
The operating cost (OC) is affected by the level of efforts and e determined by C during construction. We assume that as the cost saving effort,
, increases during construction, higher operating costs are required. In other words, we assume that, given the level of quality, more is spent to retain quality as C chooses the cheaper construction method. Further, because quality is enhanced by the effort, e, during construction, the operating cost may increase or decrease. Higher quality sometimes requires higher costs to retain quality, or it sometimes saves costs with better technology.
Equation (3) shows how the operating cost is determined when OC0 is the basic operating cost that is fixed and common knowledge. In the equation, positive means the operating cost increases as the quality-enhancing effort, e, increases, and negative means the operating cost decreases as e increases.
OC = CC0 + C1( ) + λC2(e). (3)
Here are the assumptions on the convexity of the cost or disutility functions:
Assumption 1
For these settings, we now consider the first best result from the maximization problem in (4).
(4)

PPPs versus Traditional Procurement—Financing Modalities in the Republic of Korea 219
Just like the central planner’s problem, the objective function includes the social benefit of the infrastructure, B, and the social costs, CC, OC, , and
. Under Assumption 1, the objective function of the problem is concave, so we can find the optimal solution by deriving the first-order conditions:
(5)
(6)
Equations (5) and (6) show the first-order conditions for and e. Equation (5) implies the marginal costs of decreasing CC should be the same as the marginal benefit of decreasing CC. When C increases the effort, , both the disutility of C and the operating cost increase. Thus, the marginal social cost that includes the marginal OC and the marginal disutility of C (the left side of the equation) should be the same as the marginal benefit, which is 1, in social optimum.
Equation (6) implies the marginal cost of increasing the social benefit, B, should be the same as its marginal benefit. As the quality enhancing effort, e, increases, the social costs, including CC, OC, and the disutility of O, increase. In social optimum, the marginal social cost of enhancing the quality should be the same as its marginal benefit. In reality, however, we cannot achieve the first best result because of the conflict of interests among G, C, and O.
Traditional Procurement
Here, we study a typical traditional procurement mechanism, and derive the equilibrium to compare it with the equilibrium under a PPP. Let be the amount of transfer from G to C if B is greater than or equal to . Equation (7) is the maximization problem of C to determine the amount of and :
(7)
By Assumption 1, the objective function of equation (7) is concave, so that we can derive the optimal level of C’s effort by the first-order conditions. The conditions are:
(8)
(9)
Equation (8) shows how agent C decides the level of effort to decrease CC. As increases by one unit, C can save CC by one unit. Thus, C’s marginal benefit of increasing is one, which is the right side of the equation. The left side,
Realizing the Potential of PPPs to Advance Asia’s Infrastructure Development220
, implies C’s marginal cost of increasing . As increases, OC increases by C but C does not care about the changes in OC—that is the burden of operator O, which makes equation (8) different from (5). For maximizing social welfare, the marginal cost of C1 should be considered while C does not care about the cost in a traditional procurement contract, where OC is not covered by C. Therefore, the optimal level of of C under traditional procurement,
, is greater than the first best level, .
Proposition 1: The effort to lower construction costs under traditional procurement ( ) is greater than the first best level of the effort; that is,
.
Equation (9) shows how agent C decides the level of effort to increase the benefit of the infrastructure. By increasing by one unit, the benefit of the infrastructure increases by one unit. However, C only gets the fixed amount of compensation, , regardless of the amount of B if it is greater than B0. Because C covers the cost of e, , but does not get any benefit from it, C will choose zero effort, thus, , which is obviously less than the socially optimal level, .
Proposition 2: The effort to increase the benefit of the infrastructure under traditional procurement is zero, which is less than the first best level of the effort; that is, .
As shown in Proposition 2, C chooses a lesser level of effort under traditional procurement. Because C only cares about profit, which excludes operating costs and the benefit of infrastructure, C chooses different effort levels, and , from socially optimal levels and , which means there is some inefficiency in a traditional procurement. In sum, the effort to lower construction costs is overachieved, while the effort to increase infrastructure quality is underachieved.
Public–Private Partnerships
In a typical BTO project, private party (P) gets revenue from the user fee, with the revenue amount depending on the number of users, , of the facility under a certain user-fee level. Assuming the user fee is fixed at , then the amount of P’s revenue is a linear function of . We also assume that is affected by , P’s effort to increase the benefit of the infrastructure, as follows:
Assumption 2

PPPs versus Traditional Procurement—Financing Modalities in the Republic of Korea 221
Assumption 2 implies the concavity of the function in terms of e. Because P oversees both construction and operation, P chooses and e considering P’s revenue, construction and operating costs, and disutilities from the effort. We can then write P’s maximization problem as follows:
(10)
It can, therefore, be assumed that the objective function of equation (10) is concave by Assumptions 1 and 2, so that we can find the optimal effort levels by the first-order conditions:
(11)
(12)
We now compare the conditions with the first best and traditional procurement results. We find that equation (11) is the same as equation (5), which means the level of effort to lower construction costs is the same as the first best level. We can therefore achieve the first best level of under a PPP contract, while this is overachieved in a traditional procurement. Because the private partner cares about both construction and operating costs, P’s operating cost increases by as P decreases the construction cost by one unit under a PPP. The construction company, for its part, does not care about the operating cost increase under a traditional procurement, which is why the optimal effort under a PPP project is less than for a traditional procurement.
Proposition 3: The effort to lower construction costs under a traditional procurement is the same as the first best level of the effort; that is, .
The left side of equation (12) is the same as that of the first best condition in equation (6). Thus, if the right side, , is equal to 1, the first best-effort
level can be achieved. If , the optimal effort level, , is less than , and if
, is greater than . In any case, is always positive, which means
it is greater than 0, and this is the effort level under a traditional procurement. Therefore, we can say that the quality-enhancing effort under a PPP project is greater than for a traditional procurement.
Proposition 4: The effort to increase infrastructure quality under a PPP ( ) contract is greater than for traditional procurement; that is, .
As we observed from the comparison of the theoretical models, PPPs lead to more efficient results than traditional procurements mainly because private partners choose their levels of effort. They consider both construction

Realizing the Potential of PPPs to Advance Asia’s Infrastructure Development222
and operating costs under a PPP contract, while the construction company considers only construction costs, not operating costs. So, in the model, the main source of efficiency comes from the bundling effects of PPP contracts. We now examine PPP projects in the Republic Korea to see whether there are bundling effects that can improve the efficiency of PPP procurement contracts.
Empirical Analysis of PPP Projects In principle, the structure of a PPP procurement in the Republic Korea is similar to the general PPP schemes discussed earlier. As Figure 9.2 shows, an SPV builds an infrastructure facility using private capital and transfers it to the competent authority; in return, it gets the operation and management right for a predetermined period. The SPV makes a legal agreement with the competent authority, which sets the terms of PPP contracts. The SPV tends to have specific relations with diverse partners or it sources out certain activities to external entities, such as construction companies, operation and maintenance companies, and financial investors. An SPV for a PPP project may often have various partners.
In the Republic Korea, major PPP projects come under the supervision of the Ministry of Economy and Finance and the Public–Private Partnership Review Committee. This is chaired by the Ministry of Economy and Finance, and is made up of officials and private sector experts. The Public and Private Infrastructure Investment Management Center of the Korea Development Institute supports the PPP activities of the ministry and the committee. The center, among other things, provides technical assistance to competent authorities, so that PPPs can be planned and implemented in alignment with the public interest.
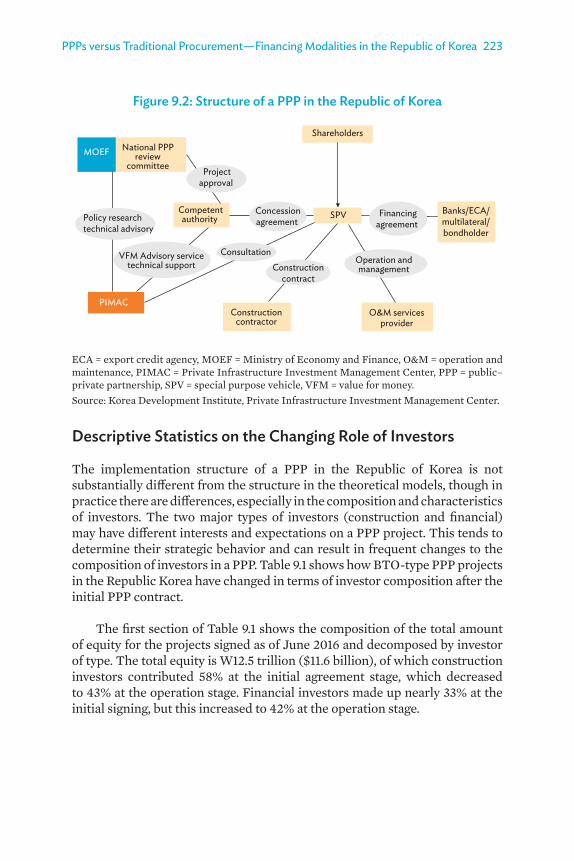
PPPs versus Traditional Procurement—Financing Modalities in the Republic of Korea 223
Figure 9.2: Structure of a PPP in the Republic of Korea
Shareholders
SPV
PIMAC
Competentauthority
MOEF
Projectapproval
Policy researchtechnical advisory
ConsultationConstruction
contract
Concessionagreement
Financingagreement
National PPP review
committee
O&M services provider
Banks/ECA/multilateral/bondholder
Constructioncontractor
VFM Advisory service technical support Operation and
management
ECA = export credit agency, MOEF = Ministry of Economy and Finance, O&M = operation and maintenance, PIMAC = Private Infrastructure Investment Management Center, PPP = public–private partnership, SPV = special purpose vehicle, VFM = value for money. Source: Korea Development Institute, Private Infrastructure Investment Management Center.
Descriptive Statistics on the Changing Role of Investors
The implementation structure of a PPP in the Republic of Korea is not substantially different from the structure in the theoretical models, though in practice there are differences, especially in the composition and characteristics of investors. The two major types of investors (construction and financial) may have different interests and expectations on a PPP project. This tends to determine their strategic behavior and can result in frequent changes to the composition of investors in a PPP. Table 9.1 shows how BTO-type PPP projects in the Republic Korea have changed in terms of investor composition after the initial PPP contract.
The first section of Table 9.1 shows the composition of the total amount of equity for the projects signed as of June 2016 and decomposed by investor of type. The total equity is W12.5 trillion ($11.6 billion), of which construction investors contributed 58% at the initial agreement stage, which decreased to 43% at the operation stage. Financial investors made up nearly 33% at the initial signing, but this increased to 42% at the operation stage.

Realizing the Potential of PPPs to Advance Asia’s Infrastructure Development224
Table 9.1: Composition of Investors in Build-Transfer-Operate PPP Projects in the Republic of Korea
(won billion)
Investor Type Initial Signing
Approval of Implementation
Design Construction Operation PPP projects with an initial signed contract
CIs 7,241 6,236 6,226 4,01157.69% 55.73% 51.43% 43.33%
FIs 4,133 3,555 4,564 3,87132.92% 31.88% 37.77% 41.81%
O&M 950 1,061 1,060 1,1697.66% 9.55% 8.88% 12.63%
Others 230 339 257 2071.83% 3.03% 2.13% 2.23%
Subtotal 12,554 11,191 12,107 9,258 Without the distressed projects due to the global recessiona
CIs 6,739 6,012 5,995 4,01164.94% 61.47% 57.16% 43.33%
FIs 2,525 2,426 3,230 3,87124.33% 24.81% 30.80% 41.81%
O&M 884 1,003 1,005 1,1698.52% 10.25% 9.58% 12.63%
Others 230 339 257 2072.22% 3.47% 2.45% 2.23%
Subtotal 10,377 9,779 10,487 9,258PPP projects in operation as of June 2016
CIs 6,351 5,843 5,827 4,01168.98% 64.03% 59.29% 43.33%
FIs 1,855 1,984 2,786 3,87120.14% 21.73% 28.35% 41.81%
O&M 774 963 961 1,1698.41% 10.55% 9.77% 12.63%
Others 227 336 255 2072.47% 3.68% 2.59% 2.23%
Subtotal 9,207 9,126 9,828 9,258
CI = construction investor, FI = financial investor, O&M = operation and maintenance, PPP = public–private partnership. Note: $1 = W1,076 in January 2018. a Nine projects were excluded: Sangju–Yeongchon Highway, Pusan New Port Second Road, Anyang–Seongnam Highway, Bibong–Maesong Highway, Oksan–Ochang Highway, Incheon–Gimpo Highway, Gwangju–Wonju Highway, Guri–Pocheon Highway, and Suwon–Gwangmyung Highway.
Source: Korea Development Institute, Private Infrastructure Investment Management Center.

PPPs versus Traditional Procurement—Financing Modalities in the Republic of Korea 225
The table’s second section examines the same statistics as the first section, excluding the delayed nine PPP projects that failed to raise capital because of the global recession in 2008. These projects were left out because they could not be considered to be operating normally. Here, the share of construction investors decreased from 65% at the time of initial signing to 43% at the operation stage, while the financial investors increased their share from 24% to 42% between the two project stages.
The table’s third section shows the same result as the second section, though calculated only for the projects in operation. The result emphasizes the same trend more dramatically: construction investors contributed up to 70% of total capital, but their share fell to 43% when projects went into operation, whereas financial investors more than doubled their share from an initial 20% to 42% at the operation stage. This tendency—construction investors tend to raise most capital at the time of initial signing, but the major function of raising capital is transferred to financial investors as projects go into operation—is a prevailing characteristic of the Republic of Korea’s PPP market and distinguishes it from other major countries with viable PPP markets.3
Two factors may be relevant to the emergence of this trend in the Republic Korea. The first is the more active role of construction investors in the take-off phase of the country’s PPP market. After the Asian financial crisis, the government promoted PPPs to complement the limited fiscal room for infrastructure investment. At that time, however, PPPs were little understood, and the country’s financial markets were not ready for this type of investment. Large construction companies with sufficient capital initiated PPPs to participate in large government construction contracts, rather than to seek returns from a particular project. In countries with developed PPP markets, these projects are often designed and implemented by developers, but this has never been widely practiced in the Republic of Korea.
The second factor is the conservative investment stance of the country’s financial institutions. Because PPP projects often come with considerable risk, financial investors planning on participating in a PPP must conduct a project risk analysis and hedge against perceived risks before they can invest in a project. The country’s financial institutions, however, have avoided investing in the early stage of PPP projects, preferring instead to come in at the postconstruction stage, where project risks have been, for the most part, eliminated. Financial institutions also tend to require substantial collateral from SPVs for loan approvals. This has considerably hampered the participation of developers, who have less capital room compared with large construction investors. On the other side, financial institutions have provided SPVs in which they participated as equity holders with subordinated loans

Realizing the Potential of PPPs to Advance Asia’s Infrastructure Development226
with high interest rates. This has made it possible for construction investors to enjoy decent returns, even though they began investing at later stages with substantially less risk.
Modified Theoretical Models Considering the Characteristics of PPPs
Here, we modify the previous theoretical model to reflect the characteristics of a PPP in the Republic of Korea. Let be the amount that a financial investor pays the construction investor when it takes over the project after the completion of construction. Usually a financial investor takes over a project after a couple of years of operation, and is determined by the number of users during the initial operation years, as well as the bargaining powers of both parties. Suppose a construction investor knows the bargaining powers of each side and the function of when the investor determines effort levels and . The following is the construction investor’s maximization problem:
(13)
Let us assume that is a linear function of the number of users Then, the optimal effort levels can be derived by the following first-order conditions:
(14)
. (15)
Equation (14) is the same as equation (8), which is the first-order condition under a traditional procurement. This means the level of effort to decrease construction costs under a PPP is the same as that for a traditional procurement, and greater than the first best level. Even for PPP contracts, a construction investor will sell a project and not care about the operation cost, thus choosing the effort level without considering the operating cost.
Proposition 5: The effort to lower construction costs in a PPP contract is greater than the first best level of the effort; that is, .
The left side of equation (15) is the same as equation (9), while the right side is different. This means that, as the right side comes closer to 0, the quality-enhancing effort level of a PPP comes closer to a traditional procurement. If is not sensitive to the effort level or is not sensitive to , then the effort level is close to zero. Therefore, under certain conditions, the effort levels chosen by a construction investor is the same as for a traditional procurement.

PPPs versus Traditional Procurement—Financing Modalities in the Republic of Korea 227
Proposition 6: If is not affected by e, or is not affected by , then the effort level under a PPP contract is zero; that is, .
Propositions 5 and 6 show that PPP contracts do not guarantee efficiency improvements and under some conditions, we do not achieve it. Therefore, introducing a PPP system is not enough to enhance procurement efficiency, and bundling contract effects should lead efficiency improvements under a PPP system.
Empirical Analysis of Investor Composition on Project Performance
Here, we examine whether the theoretical model modified on the basis of the Republic of Korea’s PPP system is well in line with the real statistics on PPP projects. For this, we constructed a small sample of PPP projects using the InfraInfo database, which is constructed and managed by the Ministry of Economy and Finance and the Public and Private Infrastructure Investment Management Center. To control the different properties of each project as far as possible, we chose 33 road PPP projects that are in operation.
We focused on the possible impact that the initial composition and changes in the equity structure may have on the output indicators of each PPP project. To examine whether and to what extent the equity structure has changed, we gathered information from the InfraInfo database on the share of construction and financial investors at different project stages (for example, initial signing, construction, and operation). The focus of this analysis was to examine how the change of equity structure can induce cost-saving behavior by construction investors. For this, we compared the total private investment volume on the initial contracts with the corresponding amounts in the final audit reports for the PPP projects. We considered two dependent variables: the relative change of project cost compared with the cost estimation at the initial signing, and the absolute difference of audited private investment volume and initial private investment volume.
The main hypotheses that we are trying to verify are twofold. First, the higher the share of construction investors at the initial contract signing, the more prevalent will be the SPV’s cost-saving efforts, since construction investors tend to focus on maximizing short-term profits by reducing construction costs. And, second, because construction investors leave projects after construction, which will be measured by the difference in the share of their equity structure before and after construction, they will show a great tendency for cutting construction costs.

Realizing the Potential of PPPs to Advance Asia’s Infrastructure Development228
We have already measured the composition of investors within each PPP project and followed its changes at different project stages. The dependent variable for the models is the difference in private investment volume between the initial agreement and the final audit report. The key explanatory variable is either the share of construction investors in the initial equity structure (models 1 and 3 in Table 9.2) or the change in share of construction investors before and after the construction (models 2 and 4), according to the design of regression models.
Table 9.2 shows the results of the regression models. Contrary to our expectations, we did not observe any statistically significant impacts from both the initial share of construction investors and the change in their share on reducing project costs when we used the share of the reduction in construction costs to the initial investment volume as a dependent variable (models 1 and 2). But, where the absolute change of investment volume was used as a dependent variable, the change in the share of construction investors has a negative and statistically significant effect on the dependent variable (model 4), while the initial share of construction investors has no significant effect on reducing construction costs (model 3). This means the greater the decrease of a construction investor’s share in a project after the initial contract signing, the bigger is the cost reduction that can be expected by the time the project goes into operation. This finding seems to partially support our prediction on the efficiency-enhancing effects of contract bundling, but further examination using a greater number of cases should be done before this can be verified.
Another interesting result is on the minimum revenue guarantee.4 In all four models, the project with a minimum revenue guarantee showed a statistically significant cost reduction, and this is far more pronounced in models 3 and 4. Although further analysis may be needed to explain this result, it nevertheless seems to confirm that PPP projects with minimum revenue guarantees were often initiated by developers who are mainly financial investors. These developers, along with construction companies, tend to be involved in projects for far longer than those initiated by construction investors. In this respect, we interpret this finding as supporting our predictions from the theoretical models that strong bundling behavior, which was observed in the PPP projects with minimum revenue guarantees, can contribute to an increase in project efficiency.
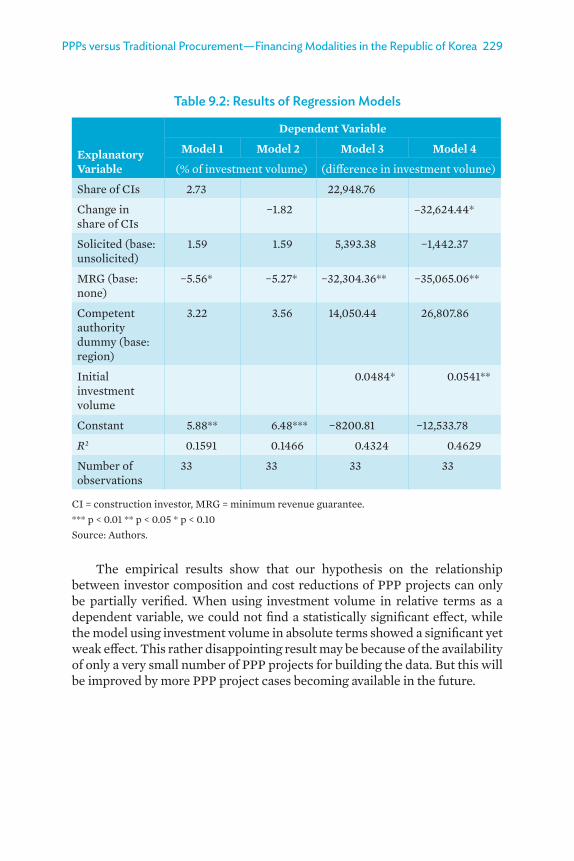
PPPs versus Traditional Procurement—Financing Modalities in the Republic of Korea 229
Table 9.2: Results of Regression Models
Explanatory Variable
Dependent Variable
Model 1 Model 2 Model 3 Model 4
(% of investment volume) (difference in investment volume)
Share of CIs 2.73 22,948.76
Change in share of CIs
−1.82 –32,624.44*
Solicited (base: unsolicited)
1.59 1.59 5,393.38 −1,442.37
MRG (base: none)
−5.56* −5.27* −32,304.36** −35,065.06**
Competent authority dummy (base: region)
3.22 3.56 14,050.44 26,807.86
Initial investment volume
0.0484* 0.0541**
Constant 5.88** 6.48*** −8200.81 −12,533.78
R2 0.1591 0.1466 0.4324 0.4629
Number of observations
33 33 33 33
CI = construction investor, MRG = minimum revenue guarantee.*** p < 0.01 ** p < 0.05 * p < 0.10Source: Authors.
The empirical results show that our hypothesis on the relationship between investor composition and cost reductions of PPP projects can only be partially verified. When using investment volume in relative terms as a dependent variable, we could not find a statistically significant effect, while the model using investment volume in absolute terms showed a significant yet weak effect. This rather disappointing result may be because of the availability of only a very small number of PPP projects for building the data. But this will be improved by more PPP project cases becoming available in the future.

Realizing the Potential of PPPs to Advance Asia’s Infrastructure Development230
ConclusionWe can derive some policy implications from our analysis. The most important is that PPPs are not always more efficient than traditional procurements. Only if the contracts and implementation of PPPs are well designed can the efficiency of these partnerships be enhanced. As seen in the PPP model for the Republic of Korea, the results are similar to those from a traditional procurement, rather than for an ideal PPP. This shows that contractors only focus on maximizing short-term profits by minimizing construction costs rather than maximizing overall profits from the whole cycle of a project. The message here is that a government considering promoting PPPs as an alternative to traditional procurement to enhance efficiency should try to make the PPP mechanism as close as possible to the ideal model of a PPP. From the Republic of Korea’s perspective, the incentive structure of construction companies who only care about minimizing costs but not maximizing the net benefit of a project needs to be changed. Strengthening competition in PPP markets would be a good way of going about this.
In the Republic of Korea, where construction companies rather than financial institutions have played major roles in PPPs, competition becomes ineffective when some of the largest construction companies build consortiums in submitting a PPP proposal. The government could consider implementing a regulation that limits the number of large construction firms participating in consortiums bidding for PPP projects. And this has been tried in requests for proposals for some projects.
Financial investors need to play leading roles in developing and implementing PPP projects, and their participation should be promoted. One way to do this is to use the new PPP schemes, BTO-a (adjusted) and BTO-rs (risk sharing), that have been introduced by the government to mitigate the reluctance of private investors by increasing the public sector’s contribution or sharing the project risk between public and private stakeholders. Another way is to encourage infrastructure funds to invest in more PPP projects, for which the system and regulation should be reformed to make a diversified PPP investment portfolio of funds possible.
Because of limited data availability, we could only conduct a partial empirical analysis to verify the relevance of our theoretical models. We hope follow-up research with a richer dataset will be able to bring out clearer results on the effect of bundling on the efficiency of PPP projects that was expected from the theoretical models.

PPPs versus Traditional Procurement—Financing Modalities in the Republic of Korea 231
In sum, the bundling effect is a key component that affects the efficiency of PPP projects. But the procuring authorities need to examine whether it is indeed effective and, if not, as in some PPP cases in the Republic of Korea, the problems that hamper the realization of the bundling effect should be resolved to improve the efficiency of PPP projects.
Notes1. The theoretical analysis of this chapter is based on Lee (2017).2. For example, the benefit of a road project cannot be exactly measured; only traffic volume,
average travel times, and similar measures can, with the results providing indirect information on the quality of a road.
3. We also conducted an additional analysis (not shown here) examining which type of investor was dominant for each project stage. Here, we observed that large construction investors took on the major role of raising capital during the construction phase after the initial signing through to design implementation, while financial investors, such as national pensions, contribute to major parts of capital at the operation stage.
4. The variable of minimum revenue guarantee was added to consider its role in shaping the Republic of Korea’s PPP system in its early years, and particularly to spur the PPP market.

Realizing the Potential of PPPs to Advance Asia’s Infrastructure Development232
References
Hart, Oliver. 2003. Incomplete Contracts and Public Ownership: Remarks, and an Application to Public–Private Partnerships. Economic Journal 113 (86): pp. 69–76.
Iossa, Elisabetta and David Martimort. 2015. The Simple Microeconomics of Public–Private Partnerships. Journal of Public Economic Theory 17 (1): pp. 4–48.
Lee, Hojun. 2017. How to Improve PPPs in Korea to Enhance the Efficiency of Public Investment. In Public Investment and Economic Growth, edited by Lee Jaejoon and Kim Kangsoo. KDI Research Monograph. Sejong: Korea Development Institute.

CHAPTER 10
Improving the Performance of Public–Private Partnerships in Infrastructure Services in Asia through Better Regulation
Xun Wu
IntroductionThe literature on the obstacles to public–private partnerships (PPPs) focuses on problems associated with political support, institutional structure, contract design, bidding processes, public perception, and the effects of unforeseeable events. Not enough attention has been given to the role of regulatory governance in the performance of PPPs. This is surprising since infrastructure services are typically regulated regardless of ownership structure because of market competition in these services. Indeed, the quality of regulations affecting PPPs can be among the key determinants to the success of these partnerships (Brown et al. 2006; Eberhard 2007; Stern and Holder 1999). A World Bank survey of private power sector investors found that four of the top five factors for an unsatisfactory investment experience were related to lack of fairness and commitment in regulatory systems (Batra, Kaufmann, and Stone 2003). Ineffective regulations not only impair the performance of PPPs in infrastructure services that are underway, but are also a major barrier for potential investors.
Regulation is vital for the smooth performance of PPPs in infrastructure services, and for developing the PPP modality. The regulatory framework presented in this chapter consists of regulatory objectives, regulatory functions, regulatory agencies, and regulatory instruments. Confusion and misunderstanding are widespread on regulations affecting PPPs at the conceptual and operational levels for three main reasons. The first is that regulations are often seen as obstacles to the development of PPPs. Although the main objective of regulations is to reduce risks by protecting the interests of all stakeholders. The second is the dominance of economic regulation in dealing with market failures. Preventing these failures is at the heart of these regulations, but there are also other rationales, such as meeting social and environmental objectives. The third reason is that much more emphasis is put on regulatory issues for initiating PPPs than on sustaining PPP contracts.

Realizing the Potential of PPPs to Advance Asia’s Infrastructure Development234
Developments in PPPs in infrastructure services in Asia’s emerging economies since the start of the 2000s provide a good opportunity to examine the role of regulation in improving the performance of these partnerships for infrastructure services. No systematic analysis has been done on this. Some studies focus on economic regulation only, but the regulation of economic issues beyond natural monopoly must also be taken into consideration. Other studies treat legal and regulatory issues as being in the same category, though approaches to both differ considerably.
By drawing on lessons from water sector PPPs using brief case studies from the People’s Republic of China and the Philippines, this chapter aims to help fill these gaps with its analysis of how a strong regulatory environment can improve the performance of PPPs in infrastructure services. The chapter presents a framework for designing regulatory systems for infrastructure services, and discusses the challenges of regulating infrastructure services in Asia in the context of the case studies. The water sector was chosen not only because the regulation of water PPPs captures the full array of the regulatory challenges in dealing with these partnerships in infrastructure services but also because they have been more controversial than PPPs in other sectors in many countries in Asia. Among the regulatory challenges are a lack of clear understanding of the definitions, scope, functions, and mechanisms of regulations for PPPs in infrastructure services.
Regulations Governing PPPs in Infrastructure ServicesPPPs are the cooperation between government and business agents that agree to work together to reach a common goal or carry out a specific task, while jointly assuming risks and responsibilities, and sharing resources and competencies. PPPs may involve services and management contracts, leases, build–operate–transfer, concessions, and joint ventures. This chapter focuses on the last three types of PPPs to be consistent with definitions used by the Asian Development Bank and other multilateral agencies.
Time inconsistency—whereby a decision-maker’s preference at one point in time is inconsistent with the preference at another point in time—is a major problem for regulating PPPs in infrastructure services. In infrastructure PPPs, time inconsistencies between current needs and future imperatives, and between promises and actions, are commonplace and, to some extent, predictable. For example, a government faced with limited public resources might feel compelled to agree to a postprivatization water tariff increase to attract private investment. But there is a danger that, once a private

Improving the Performance of PPPs in Infrastructure Services in Asia 235
partner invests in infrastructure services, the government may renege on its commitment to increase tariffs if it is under strong political pressure to do so. And private sector players, for their part, may behave opportunistically. For example, if a private partner knows the government will have to renegotiate a PPP contract once the project is in operation, that partner may bid aggressively to win contracts to increase profits through subsequent renegotiation. Regulation can play an important role in dealing with time-inconsistency problems, as these examples show.
Regulatory Objectives
Governments regulate PPPs for infrastructure services to tackle four types of risk. First, private participation in these services raises potential concerns on conflicts between the profit motive of private partners and the need to protect the public interest, since these services meet basic needs. Second, time inconstancy problems, as just discussed, can trigger opportunistic behavior among stakeholders. Third, competitive markets for infrastructure services are often lacking, raising the risk of reduced incentives for efficiency improvement. And fourth, significant problems exist with information asymmetry associated with private sector involvement. Faced with these factors, governments must monitor the performance and service quality of infrastructure PPPs. The objective in regulating PPPs is to protect public interests, deliver value for money for the public sector, ensure a fair and reasonable return for private investors and financers, and improve service delivery.
In practice, not all these objectives get enough attention in the design and implementation of PPP projects in infrastructure services. A lot of attention is generally given to objectives related to economic regulation, but social regulation is often neglected. The inherent conflicts between different objectives also need to be considered. The prioritization, relative weights, and balancing of these objectives are important for designing regulatory systems. However, these broad objectives may, not be the same as the aims of regulatory institutions. Without proper coordination, these institutions may pursue different goals, which can result in inefficiency.
Regulatory Functions
PPPs in infrastructure services are often in sectors that either lack competition or are natural monopolies. Where this is the case, tariffs and service standards must be regulated to protect the interests of consumers. Because infrastructure is capital intensive, requiring large investments over long periods, governments may act opportunistically under political pressure. Here, regulation is needed to protect the interests of private partners and
Realizing the Potential of PPPs to Advance Asia’s Infrastructure Development236
investors by curbing opportunistic behavior. Regulatory functions, therefore, aim to balance the interests of all sides in a PPP. Examples of regulatory functions include setting tariff levels, monitoring project operating costs, and setting entry and exit requirements for sector.
Because infrastructure services are essential services, it is important to ensure that they are accessible to the public at affordable prices. Both access and affordability need to be regulated for infrastructure services provided by PPPs. For strategic and national security reasons, some countries impose restrictions on foreign ownership of service providers. The procurement procedure for PPPs, including how projects are prepared, tendered, approved, and implemented, may be subject to regulation to ensure fairness, transparency, and operational efficiency, especially when public resources (financing and assets) are involved.
The roles and responsibilities of the parties involved in PPP transactions may also be regulated. Given the inherent problem of incomplete PPP contracts, which are anyway more complex than private contracts, it is inevitable that disputes between parties arise(Wu, Batac, and Malaluan 2011). While courts can provide dispute resolution mechanisms, the availability of alternative resolution mechanisms can help to increase the confidence of investors (Vandenberg 2015). The renegotiation of contracts may become necessary because of incomplete contracts, and the process and scope of renegotiation can be regulated to prevent opportunistic behavior by the parties involved. Risk allocation is a major aspect of PPP contracts, and this can be regulated to ensure that public and private interests are balanced. Examples of regulatory functions in this area include rules on risk sharing, establishing mechanisms to resolve disputes, and rules for renegotiating contracts.
Encouraging private sector participation in PPPs for infrastructure services calls for rebalancing some regulatory functions. The emergence of PPPs in infrastructure services is the result of the deregulation of certain functions. For example, there might be restrictions on private sector involvement in infrastructure services in certain sectors, which means the involvement of the private sector in these sectors is only possible after these restrictions are removed. A further reason for rebalancing regulatory functions is the complexity of PPP arrangements, and new regulations may be needed to deal with this, particularly given the increasing importance of the private sector to help fill Asia’s infrastructure gap. Figure 10.1 shows potential changes in regulatory functions caused by the characteristics of PPPs.

Improving the Performance of PPPs in Infrastructure Services in Asia 237
Figure 10.1: Changes in Regulatory Functions from Traditional Procurement to PPPs
Traditional Public Procurement Model
Public–Private Partnership
Regulatory functions
stemming from the mandates of
public services
Regulatory functions dealing
with lack of market competition in infrastructure
services
Government-owned service
providers
Regulatory functions
stemming from the mandates of
public services
Regulatory functions dealing
with lack of market competition in infrastructure
services
PPPs
Regulatory functions
stemming from the complexity in partnership
arrangements
PPP = public–private partnership. Source: Author.
Regulatory Agencies
The focus on the independence of regulatory institutions has obscured the more fundamental issue of the level—international, national, subnational, sector, and project—at which regulatory functions are performed. Internationally, treaties and agreements, such as the World Trade Organization and its General Agreement on Trade in Services, provide regulatory tools useful for PPPs, as do bilateral treaties, where dispute settlement provisions can be found in most investment treaties. Adhering to international dispute resolution mechanisms is important for attracting foreign investors to PPPs in infrastructure services. Procurement regulations in the European Union, for example, apply to all member states (Maslyukivska and Sohail 2007).
Regulation promulgated nationally and subnationally can carry out regulatory functions across sectors. PPP units have been set up to do this for certain regulatory functions in several countries in Asia, and PPP laws and regulations are applied universally across different sectors. In the People’s Republic of China, for example, more than 40 PPP regulations were issued by the government from 2013 to 2017. Table 10.1 shows some of them.

Realizing the Potential of PPPs to Advance Asia’s Infrastructure Development238
Table 10.1: Selected PPP Regulations in the People’s Republic of China, 2013–2015
Issuing Authority Issuance Date Regulation
State Council 26 September 2013 Instructions on government purchases of services from social sources
State Council 19 May 2015 Instructions on promoting PPPs in public services
NDRC 2 December 2014 Instructions on carrying out PPPs, including the NDRC version of PPP contract guidelines
NDRC and China Development Bank
10 March 2015 Notice on the promotion of development financing to support PPPs
NDRC and others 25 April 2015 Administrative methods for concessions in infrastructure and public works
MOF 29 November 2014 Operational guidelines (pilot)
MOF 30 December 2014 PPP contract guidelines (pilot)
MOF 31 December 2014 Government procurement administration methods for PPPs
MOF 7 April 2015 Guidelines for fiscal affordability evaluations of PPPs
MOF 18 December 2015 Guidelines for value-for-money evaluation of PPPs (pilot)
MOF 18 December 2015 Standardizes information platforms for PPPs
MOF = Ministry of Finance, NDRC = National Development and Reform Commission, PPP = public–private partnership.Source: Hui Jin and Isabel Rial. 2016. Regulating Local Government Financing Vehicles and Public–Private Partnerships in China. Working Paper No. 16/187. Washington, DC: International Monetary Fund.
Because numerous national and subnational government agencies are involved in regulating PPPs, potential inconsistencies between those promulgated by different agencies can arise. Take Indonesia. PPP procurement procedures are set out in Presidential Regulation No. 13 of 2010, Government Regulation No. 6 of 2006, and Government Regulation No. 38 of 2008—and there are contradictions between them. Government Regulation No. 6, for example, stipulates there should be a minimum of five bidders, but the minimum is three in Presidential Regulation No. 13.

Improving the Performance of PPPs in Infrastructure Services in Asia 239
Some regulatory functions differ considerably from sector to sector. For example, cross-ownership among power generators and distributors is a regulatory issue in the power sector, and cross-ownership is subject to sector regulation. In the Philippines, the Energy Regulatory Committee is mandated to regulate business entities operating in the energy sector, including PPPs. In the United Kingdom, all water companies are regulated by Ofwat—a sector regulator. Regulation can also be at the project level or incorporated into PPP contracts. Regulation by contract is project regulation by default. In regulating Manila’s two water concessions, which is discussed later in the chapter, a regulatory office was established to monitor the enforcement of the concession contracts.
Regulatory functions for PPPs in infrastructure services can be performed by different regulatory institutions and at different levels. While these functions may share similar names across sectors and countries, their regulatory power and the instruments used can differ considerably. For example, some institutions, have the authority and mandate to make final regulatory decisions, while others make only recommendations on regulatory issues.
There are three basic types of regulatory institutions. The first are departments within ministries or local governments. In some cases, these departments focus exclusively on regulatory functions, and they are typically called regulatory agencies, commissions, or authorities. In other cases, they also perform administrative functions. Regulatory agencies independent of government are the second type. These agencies are typically involved in the economic regulation of PPPs, and their decisions are made independently from national or local government to distance them from interference from political or business interests. These agencies can operate nationally and subnationally, and across a sector or sectors.
The third type of regulatory institution is the PPP contract itself. Here, contracts set out the rules, tariffs, and service standards without the need to create a regulatory agency for the project sector. Many Asian governments implement PPPs for infrastructure services this way. Under the regulation-by-contract modality, the discretion of decision makers is constrained by specifying the procedure for adjusting tariffs within the contract document, such as indexing, automatic pass-through, and case-by-case determinations.
Regulatory Instruments
Governments use many types of regulatory instruments for PPPs in infrastructure services; the following briefly looks at the main ones.
Rules and enforcement. The most common regulatory tool is to make rules and enforce them. For example, a government may impose rules on the

Realizing the Potential of PPPs to Advance Asia’s Infrastructure Development240
ownership of certain infrastructure services, which are then operated by the private sector. Governments typically impose rules on the number of required bids for infrastructure PPP projects. These rules are usually set by PPP laws, sector laws, executive orders, circulars, policy frameworks, administrative measures, and implementation guidelines.
Licensing. This is highly relevant for PPPs in infrastructure services because it provides a mechanism for governments to withdraw from public ownership while retaining some control (Scott 2014). In the power sectors of many countries in Asia, regulators issue licenses for generating, transmitting, and distributing electricity. Typically, licensing requires legislation under which government departments or agencies are empowered to grant licenses.
Discretionary regulation. This is used primarily in economic regulation. Discretionary regulation provides regulatory agencies with the power to unilaterally set tariffs and service standards for regulated firms (Gómez-Ibáñez 2003). Cost-of-service and price-cap regulations are examples of discretionary regulation.
Deregulation. This is highly relevant for PPPs because the emergence of PPPs in infrastructure services is the result of the removal of key restrictions, such as government financing, and the provision of certain infrastructure services.
Benchmarking. Benchmarking for PPPs in infrastructure measures the performance of a regulated entity and compares it with a sample group of firms or industry averages to show its relative standing or past performance to reflect changes in production, efficiencies, and service quality.
Designing Regulatory Systems for PPPs in Infrastructure ServicesFigure 10.2 shows the main components of a regulatory system for PPPs in infrastructure services. Although these systems aim to protect against PPP risks, they carry their own regulatory risks. A poorly designed or functioning regulatory framework can expose the system to additional risks, while contributing little to mitigating the very risks that it is designed to counter. The framework shown in the figure provides a diagnostic tool for identifying pitfalls in designing regulatory systems that can help avoid these risks.

Improving the Performance of PPPs in Infrastructure Services in Asia 241
Figure 10.2: Key Components for Designing a Regulatory System for PPPs in Infrastructure Services
Regulatory Functions
RegulatoryInstitutions
RegulatoryInstruments
Regulatory Objectives
• To protect the public interest• To deliver value for money for the public sector• To ensure a fair and reasonable return for the private investors and
financers• To improve e�ciency in service delivery
• Regulatory functions stemming from lack of market competition in infrastructure services
• Regulatory functions stemming from the mandates of public services
• Regulatory functions stemming from the complexity in partnership arrangements
• International• National and subnational governments• Sector• Project
• Rules and enforcement• Licensing • Discretionary regulation• Deregulation• Benchmarking
Source: Author.
In designing a regulatory system for PPPs in infrastructure services, the following questions should be addressed:
• What are the regulatory objectives, stated or assumed?
• Are the main regulatory objectives included?
• What is the relative importance of different objectives?
• How are regulatory functions linked?
• How can regulatory functions contribute to project performance?
• Are these regulatory functions equally important across different types of infrastructure services?
• Which government institutions should carry out regulatory functions and at what level?
• What types of regulatory instruments are best used for a particular regulatory function?
• Is the mix of regulatory instruments optimal?

Realizing the Potential of PPPs to Advance Asia’s Infrastructure Development242
The answers to these questions could reveal potential pitfalls in a regulatory system’s design. The following looks at several notable pitfalls, which are relevant in Asia and globally.
Neglecting regulatory issues. Regulation is often not explicitly mentioned in guidelines or references for PPPs, in part because potential regulatory issues for PPPs tend to be framed in the context of contract design and contract management. But this omission risks underestimating the problems of regulating PPPs in infrastructure services, and the mismatch between these problems and tools used to tackle them.
Measures lacking for implementing regulatory objectives. These objectives will only be achieved if they are realized through regulatory functions that can be performed by using the regulatory instruments of one or more regulatory institutions. For example, price regulation by using price caps or cost-of-service regulations by an independent regulatory agency are essential for fulfilling the objective of better service delivery.
Poorly executed regulatory functions. As mentioned earlier, promoting PPPs for infrastructure services calls for rebalancing different regulatory functions, but regulation is a new functional area for many developing countries, and the complexity and capacity requirements for this are often greatly underestimated.
Failure to deal with conflicts. Conflicts are unavoidable among different regulatory functions and need to be sorted out in the design of PPPs for infrastructure services. For example, while the removal of restrictions on ownership types and structures of bidders may enhance market competitiveness, these restrictions are often seen as performing a key function in safeguarding a government’s mandate to provide public services.
Misaligned regulatory functions. Regulatory functions performed by different regulatory agencies might be misaligned. For example, economic regulation can be carried out at the sector or project level, and disputes can be resolved by local or international courts of appeal. In a few developing countries in Asia, including Kazakhstan and Malaysia, PPP regulations are issued by national entities, such as PPP units, but their monitoring and enforcement can be done at the subnational or sector level. The choices on these issues may have significant effects on a regulatory system’s performance.
Conflicting regulatory functions. The regulatory functions of different agencies should not contradict each other. For example, the restriction on ownership structure—the percentage share allowed for private sector players, for instance—might be removed from national regulation, but continues to apply at the sector level.

Improving the Performance of PPPs in Infrastructure Services in Asia 243
Water PPP Case Studies in the People’s Republic of China and the PhilippinesThe case study on water and sanitation PPPs in the People’s Republic of China provides insights into how regulation at the national and sector levels can help improve the performance of water PPPs. How Manila’s two water concessions were regulated is a good example of the tradeoff among different regulatory institutions and regulatory instruments, and the development of regulatory agencies over time.
Regulating Water PPPs in the People’s Republic of China
Until the end of the 1970s, water and sanitation in the People’s Republic of China was one of the county’s most centrally planned sectors. But market reforms challenged this system’s institutional and economic foundations, which held that water was a basic public need that should be provided for free. The reforms compromised the financing and provisioning mechanisms for free water. The country’s water infrastructure came under further pressure from a rising urban population and rapid industrialization, leading to a growing inability to supply enough water and wastewater treatment during the 1980s and 1990s.
To tackle the rising demand for water services and to help finance new projects, the government opened the sector to private participation, introducing national schemes to attract foreign investment in the 1990s. One notable policy was the 21st Century Urban Water Management Pilot Scheme in 1997, which liberalized water tariffs for projects that attracted foreign capital and allowed foreign investors to receive attractive rates of return from water projects. The promulgation of the Urban Water Price Regulation in 1998 allowed local governments to set water tariffs to guarantee foreign investors a net return of 8%–10%. These measures were well received by investors and brought the first wave of water PPPs to the country (Table 10.2). Foreign water companies, including France’s Suez SA and Germany’s RWE AG, participated in 17 out of 42 PPP water and sanitation projects during 1994–2001.

Realizing the Potential of PPPs to Advance Asia’s Infrastructure Development244
Table 10.2: Water and Sanitation PPPs in the People’s Republic of China, 1994–2017
Item
Number of Projects Percentage of Total Projects1994–2000
2001–2006
2007–2017
1994–2000
2001–2006
2007–2017
PPP Type
Concession 16 56 66 50.0 33.3 22.1Divestiture 1 2 10 3.1 1.2 3.3Greenfield 15 103 186 46.9 61.3 62.2Management and lease
0 7 37 0.0 4.2 12.4
Project TypePotable water and sewage treatment plant
2 4 5 6.3 2.4 1.7
Potable water treatment plant
27 42 15 84.4 25.0 5.0
Sewage collection 0 0 1 0.0 0.0 0.3Sewage collection and treatment
0 0 3 0.0 0.0 1.0
Sewage treatment plant
1 106 256 3.1 63.1 85.6
Water utility with sewerage plant
0 7 3 0.0 4.2 1.0
Water utility without sewerage plant
2 9 15 6.3 5.4 5.0
Foreign InvestmentNo 0 70 223 0.0 41.7 74.8Yes 32 98 75 100.0 58.3 25.2
Project StatusOperational or under construction
20 164 192 62.5 97.6 100.0
Cancelled 12 4 0 37.5 2.4 0.0
PPP = public–private partnership.Source: Author’s calculation based on the World Bank’s Private Participation in Infrastructure Database (accessed 25 March 2018).
These early PPPs were hit by controversies and growing pains. One problem was the guaranteed rates of return to foreign investors. Opponents claimed that offering preferential terms to foreigners was unfair to local companies. There were also complaints that government officials were

Improving the Performance of PPPs in Infrastructure Services in Asia 245
overeager to secure PPP projects because career advancement was closely linked with the amount of foreign direct investment they attracted. Many water and sanitation PPP contracts at the time were seen as too generous to foreign partners. In 2002, the General Office of the State Council stepped in, issuing a circular scrapping guaranteed fixed returns to foreign investors and extending this provision to existing PPP contracts.
The sudden change of policy was a major setback for foreign investors in the sector, and 12 out of 32 projects that had reached financial closure during 1994–2000 were canceled. The government, however, remained committed to PPPs, and showed this by launching a campaign to promote these partnerships by removing several other constraints to foreign investment in water. The 2002 Foreign Investment Industrial Guidance Catalogue allowed foreign investors to build and operate water supply and drainage networks in medium- and large-sized municipalities. The 2004 Measures on Public Utilities Concession Management allowed foreign investors to bid for any urban water services contracts. As part of efforts to promote PPPs in the sector, Chinese banks could finance investments in water PPPs instead of relying on international financing, thereby allowing local companies to participate in the sector’s PPPs.
Arguably, the most important policy initiative was the “rationalization” of water tariffs from 2002. The 2004 Circular on Accelerating the Reform of Water Prices, Promoting Water Savings, and Protecting Water Resources tackled the need to raise water tariffs to more realistic levels (Zhong, Mol, and Fu 2008). With strong support from the central government, authorities in many cities substantially raised their water tariffs, which increased from 75% to 100% from 2004 to 2006 in some large cities (Owen 2006). However, tariffs, were still not high enough to reach full cost recovery. Even so, the government, by steadily increasing tariffs across the country, clearly showed its commitment to making the sector commercially viable. And this unleashed a second wave of water PPP projects at a time when interest in this modality was declining elsewhere in the world. From 2001 to 2017, 467 PPP projects were undertaken in water and sanitation in the People’s Republic of China, accounting for more than 50% of the total number of these projects globally.
This impressive growth, however, is being overshadowed by the long-term prospects for water and sanitation PPPs in the country because of institutional weaknesses. Credible regulatory mechanisms for these partnerships are still lacking. Different ministries and agencies are involved in regulation, including the Ministry of Housing and Urban–Rural Development, the Ministry of Water Resources, and the Ministry of Environmental Protection. All of them have overlapping roles and responsibilities. Despite having numerous regulatory agencies, there is a policy vacuum and technical capacity is weak in regulation, including in the critical areas of economic regulation and tariff setting. Local

Realizing the Potential of PPPs to Advance Asia’s Infrastructure Development246
governments have complete discretion in setting water tariffs, but they are not well suited for the task. Because local governments essentially own local water companies, rejecting a tariff increase will directly affect their budgets, which must cover tariff losses. Municipalities also do not usually have the technical capacity to regulate their water companies or reconcile the many national regulations applying to water companies.
Public accountability has not been a notable feature of PPPs in water and sanitation in the People’s Republic of China. The public hearing process, as the primary regulatory mechanism for tariff reviews, has not been effective in compensating for the regulatory gap. Several scandals have exposed water utilities for manipulating agendas and proceedings in public hearings to avoid confrontations with the public. Transparency in production costs is lacking, and the absence of proper benchmarking prevents users from participating in informed discussions on rate setting. Only very rarely have proposals for rate adjustments been rejected or revised because of opposition in a public hearing. Yet, the public is becoming increasingly wary of water tariff increases, and protests against rate hikes may become a major obstacle to tariff reform in the future.
The strong bias favoring projects that involve large private investments is another concern. As noted earlier, the performance of local government officials is often evaluated on their success in attracting investments. This risks overinvestment in greenfield projects, while arrangements that may be more appropriate for increasing network efficiency, such as improved management contracts or leases, can get neglected. This may be an important reason why nonrevenue water that has been produced but does not reach users remains high in many cities, despite massive investments into the sector.
Lessons from the People’s Republic of China Case Study
The experience of the People’s Republic of China in water and sanitation PPPs shows that having credible regulatory mechanisms are essential for the sustainability of these partnerships. One of the country’s costliest PPP mistakes was the failure to implement a unified regulatory mechanism. This may have been due to path dependence because most foreign companies in the first wave of water PPPs were French. Discretionary regulatory mechanisms are largely nonexistent in France, where contracts are the sole form of regulation. Under the French model, PPP contracts suffice to govern rates, service requirements, and procedures; as such, separate regulatory agencies are not deemed necessary. Yet, it is unrealistic to expect that contracts can specify all contingencies, especially in developing countries, given the changing circumstances over long time frames of most PPPs.

Improving the Performance of PPPs in Infrastructure Services in Asia 247
Credible discretionary regulatory mechanisms can be adapted to remediate system problems that arise and change. The lack of these mechanisms has affected progress being made in the People’s Republic of China on efficiency gains in utility operations; for example, where water companies are not contractually bound to improve efficiency. This is one reason why nonrevenue water remains a big problem in many cities, despite the injection of massive investments into the sector.
Setting up competent regulatory agencies will be a long-term process, given the lack of regulatory capacity in many cities that host PPP projects. Even so, some regulatory functions can be performed while efforts are underway to set up a formal system, as is being done in Guangzhou. Its city government discloses to the public detailed cost information on water utilities as an effective transparency check in the absence of an official regulatory system. A proposed initiative by Guangzhou’s provincial government to benchmark water utilities according to performance indicators to put pressure on utilities to reduce costs and improve services sounds promising.
Intergovernment support, coordination, and oversight are essential for promoting PPPs and for managing regulatory risks. The experience of the People’s Republic of China shows that strong support and oversight from the central government is essential to smooth operations and for lasting project success. The country has supported the proliferation of PPPs by several policy choices affecting their operations and general operating conditions. The Asian Development Bank’s support for the government’s efforts to draw up national guidelines for setting water tariffs through two technical assistance projects was instrumental in improving policy for reforming these tariffs.
Because local governments are responsible for supplying water, the central government may not be able to set up a robust regulatory framework for water and sanitation PPPs. Even so, these frameworks and the guidelines for them can be used as models by local governments and domiciled in contracts until a regulatory framework is set up. And, once the process matures, a regulatory system can be passed into law. Doing this will send a strong signal to the public and private sectors that the country’s PPPs process is not ad hoc, but clearly thought out at the highest levels of government.
The main lesson from the experience in the People’s Republic of China is that there are no shortcuts in introducing private participation into water and sanitation. Certain fundamental steps, such as tariff reform and creating effective regulatory systems, are difficult to implement but critical to success in the sector. To achieve this, the government needs to increase spending on water and sanitation, raise tariffs further, and seek ways to increase efficiency in operation and management—and this all needs to be done on the back of a

Realizing the Potential of PPPs to Advance Asia’s Infrastructure Development248
strong communication strategy to stakeholders. The government also needs to recognize that water tariff subsidies are not reaching the poor, who may not even be connected to subsidized supply systems, but depend on expensive unorganized suppliers.
The increase in water tariffs by many cities has been one of the main drivers for the boom in investments in PPPs and better service delivery since 2010. And that boom happened despite guaranteed rates of return being no longer allowed. In India, conversely, water tariffs are still generally too low for cost recovery.
Regulating Manila’s Water Concessions
In 1997, two concession contracts were awarded for water and sanitation services in Metropolitan Manila in what was then the world’s largest water PPP project. At that time, Metropolitan Manila had a population of 11 million spread across 12 cities and five municipalities. With 16,000 people per square kilometer, this was a very densely populated conurbation.
The service area of the Metropolitan Waterworks and Sewerage System (MWSS) was divided into two zones—west and east—which were bid out separately in an international tender. The same company could not win both zones. The contract for the west zone was awarded to Maynilad Water Services Inc., a joint venture between Philippine conglomerate Benpres Holdings Corporation and French multinational Suez SA. The east zone was awarded to Manila Water Company, a joint venture of Ayala Corporation, one of the Philippines’ largest companies, United Kingdom-listed water company United Utilities Group PLC, and United States construction and engineering group Bechtel Corporation. The 25-year contracts specified targets for the concessionaires to increase the coverage and improve the continuity of water supply. They were also required to pay concession fees to cover the costs of servicing MWSS debt. In return, the concessionaires received a revenue from tariffs.
From the outset, a hybrid regulatory system was adopted within a complex organizational structure of public and private entities (Jensen and Wu 2017). Contracts were signed between the MWSS and the concessionaires, and a new public agency, the MWSS Regulatory Office, was established under the MWSS as a contract monitoring body, with its legal basis set out in the contract document. The regulatory office’s discretionary power was deliberately restricted to reduce perceptions of regulatory risk in the private sector. The office was not granted decision-making powers; instead, it makes recommendations to the MWSS board of trustees, and its decisions must be approved by the board before they are implemented. The board, however, has
Improving the Performance of PPPs in Infrastructure Services in Asia 249
some financial autonomy since it is funded by a levy on the concessionaires rather than the public budget.
The water concession contracts provide for minor disputes to be heard by an ad hoc appeals panel, and for international arbitration for major disputes between the parties. The panel can overrule the regulatory decisions of the MWSS board, and the contract specifies that the panel’s decisions are final. Therefore, the panel therefore has regulatory functions of an appellate character.
Between the government and the concessionaires, regulatory risk under the hybrid model was reduced by detailed contract provisions on tariffs, targets, and grounds for adjustment, which constrained discretion, and by using international arbitration to settle major disputes. Setting up the regulatory office and periodic rate rebasing were intended to deal with contractual incompleteness by allowing tariffs and targets to be reviewed and adjusted to take account of changes in the operating conditions in a planned way.
The first major regulatory challenge came in 1998, less than a year into the contract term. Manila Water petitioned the regulatory office for a tariff increase to take into account the rapid increase in the cost of capital caused by the Asian financial crisis, and to front load compensation for insufficient raw water supply caused by the El Niño weather phenomenon. The regulatory office rejected the petition. It argued that the contract implied that the tariff should not be adjusted to reflect changes in the appropriate discount rate until the first rate rebasing, and that front loading tariff adjustments under the extraordinary price adjustment was disallowed. Manila Water took the dispute to the appeals panel, which ruled in its favor. Some members of the regulatory office felt this early tariff adjustment undermined the validity of the bidding process. But most felt the office should respect the finality of the panel’s decision.
The second major regulatory challenge was the first rate rebasing in 2002, which revealed gaps and ambiguities in the regulatory structure of the water concessions. To take just one example, the requirements for information disclosure by the concessionaires were not clearly specified in their contracts. Consequently, the technical and financial information that the regulatory office received was incomplete and not standardized.
For Manila Water, the first rate rebasing went smoothly in 2002. The regulatory office recommended a tariff slightly lower than that requested, reflecting certain expenditure disallowances, and Manila Water agreed to the adjustment. By contrast, Maynilad’s rate rebasing not only turned out to be much more complicated than Manila Water’s but also exposed considerable operational inefficiencies at Maynilad. The regulatory office’s final determination

Realizing the Potential of PPPs to Advance Asia’s Infrastructure Development250
included a large cost disallowance, and a much lower tariff than proposed by Maynilad. Maynilad rejected the determination, claiming its financial position was untenable, and gave notice that it was terminating its contract. The dispute was referred to the appeals panel, which found that neither side had breached the contract seriously enough to warrant termination. On the announcement of the panel’s decision, Maynilad filed for bankruptcy in a local court, effectively preventing the government from recovering unpaid fees from the company. The government had no choice but to start negotiations on the terms of Maynilad’s exit despite its weak bargaining position.
In 2006, the west concession was rebid and awarded to a consortium of two Philippine companies: D. M. Consunji Inc. and Metro Pacific Investments Corporation. The implied asset valuation of their bid was well above the government’s reservation price, suggesting the bidders perceived the regulatory risk to be low. This can be interpreted as an endorsement of the regulatory system for Manila’s water sector, and the regulatory office improving its ability to manage the water concessions.
Although the regulatory office has become more assertive, it has faced challenges to its authority. A decision by former President Gloria Macapagal Arroyo in 2008 to block Manila Water’s petition for a tariff increase over concerns on the impact of the global financial crisis led to Maynilad—the name was retained by the new owners of the west concession—asking for its contract to be extended so that the increase could be spread over a longer period. The regulatory office opposed the extension, arguing that losing the opportunity to rebid the contract might lead to significantly higher costs for consumers in the long term. But the MWSS board was under heavy pressure from the executive branch of the government to grant the extension. Manila Water got its 15-year extension in 2009, and Maynilad’s water concession was extended for 15 years in 2010.
The contract extensions were a blow to developing the regulatory office’s role beyond the one provided for it in the water concession contracts. A more powerful agency with an explicit responsibility to represent the public interest might have been able to veto the contract extension. Under Manila’s hybrid regulatory system, however, the primacy of contract over agency allowed the concessionaires to renegotiate opportunistically to suit their short-term financial interests.
Lessons from the Manila Case Study
In Manila, the hybrid regulatory structure offered the great promise of compensating for drawbacks in both contract and discretionary regulation. In

Improving the Performance of PPPs in Infrastructure Services in Asia 251
the design phase, the priority appears to have been reducing regulatory and political risks within the constraints imposed by the institutional structure. Thus, the contracts specified the initial tariff and had detailed provisions on tariff indexation, but the principles and processes of rate rebasing were very vague. Regulatory risks were reduced by the dispute settlement mechanism, whereby disputes were taken out of the hands of local courts and entrusted to an international arbitration panel, whose decisions were final.
The contracts were the central regulatory instrument in the first rate rebasing. Here, the regulatory office referred to the concessionaires’ own business plans as the benchmark for performance. But by the time of the contract extension and the third rate rebasing, tensions inherent in the role of a regulatory agency in the hybrid structure were acutely apparent. And, by this time, the regulatory office had begun to define its own role more broadly as providing continuing incentives for the concessionaires to operate efficiently. The office also tried to fit the contract terms to its own interpretation of key parameters, such as the appropriate discount rate and “prudent and efficient” spending.
The regulatory office’s capabilities have evolved considerably since it was set up in 1997. In the first rate rebasing, the office essentially contracted out major regulatory tasks by using external consultants to provide technical inputs and analysis. A notable feature of the regulatory office’s development has been its move away from its original role as merely a contract monitoring agency to becoming a full-fledged, autonomous regulatory agency. This is both a necessary and desirable process if a regulatory system is to continue to exert pressure on firms to operate efficiently over the life of PPP contracts.
The limitations of the hybrid structure were also evident in the renegotiation of both contracts and their 15-year extension. In these episodes, the regulatory office positioned itself as the contracts’ guardian and opposed changes in major provisions. But it was ultimately unable to block the government’s short-term incentives. The renegotiation of contracts is not always opportunistic of course (Brux 2010), but the potential costs to the consumer are significant. Consumers effectively subsidized the financial irresponsibility of Maynilad’s original owners. Delaying the termination of the contract through the amendments raised costs to both the consumer, directly in tariffs and indirectly through foregone service improvements, and the government, which was unable to recoup the unpaid concession fees. It is difficult to estimate the cost of extending Maynilad’s concession by 15 years, but it seems likely that the competitive effect of rebidding could have allowed considerable efficiency savings to be passed on to consumers.

Realizing the Potential of PPPs to Advance Asia’s Infrastructure Development252
Conclusions and Policy RecommendationsThe main institutions involved in the regulation of PPPs are national or subnational PPP units, government agencies responsible for procurement, ministries, departments, sector regulatory agencies, and local government agencies. Although regulatory functions are performed by different institutions, they should nevertheless be allocated to the institutions that have a clear mandate and sufficient resources to carry them out to ensure prudent processes and clear lines of accountability. Coordinating and streamlining multiple layers of regulations that may affect PPPs in infrastructure services across one or different levels of government are essential for reducing regulatory obstacles to promote PPPs.
While vital regulatory tasks can be carried out effectively nationally or subnationally, the importance of adapting regulation based on sector characteristics cannot be overstated. In some sectors, the case for monopolies could be significantly weakened by emerging technologies or changes in industries, and so existing regulations may not be justifiable and should be reformed. Further, the benefits of regulation should be weighed against their costs since they are a part of the overall regulatory system. Rushing into PPP projects before essential reforms are adopted may make it harder to undertake sector regulatory reforms in the future.
Effective regulation requires adequate capacity. Regulation, especially economic regulation, involves a high level of technical expertise across different areas, and resources need to be available for regulatory functions. Indeed, the monitoring, enforcement, and adjustment requirements of regulation are complex technical activities that require not just sufficient resources but also skills and information to be effective. Progress can be made gradually, as regulatory capacity is being developed; for example, by collecting and publishing information on the performance of PPPs to increase transparency and accountability, or setting up a sector or national unit to benchmark the performance of PPPs across localities and sectors.
Public participation can be vital for the success of PPPs in infrastructure services, and regulation can play a role in enhancing this participation by finding ways to involve the public and consumers in the regulatory process. Mechanisms can be established to allow the public to make submissions about planned PPPs, and public sessions held for utilities to present their case for tariff changes to the government. Setting up customer complaint units with a mandate to assist customers with complaints they cannot resolve directly with PPP project companies can also help involve consumers in the regulatory process.
Improving the Performance of PPPs in Infrastructure Services in Asia 253
References
Batra, Geeta, Daniel Kaufmann, and Andrew H. W. Stone. 2003. Investment Climate around the World: Voices of the Firms from the World Business Environment Survey. Vol. 1. Washington, DC: World Bank.
Brown, Ashley C., Jon Stern, Bernard William Tenenbaum, and Defne Gencer. 2006. Handbook for Evaluating Infrastructure Regulatory Systems. Washington, DC: World Bank.
De Brux, Julie 2010. The Dark and Bright Sides of Renegotiation: An Application to Transport Concession Contracts. Utilities Policy 18 (2): pp. 77–85.
Eberhard, Anton. 2007. Infrastructure Regulation in Developing Countries: An Exploration of Hybrid and Transitional Models. Working Paper No. 7. Washington, DC: World Bank.
Gómez-Ibáñez, José A. 2003. Regulating Infrastructure: Monopoly, Contracts, and Discretion. Cambridge, MA: Harvard University Press.
Jensen, Olivia and Xun Wu. 2017. The Hybrid Model for Economic Regulation of Water Utilities: Mission Impossible? Utilities Policy 48 (October): pp. 122–131.
Jin, Hui and Isabel Rial. 2016. Regulating Local Government Financing Vehicles and Public–Private Partnerships in China. IMF Working Paper No. 16/187. Washington, DC: International Monetary Fund.
Maslyukivska, Olena and Muhammad Sohail, 2007. European Infrastructure Procurement through PPP. Proceedings of the Institution of Civil Engineers: Management, Procurement and Law 160 (4): pp. 159–167.
Owen, David L. 2006. Pinsent Masons Water 2006–2007. Pinsent Masons, London.
Scott, Colin. 2014. Licensing as a Tool of Regulation and Governance. CASS Journal of Law 36 (2): pp. 35–45.
Stern, Jon and Stuart Holder. 1999. Regulatory Governance: Criteria for Assessing the Performance of Regulatory Systems: An Application to Infrastructure Industries in the Developing Countries of Asia. Utilities Policy 8 (1): pp. 33–50.

Realizing the Potential of PPPs to Advance Asia’s Infrastructure Development254
Vandenberg, Paul. 2015. Engaging the Private Sector in Public–Private Partnerships. ADBI Policy Brief. Tokyo: Asian Development Bank Institute.
Wu, Xun, Loit Batac, and Nepomuceno A. Malaluan. 2011. Regulatory Independence and Contract Incompleteness: Assessing Regulatory Effectiveness in Water Privatization in Manila. In Infrastructure Regulation: What Works, Why and How Do We Know? Lessons from Asia and Beyond, edited by Darryl S. L. Jarvis, M. Ramesh, Xun Wu, and Eduardo Araral, Jr. Singapore: World Scientific Publishing.
Wu, Xun and Leong Ching. 2013. The French Model and Water Challenges in Developing Countries: Evidence from Jakarta and Manila. Policy & Society 32 (2): pp. 103–112.
Zhong, Lijin, Arthur P. J. Mol, and Tao Fu. 2008. Public–Private Partnerships in China’s Urban Water Sector. Environmental Management 41 (6): pp. 863–877.

CHAPTER 11
Public–Private Partnership Development in Southeast Asia
Fauziah Zen
IntroductionThis chapter delineates the landscape for infrastructure development in Southeast Asia. Its emphasis is on the financing mechanisms for public–private partnerships (PPPs), which governments across the region are promoting to help close their infrastructure gaps amid limited public resources. The Association of Southeast Asian Nations (ASEAN) needs infrastructure investments of at least $100 billion a year to sustain economic growth, which cannot be fulfilled solely by public funds. The chapter discusses Southeast Asia’s infrastructure ecosystem, the factors that influence the performance of PPPs in the region, and the use of these partnerships in social infrastructure and pro-poor development planning. The focus is on the region’s five countries that are most actively promoting PPPs: Indonesia, Malaysia, the Philippines, Thailand, and Viet Nam.
PPPs in Southeast Asia face challenges on numerous fronts, including inadequate regulatory frameworks and institutional arrangements for their implementation. The problems often stem from incomplete or unclear regulations, the lack of a champion in government to promote PPPs, and not enough or incompatible support. Public stakeholders also lack the capacity to use PPPs. The lack of credible pipelines for infrastructure PPPs has resulted in an inefficient PPP market in Southeast Asia and high uncertainty over the sustainability of offered projects.
Several policy recommendations are offered to help remedy this situation. For PPPs to take off in Southeast Asia, decision makers should focus on offering a few well-prepared PPP projects that can deliver demonstration effects. Across the region, the capacity of national and subnational government agencies dealing with PPPs need to be improved, and multinational development banks can help client governments build this capacity. From a development perspective, PPPs need to be incorporated into poverty alleviation programs. Improving the governance of these partnerships, especially transparency and accountability, is a regional challenge. All countries in the region need to create fiscal space to support their infrastructure development, and here establishing special funds for PPPs could help.

Realizing the Potential of PPPs to Advance Asia’s Infrastructure Development256
Infrastructure Development in Southeast AsiaPPPs are playing an increasing role in helping to meet Southeast Asia’s huge demand for infrastructure, though their level of use varies across countries. PPPs do not play a prominent role in countries where public funds are abundant and public institutions are strong, such as Brunei Darussalam and Singapore. But they are being actively promoted in Indonesia, Malaysia, the Philippines, Thailand, and Viet Nam, where public funds for infrastructure are tight. In these countries, the public sector’s commitment to PPPs and often ambitious PPP project plans are not always in sync; this is particularly the case in Indonesia.
Singapore has the region’s most developed infrastructure, which is on a par with or even better than many advanced economies. As a compact city-state focusing on services, Singapore carefully calibrates its infrastructure to support specific economic demands and constraints. The World Economic Forum’s Global Competitiveness Report 2017–2018 ranked Singapore second in its global competitiveness index and infrastructure ranking, the position it has held since 2012. The country’s institutional environment is closely related to the efficient implementation of infrastructure. The World Economic Forum defines this as influential factors of “investment decisions and the organization of production,” with the institutional environment playing a “key role in the ways in which societies distribute the benefits and bear the costs of development strategies and policies” (WEF 2017). Because PPPs require a supportive business environment that underpins investment decisions, it is important for governments to maintain good and stable macroeconomic conditions. Figure 11.1 shows, as expected, a close correlation between the World Economic Forum’s infrastructure and institutional scores.
Figure 11.1 shows a consistent pattern of close links between macroeconomic and institutional variables and infrastructure development in advanced economies, but this pattern is weak in developing ones. Intuitively, it can be said that infrastructure is needed to foster economic growth and macroeconomic stability, while a healthy business climate, represented by positive macroeconomic conditions and supportive institutional frameworks, will attract more investment, including for infrastructure. Most Southeast Asian countries score highly in the World Economic Forum’s survey, though Indonesia, the Philippines, and Thailand show wide score gaps on infrastructure and institutions. These countries, therefore, have more room to use their favorable macroeconomic performance to attract infrastructure investment.

Public–Private Partnership Development in Southeast Asia 257
Figure 11.1: Infrastructure and Institutions Scores in Asia and the Pacific, 2017–2018
0
1
2
3
4
5
6
7
Scor
e
Infrastructure
Brunei Darussa
lam
Cambodia
Indonesia
Lao PDR
Malaysia
Philippines
Singapore
Thailand
Viet Nam
Australia
Hong Kong, China
Japan
New Zealand
Institutions Macroeconomic
Lao PDR = Lao People’s Democratic Republic.Note: The scores range from 1 to 7, with 7 being the highest.Source: World Economic Forum. 2017. The Global Competitiveness Report 2017–2018. Geneva.
Infrastructure development in Cambodia, the Lao People’s Democratic Republic (Lao PDR), Myanmar, and the Philippines lags far behind the average for East Asia and Pacific in the World Economic Forum survey. Because PPPs are still at an early stage of policy maturity in these countries, most financing for infrastructure come from public funds, including loans and, to a lesser extent, privatization.
Indonesia and Myanmar have both invested heavily in fixed assets (capital formation), though not all these assets are in infrastructure. Even so, data for fixed assets can be used as a proxy for infrastructure investment for these countries. Under the National Medium-Term Development Plan, the country needs to spend Rp5,519 trillion ($409 billion) from 2015 to 2019 to meet its major infrastructure needs; this works out at Rp1,107 trillion ($82 billion) a year, or 9%–10% of the country’s nominal gross domestic product (GDP). The infrastructure needs include 15 airports, 24 seaports, 2,650 kilometers of road, 3,258 kilometers of rail, and bus rapid transit for 29 cities. Indonesia’s state-owned enterprises (SOEs) and the private sector are expected to fund close to 60% of this infrastructure in the plan period.

Realizing the Potential of PPPs to Advance Asia’s Infrastructure Development258
In the Philippines, the Public–Private Partnership Center energetically promotes PPPs. Since 2010, 16 PPP contracts have been awarded, worth ₱332 billion ($6.4 billion). Completed projects include the Mactan-Cebu International Airport Terminal 2, the Ninoy Aquino International Airport expressway in Manila, and the construction of 12,202 classrooms nationwide. Under construction at the time of writing is the Bulacan Bulk Water Supply Project.
In Thailand, 44 PPP projects were underway in transport, logistics, utilities, telecommunication, and property at the end of 2015, according to the State Enterprise Policy Office. The office’s Public–Private Partnership Master Plan, 2015–2019 determines the sectors and types of commercial and social investments for PPPs. These fall into two types: those requiring private sector investment and those encouraging private sector investment.
Malaysia has used PPPs for several big infrastructure projects, mostly in power and transport. From 1983 to 2016, there were 824 PPP projects and privatizations (privatizations are included in the country’s definition of a PPP). These projects cut some 113,000 government jobs and saved the government RM207 billion ($53 billion) in capital expenditure. A drawback of the country’s PPP unit is that it does not have guidelines to manage unsolicited project proposals.
Viet Nam is a newcomer to infrastructure PPPs, although build–operate–transfer projects have been recognized since 1992 in an amendment to the Foreign Investment Law. Since 1990, 83 projects reached financial close. Most PPP projects in Viet Nam are in power and transport.
In all five countries, PPP spending is typically less than 1% of GDP, while public spending in infrastructure varies from 2% to 10% of a country’s GDP (Table 11.1).
Budget spending on infrastructure is largest in Malaysia, Viet Nam, and Thailand. Spending in Indonesia has increased markedly since 2015, though the amount as a proportion of GDP is still low. Caution is needed in comparing the country data in Table 11.1 because the five countries have different definitions of PPPs that are influenced by their systems of government. For instance, government spending may or may not include national and subnational spending, and, as already noted, Malaysia includes privatizations in its definition of a PPP.

Public–Private Partnership Development in Southeast Asia 259
Table 11.1: PPP and Public Spending on Infrastructure in Southeast Asia, 2005–2015 (% of GDP)
Year
Indonesia Malaysia Philippines Thailand Viet Nam
PPP GFCF PPP GFCF PPP GFCF PPP GFCF PPP GFCF2005 0.08 3.05 1.48 9.40 0.32 1.82 0.43 6.24 0.56 5.59
2006 0.11 3.91 1.11 9.56 0.17 1.69 0.31 6.15 0.48 5.30
2007 0.15 3.42 0.98 9.54 0.14 2.07 0.27 6.3 0.19 6.03
2008 0.22 2.99 0.59 9.64 0.12 2.42 0.28 5.82 0.17 5.99
2009 0.18 2.80 0.37 10.08 0.47 2.88 0.30 6.11 0.22 8.51
2010 0.19 2.50 0.14 9.81 0.61 2.87 0.18 5.55 0.33 8.09
2011 0.15 2.85 0.07 9.53 0.61 1.84 0.22 5.00 0.61 6.76
2012 0.20 3.16 0.19 10.50 0.64 2.84 0.29 5.08 0.56 7.60
2013 0.19 3.54 0.26 10.21 0.65 2.58 0.26 5.05 0.49 7.72
2014 0.22 2.96 0.24 9.16 0.40 2.63 0.42 4.58 0.58 6.56
2015 0.19 3.36 0.21 8.81 0.50 3.08 0.31 5.78 0.48 6.38
GDP = gross domestic product, GFCF = gross fixed capital formation, PPP = public–private partnership.Note: General government GFCF, PPP, and GDP in billions of constant 2011 international dollars. Source: International Monetary Fund, Investment and Capital Stock Dataset 1960–2015.
Institutionalizing PPPsPPPs are handled in various ways by Southeast Asian countries. Some define the legal terms of these partnerships and set up dedicated implementing agencies to carry out projects. Others assign certain government agencies to include PPPs in their portfolios. Malaysia, for example, established the Public–Private Partnership Unit under the Prime Minister’s Department in the early 1980s to coordinate projects that have an impact on the economy.
The Public–Private Partnership Center of the Philippines was set up as a one-stop service to handle PPP processes by an executive order in 2010 as an attached agency of the National Economic and Development Authority, the government’s economic planning agency. Thailand set up the Public–Private Partnership Unit under the State Enterprise Policy Office to prepare PPP strategic plans and to evaluate proposed projects. Viet Nam established the Public–Private Partnership Office under the Ministry of Planning and Investment to coordinate PPP projects. Various institutions are responsible

Realizing the Potential of PPPs to Advance Asia’s Infrastructure Development260
for Indonesia’s PPP programs; these include the Coordinating Ministry for Economic Affairs, the National Development Planning Agency, the Ministry of Finance, and line ministries. To speed up priority projects, President Joko Widodo established the Committee for the Acceleration of Priority Infrastructure Delivery in 2014 to coordinate infrastructure policy.
Having several agencies responsible for PPPs can potentially lead to overlaps of authority and prolong processes. The differences in PPP policy frameworks in Southeast Asia are largely influenced by internal variables that include governance systems (for example, decentralized countries have more decision makers and regulations); fiscal capacity; and judicial systems. There is no evidence showing that one system is better than another if the system is efficient and reliable. It arguably does not matter whether a country has a dedicated PPP law or whether PPP legislation is embedded in other laws; the main thing is a strong regulatory environment for PPPs.
Coherent investment policies for PPPs are vital. Incoherent policies confuse potential PPP investors and prolong processes, thereby reducing investor confidence and the government’s credibility. A major complaint from PPP investors in Southeast Asian countries is on changing and discriminative regulations, especially on equity, landownership, and nationality biases.
Public sector capacity is another vital requirement for implementing PPPs effectively, since these are more complex than other types of public investments and require specialized knowledge. Southeast Asian governments tend to treat PPPs like traditional procurements, which results in incompatible restrictions and eliminates the advantages of these partnerships. This typically leads to risk-averse behavior by public agencies wanting to shift PPP project risks to their private partners. In Indonesia, the inability to handle complex PPPs resulted in some projects becoming traditional public procurements or being assigned to SOEs. This happened to a rail link project linking Jakarta’s airport to the city center, which was listed for a PPP but eventually went to an SOE.
Despite different PPP systems, factors common to the success of PPP projects in Southeast Asian countries include coherent PPP policies, officials being knowledgeable on PPPs, and a willingness by the public sector to forge partnerships with the private sector. This is a necessary condition for successful PPP development programs. In Southeast Asia, however, the technical capacity of public agencies is usually not on a par with their private partners, which can complicate negotiations. At the same time, implementing agencies must have sufficient powers to make decisions, lead the PPP process, and decide on timely solutions to problems. A good example of an agency that can do this is the Public–Private Partnership Center of the Philippines,

Public–Private Partnership Development in Southeast Asia 261
which has the full support of the President and, as such, can effectively deal with various sectors across different tiers of government. Malaysia’s Public–Private Partnership Unit is under the Office of the Prime Minister. Other PPP units in Southeast Asia are often under the finance ministry or the national development agency.
Transparency surveys rank corruption as one of the biggest problems in doing business in Southeast Asia’s developing countries. It is, therefore, essential that governments tackle this and other factors undermining a good investment climate. For PPPs, this means making processes transparent and accountable, which can reduce opportunities for corruption. One reason why Thailand embarked on PPPs was to reduce corruption, and a notable piece of legislation for this was transferring the approval process for private participation to the Cabinet under the Private Participation in State Undertakings Act of 1992. The act also created ex ante checks and balances for PPPs (Nonthasoot 2011).
Institutional and Legal Frameworks The institutional and legal frameworks for PPPs are heavily influenced by the fact that governments lead these partnerships. Legal frameworks define the rules for and the role of public sector and private entities participating in PPPs. The government agencies responsible for the process of implementing PPPs determine the efficiency and effectiveness of these rules. A poor performance will not only affect the direct costs for private entities participating in a PPP but also indirect and intangible costs, such as investor confidence and risk perceptions.
Ismail and Haris (2014) show the constraints hindering PPPs in Malaysia are lengthy delays in negotiations, political debates on a project, lack of government guidelines and procedures, high user charges, confusion over government objectives and evaluation criteria, and unsolicited proposals not being regulated within a PPP legal framework. All these problems center on incomplete legal frameworks, inefficient procedures, and the political economy.
Indonesia is reforming its legal framework for PPPs to speed up processes. Since 2010, revised regulations have been issued on the scope of PPPs, land acquisition, and government support for these partnerships by providing viability gap funding, guarantees and availability payments, and setting up the Project Development Facility, which helps the government to prepare infrastructure projects and make them bankable. These measures have enabled some long-delayed projects to reach financial close, and sped up bidding and
Realizing the Potential of PPPs to Advance Asia’s Infrastructure Development262
negotiation procedures. Despite the revised regulations, the number of PPP projects in Indonesia remains low, mostly because of inconsistent actions by public agencies.
In 2013, Thailand enacted the Private Investment in State Undertaking Act, which replaced the 1992 act, to promote PPP investments by institutionalizing the Public–Private Partnership Master Plan and the Public–Private Partnership Committee, the highest authority for PPP strategies, and the Public–Private Partnership Unit, which streamlines PPP procedures, sets timelines for PPP steps, and provides a Project Development Facility. The act also set guidelines for the value-for-money concept for PPPs, small infrastructure projects eligible for these partnerships, and for creating a PPP database.
The Philippines has several notable strong points in its legal and regulatory frameworks for PPPs. The country has clear guidelines on cost–benefit analyses for PPPs, risk assessments, comparative modalities, and directions to structure PPP projects.
Southeast Asia’s Infrastructure Industry Developing infrastructure needs a system whose components link with one another to support that system. This model of an infrastructure ecosystem has three parts—management, construction, and financing—and this forms the basis of the discussion of Southeast Asia’s infrastructure situation (Figure 11.2).
Financing infrastructure is the most challenging part of infrastructure development in Southeast Asia and other emerging regions. Public finance can offer several mechanisms to support PPP projects, such as viability gap funding, tax allowances, and revenue and loan guarantees. To avoid breaching good governance principles, these mechanisms are determined by regulations, typically benchmarked to international standards. A private sector partner who awarded a PPP project will need to raise funds by using equity and making loans to maximize financial returns. This demand is filled by financial providers, such as equity firms, investment banks, creditors, and sponsors.

Public–Private Partnership Development in Southeast Asia 263
Figure 11.2: The Infrastructure Ecosystem
Intermediaries/Support System
Advisors (legal, project management, financial) Channel (capital market, negotiator, banks)
Financing• Financier• Creditor• SponsorRegulatory Framework
Management• Owner• Operator• Users
Construction (EPC)• Civil• Mechanical engineering
EPC = engineering, procurement, and construction. Source: Author.
In developed economies, financiers are abundant and excellent support systems are in place for PPPs. In developing Southeast Asia, however, there are not enough participants to make the infrastructure industry ecosystem work efficiently. For instance, the size of local currency bond markets in Indonesia, Malaysia, the Philippines, Singapore, Thailand, and Viet Nam is very small compared with Japan and other advanced economies (Table 11.2). As of November 2017, the total local currency bonds in these six emerging markets was only $1.22 trillion compared with Japan, at $10.18 trillion.

Realizing the Potential of PPPs to Advance Asia’s Infrastructure Development264
Table 11.2: Size and Composition of Local Currency Bond Markets in Select Countries
($ billion)
Q3 2017 Indonesia Malaysia Philippines Singapore Thailand Viet Nam JapanTotal 180 299 102 265 330 46 10,178
Government 153 159 83 162 239 44 9,482
Corporate 27 140 20 103 91 2 695
Q = quarter.Source: Asian Development Bank. 2017. Asian Bond Monitor. Manila (November).
The Economist Intelligence Unit’s 2014 Infrascope report, which analyzed the readiness of countries in Asia and the Pacific to deliver sustainable PPPs, provides scores on 19 indicators of PPPs. These fall into six categories: legal and regulatory frameworks, institutional frameworks, operational maturity, investment climate, financial facilities, and subnational adjustment factors. This is a useful resource for countries to gauge the effectiveness of their PPP processes, and the results will likely reflect a country’s stage of development and economic structure. The ability of countries to efficiently implement infrastructure PPP projects differs from sector to sector. Power generation is usually less complicated because outputs are set out in the PPP and purchasing agreements. But toll roads, especially where they include environmental sustainability components, require lengthier assessment processes and robust demand estimations. If a project is urgently needed, the easiest way is through public procurement or having an SOE carry it out. Several infrastructure projects in Indonesia are being implemented by SOEs through direct assignment.
Closing Infrastructure GapsClosing infrastructure gaps is rising on the development agendas of countries across Southeast Asia. This section looks at the infrastructure programs of four countries: Indonesia, Malaysia, the Philippines, and Thailand.
Indonesia
Since the Asian financial crisis, Indonesia’s infrastructure spending growth has been less than its economic growth, leading to a decreasing stock of infrastructure as a percentage of GDP (Figure 11.3). Having only a small budget for infrastructure means that spending on new projects has been insignificant (and even lower than the allocation for maintaining infrastructure). This situation, combined with an ineffective policy for prioritizing infrastructure projects, has hampered economic growth, and is manifested in congested

Public–Private Partnership Development in Southeast Asia 265
roads in towns and cities, high logistics costs, and electricity blackouts. Indeed, Indonesia has built almost no new infrastructure outside Java Island since the Asian financial crisis. But that situation has been changing since 2015.
Figure 11.3: Infrastructure Stock in Indonesia, 1995–2015
0
15
30
45
60
75
0
1
2
3
4
5
% of
GD
P
Cons
tant
200
0 Rp
(tho
usan
d tr
illio
n)
State-owned enterprise Private
Local government Central government
Total infrastructure capital stock (% of GDP)
1995 1996 1997 1998 1999 2000 2001 2002 2003 2004 2005 2006 2007 2008 2009 2010 2011 2012 2013 2014 2015
GDP = gross domestic product, Rp = rupiah.Note: Capital stock estimated using the perpetual inventory method, assuming 5% depreciation rate.Source: Australia Indonesia Partnership for Economic Governance.
Since taking office in 2014, President Widodo has emphasized the significant role that infrastructure plays in the country’s economic development—a departure from his predecessor’s stance—and has pledged to develop infrastructure, particularly outside Java Island. He has abolished energy subsidies and allocated significant funding for health, education, and infrastructure. Although accelerating infrastructure is a top agenda of the Widodo administration, PPPs in Indonesia are still often complex and require long lead-in times before getting underway. Table 11.3 shows the National Development Planning Agency’s projections for the country’s infrastructure plan over 2015–2019, based on three scenarios.

Realizing the Potential of PPPs to Advance Asia’s Infrastructure Development266
Table 11.3: Indonesia’s Priorities and Financing Needs, 2015–2019 (Rp billion)
Infrastructure Plan
Infrastructure Financing
Needs 2015–2019
Scenario 1: Full
Scenario
Scenario 2: Partial
ScenarioScenario 3:
Baseline
New roads: 2,650 km Roads 1,274 851 637
Highway: 1,000 km Rail system 278 222 140
Road maintenance: 46,770 km
Urban transport 155 115 75
Bus corridors: 2 Sea transport 563 424 282
New seaports: 24 Ferry and other water transport
91 80 60
Seaport development: 59
Air transport 182 165 100
Pioneer cargo ships: 26
Electricity 1,080 762 714
New airports: 15 Energy and gas 535 420 268
Airport infrastructure development
Water resources 1,091 845 645
Airplanes: 20 Water and sanitation
666 450 330
Rail lines: 2,159 km Public housing 384 247 180
Intracity rail lines: 1,099 km
Information and communication technology
242 200 130
Total 6,541 4,781 3,561
km = kilometer, PPP = public–private partnership, Rp = rupiah, SOE = state-owned enterprise.Note: SOEs and PPPs are expected to fill the funding gap since the central government can only fulfil about 40% of the financing needs of its infrastructure plan.Sources: Ministry of Finance, Government of Indonesia. 2016. State Budget for the 2016 Fiscal Year. Jakarta; and National Development Planning Agency, Government of Indonesia. 2014. National Development Agenda 2015–2019. Jakarta.
In 2015, the government announced that several infrastructure projects that were initially assigned to SOEs would be done as PPPs, with the public funds freed up from this being allocated to necessary but nonviable projects that would be built by SOEs. As part of this effort, several long-abandoned infrastructure projects—for example, transprovincial roads and rail links on the islands of Kalimantan, Sulawesi, Sumatera, and Papua—have been completed

Public–Private Partnership Development in Southeast Asia 267
or nearly completed. The national government also provides special transfers to subnational governments to build infrastructure. This funding, however, has increased the national debt, though it is still manageable at below 27% of GDP.
The Philippines
President Rodrigo Roa Duterte’s administration launched in 2016 a 10-point socioeconomic agenda that includes accelerated infrastructure spending in which PPPs play a key role. The administration’s “Build, Build, Build” infrastructure drive focuses on transport programs, new master plans for cities, and digital infrastructure. The administration plans to increase public spending on infrastructure over its 2017–2022 term, starting with at least 5% of GDP in 2017 and increasing this to 7.1% by 2022.
The infrastructure program aims to make the approval process easier for PPPs by cutting red tape; for example, by eliminating the need for approvals by the National Economic and Development Authority and the Investment Coordination Committee for projects under ₱5 trillion ($96 billion). Under the program, the social discount rate—the interest rate used in public projects—was lowered to 10% from 15%, and funding increased to regional development councils and local governments for feasibility and engineering studies for infrastructure projects (NEDA 2016).
The infrastructure drive is mainly handled by the National Economic Development Authority, the Department of Transportation, the Department of Public Works and Highways, and the Bases Conversion and Development Authority, a government-owned corporation under the Office of the President mandated to transform former United States military bases into productive facilities for civilians. As a key infrastructure agency, public works and highways received a 30% budget increase to ₱397.1 billion ($7.6 billion) for its 2016 fiscal year, and that amount is scheduled to rise to ₱637.9 billion ($12.28 billion) in 2018. The Duterte administration expects the infrastructure drive to create 2 million jobs and a further 730,000 jobs from the new master plan for cities.
Malaysia
Malaysia consistently spends more on infrastructure as a percentage of GDP than any other country in Southeast Asia, and this has been above 9% for almost all fiscal years since 2005, except 2015. The country’s infrastructure programs are part of its 5-year national development plans; the Eleventh Malaysia Plan, 2016–2020 is titled Anchoring Growth on People. The plan, prepared by the Economic Planning Unit of the Prime Minister’s Department, has six strategic thrusts: (i) enhancing inclusiveness, (ii) improving well-being for all,

Realizing the Potential of PPPs to Advance Asia’s Infrastructure Development268
(iii) accelerating human capital development to become an advanced nation, (iv) pursuing green growth for sustainability and resilience, (v) strengthening infrastructure to support economic growth, and (vi) reengineering economic growth for greater prosperity. The fifth strategic thrust focuses on building an integrated, needs-based transport system; promoting the growth of logistics; enhancing trade facilitation; improving the coverage, quality, and affordability of digital infrastructure; continuing water services reforms; and encouraging sustainable energy use.
The government expects that planned mega infrastructure projects will make Malaysia a RM2 trillion ($505 billion) economy by about 2025. These projects include the Kuala Lumpur–Singapore High Speed Rail project, the Pan Borneo Highway, the East Coast Rail Link, Bandar Malaysia, and Vision Valley.1 The government is providing tax incentives to attract a targeted RM6.5 billion ($1.5 billion) in infrastructure investments and to create 14,000 jobs until 2025.
Thailand
Thailand’s Transport Infrastructure Development Master Plan, 2015–2022 plans to invest B1.9 billion ($54 million) in the sector. Among its big-ticket projects are upgrading the country’s rail network, building a double-track railway to the border with the Lao PDR, building four-lane highways connecting growth centers with border areas, extending Bangkok’s metro rail transit, and building seaports on the Gulf of Thailand and the Andaman Sea.
As well as the master plan, Thailand launched an annual Investment Action Plan in 2015: that year’s plan had 59 projects totaling B848 billion ($24.0 billion). Of this, B56 billion ($1.6 billion) was disbursed in 2015, with the rest to be spread up to 2022. The action plan for 2017 has 36 new projects and seven continued projects from the 2016 plan. The 36 projects, worth B905 billion ($25.6 billion), are all in transport and include 10 double-track rail network projects, five motorway and expressway projects, and three projects each for maritime and air transport. The government expects all the projects in the 2017 action plan to be financed through loans (65%); PPPs (26%); the budget (6%); the Thailand Future Fund, a government infrastructure fund (2.5%); and SOEs (0.2%).

Public–Private Partnership Development in Southeast Asia 269
Approaches to PPPs in Southeast Asia Infrastructure investments are typically large, with stable but modest returns. When investors deal with governments in Southeast Asia and other emerging economies with less mature PPP policies, they face a higher risk of changing regulations or being guided by unclear rules. A potential investor in an infrastructure PPP in these markets will often spend many months and a great deal of money to land a contract. But even having done this, it is not unusual for the bidding to be cancelled or postponed, and no reason given. Pitfalls such as these lead to high sunk-costs in many infrastructure PPP projects in Southeast Asia. Contracts, as much as legal and regulatory frameworks, therefore, play a significant role in securing a finalized PPP deal.
Infrastructure projects in the region face two high-profile challenges: lack of capacity in the public sector to handle PPPs, which is discussed later in the chapter, and underdeveloped financial markets. Because of this, potential funds for infrastructure are not being tapped because there are no capital market mechanisms to channel them. As a result, large institutional investors, such as pension funds and insurance companies, have less opportunity to diversify their portfolios into infrastructure projects. The absence of this potential avenue for financing infrastructure is an added difficulty for governments promoting PPPs to help close Southeast Asia’s infrastructure gaps, and will likely remain so for some time, given the slow progress being made in developing countries’ capital markets. It should be noted, however, that a well-developed local capital market increases a country’s exposure to global financial risks, which many governments in developing countries are trying to avoid. So far, Southeast Asia’s emerging capital markets have relatively little foreign participation, except in Indonesia and Malaysia.2
Variations in implementing PPPs depend on the maturity of national policies for these partnerships, but there are three basic stages (Table 11.4). Countries at the initial stage mainly use PPPs to fill infrastructure financing gap, including privatizing state assets. At the intermediate stage, countries focus on construction and operation, including management and services contracts. At the mature stage, countries tap into the advanced benefits of PPPs, such as innovation in design and technology. In Southeast Asia, Singapore is at the mature stage; Indonesia, Malaysia, the Philippines, and Thailand are at the intermediate stage; and Cambodia, the Lao PDR, Myanmar, and Viet Nam are at the initial stage.

Realizing the Potential of PPPs to Advance Asia’s Infrastructure Development270
Table 11.4: PPP Implementation Stages Based on Policy Maturity
Transaction Type
Initial or Early
StageIntermediate
StageMature
Stage
Privatization of state enterprises X
Privatization of state assets X
Privatization with residual interests X
Private finance initiative X X X
Build–operate–transfer, build–own–operate, and build–own–operate–transfer contracts
X X X
Design–renovate–build–operate contracts
X X X
Operation and maintenance contracts X X X
Design–build–finance–operate contracts X X X
Renovate–build–operate contracts X X X
Concessions X X X
Management and service contracts X X
Traditional construction contracts
PPP = public–private partnership.
Source: Fauziah Zen and Michael Regan, eds. 2015. Financing ASEAN Connectivity. Economic Research Institute for ASEAN and East Asia Project Report 2013–2015. Jakarta.
Infrastructure PPPs in Southeast Asia are not—at least for the time being—going to be marked by technical or financing innovations given the resources. Because of this, governments need to set realistic expectations on their PPP targets, improve PPP systems and the capacity of agencies to handle these partnerships, and work on narrowing their infrastructure gaps.
Within this context, Southeast Asia can be divided into countries with more-developed PPP systems (Indonesia, Malaysia, the Philippines, Singapore, and Thailand), and countries with less-developed systems (Brunei Darussalam, Cambodia, the Lao PDR, Myanmar, and Viet Nam). For infrastructure financing, four main factors determine a project’s attractiveness, options, and size of financing:
• Stage of economic development. This determines the types of available projects, economic demands, and the fiscal and knowledge capacities to carry out a project.
Public–Private Partnership Development in Southeast Asia 271
• Fiscal management. This determines the capacity to provide fiscal support, guarantees, cofunding, and securing loans for infrastructure financing.
• Capital market development. This determines the confidence level to invest in a project and the available financing channels, especially for long-term investors.
• Regulatory framework. This determines the ease of investing in a PPP, the level of secured investments, and cost efficiency.
Southeast Asian countries belonging to the more-developed PPP group have similarities: they typically have the fiscal capacity to secure loans and cofund infrastructure projects. These countries have mature fiscal management systems that reduce the potential to default, and they provide support for infrastructure projects. The capital markets of some of these countries are already at a mature stage, enabling the participation of institutional investors in PPPs. The legal systems of this group are generally complete, clear, and predictable. This group’s main challenge is to accelerate the strengthening of their PPP systems, though this could be complicated by political economy factors; for instance, changes that require approval from legislatures or political deals during the election cycle. The demand for infrastructure is strong in Southeast Asia’s more developed economies, especially in urban areas and from a growing middle-income class. This will likely continue, given the region’s strong economy and political stability.
Demand for infrastructure tends to be lower in countries in the group with less-developed PPP systems, with the level influenced by population size, geographical challenges, and purchasing power. The PPP systems of these countries are also shaped by their stage of development, since this determines the types of infrastructure to be prioritized. Some countries in this group have narrow fiscal capacity, debt management problems, and less macroeconomic stability. These countries also do not have an investment grade rating, and their capital markets are at an early stage of development or do not exist. Before they can make progress on their PPP systems, they need to improve their investment climate. Table 11.5 shows the countries in the two groups in the World Economic Forum’s 2017–2018 Global Competitiveness Index.

Realizing the Potential of PPPs to Advance Asia’s Infrastructure Development272
Table 11.5: Global Competitiveness Index 2017–2018 Rankings for Southeast Asia
Rank Economy Driver Room for Improvement3 Singapore Innovation None23 Malaysia Transition from
efficiency driven to innovation driven
Higher education, innovation
32 Thailand Efficiency driven Institutions, health, primary and higher education, labor market, and innovation
36 Indonesia Efficiency driven Institutions, infrastructure, health, primary and higher education, market efficiency, and innovation
56 Philippines Transition from factor driven to efficiency driven
Institutions, infrastructure, health, primary and higher education, market efficiency, and innovation
46 Brunei Darussalam
Transition from factor driven to efficiency driven
Institutions, macroeconomic environment, infrastructure, higher education, market efficiency, and innovation
55 Viet Nam Transition from factor driven to efficiency driven
Institutions, macroeconomic environment, infrastructure, health, primary and higher education, market efficiency, and innovation
94 Cambodia Factor driven Institutions, macroeconomic environment, infrastructure, health, primary and higher education, market efficiency, and innovation
98 Lao PDR Factor driven Institutions, infrastructure, health, primary education, macroeconomic environment, market efficiency, and innovation
Lao PDR = Lao People’s Democratic Republic.Note: Rankings out of 137 economies. Myanmar is not included in the 2017–2018 index.Source: World Economic Forum. 2017. The Global Competitiveness Report 2017–2018. Geneva.
The ability of government institutions to handle infrastructure PPPs is a challenge for most countries in Southeast Asia. Because many PPP projects are large, they often require complex financial structures and involve several stakeholders, including central government and local authorities. Against this demanding backdrop, governments must nurture their infrastructure ecosystems to create complete PPP markets. The tendency in Southeast Asia is for governments to create new agencies to tackle unperformed PPP tasks
Public–Private Partnership Development in Southeast Asia 273
instead of pushing the responsible agency to perform better. As a rule, large government units handling PPPs result in more complex PPP mechanisms.
Southeast Asian countries should consider using the learning-by-doing approach—a country picks a priority project and makes it a showcase one—for their infrastructure PPPs. Here, cross-border projects are a good opportunity to share knowledge, gain economies of scale, and impose the same standards for all stakeholders. By doing this, governments will see the areas that need improving and the regulations that are missing or are insufficient. They will also be able to identify the skills that agencies will need to carry out PPPs, with these agencies gaining valuable experience by working on projects with the private sector. Despite these benefits, cross-border PPP projects are more complicated because of the involvement of numerous stakeholders with different interests, capacities, and legal systems. Multilateral development banks can help address these inconsistencies, as they did in the Nam Theun 2 hydropower project in the Lao PDR, which produces power for export to Thailand. In this project, the Asian Development Bank and the World Bank provided political risk insurance that lowered project risks, increasing the confidence of financiers.
Risk Management and Support
Managing risks to PPPs is essential for preventing potentially large and long-term damage to projects. A vital element of PPP risk management is the ability of governments to choose optimum trade-offs among schemes to maximize benefits, minimize risks, and assess future risks. Governments tend to lean toward risk-averse choices, leaving their private sector partners in such a risky position that negotiations can fail or governments end up bearing excessive liabilities, which will likely reinforce their adversity to risk.
The assessment of future liabilities is complex, since it is not only determined by the capabilities of involved entities but also by external factors, such as macroeconomic conditions and changing economic structures. To anticipate this, Indonesia set up the Directorate of Government Support and Infrastructure Financing Management under the Ministry of Finance’s Directorate General of Budget Financing and Risk Management. In setting up the unit, the government recognized that PPPs could expose the state budget to contingent liabilities that could turn into future fiscal risks. The unit, however, does not have a special risk- mitigation agency to monitor PPP projects, a similar situation to other countries in the region. Instead, risk mitigation is done during the procurement process. That no mitigation mechanisms are used during project implementation is a worrying omission because problems can occur at any stage of the process. It is important that problems are fixed to prevent them from turning into a series of failures that can collapse an entire project.
Realizing the Potential of PPPs to Advance Asia’s Infrastructure Development274
Getting Momentum Going for PPPs
Although PPPs are playing an increasing role in infrastructure development in Southeast Asia, the pace has been sluggish since about 2010, even in the Philippines, which is energetically promoting them (Table 11.1). Among the handicaps are (i) poor project pipelines; (ii) ineffective legal systems; (iii) lack of public sector capacity to assess risk sharing and incentives, and to negotiate PPP deals; and (iv) lack of supportive financial markets. Because of these obstacles, decision makers in the public sector, as mentioned earlier, may simply decide not to go the PPP route and fund infrastructure through state budgets or assign them to SOEs. But a drawback of using SOEs for this is that they crowd out the private sector.
The difficulty faced by governments with either no or only a few successful PPP projects behind them is how to get momentum for these investments going. Some governments start with concessions or affermage, leases, and renovate-operate-transfer contracts. The main objective is to the upgrade infrastructure and shift the burden of operation from the public to the private sector. Thailand, at the time of writing, was offering an operation and maintenance scheme for its Bang Pa-In—Nakhon Ratchasima and Bang Yai—Kanchanaburi intercity motorways. And Indonesia is selling the government-funded Bekasi—Kampung Melayu toll road in Greater Jakarta.
Poor project pipelines are a major factor for the slow implementation of infrastructure PPPs in Southeast Asia. The Public–Private Partnership Center of the Philippines is trying to address this by providing potential investors with detailed project information, as this can affect the cost of bidding and investor confidence. Typical investor turnoffs are poorly prepared projects or changing the status of a project; for example, canceling the tendering process in a PPP, causing bidders real financial loss. In Indonesia, bidders spend from $5 million to $10 million to participate in a tender.3 Credible project pipelines with clear timelines are imperative for ensuring that investors have confidence in a country’s PPP system.
Various financing options can be used to attract investors to PPPs, such as incorporating future incremental land value into a project’s valuation and financing projects by adding future tax increments, which are widely used by municipalities in the United States for infrastructure. Land value capture has been used to increase the attractiveness and benefits of urban rail transit development projects in Singapore; Hong Kong, China; and Tokyo. Using land value capture as a financing option requires a systematic approach rather than opportunistic exploitation. Projects using this should be viewed as part of a program and not as an independent entity, since the expected benefits depend on other linked factors.

Public–Private Partnership Development in Southeast Asia 275
PPPs to Support the Master Plan on ASEAN Connectivity 2025
PPPs have an important role to play in ASEAN’s efforts for greater connectivity across its 10 member states, and as one approach to advancing the region’s infrastructure development. In 2016, ASEAN leaders adopted the Master Plan on ASEAN Connectivity 2025, which focuses on five strategic areas: infrastructure that can help sustain economic growth, digital innovation, seamless logistics, regulatory excellence, and people mobility. The sustainable infrastructure strategy has three objectives: increasing public and private infrastructure investment in each ASEAN member state, significantly enhancing the evaluation and sharing of best practices on infrastructure productivity in ASEAN, and increasing the deployment of smart urbanization models across ASEAN.
To achieve the first objective, the master plan proposes that a priority list of potential ASEAN infrastructure projects and sources for their financing be drawn up. Having such a list would improve market confidence and the capability gaps associated with developing a strong infrastructure pipeline. Since the master plan’s adoption, no progress has been made on this initiative. But this is understandable, given the complexities of PPPs and the loose relationships between ASEAN member states. For the project list, the master plan contains the incomplete projects of the plan it succeeds. The Master Plan on ASEAN Connectivity 2010 had 52 projects in four strategic areas: the ASEAN Highway Network, the Singapore–Kunming Rail Link, an integrated multimodal transport system, and the ASEAN Single Aviation Market.
The Potential of PPPs for Social InfrastructureUsing PPPs for social infrastructure is a relatively new concept in Southeast Asia. But this is an attractive solution to help close the supply–demand gap for social infrastructure, especially given the increasing demand for hospitals, schools, training centers, and other social infrastructure, and the limited public funds and capacity to build these facilities. Governments hope that, if the private sector can finance, design, build, and operate infrastructure efficiently, they will be able to devote more resources to areas that cannot be delegated to the private sector. The efficiency argument for PPPs is valid in advanced economies since these partnerships require well-developed policies for their implementation. In Southeast Asia and other emerging regions, PPPs are mainly used to fill financing gaps in infrastructure demand, and their use for social infrastructure is still limited.
Indeed, the only social infrastructure PPP projects that have been successfully implemented in the region seems to have been in the Philippines,

Realizing the Potential of PPPs to Advance Asia’s Infrastructure Development276
where schools and other education facilities have been built using this modality. Malaysia offered the Umum Sarawak Hospital Project as a PPP in 2012, though this was more a partial privatization through a management contract than a regular PPP with a life-cycle contract. No information at the time of writing was available on the project’s status. In 2017, Indonesia was considering PPPs for upgrading 12 hospitals, and four of these projects were listed in the country’s 2018 PPP book as being “under preparation.” Thailand is also trying to use PPP for its health sector.
PPP for social infrastructure can have many configurations. But whatever the configuration, the most important elements are output-based service delivery, private sector participants taking on some risks, and partnerships that cover a project’s life cycle. Social infrastructure PPPs are typically medium-sized. Because education and health care are usually local responsibilities, the public agency in charge of them tends to be subnational. This is an opportunity to develop PPPs at the local level, though these projects can be difficult because they require capacities that subnational governments may find difficult to provide.
Medium-sized social infrastructure PPPs are generally held to be simpler to implement than large-scale ones, though this is not always the case. PPPs regardless of size require complex procedures, including legal processing and technical requirements. High administrative and legal costs mean that drafting PPP contracts cannot be justified for projects below a certain size. Because of these constraints, interest is growing in “lite PPPs,” which simplify procedures without sacrificing prudent action (Zen and Regan 2015).
Pro-Poor PPPs
Building infrastructure accessible to the poor can have a transformational effect on empowering disadvantaged groups. Figure 11.4 shows the types of basic infrastructure that are fundamental for this process. Pro-poor PPPs do not differ much from other PPP modalities. Because output-based performance is a feature of a pro-poor PPP, the measures to gauge project success are straightforward. By contrast, traditional public procurement often uses variables that are neither necessary nor sufficient for measuring project success. For example, the cost of capital from a state budget is always considered zero, and therefore, no comparison can be made with a project’s opportunity costs. Another example is when risks, especially future or contingent risks, are not monetized and included in the total project cost. This makes it incomparable with other modalities, such as privatization.

Public–Private Partnership Development in Southeast Asia 277
Figure 11.4: Basic Infrastructures for Empowering People
Empowerment
Knowledge accumulation
Education Information
Health care
Nutrition Health-care facilities
Water and sanitation
Support for productivity
Transportationor logistics Electricity Market-
places Irrigation
Source: Author.
The need to expand pro-poor infrastructure in Southeast Asia is huge, particularly in health, education, and water and sanitation, where development indicators are lagging behind. In education, Southeast Asia is underachieving in primary enrollment (Brunei Darussalam, Indonesia, and the Philippines), and reaching the last grade (Cambodia, Indonesia, the Lao PDR, Myanmar, and the Philippines). Telecommunication, internet, and broadcasting infrastructure can be used to support both formal and informal education. Upgrading and expanding water and sanitation systems are sorely needed in many countries—a process that could be accelerated if there was greater private sector participation in delivering this infrastructure. In 2015, 300 million people in the region did not have safe drinking water and 1.5 billion lacked basic sanitation (UNICEF and WHO 2015). Bringing economic development to remote areas remains a challenge in much of Southeast Asia. According to IEA (2017), 65 million people, 10% of the region’s population, are without access to electricity. Renewable and clean energy, and micro, small, and medium-sized power plants—all areas in which companies are active—can help meet this demand. The private sector has a role to play in developing conventional markets for goods where small producers and farmers have access to markets without having to rely on lengthy supply chains.
Progress made in increasing the participation of the private sector in these and other pro-poor infrastructure areas will not, in themselves, be sufficient to reduce poverty. For this to happen, infrastructure must be accessible to the poor to legally use without exclusion, and it must be affordable (and again, in a way that can be used or consumed legally). This infrastructure must also be efficient in that it offers no incentives for overconsumption.
There are no conflicting principles between pro-poor and other types of PPP systems because infrastructure projects fulfill the following three basic

Realizing the Potential of PPPs to Advance Asia’s Infrastructure Development278
principles: First, the government must have a solid argument for investing in the infrastructure, which should benefit the economy. From a public sector standpoint, the cost–benefit analysis of an infrastructure project should use an economic rather than financial approach. But this analysis can, to some extent, cover pro-poor and other social aspects, which are typically intangible if the data and method permit. It is not important that financial cost–benefit analysis results show a negative net benefit, but it is important that the socioeconomic cost–benefit analysis is positive. If it is, governments are justified in investing in a project, subject to other spending priorities.
Second, government contracting agencies must understand PPP principles and procedures, especially on legal frameworks, contract management, risk sharing, fiscal support, and negotiating with private sector partners. Technical capacity can be outsourced if needed; this is a pragmatic approach to improve the capabilities of government, especially subnational governments who are directly responsible for local welfare. Contracting agencies should balance their socioeconomic objectives with private returns to achieve mutual benefits. And third, it is important that governments listen to the views of all stakeholders in a PPP project, especially users. Here, contracting agencies should understand the real condition and demands of users, particularly for pro-poor projects, where the government must be particularly sensitive to purchasing ability and the dynamics of migration.
Because a pro-poor infrastructure program is based on an output or outcome policy, it can be developed either by traditional procurement or a PPP as long as socioeconomic output is maximized. In theory, PPPs are more public resource efficient than traditional procurement because, by their very nature, they enforce market discipline (targeted beneficiaries rather than public subsidies), provide opportunities for knowledge transfer, and enhance transparency and accountability. A company participating in a pro-poor project shows that it is socially responsible, and pro-poor projects make economic sense because better welfare means a higher potential for project users to become consumers.
Having a sound economic cost–benefit analysis can increase transparency, improve understanding and skills, and enhance opportunities for having better mechanisms to choose the right project modality. The main challenge of this method is usually data availability and questionable methodologies. A flawless cost–benefit analysis, however, is not a requirement. But public discourses on planned infrastructure projects are needed because they are vital for project planning. Social sectors that are seen as having a large impact on reducing poverty and improving welfare include primary and secondary education, education-related services, health care, and public transport. Infrastructure projects in these sectors usually encounter the least resistance from stakeholders and the public because their benefits are clear—and these are best-suited for pro-poor PPP projects.

Public–Private Partnership Development in Southeast Asia 279
In Southeast Asia, huge financial resources will be needed to provide the basic infrastructure services to make meaningful inroads into reducing poverty—not only to build infrastructure but also to provide subsidies for the poor to be able to use these services. Reaching the poor and vulnerable in distant and isolated communities is especially expensive, and inadequate data on these groups makes it hard for them to be identified. There are two main ways to avoid the exclusion of the poor from using infrastructure services. First, PPP operators charge affordable prices for these services and receive payments from the government to sustain their businesses up to an amount agreed in their contracts; these are called availability payments. In the school infrastructure PPP project in the Philippines, private partners designed, financed, and built classrooms in return for a 10-year lease contract before the facilities were transferred to the government. The private partners received availability payments throughout the leasing period for the upkeep of the classrooms. And second, PPP operators charge the full price for a service, and poor consumers receive direct subsidies from the government to be able to use them.
The challenge of pro-poor PPPs is the low purchasing power of the end users, which means that project revenue streams cannot rely on user fees without government subsidies. Using subsidies as part of pro-poor PPP financing schemes may create the problems of mistargeting or inefficient allocation. Indeed, subsidies often end up benefiting the better-off rather than the poor because of poor targeting. The amount of subsidy is subject to negotiation, but once set, they are often difficult to adjust later.
Because pro-poor PPP projects require public funds, they need continuous government support throughout their life cycle. As such, they are investments in human capital to strengthen a country’s socioeconomic foundations. Using PPPs for this purpose can also bring greater efficiency, transparency, accountability, and value for money to government poverty-alleviation programs. Realistically, however, it is unlikely that there will be many pro-poor PPP infrastructure projects in Southeast Asia in the medium term, because of budget constraints and the complexity of this modality. That said, PPPs can be pro-poor, as the following example from Indonesia shows.
Case Study of a Pro-Poor PPP: Umbulan Water Supply System Project
This project, in East Java Province, aims to provide water services to the poor at an affordable price. Only 75% of the province’s population is served by a water supply system, and expanding coverage is essential to the national government’s objective to reduce poverty and inequality.
The initial idea for Umbulan goes back to the 1970s, but it was not until 2010 that it was tendered, with procurement completed in 2015. That the

Realizing the Potential of PPPs to Advance Asia’s Infrastructure Development280
project finally got underway was because the national government registered it as a national strategic and priority project. The project was led by the coordinating minister for economic affairs. Project stakeholders include an SOE in infrastructure financing, PT Sarana Multi Infrastruktur; the Province of East Java; and cities and municipalities in the service area.
The project aims to serve 1.3 million people in the province with 93 kilometers of water transmission pipe, at an estimated cost of Rp2.05 trillion ($143 million). Because local governments and a private consortium of local companies were only able to finance 60% of the project, the national government provided fiscal support in recognition of the project’s importance to its poverty-alleviation goals, and to make this a showcase PPP. The Ministry of Finance provided Rp818 billion ($57 million) through viability gap funding to ensure an affordable tariff for the water. SOE Sarana Multi, through the Project Development Facility, helped the provincial authorities prepare and carry out project transactions. The provincial authorities, for their part, bought the land used in the project. The financing was structured to deliver a bankable and fiscally sound project, which reached financial close in December 2016.
The concession period is 25 years. The project is scheduled to start operating in mid-2019, its revenue stream coming from user fees. As well as the national government’s direct contribution through the Ministry of Finance, the Indonesia Infrastructure Guarantee Fund, an SOE providing guarantees for contingent liabilities, provided a guarantee to enhance the credit of the special purpose company. Figure 11.5 shows the project’s transaction scheme.
Once the project is operational, there will be a substantial decline in water tariffs that will make the supply of clean water far more affordable in the service area. The local water company currently sells water at Rp3,331 per cubic meter (m3) ($0.25) but cannot meet the demand, and private suppliers at Rp36,000/m3 ($2.70) or nearly 11 times the local water company’s price. The new price proposal after the project’s completion ranges from Rp2,510/m3 ($0.20) and Rp6,860/m3 ($0.50), depending on the distance from the plant.
The Umbulan Water Supply Project offers several lessons for promoting pro-poor infrastructure PPPs in Southeast Asia. It shows that well-led coordination among stakeholders can get long-delayed projects moving, as this one was. The project is a good example of the benefits of credit- enhancement and fiscal support through viability gap funding—made possible by the issuance of various regulations and decrees, including a presidential regulation. Registering Umbulan as a national strategic project and priority project showed the strong commitment of the national government to this project. That commitment, however, is hard to secure if the number of projects

Public–Private Partnership Development in Southeast Asia 281
exceed a government’s capacity to handle them; hence, it is essential to provide a feasible project pipeline. The project also highlights the importance of doing a thorough feasibility study; Umbulan’s was done with the assistance of an SOE, which contributed to the project’s financial structuring to make it bankable.
Figure 11.5: Umbulan Water Supply Project Transaction Scheme
Ministry of Public Works Ministry of Finance
IIGF
SPVProvince
PDAB (o�taker)
PDAMs
PT. SMI
GuaranteePremium payment
Tari� payment
Tari� payment
11
1 9
28
73 4
5
610
12
Bulk water
Cities/municipalities
IIGF = Indonesia Infrastructure Guarantee Fund, PDAB = Perusahaan Daerah Air Bersih (regional bulk water company), PDAM = Perusahaan Daerah Air Minum (local water company), PT SMI = Sarana Multi Infrastruktur, SPV = special purpose vehicle.
Notes:1. Assignment from finance minister to PT SMI to do project preparation 2. Cooperation between provincial government and PT SMI to facilitate project preparation 3. Cooperation between provincial government and municipalities/cities 4. Build–operate–transfer contract between provincial government and the SPV 5. Assignment from provincial government to PDAB to become offtaker6. Bulk water supply contract between PDAB and PDAMs 7. Guarantee agreement between IIGF and SPV8. Regress agreement between provincial government and IIGF 9. Viability gap funding provided10. Support from municipalities/cities to PDAMs for bulk water payment 11. Support from the Ministry of Public Works in the form of partial construction, if needed 12. Support from the Ministry of Public Works to PDAMs
Source: Provincial Government of East Java. 2016. Mengalirkan Air Umbulan Sejahterakan Masyarakat. Surabaya.

Realizing the Potential of PPPs to Advance Asia’s Infrastructure Development282
Recommendations for PPP Policy Frameworks in Southeast AsiaAlthough PPP polices across Southeast Asia are at various stages of maturity, the following recommendations are offered to help strengthen the policy frameworks of infrastructure PPPs:
Conducive business environment. Strong macroeconomic fundamentals are vital to attract private sector investment. It is important for Southeast Asia’s developing countries to maintain macroeconomic stability through prudent fiscal management, and to improve their sovereign ratings and good governance practices. Because the infrastructure industry affects not only the finance sector but other entities, such as contractors, consultants, and users, a conducive business climate will nurture these components and facilitate efficient markets. Both are essential for economic development and to increase competitiveness. Infrastructure is a long-term investment whose sustainability requires continuing political and macroeconomic stability, and a promising economy.
Infrastructure financing. To advance PPP systems, governments should develop compatible financing systems. A PPP is a sophisticated financing modality, which is very different from traditional procurement. A PPP’s performance is based on service quality and delivery, not on inputs; and the contract period is defined by a project’s life cycle. These features are a big incentive for implementing agencies to show market discipline. To this end, risk-sharing schemes reduce moral hazard from both sides and allow greater support from governments. To lower the cost of capital, governments can provide credit enhancement, typically through guarantees. Governments can also use various forms of support offered by multilateral agencies. ADB (2017) highlights how risk sharing in PPPs creates a compelling incentive for the private sector to avoid failure and deliver high-quality infrastructure and associated services on time and cost effectively.
Institutions and capacity. Public sector leadership is vital to guide the whole PPP process. Institutional aspects include the legal system, the institutions involved, and procedures for implementing PPPs. These require strong regulatory frameworks and the capacity to design, negotiate, and reach mutually beneficial contracts. Private entities require certainty in these partnerships, which only governments can provide. Equipping PPP units with enough power and capabilities to make crosscutting decisions will increase efficiency, enhance certainty, and speed up processes.

Public–Private Partnership Development in Southeast Asia 283
Credible project pipelines. Providing potential investors with regular and well-prepared project pipelines gives a strong signal that a government is committed and capable to work on PPPs. A pipeline of well-prepared projects and clear procedures will boost the confidence of both private partners and potential investors. Credible project pipelines will increase market efficiency and smooth deal flows, and allow investors to pick the most appropriate projects to bid.
In sum, for PPPs to be successful, countries should have achievable project pipelines, engage with qualified private sector partners, and put in place processes to ensure effective, efficient, and competitive mechanisms for these partnerships.
The following are recommendations for Southeast Asia’s more developed PPP markets of Indonesia, Malaysia, the Philippines, and Thailand:
(i) Focus on a few well-prepared priority PPP projects to attract investors, rather than maintain long lists of candidate projects for which governments do not have the capacity to deal with. Well-managed deal flows are important so that potential investors know what to expect, and to attract the most ready bidders. Successful PPPs also have powerful demonstration effects to attract more investors. Brownfield projects might also be more attractive, given their historical data and performance.
(ii) Use geographical challenges and urban poverty as rationales for advancing pro-poor PPPs. Here, it will be best to start with a few projects that have superior feasibility studies, and to provide legal and institutional frameworks and standards for “lite PPPs” to accommodate medium-sized projects.
(iii) Ensure risks in PPP projects are fairly shared in accordance with best internalization principles, combined with government support and openness to foreign participation, including investors and multilateral development banks.
(iv) Explore innovative financial schemes for PPPs; for example, land value capture and tax increment financing.
(v) Provide technical skills training on PPPs for officials working on PPP projects, including in local governments.
The following are recommendations for Southeast Asia’s less-developed PPP markets of Cambodia, the Lao PDR, Myanmar, and Viet Nam:
(i) Focus on building good governance by ensuring transparent and accountable PPP projects that can set benchmarks. It is important to show strong commitment for PPPs; this can be done by improving governance systems and providing legal certainty, and by establishing special funds and agency for these partnerships.

Realizing the Potential of PPPs to Advance Asia’s Infrastructure Development284
(ii) Explore and develop options for infrastructure finance and provide regulatory and institutional frameworks. This can be started by setting up a general framework for projects or by developing one from a showcase project. The choice will depend on a country’s governance system and how its political economy interacts with PPPs.
(iii) Publish a list of priority projects that are compatible with a country’s capacity to handle them; avoid a “shopping list” of projects.
(iv) Mobilize public resources to support infrastructure PPPs by increasing tax and customs revenue for government and project bonds.
(v) Focus on the following capacity-building areas for PPPs: understanding the infrastructure industry, PPP characteristics, building strong regulatory frameworks, and involving local governments.
Notes1 The East Coast Rail Link will connect Port Klang and Kuala Lumpur to Pahang, Trengganu,
and Kelantan. Bandar Malaysia is an urban redevelopment project near Sungai Besi Airport and will have a Kuala Lumpur–Singapore high-speed rail. Vision Valley is a metropolis development in Negeri Sembilan near Kuala Lumpur, which aims to be a modern, sustainable, high tech, and livable city.
2 Foreign holdings of local currency government bonds were 40% in Indonesia and 30% in Malaysia in December 2017.
3 Estimates given by informal interviews with several investors and project consultants operating in Southeast Asia in 2017.

Public–Private Partnership Development in Southeast Asia 285
References
ADB (Asian Development Bank). 2017. Asian Development Outlook 2017 Update: Sustaining Development through Public–Private Partnership. Manila.
IEA (International Energy Agency). 2017. Southeast Asia Energy Outlook 2017. World Energy Outlook Special Report. Paris.
Ismail, Suhaiza and Fatimah A. Haris. 2014. Constraints in Implementing Public Private Partnership in Malaysia. Built Environment Project and Asset Management 4 (3): pp. 238–250.
Ministry of Finance, Government of Indonesia. 2016. State Budget for the 2016 Fiscal Year. Jakarta.
National Development Planning Agency, Government of Indonesia. 2014. National Development Agenda 2015–2019. Jakarta.
NEDA (National Economic and Development Authority), Government of the Philippines. 2016. Revisions on ICC [International Coordination Committee] Guidelines and Procedures. Manila: NEDA. http://www.neda.gov.ph/wp-content/uploads/2017/01/Revisions-on-ICC-Guidelines-and-Procedures-Updated-Social-Discount-Rate-for-the-Philippines.pdf.
Nonthasoot, Seree. 2011. PPP in Thailand: Policy Development and Challenges—Enabling Finance for Private Finance of Infrastructure. Paper presented at the APEC Finance Ministers’ Process Workshop, Washington, DC.
Provincial Government of East Java. Republic of Indonesia. 2016. Mengalirkan Air Umbulan Sejahterakan Masyarakat. Surabaya.
UNICEF (United Nations Children’s Fund) and WHO (World Health Organization). 2015. Progress on Sanitation and Drinking Water. 2015. Update and Millennium Development Goal Assessment. Geneva
WEF (World Economic Forum). 2017. The Global Competitiveness Report 2017–2018. Geneva.
Zen, Fauziah and Michael Regan, eds. 2015. Financing ASEAN Connectivity. Jakarta: Economic Research Institute for ASEAN and East Asia.


CHAPTER 12
Public–Private Partnership Systems in the Republic of Korea, the Philippines, and Indonesia: A Comparative Review
Kang-Soo Kim, Min-Woong Jung, Mee-Soo Park, Yoo-Eun Koh, and Jin-Oh Kim
Introduction This chapter analyzes and compares the public–private partnership (PPP) systems in the Republic of Korea, the Philippines, and Indonesia to identify the requirements for making this modality an effective catalyst for infrastructure’s contribution to sustainable development. The Economist Intelligence Unit’s 2014 Infrascope, in its assessment of the environment for PPPs in Asia and the Pacific, classified the Republic of Korea and the Philippines as developed markets in terms of their PPP readiness and Indonesia as an emerging PPP market (EIU 2015). All three countries recognize the vital role of the private sector to provide infrastructure investments to help meet their financing needs, and to use the increased capacity of the private sector and its transactional experience in handling these partnerships to develop their PPP markets. All three governments have also undertaken reforms to strengthen their institutional frameworks for these partnerships and improve risk-sharing mechanisms to increase the use of PPPs to provide infrastructure services.
This chapter also examines the legal and institutional frameworks, implementation processes for solicited and unsolicited project proposals, the types of government support for infrastructure PPPs, and the main agencies and supporting organizations working on these partnerships in the three countries. A comparative analysis draws lessons for other countries in developing Asia seeking to improve the efficiency and effectiveness of their PPPs. The comparative analysis underscores how strong institutions, unified procurement frameworks, and effective dispute resolution mechanisms can improve the implementation of infrastructure PPPs. Appendix A12.1 summarizes the institutional and financial aspects of PPPs in the three countries, their treatment of land and buildings for these partnerships, project selection processes, and main infrastructure types eligible for PPPs.
Realizing the Potential of PPPs to Advance Asia’s Infrastructure Development288
Legal and Regulatory FrameworksWell-functioning and transparent legal and regulatory frameworks are a must for countries promoting PPPs as a financing modality to build and upgrade infrastructure. Not all countries that have embarked on the PPP path have specific PPP laws, but some kind of enabling legislation is needed for the private sector to participate in public infrastructure projects, and for setting regulations for the different types of procurements. The following looks at these processes for the three case study countries.
The Republic of Korea
Legal Bases
These are essentially twofold in the Republic of Korea. The Public–Private Partnerships in Infrastructure Act of 1994 (amended in 1998, 2005, and 2011, henceforth called the PPP Act) is the basic law for these partnerships. The Ministry of Economy and Finance’s annual PPP master plans suggest policy directions for the PPP system and infrastructure investments. The master plans also give general guidelines and set out project implementation procedures. More detailed guidelines are issued by the Public and Private Infrastructure Investment Management Center (PIMAC), an independent organization. To ensure transparency, PIMAC, after consulting with the Minister of Economy and Finance, announces guidelines for carrying out each facet of a PPP project.
Types of Procurement
The two types of procurement methods in the Republic of Korea depend on whether the ownership of infrastructure will be transferred to the central government or to a local government on the completion of a PPP project. The first type, known as revertible facilities, are build–operate–transfer (BOT), build–transfer–operate (BTO), and build–transfer–lease (BTL) projects. The second type, nonrevertible facilities, are for build–own–operate (BOO) projects. Procurement methods are divided into how concessionaires recover their investment. BTOs, BOTs, and BOOs allow concessionaires to directly collect fees from infrastructure users, while BTLs allow them to do this through the government. For the direct collection of user fees, PPP procurement methods are divided into whether concessionaires get them from management and operation rights (BTO) or from facility owners (BOT and BOO). The PPP Act also allows for other procurement methods. Solicited and unsolicited project proposals are used, and these are discussed later in the chapter for all three countries.
The PPP Act uses a positive list system for 57 types of infrastructure eligible for PPPs (Appendix A12.1). The Republic of Korea appears to have adopted this system for its ability to ensure predictability and legal stability

PPP Systems in the Republic of Korea, the Philippines, and Indonesia 289
by clearly stating the scope of the act’s application for PPP projects. Here, the act grants concessionaires a special exemption from public law by fully recognizing them as the main agents for procuring infrastructure facilities. It also endows concessionaires with powerful rights, including acquisition rights to private land.
The Philippines
Legal Bases
The Philippines has three legal bases for implementing PPP projects. The Build–Operate–Transfer Law of 1994 (Republic Act No. 7718) mandates the state to provide the enabling environment and incentives for private participation in infrastructure and development projects. Executive Order No. 423 of 2005 provides guidelines on joint ventures for government-owned and controlled corporations. The Local Government Code of 1991 (Republic Act No. 7160) can be used by local government units as an alternative legal basis for PPPs to the act. The government’s contribution to a PPP must not exceed 50% of a project’s cost, and the validity of contracts under the Build–Operate–Transfer Law may not exceed 50 years. Public utility PPPs must be operated by Filipino entities and, if a project is a corporation, it must be at least 60% owned by Filipinos.
Types of Procurement
The Build–Operate–Transfer Law provides for nine contractual arrangements: BOT, BTO, BOO, build–and–transfer, build–lease–transfer, contract–add–operate, develop–operate–transfer, rehabilitate–operate–transfer, and rehabilitate–own–operate. Other arrangements can qualify as a procurement type under the law, if approved by the president. Implementing agencies can accept unsolicited proposals for PPP projects on a negotiated basis, if certain conditions are met.
Building and upgrading infrastructure, its financing, and operation and maintenance can be wholly or partly financed by the private sector in the Philippines. Other infrastructure projects authorized by government agencies can be proposed under the Build–Operate–Transfer Law. But these must have a cost-recovery component covering at least 50% of the project cost or a level determined by the approving body.
Indonesia
Legal Bases
Indonesia’s first general PPP regulation, Presidential Decree No. 7 of 1988, covered the cooperation between the government and the private sector to

Realizing the Potential of PPPs to Advance Asia’s Infrastructure Development290
develop or manage infrastructure. A cross-sector regulatory framework for implementing PPPs was established in 2015 with Presidential Regulation No. 38. This stipulates that PPPs for infrastructure are determined by the head of a ministry or local government, state-owned enterprises, and enterprises owned by local governments.
Types of Procurement
Most infrastructure PPPs in Indonesia are carried out by BOTs and BOOs, though design–build–operate, design–build–lease, and build–buy–operate are used to a lesser extent. PPP projects can be developed on a solicited or unsolicited basis, but in all cases the selection of a private sector partner must be conducted by open tender.
Under Indonesia’s PPP eligibility criteria, companies providing infrastructure must have the technical capacity to be able to work in the project sector concerned, and deliver projects that are economically feasible and financially viable. Companies must have the financial capacity to be able to participate in an infrastructure PPP and prepare a feasibility study for the proposed PPP project. Three compensation options are available for a prospective private partner doing this: (i) extra points within 10% of the total evaluation points upon review of the proposal assessment,1 (ii) granting the right to make a revised proposal within 30 days under the results of the assessment of the tender process, and (iii) buying the intellectual property rights of project from the initiator.
PPP Implementation ProcessesThis section examines the implementation processes of solicited and unsolicited project proposals in the three countries. In Indonesia and the Philippines, solicited PPP projects are dealt with separately from public-procurement projects. The Republic of Korea has a unified framework for solicited PPPs and public-procurement projects. All three countries encourage unsolicited PPP proposals and have legal bases for the procurement procedure for unsolicited projects.
Republic of Korea
Solicited Projects
The competent authority—procurement agency—develops a PPP project plan setting out the investment priorities and project characteristics. PPP master plans lay out the general principles for selecting PPP projects. A candidate project must fall under one of the 59 infrastructure types covered

PPP Systems in the Republic of Korea, the Philippines, and Indonesia 291
by the PPP Act. At this stage, the competent authority assesses a candidate project’s profitability, benefit to the public, user affordability, and efficiency gains, and assesses whether it is in line with national medium- and long-term infrastructure plans. A preliminary feasibility study, conducted by PIMAC, must be done if a candidate project costs exceed W50 billion ($50 million) or requires a government subsidy of over W30 billion ($30 million).
Once the project is designated, the competent authority puts out a request for proposal (RFP) within 1 year of a project being designated. Before the announcement is made, it is important for the authority to consult with government agencies on any issues and regulations that may affect the project once it gets going. The Public–Private Partnership Review Committee must review the RFP documents before a formal announcement is made for projects costing over W200 billion ($200 million) or requiring a government subsidy of over W30 million ($30 million).
Bidders submit project proposals to the competent authority in accordance with legislation and regulations covering this process, and they usually form a consortium of builders, maintenance operators, and financial institutions. Bidders have the right to request clarifications on any aspect of the RFP’s specifications, and the competent authority must share its response with all bidders.
The competent authority forms a team of external experts to evaluate the bids using the RFP criteria. This is usually done in two stages: a prequalification evaluation of the bidder’s project-implementation capacity, and a technical and financial evaluation of the proposal. The competent authority should select at least two potential concessionaires in case negotiations fail with the preferred bidder. The authority then starts negotiations with the preferred bidder, and it is usual to form a team of external legal, financial, and engineering experts for this (PIMAC can be asked to provide advisory support).
The concessionaire puts together a detailed engineering and design plan—based on the PPP contract—for the project and applies for the plan’s approval within 1 year of the project being awarded. The competent authority notifies the concessionaire of its decision on the engineering and design plan within 3 months from the application’s filing date. Once the plan is approved, the concessionaire is responsible for getting all the permits and approvals for construction. The competent authority monitors construction to ensure the quality of the building materials and the equipment used; an independent expert is usually hired to do this.

Realizing the Potential of PPPs to Advance Asia’s Infrastructure Development292
Unsolicited Proposals
The competent authority reviews unsolicited project proposals to ensure that they are in line with the government’s infrastructure investment plans and priorities, and for their commercial viability. PIMAC’s review of these project proposals entails a value-for-money analysis, which has three phases: (i) a cost–benefit and policy analysis; (ii) a comparative analysis between a public-sector comparator and the PPP proposal; and (iii) a financial analysis to assess the project cost, user fees, and level of government financial support. PIMAC submits its review to the competent authority and the Ministry of Economy and Finance.
When pursuing an unsolicited project, the competent authority must notify the public about the content of the proposal to allow other parties to submit alternate proposals, and allocate at least 90 days for this to ensure fair competition. Based on the merits of the initial proposal, extra points within 10% of the total evaluation points can be awarded after the review of the value-for-money assessment. The rate of extra points is included in the RFP. The competent authority’s evaluation team assesses the alternative proposals and the initial proposal again, and selects a preferred bidder. If no alternate proposals are submitted, the initial bidder is designated as the potential concessionaire for the PPP negotiation phase.
The Philippines
Solicited Projects
A PPP project initiated by the government covers three stages: project identification and prioritization, project approval, project procurement, and contract award. In the first phase, the project is assessed to ensure that it supports the Philippine Development Plan and sector master plans. Candidate projects are then included in the Comprehensive and Integrated Infrastructure Program, which accompanies the Philippine Development Plan. Both are approved by the board of National Economic and Development Authority (NEDA), the government’s central planning agency, and are reviewed annually.
Preparing an infrastructure PPP project begins with the implementing agency conducting prefeasibility analysis. Detailed feasibility studies are then conducted on viable projects. The results determine the type and level of government support; for example, viability-gap funding. Although there are no multiyear appropriations, government agencies handling infrastructure projects are required to submit a 3-year rolling plan on their proposed priority infrastructure investments to the Department of Budget and Management. Before a project can be included in an implementing agency’s budget request, approvals from various government bodies are required; these are set out in Table 12.1.

PPP Systems in the Republic of Korea, the Philippines, and Indonesia 293
Table 12.1: Approval Procedures for PPPs in the Philippines
Implementing Agencies Approving Body Approval Thresholds
National government agencies
Investment Coordination Committee (ICC)
Up to ₱300 million ($6 million)
National Economic and Development Authority Board
(on ICC’s recommendation)
Above ₱300 million and for all negotiated projects (e.g.,
unsolicited proposals)
Local government units
Municipal Development Council
Up to ₱20 million ($0.4 million)
Provincial Development Council
From ₱20 million to ₱50 million ($1 million)
City Development Council Up to ₱50 million
Regional Development Council
From ₱50 million to ₱200 million ($4 million)
ICC Above ₱200 million
Source: Korea Development Institute. 2015. A Comparison Study on the PPP System of Korea, Philippines and Indonesia. Sejong.
The next step is to get the approval of government oversight bodies. The Investment Coordinating Committee, which is made of up NEDA officials, evaluates the project’s alignment with and contribution to the Philippine Development Plan. The Department of Finance appraises project risk, allocates the fiscal requirements and government debt needed to carry it out, and estimates the financial internal rate of return. It also evaluates the project’s impact on fiscal sustainability by assessing the government’s direct, contingent, and opportunity costs. The Public–Private Partnership Center of the Philippines (henceforth PPP Center), the main support organization for PPPs and a NEDA-attached agency, conducts value-for-money and financial analyses, and validates the appropriateness of viability gap funding for projects that are economically viable but not financially attractive.
The approval of these oversight bodies is a prerequisite to government budget support for PPP projects and for the project tender itself. Competitive bidding is the default mode for project procurement and awarding contracts in the Philippines. Negotiated contracts are allowed if there is only one complying bidder in a competitive bid, but these are restricted to the financial proposal. The head of the implementing agency is authorized to sign the contract after it has been reviewed by the agency’s legal counsel. Department of Finance approval is needed for projects in which the national government has direct and contingent liability. Figure 12.1 shows the procurement process options for solicited PPP proposals.

Realizing the Potential of PPPs to Advance Asia’s Infrastructure Development294
Figure 12.1: PPP Procurement Options for Solicited Proposals in the Philippines
process
Bid evaluation
Two-stage process
Advertisement/invitation
to prequalify and bid
Prequalification
Tendering, submission, receipt, and opening of
bids
Award of contract
Bid evaluation
Advertisement/invitation to bid
Tendering, submission, receipt, and
opening of bids
Award of contract
Single-stage process
Source: Public–Private Partnership Center of the Philippines. 2014. National Government Agency Public–Private Partnership Manual. Manila.
Unsolicited Proposals
Implementing agencies may accept unsolicited proposals for a PPP project on a negotiated basis, if three conditions are met. First, the project has a new concept or technology that is approved by the implementing agency and is not on the list of national or local priority projects. Second, the project does not require a government guarantee, subsidy, or equity stake. And third, the implementing agency puts an announcement in a newspaper detailing the comparative or competitive proposal; here, challengers have 60 working days to submit a comparative proposal. If no complying proposals are received, the original proponent is awarded the contract. If a challenger submits a better price proposal than the one submitted by the original proponent, the proponent has the right to match within 30 working days after receiving the bid results. Should the original proponent fail to match the challenger’s price proposal within this period, the contract is awarded to the challenger. But, if the original proponent matches the price proposal of the comparative proponent within this period, the project is awarded to the original proponent. All negotiated PPP contracts require the approval of NEDA’s board, which bases its decision on the recommendation of the Investment Coordination Committee.
Indonesia
Solicited Projects
The process for government solicited infrastructure PPP projects in Indonesia has four phases: planning, preparation, transaction, and contract management. In the first phase, the government contracting agency identifies potential projects for private sector participation in accordance with government policies and objectives for infrastructure, and in terms of available resources and project timing. The contracting agency then assesses the potential project’s priority, using the following criteria:

PPP Systems in the Republic of Korea, the Philippines, and Indonesia 295
• clarity of the PPP project’s description; • obstacles to using the main resources for implementing the project; • clarity of the results of the project’s inputs;• social and environmental impacts; • potential for sustainable demand;• ease of land acquisition and resettlement;• government’s ability to support the project;• institutional readiness; and• whether the project is included in the government’s strategic
priorities and planning for infrastructure.
In the project preparation phase, the government contracting agency studies possible risks for a project being a PPP and the project’s social benefits. This phase has two steps: the first outlines the case to be made for the project as a business proposition. Here, a legal and technical assessment of the project and a prefeasibility study are carried out. A preparation-of-readiness study is done in the second step, focusing on the availability of land. The contracting agency prepares a list of land compensation or expropriation that defines the land needed for the project.
The transaction phase covers procurement planning and implementation. In this phase, the government contracting agency completes the prefeasibility study and prepares the procurement plan for public tender. The contracting agency then forms a procurement committee of experts, which arranges a procurement schedule and a procurement-notices concept. Here, the agency sounds out investor interest to present an attractive project package to potential investors. The committee also prepares a self-estimated price for the project, and the prequalification and procurement documents. A winning bidder is then selected using the procurement steps shown in Figure 12.2.
Figure 12.2: PPP Procurement Process for Solicited Proposals in Indonesia
proposalPrequalification Bidding document
openingEvaluation of
o�ers
Establishing the minutes of the
procurement results
O�ering implementation
Procurementexplanation/
briefingSubmission of the proposal
Tender winner
stipulationStipulation of a single bidder
Objection from bidder(s), if any
Winner stipulation letter
issuance
PPP agreement signing
PPP = public–private partnership.Source: National Development Planning Agency. 2015. 2015 PPP Book. Jakarta.

Realizing the Potential of PPPs to Advance Asia’s Infrastructure Development296
Unsolicited Proposals
Unsolicited project proposals for PPPs in Indonesia have two stages. The first covers the time from when a project proponent presents a project to the government until all internal assessments and approvals are finished and the project is ready to be tendered. The second stage is a competitive tender, which may well differ in the incentives or benefits in the project proponent’s unsolicited proposal.
The first of three steps in the first stage to get a project approved for an unsolicited proposal begins with a letter of intent proposing the project and a concept suggestion (and includes documentation showing the proponent is able to carry out the project). The contracting agency decides whether to continue with the proposal.
The second step involves the contracting agency’s evaluation of the project proponent’s feasibility study, and whether the proponent fulfills the requirements to join the tender. Three things need to be done for this: (i) the proponent submits the feasibility documents to the contracting agency, (ii) the agency evaluates and assesses the feasibility study and prequalification requirements, and (iii) the agency approves or rejects the proposal. The third step is the process to get the contracting agency’s approval for the project proponent to be formally designated as the project’s initiator. This step has four parts in which (i) the proponent completes the feasibility study and prequalification requirements, (ii) the proponent obtains environmental permits and location stipulation, (iii) the agency decides whether to go ahead with the proposal, and (iv) the agency sets compensation for the project proponent.
The second stage involves a competitive tender process up to financial close. During this stage, the approaches tend to differ in incentives or benefits to those offered to the project’s original proponent. Compensation for the project initiator is provided after the review of the proposal assessment by giving one extra point within 10% of total evaluation points and granting the project proponent the right to match, according to the tender results, no later than 30 days from the announcement of the best offer in the tender process.
PPP Institutional Frameworks Although legal and regulatory frameworks enable PPPs, a second tier of institutions and processes is needed to implement applicable laws, regulations, rules, and policies. Well-functioning institutional arrangements are essential for this process going smoothly. Without them, PPPs will be harder to develop—and the agencies with specific responsibilities under legislation to implement PPPs will not be doing this effectively. Many governments have

PPP Systems in the Republic of Korea, the Philippines, and Indonesia 297
established specialized PPP units to develop and supervise projects, and these units play a vital role in successfully promoting and developing PPP projects.
The Republic of Korea
The competent authority in the Republic of Korea is the head of the central administrative agency responsible for an infrastructure PPP project. If the project is a national one, the competent authority is a central government ministry. If the project is a regional one, it is the head of the relevant local government. This is also the case if the project is subsidized by the central government but implemented by a local government. Table 12.2 shows the key agencies promoting PPP systems.
Table 12.2: Government Organizations Promoting PPP Systems in the Republic of Korea
Key Agencies Function
Ministry of Economy and Finance (Fiscal Management Bureau)
The ministry oversees general fiscal management and has two primary tasks: (i) to formulate medium- to long-term fiscal strategies and a roadmap for fiscal consolidation, and (ii) to manage budget spending and assess fiscal performance to improve fiscal effectiveness.
Public and Private Infrastructure Investment Management Center (PIMAC)
Responsible for supporting PPP projects implemented by the private sector and competent authorities under the PPP Act. PIMAC provides the feasibility analysis of large-scale projects, and evaluates project plans.
Source: Authors.
Under the PPP Act, the Public–Private Partnership Review Committee was established as a unit under the Ministry of Economy and Finance to oversee policies and decisions affecting large-scale PPP projects. The 2011 amendment of the PPP Act was to establish the Committee for Mediation of Public–Private Partnership Project Disputes under the direct jurisdiction of the minister of strategy and finance.
The Philippines
Several types of institutions play a major role in the Philippines’ PPP program. Implementing agencies sponsor the development of PPP projects; these agencies are made up of government departments; subnational agencies, particularly local government units; and government-owned and controlled corporations (Table 12.3) These agencies work together to ensure better collaboration between the private sector and government.

Realizing the Potential of PPPs to Advance Asia’s Infrastructure Development298
Table 12.3: Government Organizations Promoting PPP Systems in the Philippines
Key Agencies Function
Department of Finance Approves government undertakings, direct and contingent; approves PPP contracts requiring government undertakings, including access to official development assistance loans and sovereign guarantees.
National Economic and Development Authority
Constitutional body tasked with formulating the Philippines’ strategic socioeconomic development plan, and coordinating the prioritization of the plan’s investment program, which is funded from public and private resources through PPPs.
Investment Coordination Committee
Evaluates the fiscal, monetary, and balance-of-payment implications of major national projects.
Development Budget Coordinating Committee
Advises on annual government expenditure program, and the ceiling of government spending for economic and social development, defense, and debt servicing.
Infrastructure Committee Advises on infrastructure policies on their consistency with national development goals, coordinates the preparation of infrastructure programs, strategic investment programs, and the project plans of government infrastructure agencies.
PPP Center Mandated to facilitate the implementation of PPP programs and projects. The center was reorganized under Executive Order No. 8 in 2010, and serves as the central coordinating and monitoring agency for all PPP projects in the Philippines.
PPP = public–private partnership.Source: Authors.
Indonesia
Infrastructure investments and development are demarcated by sector in Indonesia. Because each sector has its own laws and regulations, coordination is essential for effective infrastructure development. Since Indonesia has several agencies promoting and implementing PPPs, and some have overlapping functions, it is important that the responsibilities of each agency are clearly defined to eliminate possible coordination problems (ADB 2017) (Table 12.4).

PPP Systems in the Republic of Korea, the Philippines, and Indonesia 299
Table 12.4: Government Organizations Promoting PPP Systems in Indonesia
Key Agencies Function
Ministry of National Development Planning and National Development Planning Agency
Coordinate the country’s PPP program, decide on whether projects should be procured as PPPs, and evaluate the progress on PPP projects. The National Development Planning Agency has a central PPP unit, the Directorate, responsible for ensuring policy consistency, quality control and transparency, setting standards, and compliance monitoring of PPP projects.
Committee of Infrastructure Priorities Development Acceleration
Recommends policies to strengthen the PPP system, and determines the priority of PPP projects.
Ministry of Finance Provides budgets for PPPs and recommends fiscal support for PPP projects.
PT Sarana Multi Infrastruktur State-owned enterprise provides infrastructure financing for PPP projects.
State Asset Management Agency
Provides land acquisition fund for PPP projects.
Indonesia Infrastructure Guarantee Fund
Mandated to provide contingency support and guarantees to risks, such as government delays for getting projects off the ground.
State-Owned Infrastructure Financing Company
Indonesia’s other main supporting agency for PPPs. Mandated to provide alternative sources of funds to finance, promote, and support PPP projects, and to increase the size, capacity, and effectiveness of infrastructure projects through partnerships with third parties.
PPP = public–private partnership.Source: Authors.
Government Support for PPPsGovernments will only attract private participation in infrastructure if investors are confident of earning a reasonable return. For countries that do not have mature PPP markets, investors also want government support or guarantees for a certain degree of risk—and governments can improve the bankability of projects by using support instruments such as equity, debt relief, grants, guarantees, fiscal incentives, and contract clauses based on project needs. The Republic of Korea provides financial support through subsidies to resolve financial feasibility problems that may occur on infrastructure PPPs; the Philippines and Indonesia use viability gap funding.

Realizing the Potential of PPPs to Advance Asia’s Infrastructure Development300
The Republic of Korea
The government provides a range of administrative and financial support as part of its effort to promote PPP projects.
Construction Subsidy
If it is necessary to set user fees for infrastructure at a certain level, the government may, under the PPP Act, give a construction subsidy to a concessionaire. The amount is determined in the concession agreement and the ratio of subsidy to construction costs is decided by negotiation. The timing for subsidy payments is determined in the concession agreement and is set in terms of the concessionaire’s equity investment plan. Construction subsidies are paid annually or quarterly and cannot be concentrated in a particular year. The point of distribution must reflect the progress being made on completing a project and the scope of the equity investment.
Risk Sharing
Two risk-sharing schemes for BTO projects were introduced in 2015 to reinvigorate this modality—BTO risk-sharing projects and BTO-adjusted projects. Under a BTO risk-sharing project, investment and operating costs are shared by the government and the private partner at a certain ratio, and both share excess profits or losses (Figure 12.3). If the share of the investment costs between government and private partner is split evenly, the private partner
Figure 12.3: Mechanism of a Build-Transfer-Operate Risk-Sharing Scheme in the Republic of Korea
Government profit 10Private profit 10
Government loss 20
Private loss 20
Revenue 60
Concession agreement
Revenue 120
Example 1 Actual operation revenue < investment cost in facility + operation cost
Example 2 Actual operation revenue > investment cost in facility + operation cost
100(investment cost
in facility + operation cost)
Source: Ministry of Strategy and Finance. 2015. Public-Private-Partnership Projects Promotion Plan. Sejong.

PPP Systems in the Republic of Korea, the Philippines, and Indonesia 301
can receive a certain portion of the operating costs from the government when user demand for the infrastructure facility or service is not sufficient (example 1 in Figure 12.3). But, when demand exceeds the contracted forecast, the government receives a partial return of the private partner’s profits (example 2). BTO risk-sharing was introduced to supplement the previous system in which the private sector took on most of the project risk for a BTO, and the government took on most of the risk for a BTL. The fundamental concept of a BTO risk-sharing project is that the competent authority shares a portion of the private sector’s investment risk rather than the revenue risk. Under this scheme, private partners bear less revenue risk, compared with standard BTO scheme. This is a way of lowering the rate of return on the government’s investment and, ultimately, to lower the user fees.
Under a BTO-adjusted PPP project, the government covers the repayment of the principal loan and interest for 70% of the total private investment and shares excess profits with the concessionaire (Figure 12.4). The concessionaire
Figure 12.4: Mechanism of a Build-Transfer-Operate Adjusted Scheme in the Republic of Korea
Concessionagreement
Example 1 Example 2 Example 3Actual revenue Actual revenue Actual revenue
< < >
Actual revenue 120Private profit 6
Government profit 14
Private loss 20
Actual revenue 80
Mininum operation
cost 70 (Government compensation)
Nonguaranteed principle loan 30
(Private risk)
Private loss 30
Government loss 10
Actual revenue
60
Mininum operation
cost
Minimum operation cost + nonguaranteed principle loan
Minimum operation cost + nonguaranteed principle loan
Minimum operation cost
Source: Ministry of Strategy and Finance. 2015. Public-Private-Partnership Projects Promotion Plan. Sejong.
Realizing the Potential of PPPs to Advance Asia’s Infrastructure Development302
bears a loss for as long as it is less than 30% of the total private investment. If the loss exceeds 30%, the concessionaire receives government financial support. Excess profits are shared by the government and concessionaire on a 7:3 ratio. The advantage of this system is that it can reduce project risks for the private partner and user fees. BTO-adjusted PPP projects are especially useful for environmental infrastructure, such as sewage and wastewater disposal.
Credit Guarantees
The Infrastructure Credit Guarantee Fund has provided credit guarantees to concessionaires borrowing from financial institutions for PPP projects since 1994. Under the PPP Act, the fund is managed by the Korea Credit Guarantee Fund, a public financial institution that extends credit guarantees for the liabilities of promising enterprises that lack tangible collateral. The Infrastructure Credit Guarantee Fund is financed through annual government investment, revenue from guarantee fees, and returns on investments. When a fund-guaranteed project defaults, the fund subrogates on behalf of the concessionaire. If a project guaranteed by the fund becomes bankrupt, the fund reimburses the concessionaire for its obligations. The credit guarantee limit for each project is W300 billion ($300 million), and the maximum annual guarantee fee is 1.5% of the guaranteed fund.
Buyout Rights
Concessionaires of revertible infrastructure facilities may request the central or local government to buy out these facilities, including supplementary ones, if they are unable to build, manage, or operate them because of unavoidable circumstances due to force majeure.
Compensation on Termination
The possibility of compensation in the case of premature contract termination is a significant risk mitigation factor for concessionaires, enabling them to finance debt at favorable interest rates. If a concessionaire is unable to maintain a facility, a request can be made to the government to terminate the concession agreement. If this happens, the government assumes the management and operation rights of the facility. The method of calculating payment and the causes for termination must be specified in the concession agreement.
Exemption from Charges and Taxes
The central or a local government may exempt a PPP project, partially or fully from certain taxes. Table 12.5 gives the details.

PPP Systems in the Republic of Korea, the Philippines, and Indonesia 303
Table 12.5: Exemption from Charges and Taxes for PPP Projects in the Republic of Korea
Relevant Acts Details of Exemption
Farmland Act, Management of Mountainous Districts Act
A facility installed for a PPP project may be tax exempted fully—or by 50%—from the farmland conservation charge and the substitute forest development cost.
Restriction of Special Taxation Act
A concessionaire is permitted to issue social overhead capital bonds for implementing a PPP project, and a separate rate of 14% applies to the interest income from the bonds. Effective until 31 December 2018.
A zero tax rate is applied to the value-added tax on an infrastructure facility or for construction services, which the concessionaire supplies to the central or local government. Effective until 31 December 2018.
A zero tax is applied to the value-added tax on urban railroad construction services supplied directly by the concessionaire. Effective until 31 December 2018.
A foreign investment of at least $10 million in a PPP facility in a foreign investment zone is exempt from corporate, income, acquisition, registration, and property taxes.
Corporate Tax Act An allowance for writing off indemnity receivables is recognized as a loss on the Infrastructure Credit Guarantee Fund under the Public–Private Partnerships in Infrastructure Act.
Where a domestic corporation spends a subsidy or other asset received for implementing a PPP project to acquire or ameliorate an asset for the project, the equivalent amount may be included in losses in calculating the income for the applicable fiscal year.
Land developed for implementing a PPP project is exempt from the additional income tax for transferring the property.
Where a concessionaire meets the requirements for a nominal investment company under the Corporate Tax Act and distributes 90% or more of distributable income as dividends, the amount of these dividends may be deducted in calculating the amount of income. The requirements for a nominal investment company are at least W5 billion ($5 million) for companies implementing any PPP project other than a BTL, or equity of at least W1 billion ($1 million) for companies implementing a BTL PPP.
continued on next page

Realizing the Potential of PPPs to Advance Asia’s Infrastructure Development304
Relevant Acts Details of Exemption
Local Tax Act A corporation newly established in the Seoul Metropolitan Area for implementing a PPP project is recognized as an exception to the triple taxation of the registration tax.
Acquistion and registration tax is waived for a project implemented under the condition that the property will revert or be donated to the central or local government.
BTL = build–transfer–lease, PPP = public–private partnership.Source: Ministry of Strategy and Finance. 2017. PPP Basic Plans. Sejong.
Land Acquisition
Under the PPP Act, a concessionaire may have expropriation rights and can entrust the task of land purchase, compensation for losses, and the resettlement of residents, among other factors, to the competent authority or the head of a local government. A concessionaire must discuss with the head of the administrative agency how the land belonging to the state or local government for a PPP project is going to be used. This land may not be sold for any purpose other than for the project after the project proposal has been publicly announced.
Under the PPP Act, national or public property in areas designated for PPP projects may be sold to the concessionaire through a concession agreement; the concessionaire can use this property free of charge.
The Philippines
Under the Build–Operate–Transfer Law, the government may provide any form of direct or indirect support for infrastructure PPP projects.
Cost Sharing
The implementing agency or local government unit bear a portion of the capital expense for an infrastructure PPP project provided that viability gap funding does not exceed 50% of the project cost. Any government share of a PPP may be financed from direct government appropriations or from official development assistance.
Credit Enhancements
Direct and indirect support for an infrastructure PPP project by the project operator, the implementing agency, and local government unit is contingent on certain events or risks (natural disasters, for example) happening, as stipulated in the PPP contract. Credit enhancements are allocated to the party that is
Table 12.5 continued

PPP Systems in the Republic of Korea, the Philippines, and Indonesia 305
best able to manage these risks. Credit enhancements can include government guarantees on project performance; indirect guarantees can also be offered. These are agreements in which the government or any of its agencies or local government units assume partial or full responsibility for a project’s financial standing to avoid the project operator defaulting on the project loan.
Direct Government Subsidies
These are used when the government or any of its agencies or local government units (i) defray or pay for a portion of a project’s cost, (ii) condone or postpone payments due from a project proponent, (iii) contribute properties or assets to a project, (iv) waive or grant special rates on real property taxes on a project during the term of the contract agreement in the case of local government units, and (v) waive charges or fees for business permits or licenses needed for a project’s construction.
Direct Government Equity
This involves the subscription by the government or any of its agencies or local government units of shares, or other securities convertible to shares, of a project company’s stock. The subscription can be paid by cash or assets.
Performance Undertaking
This is an undertaking by a government department or agency, government- owned or controlled corporation, or local government unit to assume responsibility for the performance of obligations of the implementing agency or local government unit under the project agreement. This includes paying obligations in the event of default. These undertakings may be subject to the payment of risk premiums to the national government, local government unit, or any other authorized agency.
Legal Assistance
This is given for infrastructure PPP projects only in cases, hearings, or inquiries where the implementing agency or local government unit and the project proponent are third-party defendants and respondents.
Project Development and Monitoring Fund
The Project Development and Monitoring Fund (PDMF), set up in 2010 under Executive Order No. 8, provides government funding that implementing agencies can tap to help them identify, prioritize, and prepare PPP projects, and for related advisory services (Figure 12.5). Since 2010, the PDMF has supported 35 of the 53 projects in the Philippines’ PPP program, with 45 out of 76 applications for PDMF funding approved. Since 2011, the fund has disbursed ₱2.15 billion ($42.9 million), according to the PPP Center, which administers the fund.
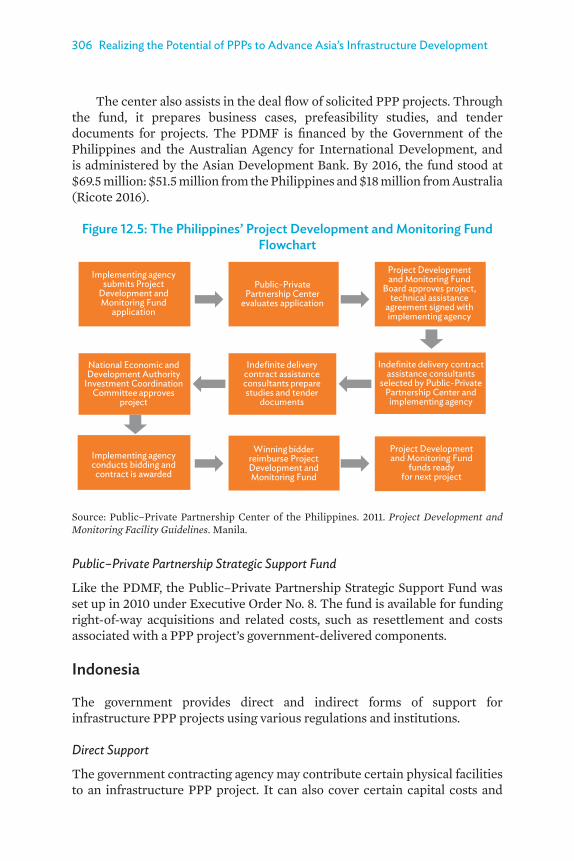
Realizing the Potential of PPPs to Advance Asia’s Infrastructure Development306
The center also assists in the deal flow of solicited PPP projects. Through the fund, it prepares business cases, prefeasibility studies, and tender documents for projects. The PDMF is financed by the Government of the Philippines and the Australian Agency for International Development, and is administered by the Asian Development Bank. By 2016, the fund stood at $69.5 million: $51.5 million from the Philippines and $18 million from Australia (Ricote 2016).
Figure 12.5: The Philippines’ Project Development and Monitoring Fund Flowchart
Implementing agency submits Project
Development and Monitoring Fund
application
National Economic and Development Authority
Investment Coordination Committee approves
project
Implementing agency conducts bidding and contract is awarded
Winning bidder reimburse Project Development and Monitoring Fund
Project Development and Monitoring Fund
funds ready for next project
Project Development and Monitoring Fund
Board approves project, technical assistance
agreement signed with implementing agency
Public-Private Partnership Center
evaluates application
Indefinite delivery contract assistance consultants prepare studies and tender
documents
Indefinite delivery contract assistance consultants
selected by Public-Private Partnership Center and implementing agency
Source: Public–Private Partnership Center of the Philippines. 2011. Project Development and Monitoring Facility Guidelines. Manila.
Public–Private Partnership Strategic Support Fund
Like the PDMF, the Public–Private Partnership Strategic Support Fund was set up in 2010 under Executive Order No. 8. The fund is available for funding right-of-way acquisitions and related costs, such as resettlement and costs associated with a PPP project’s government-delivered components.
Indonesia
The government provides direct and indirect forms of support for infrastructure PPP projects using various regulations and institutions.
Direct Support
The government contracting agency may contribute certain physical facilities to an infrastructure PPP project. It can also cover certain capital costs and
PPP Systems in the Republic of Korea, the Philippines, and Indonesia 307
provide operating subsidies through the annual national or regional budget; these costs are approved by national and regional parliaments. Direct support can be given when an infrastructure PPP is economically justified, but not financially feasible.
Land Acquisitions
In 2017, the Ministry of Finance, through its State Asset Management Agency, launched a land acquisition scheme for nationally strategic infrastructure PPP projects. The agency is mandated to provide land funds for these projects to ensure timely acquisition processes to boost private investment in infrastructure.
Contingent Support
Contingent support is a government guarantee to compensate a PPP project company, if a risk specified in the PPP contract happens. Here, the government guarantees the types of risk that it is in the best position to manage—for example, political, project performance, and demand risks—and for which there is an economic justification to do so. Project performance risk includes delays in land acquisitions, rising land acquisition costs, post-contract changes in performance specifications, lower-than-contracted tariff adjustments, and delays in operation.
To activate contingent support, the government contracting agency requests this, based on feasibility study findings. The request is reviewed by the Committee of Infrastructure Priorities Development Acceleration, evaluated by the Risk Management Unit, approved by the Ministry of Finance, and administered by Indonesia Infrastructure Guarantee Fund.
Indonesia Infrastructure Guarantee Fund
This was set up by the government in 2009 as a state-owned company to be a one-stop processor for appraising, structuring, and guaranteeing infrastructure PPPs. The fund provides guarantees to mitigate government contractual risks in PPP projects; these are basically the financial obligations of the government contracting agency. The fund manages the guarantee and processes any claims.
Tax Incentives and Viability Gap Funding
Through the Ministry of Finance, the government can extend tax incentives to private partners for certain types of PPP projects. Viability gap funding is available for up to 50% of the construction, equipment, and installation costs of an infrastructure PPP project. It can also be used for interest payments during construction.

Realizing the Potential of PPPs to Advance Asia’s Infrastructure Development308
Comparative AnalysisInfrastructure PPP projects need the support of government, the public, and all major stakeholders to be successful. These parties have a big say on whether a PPP project goes ahead in the first place, and in defining a project and monitoring service quality. Their involvement can identify early in the process potentially problematic issues that can either get overlooked or be more difficult to fix later. Independent public oversight during implementation can build public trust in a project and promote public sector innovation.
Communicating national infrastructure plans with the public and end users needs improving in all three case study countries. Opposition to infrastructure PPPs is widespread because of high user fees, poor service, the involvement of foreign investors, and the potential for corruption. Civic groups in these countries are often critical that infrastructure PPPs can have adverse social and environmental impacts, particularly for minority groups.
Governments need to communicate effectively with the public and civil society on planned infrastructure PPPs. Each project needs a stakeholder engagement strategy that sets out how it will be explained to affected communities and civil society groups. None of the three countries, however, have such strategies. Consultations on planned projects should be held with civil groups to be able to understand early on possible objections to elements of a project. End users should be part of this process and be used to monitor service quality once a project is completed.
Legal and Regulatory Frameworks
Overall, the legal and regulatory frameworks in the three countries are sufficiently conducive for implementing infrastructure PPPs. But there is room for improvement. Indonesia and the Philippines need to streamline their legal and regulatory procedures to be able to resolve disputes efficiently and quickly. In the Republic of Korea, the government set up the Committee for Mediation of Public–Private Partnership Project Disputes for this very purpose. Disputes are not unusual in PPPs since they require large investments over a long time, and are susceptible to changes in business conditions and policy objectives. Being able to manage disputes is essential because they are not only costly and time-consuming, but, if unchecked, can wreck a partnership.
In Indonesia and the Philippines, officials working on PPPs need training on PPP rules and regulations, and to gain a thorough understanding of project-based concession agreements. Going by the Republic of Korea’s experience, most PPP disputes are over toll fees, project costs, taxes, the interpretation and application of laws, refinancing gain sharing, and government payments.
PPP Systems in the Republic of Korea, the Philippines, and Indonesia 309
Procurement Processes
For solicited projects, Indonesia and the Philippines appraise, select, budget, manage, and monitor their PPPs separately from government-procured projects. This practice distorts the priorities of public investments, ignores the management of public finances, and creates undue fiscal risks, which can be caused by PPP projects. To counter these problems and to help promote slackening private investment in infrastructure, the Republic of Korea, in 2015, adopted a unified framework for integrating PPPs and government-procured investment projects.
Using a unified framework was also aimed at promoting private sector investments in infrastructure, which have declined since 2011. To help counter this, the government raised the amount of PPP investment targets by widening the scope of PPP applications and government-procured infrastructure projects that can be converted into PPPs. To do this, it was essential to devise an implementation process that introduced PPPs as an alternative procurement method for traditionally procured government infrastructure projects. For this, a unified procedure was needed to review government-procured and PPP projects. Under the framework, the Ministry of Economy and Finance selects a project for which a preliminary feasibility study and a value-for-money test are conducted. Based on the Republic of Korea’s experiences, the unified framework ensures that the modality that offers the best value for money is chosen. Indonesia and the Philippines would benefit from using a unified framework to be able to assess their PPP and government-procured investment projects more objectively. Doing this will also benefit the management of their public finances.
All three countries have legal bases for PPPs that allow for unsolicited proposals. The Philippines and Indonesia give precise conditions for unsolicited proposals to prevent them from being overused, and for procurement procedures to enhance transparency and invite third-party participation. The Republic of Korea, in 2016, relaxed its regulations on unsolicited proposals by allowing private proposals for BTL projects. Unlike developed countries, which prepare projects that attract private investors without relying on unsolicited proposals, the Republic of Korea promotes unsolicited proposals to expand the participation of small and medium-sized companies and financial investors in PPPs. Even though PIMAC scrutinizes unsolicited proposals using mandatory value-for-money tests, the government still evaluates these proposals to ensure their alignment with its investment needs and competitive procurement processes. To keep the market competitive, the procedure must allow sufficient time for bidders other than the project proponent to make their proposals.

Realizing the Potential of PPPs to Advance Asia’s Infrastructure Development310
Well-Functioning Institutions
PPP institutional systems in the Philippines and the Republic of Korea center on their ministries of finance, while Indonesia’s system is dispersed among several agencies. For example, the Indonesian Ministry of Finance secures budgets for PPP projects, and plans and provides government financial support for PPPs, while the National Development Planning Agency oversees project evaluations and management, and builds the capacity of other agencies to handle PPPs. The Indonesia Investment Coordinating Board, meanwhile, provides information on the PPP system and projects to investors, and the Coordinating Ministry for Economic Affairs of Indonesia coordinates PPPs with relevant organizations. To ensure a stable and systematic institutional system for PPPs, the government should clearly set out the functions of all ministries and government institutions for working on PPPs to avoid overlaps and conflicts of interest.
All three countries have national support agencies for PPPs for project development, feasibility studies, and project evaluations, though there are differences in their functions and roles. The Republic of Korea’s PIMAC is independent; the Philippines’ PPP Center is attached to NEDA, a government agency; and Indonesia has two central government PPP units. PIMAC may not finance PPP projects, but the PPP units of Indonesia and the Philippines can.
Risk Sharing
Private investors will only come in on government infrastructure projects, if they are confident of earning a decent return on their investment. Especially at the early stages of PPP transactions, private partners require government financial support or guarantees to cover certain risks. Governments, for their part, want their infrastructure projects to be bankable, and they use a range of supportive instruments to achieve this.
All three countries have policy measures to promote infrastructure PPPs. The Philippines makes viability gap funding available for solicited PPP projects. Viability gap funding is also available for infrastructure PPPs in Indonesia. The Republic of Korea provides financial support to resolve financial feasibility problems that may occur in an infrastructure PPP. A construction subsidy, for example, can be given to a special purpose vehicle if the competent authority deems it necessary for maintaining user fees at a certain level.
Inadequate right-of-way acquisition processes and government budgets for land acquisition are hindering the implementation of infrastructure PPPs in Indonesia and the Philippines. Compulsory land acquisitions are controversial and take time to resolve, and the governments of both countries

PPP Systems in the Republic of Korea, the Philippines, and Indonesia 311
are taking steps to tackle this problem. In the Republic of Korea, the competent authority may, if necessary, buy land for an infrastructure PPP and let the concessionaire use it free of charge until project completion. In Indonesia, land acquisition is an obligation of the government contracting agency, and Presidential Regulation No. 30 of 2015 allows investors to prefinance land acquisition, which is later recovered by the government. In the Philippines, the Public–Private Partnership Strategic Support Fund reduces the risk of project delays or cancellations because of land acquisitions by helping the government meet the cost of these acquisitions or doing preparatory work on them. Despite these efforts, all three countries need to do more to ensure a smoother path for land acquisitions by providing efficient processes for land compensation, timelines, financing schedules, and plans and formulas for compensating landowners.
Although not exhaustive, the comparative analysis of the three countries shows that enabling legal, institutional, and policy environments are vital for the successful implementation of infrastructure PPPs. Reform efforts—to varying degrees—are being undertaken by the governments of these countries to remove obstacles to the greater participation of the private sector in infrastructure PPPs. But, going by the measures taken so far, bolder steps need to be taken in all three countries.

Realizing the Potential of PPPs to Advance Asia’s Infrastructure Development312
App
endi
x A
12.1:
PPP
Sys
tem
s in
the
Repu
blic
of K
orea
, the
Phi
lippi
nes,
and
Indo
nesia
Asp
ects
Item
The
Rep
ublic
of K
orea
The
Phi
lippi
nes
Indo
nesi
a
Inst
itut
iona
lP
ublic
–pri
vate
pa
rtne
rshi
p (P
PP
) law
s an
d re
gula
tion
s
PP
P L
aw
• A
ct o
n th
e P
rom
otio
n of
Pri
vate
C
apit
al in
to S
ocia
l Ove
rhea
d C
apit
al I
nves
tmen
t and
the
Enf
orce
men
t Dec
ree
of th
e P
PP
Act
(199
4): B
egin
ning
of t
he
syst
emat
ic m
anag
emen
t of P
PP•
Pri
vate
Par
tici
pati
on in
In
fras
truc
ture
Act
(PP
P A
ct) a
nd
the
Enf
orce
men
t and
Dec
ree
of
the
PP
P A
ct (1
999)
: Fun
dam
enta
l la
w fo
r PPP
in in
fras
truc
ture
• P
ublic
–Pri
vate
Par
tner
ship
s in
In
fras
truc
ture
Act
(200
5) a
nd
Enf
orce
men
t Dec
ree
of th
e P
PP
A
ct (2
005
to p
rese
nt):
Est
ablis
hes
a m
anag
emen
t sys
tem
suite
d to
th
e pu
blic
nat
ure
of P
PPs,
and
stre
ngth
ens i
nstit
utio
nal s
uppo
rt
to p
rom
ote
priv
ate
inve
stm
ent i
n in
fras
truc
ture
Maj
or r
elat
ed r
egul
atio
ns
• B
asic
Pla
n fo
r P
PPs
: A
bas
ic p
lan
for P
PPs m
ust b
e es
tabl
ishe
d in
acc
orda
nce
with
the
PPP
Act
. The
Min
istr
y of
Eco
nom
y an
d Fi
nanc
e pu
blis
hes i
t in
the
form
of
an
annu
al a
nnou
ncem
ent.
PP
P L
aw•
Rep
ublic
Act
No.
695
7 (1
990)
: Bu
ild–O
pera
te–T
rans
fer L
aw (B
OT
La
w).
• R
epub
lic A
ct N
o.77
18 (1
994)
: St
reng
then
s 199
0 ac
t. •
Rep
ublic
Act
No.
716
0 (1
991)
: Pr
ovid
es a
loca
l gov
ernm
ent c
ode.
• R
epub
lic A
ct N
o. 8
974
(200
0):
Faci
litat
es th
e ac
quis
ition
of r
ight
-of
-way
site
for n
atio
nal g
over
nmen
t in
fras
truc
ture
pro
ject
s and
for
othe
r pur
pose
s.•
Rep
ublic
Act
No.
897
5 (2
000)
: E
nsur
es th
e ex
pedi
tious
im
plem
enta
tion
and
com
plet
ion
of
gove
rnm
ent i
nfra
stru
ctur
e pr
ojec
ts
by p
rohi
bitin
g lo
wer
cou
rts f
rom
is
suin
g te
mpo
rary
rest
rain
ing
orde
rs
• R
epub
lic A
ct N
o. 9
184
(200
3):
Mod
erni
zes,
stan
dard
izes
, and
re
gula
tes g
over
nmen
t pro
cure
men
t •
Rep
ublic
Act
No.
1075
2 (2
016)
: Fa
cilit
ates
the
acqu
isiti
on o
f rig
ht-
of-w
ay si
te fo
r nat
iona
l gov
ernm
ent
infr
astr
uctu
re p
roje
cts
Gen
eral
Reg
ulat
ions
on
PP
Ps•
Pre
side
ntia
l Reg
ulat
ion
No.
38
(201
5): C
oope
ratio
n be
twee
n go
vern
men
t and
bus
ines
s ent
ities
on
infr
astr
uctu
re
• P
resi
dent
ial R
egul
atio
n N
o. 7
8 (2
010)
: Gov
ernm
ent g
uara
ntee
for
infr
astr
uctu
re P
PP p
roje
cts
Maj
or r
elat
ed r
egul
atio
ns
• M
inis
teri
al R
egul
atio
n of
Fin
ance
N
o. 8
(201
6): G
uide
lines
on
gove
rnm
ent g
uara
ntee
• H
ead
of N
atio
nal P
rocu
rem
ent
Age
ncy
Reg
ulat
ion
No.
19 (2
015)
: Pr
ocur
emen
t gui
delin
es fo
r bu
sine
sses
on
infr
astr
uctu
re P
PPs
• M
inis
teri
al R
egul
atio
n of
Fin
ance
N
o. 19
0 (2
015)
: Ava
ilabi
lity
paym
ents
fo
r inf
rast
ruct
ure
PPPs
•
Min
iste
rial
Reg
ulat
ion
of H
ome
Aff
air
No.
96
(201
6): A
vaila
bilit
y pa
ymen
ts fo
r reg
iona
l inf
rast
ruct
ure
PPPs
•
Min
iste
rial
Reg
ulat
ion
of F
inan
ce
No.
223
(201
2): V
iabi
lity
gap
fund
ing
cont
inue
d on
nex
t pag
e

PPP Systems in the Republic of Korea, the Philippines, and Indonesia 313
App
endi
x A
12.1:
PPP
Sys
tem
s in
the
Repu
blic
of K
orea
, the
Phi
lippi
nes,
and
Indo
nesia
Asp
ects
Item
The
Rep
ublic
of K
orea
The
Phi
lippi
nes
Indo
nesi
a
Inst
itut
iona
lP
ublic
–pri
vate
pa
rtne
rshi
p (P
PP
) law
s an
d re
gula
tion
s
PP
P L
aw
• A
ct o
n th
e P
rom
otio
n of
Pri
vate
C
apit
al in
to S
ocia
l Ove
rhea
d C
apit
al I
nves
tmen
t and
the
Enf
orce
men
t Dec
ree
of th
e P
PP
Act
(199
4): B
egin
ning
of t
he
syst
emat
ic m
anag
emen
t of P
PP•
Pri
vate
Par
tici
pati
on in
In
fras
truc
ture
Act
(PP
P A
ct) a
nd
the
Enf
orce
men
t and
Dec
ree
of
the
PP
P A
ct (1
999)
: Fun
dam
enta
l la
w fo
r PPP
in in
fras
truc
ture
• P
ublic
–Pri
vate
Par
tner
ship
s in
In
fras
truc
ture
Act
(200
5) a
nd
Enf
orce
men
t Dec
ree
of th
e P
PP
A
ct (2
005
to p
rese
nt):
Est
ablis
hes
a m
anag
emen
t sys
tem
suite
d to
th
e pu
blic
nat
ure
of P
PPs,
and
stre
ngth
ens i
nstit
utio
nal s
uppo
rt
to p
rom
ote
priv
ate
inve
stm
ent i
n in
fras
truc
ture
Maj
or r
elat
ed r
egul
atio
ns
• B
asic
Pla
n fo
r P
PPs
: A
bas
ic p
lan
for P
PPs m
ust b
e es
tabl
ishe
d in
acc
orda
nce
with
the
PPP
Act
. The
Min
istr
y of
Eco
nom
y an
d Fi
nanc
e pu
blis
hes i
t in
the
form
of
an
annu
al a
nnou
ncem
ent.
PP
P L
aw•
Rep
ublic
Act
No.
695
7 (1
990)
: Bu
ild–O
pera
te–T
rans
fer L
aw (B
OT
La
w).
• R
epub
lic A
ct N
o.77
18 (1
994)
: St
reng
then
s 199
0 ac
t. •
Rep
ublic
Act
No.
716
0 (1
991)
: Pr
ovid
es a
loca
l gov
ernm
ent c
ode.
• R
epub
lic A
ct N
o. 8
974
(200
0):
Faci
litat
es th
e ac
quis
ition
of r
ight
-of
-way
site
for n
atio
nal g
over
nmen
t in
fras
truc
ture
pro
ject
s and
for
othe
r pur
pose
s.•
Rep
ublic
Act
No.
897
5 (2
000)
: E
nsur
es th
e ex
pedi
tious
im
plem
enta
tion
and
com
plet
ion
of
gove
rnm
ent i
nfra
stru
ctur
e pr
ojec
ts
by p
rohi
bitin
g lo
wer
cou
rts f
rom
is
suin
g te
mpo
rary
rest
rain
ing
orde
rs
• R
epub
lic A
ct N
o. 9
184
(200
3):
Mod
erni
zes,
stan
dard
izes
, and
re
gula
tes g
over
nmen
t pro
cure
men
t •
Rep
ublic
Act
No.
1075
2 (2
016)
: Fa
cilit
ates
the
acqu
isiti
on o
f rig
ht-
of-w
ay si
te fo
r nat
iona
l gov
ernm
ent
infr
astr
uctu
re p
roje
cts
Gen
eral
Reg
ulat
ions
on
PP
Ps•
Pre
side
ntia
l Reg
ulat
ion
No.
38
(201
5): C
oope
ratio
n be
twee
n go
vern
men
t and
bus
ines
s ent
ities
on
infr
astr
uctu
re
• P
resi
dent
ial R
egul
atio
n N
o. 7
8 (2
010)
: Gov
ernm
ent g
uara
ntee
for
infr
astr
uctu
re P
PP p
roje
cts
Maj
or r
elat
ed r
egul
atio
ns
• M
inis
teri
al R
egul
atio
n of
Fin
ance
N
o. 8
(201
6): G
uide
lines
on
gove
rnm
ent g
uara
ntee
• H
ead
of N
atio
nal P
rocu
rem
ent
Age
ncy
Reg
ulat
ion
No.
19 (2
015)
: Pr
ocur
emen
t gui
delin
es fo
r bu
sine
sses
on
infr
astr
uctu
re P
PPs
• M
inis
teri
al R
egul
atio
n of
Fin
ance
N
o. 19
0 (2
015)
: Ava
ilabi
lity
paym
ents
fo
r inf
rast
ruct
ure
PPPs
•
Min
iste
rial
Reg
ulat
ion
of H
ome
Aff
air
No.
96
(201
6): A
vaila
bilit
y pa
ymen
ts fo
r reg
iona
l inf
rast
ruct
ure
PPPs
•
Min
iste
rial
Reg
ulat
ion
of F
inan
ce
No.
223
(201
2): V
iabi
lity
gap
fund
ing
Asp
ects
Item
The
Rep
ublic
of K
orea
The
Phi
lippi
nes
Indo
nesi
a
Maj
or r
elat
ed r
egul
atio
ns
• E
xecu
tive
Ord
er N
o. 4
23 (2
005)
: R
ules
and
pro
cedu
res f
or re
view
ing
and
appr
ovin
g go
vern
men
t co
ntra
cts
• E
xecu
tive
Ord
er N
o. 8
(201
0) a
s am
ende
d by
Exe
cuti
ve O
rder
N
o. 13
6 (2
013)
: R
eorg
aniz
es a
nd
rena
mes
the
Build
–Ope
rate
–T
rans
fer C
ente
r to
the
Publ
ic–
Priv
ate
Part
ners
hip
Cen
ter o
f th
e Ph
ilipp
ines
, and
tran
sfer
s its
at
tach
men
t fro
m th
e D
epar
tmen
t of
Tra
de a
nd In
dust
ry to
the
Nat
iona
l E
cono
mic
and
Dev
elop
men
t A
utho
rity
(NE
DA
) •
Exe
cuti
ve O
rder
No.
78
(201
2):
Man
date
s pro
visi
ons o
n th
e us
e of
alte
rnat
ive
disp
ute
reso
lutio
n m
echa
nism
s in
cont
ract
s inv
olvi
ng
build
–ope
rate
–tra
nsfe
r pro
ject
s, jo
int v
entu
re a
gree
men
ts b
etw
een
the
gove
rnm
ent a
nd p
riva
te e
ntiti
es,
and
thos
e en
tere
d in
to b
y lo
cal
gove
rnm
ent u
nits
cont
inue
d on
nex
t pag
e
Tabl
e A
12.1
cont
inue
d

Realizing the Potential of PPPs to Advance Asia’s Infrastructure Development314
Asp
ects
Item
The
Rep
ublic
of K
orea
The
Phi
lippi
nes
Indo
nesi
a
Type
s of
PP
P
proc
urem
ent
• Bu
ild–o
pera
te–t
rans
fer
• Bu
ild–t
rans
fer–
leas
e•
Build
–tra
nsfe
r–op
erat
e•
Build
–ow
n–op
erat
e•
Build
–lea
se–t
rans
fer
• R
ehab
ilita
te–o
pera
te–t
rans
fer
• R
ehab
ilita
te–o
wn–
oper
ate
• R
ehab
ilita
te–t
rans
fer–
leas
e
• Bu
ild–t
rans
fer
• Bu
ild–l
ease
–tra
nsfe
r•
Build
–ope
rate
–tra
nsfe
r•
Build
–ow
n–op
erat
e•
Build
–tra
nsfe
r–op
erat
e •
Con
trac
t–ad
d–op
erat
e •
Dev
elop
–ope
rate
–tra
nsfe
r •
Reh
abili
tate
–ope
rate
–tra
nsfe
r •
Reh
abili
tate
–ow
n–op
erat
e
• Bu
ild–o
pera
te–t
rans
fer
• Bu
ild–o
wn–
oper
ate
• D
esig
n–bu
ild–o
pera
te•
Des
ign–
build
–lea
se•
Build
–buy
–ope
rate
Elig
ible
fa
cilit
ies
• R
oads
: Roa
ds a
nd a
ppur
tena
nces
, pa
rkin
g lo
ts, i
nter
mod
al tr
ansf
er
cent
ers,
inte
llige
nt tr
ansp
ort
syst
ems,
publ
ic g
arag
es fo
r tax
is•
Rai
l: R
ailw
ays,
urba
n ra
ilway
s, ra
ilway
faci
litie
s •
Port
s: H
arbo
r fac
ilitie
s, fis
hery
ha
rbor
faci
litie
s, in
fras
truc
ture
fa
cilit
ies l
inki
ng n
ew h
arbo
rs to
the
supp
ortin
g ar
teri
al n
etw
ork
• A
irpo
rts
• W
ater
res
ourc
es:
Mul
tipur
pose
da
ms,
rive
r fac
ilitie
s, w
ater
wor
ks
syst
ems,
inte
rmed
iate
wat
erw
ork
• In
form
atio
n an
d co
mm
unic
atio
n:
Tele
com
mun
icat
ion
faci
litie
s, su
per h
igh-
spee
d in
form
atio
n an
d co
mm
unic
atio
n ne
twor
ks,
info
rmat
ion
and
com
mun
icat
ion
netw
orks
, spa
tial i
nfor
mat
ion
syst
ems,
infr
astr
uctu
re fo
r ub
iqui
tous
(sm
art)
citi
es
• H
ighw
ays/
road
s•
Rai
l•
Port
•
Air
port
s•
Pow
er g
ener
atio
n•
Tele
com
mun
icat
ion
• In
form
atio
n te
chno
logy
and
da
taba
ses
• Ir
riga
tion
infr
astr
uctu
re
• W
ater
supp
ly•
Edu
catio
n an
d he
alth
infr
astr
uctu
re•
Land
recl
amat
ion,
dre
dgin
g •
Indu
stri
al a
nd to
uris
m e
stat
es o
r to
wns
hips
• G
over
nmen
t bui
ldin
gs, h
ousi
ng
proj
ects
• M
arke
ts, s
laug
hter
hous
es•
War
ehou
ses,
post
-har
vest
faci
litie
s•
Publ
ic fi
sh p
orts
, fish
pond
s•
Env
iron
men
tal a
nd so
lid w
aste
m
anag
emen
t•
Clim
ate
chan
ge m
itiga
tion
and
adap
tatio
n i
nfra
stru
ctur
e
• T
rans
port
, roa
ds
• W
ater
reso
urce
s and
irri
gatio
n•
Dri
nkin
g w
ater
•
Cen
tral
was
tew
ater
man
agem
ent
• Lo
cal w
aste
wat
er m
anag
emen
t •
Was
te m
anag
emen
t sys
tem
s •
Tele
com
mun
icat
ion
and
info
rmat
ics
• E
lect
rici
ty
• O
il, g
as, a
nd re
new
able
ene
rgy
• E
nerg
y co
nver
sion
• U
rban
faci
litie
s•
Edu
catio
n fa
cilit
ies
• Sp
orts
and
cul
ture
faci
litie
s •
Are
a in
fras
truc
ture
•
Tour
ism
•
Hea
lth
• Pr
ison
s •
Publ
ic h
ousi
ng
cont
inue
d on
nex
t pag
e
Tabl
e A
12.1
cont
inue
d

PPP Systems in the Republic of Korea, the Philippines, and Indonesia 315
Asp
ects
Item
The
Rep
ublic
of K
orea
The
Phi
lippi
nes
Indo
nesi
a
• E
nerg
y: E
lect
ric
sour
ce fa
cilit
ies,
gas s
uppl
y fa
cilit
ies,
inte
grat
ed
ener
gy fa
cilit
ies,
new
and
re
new
able
ene
rgy
faci
litie
s •
Env
iron
men
t: S
ewag
e sy
stem
s, pu
blic
sew
age
trea
tmen
t fac
ilitie
s, ex
crem
ent f
acili
ties,
faci
litie
s for
re
use
of se
wag
e an
d w
aste
wat
er,
was
te d
ispo
sal f
acili
ties,
was
tew
ater
tr
eatm
ent t
erm
inal
faci
litie
s, pu
blic
tr
eatm
ent f
acili
ties
• D
istr
ibut
ion:
Log
istic
s ter
min
als,
logi
stic
s com
plex
es, b
us te
rmin
als
• C
ultu
re, s
port
s, a
nd to
uris
m
faci
litie
s: T
ouri
st fa
cilit
ies,
reso
rt
com
plex
es, s
peci
aliz
ed sp
orts
fa
cilit
ies,
publ
ic sp
orts
faci
litie
s, lib
rari
es, m
useu
ms,
art g
alle
ries
, in
tern
atio
nal c
onfe
renc
e fa
cilit
ies,
cultu
ral f
acili
ties,
faci
litie
s for
bi
cycl
e ri
ding
, you
th re
crea
tion
faci
litie
s, sc
ienc
e m
useu
ms,
urba
n pa
rks
• E
duca
tion
: K
inde
rgar
tens
, el
emen
tary
and
seco
ndar
y sc
hool
s, hi
gher
edu
catio
n fa
cilit
ies
cont
inue
d on
nex
t pag
e
Tabl
e A
12.1
cont
inue
d

Realizing the Potential of PPPs to Advance Asia’s Infrastructure Development316
Asp
ects
Item
The
Rep
ublic
of K
orea
The
Phi
lippi
nes
Indo
nesi
a
• N
atio
nal d
efen
se
• H
ousi
ng
• In
dust
rial
com
plex
es
• W
elfa
re:
Nur
sing
faci
litie
s, ch
ildca
re fa
cilit
ies
• Fo
rest
ry:
Nat
ural
and
recr
eatio
nal
fore
sts,
arbo
retu
ms
• P
ublic
offi
ces
• C
rem
ator
ium
s
Fin
anci
al
supp
ort
Pro
ject
D
evel
opm
ent
Fund
Non
e•
Proj
ect D
evel
opm
ent a
nd
Mon
itori
ng F
und,
set u
p in
201
0, fo
r go
vern
men
t fina
nces
to b
e us
ed fo
r de
velo
ping
PPP
s.
• PT
Sar
ana
Mul
ti In
fras
truc
ture
pr
ovid
es th
e in
fras
truc
ture
de
velo
pmen
t fina
nces
.
Gov
ernm
ent
supp
ort
• C
onst
ruct
ion
subs
idy
• R
isk-
shar
ing
syst
em
Ȫ
Build
–tra
nsfe
r–op
erat
e, ri
sk
shar
ing
Ȫ
Build
–tra
nsfe
r–op
erat
e,
adju
sted
•
Cre
dit g
uara
ntee
• B
uyou
t rig
ht
• C
ompe
nsat
ion
on te
rmin
atio
n•
Infr
astr
uctu
re b
onds
• In
fras
truc
ture
fund
s•
Tax
trea
tmen
t
• C
ase
by c
ase
appr
oach
: No
guar
ante
e fo
r uns
olic
ited
proj
ects
• C
ost s
hari
ng: I
mpl
emen
ting
agen
cy
or lo
cal g
over
nmen
t uni
t bea
rs
a po
rtio
n of
the
capi
tal e
xpen
se
for a
n in
fras
truc
ture
PPP
pro
ject
. G
over
nmen
t sha
re m
ay b
e fin
ance
d fr
om d
irec
t app
ropr
iatio
ns o
r offi
cial
dev
elop
men
t ass
ista
nce
• C
redi
t enh
ance
men
t: C
an in
clud
e go
vern
men
t gua
rant
ees o
n pr
ojec
t pe
rfor
man
ce
• D
irec
t sup
port
: The
gov
ernm
ent
cont
ract
ing
agen
cy m
ay c
ontr
ibut
e ce
rtai
n ph
ysic
al fa
cilit
ies t
o an
in
fras
truc
ture
PPP
pro
ject
. It c
an
also
cov
er c
erta
in c
apita
l cos
ts a
nd
prov
ide
oper
atin
g su
bsid
ies t
hrou
gh
the
annu
al n
atio
nal o
r reg
iona
l bu
dget
.•
Land
acq
uisi
tion
: The
Min
istr
y of
Fin
ance
thro
ugh
its S
tate
Ass
et
Man
agem
ent A
genc
y (L
MA
N)
laun
ched
a n
ew sc
hem
e fo
r lan
d ac
quis
ition
of n
atio
nal s
trat
egic
pr
ojec
ts in
201
7. LM
AN
pro
vide
s la
nd fu
nds f
or a
ll na
tiona
lly st
rate
gic
proj
ects
for t
imel
y la
nd a
cqui
sitio
n.
cont
inue
d on
nex
t pag
e
Tabl
e A
12.1
cont
inue
d

PPP Systems in the Republic of Korea, the Philippines, and Indonesia 317
Asp
ects
Item
The
Rep
ublic
of K
orea
The
Phi
lippi
nes
Indo
nesi
a
• D
irec
t gov
ernm
ent e
quit
y:
Subs
crip
tion
by th
e go
vern
men
t or
any
of i
ts a
genc
ies o
r loc
al
gove
rnm
ent u
nits
of s
hare
s or o
ther
se
curi
ties c
onve
rtib
le to
shar
es
of a
pro
ject
com
pany
’s st
ock.
The
su
bscr
iptio
n ca
n be
pai
d by
cas
h or
as
sets
.
• C
onti
ngen
t sup
port
: Gov
ernm
ent
guar
ante
e to
com
pens
ate
a PP
P pr
ojec
t com
pany
if a
spec
ified
risk
ha
ppen
s •
Indo
nesi
a In
fras
truc
ture
Gua
rant
ee
Fund
: Sta
te-o
wne
d co
mpa
ny fo
r ev
alua
ting,
stru
ctur
ing,
and
man
agin
g gu
aran
tees
to m
itiga
te g
over
nmen
t-
rela
ted
cont
ract
ual r
isks
in P
PP
proj
ects
•
Tax
ince
ntiv
es a
nd v
iabi
lity
gap
fund
ing:
The
gov
ernm
ent,
thro
ugh
the
Min
istr
y of
Fin
ance
, may
ext
end
tax
ince
ntiv
es to
pri
vate
par
tner
s fo
r cer
tain
type
s of p
roje
cts.
Via
bilit
y ga
p fu
ndin
g is
ava
ilabl
e as
go
vern
men
t sup
port
for u
p to
50%
of
the
cons
truc
tion,
equ
ipm
ent,
and
inst
alla
tion
cost
s of a
n in
fras
truc
ture
PP
P pr
ojec
t. It
may
als
o be
use
d fo
r int
eres
t pay
men
ts d
urin
g th
e co
nstr
uctio
n pe
riod
.
cont
inue
d on
nex
t pag
e
Tabl
e A
12.1
cont
inue
d

Realizing the Potential of PPPs to Advance Asia’s Infrastructure Development318
Asp
ects
Item
The
Rep
ublic
of K
orea
The
Phi
lippi
nes
Indo
nesi
a
Land
and
bu
ildin
gsFo
reig
n ow
ners
hip
for
land
and
bu
ildin
gs
No
rest
rict
ions
The
1987
Con
stitu
tion
sets
out
fore
ign-
owne
rshi
p lim
its o
n la
ndow
ners
hip.
C
ompa
nies
that
are
at l
east
60%
ow
ned
by F
ilipi
nos m
ay a
cqui
re p
riva
te la
nd,
but t
hey
may
onl
y le
ase
and
not o
wn
publ
ic la
nd.
Land
ac
quis
itio
nsu
ppor
t by
gove
rnm
ent
The
con
cess
iona
ire
has e
xpro
pria
tion
righ
ts u
nder
the
PPP
Act
and
may
en
trus
t lan
d pu
rcha
se, c
ompe
nsat
ion
for l
osse
s, an
d re
sett
lem
ent,
amon
g ot
her t
hing
s, to
the
com
pete
nt
auth
ority
or t
he h
ead
of th
e re
leva
nt
loca
l gov
ernm
ent.
Dep
artm
ent o
f Pub
lic W
orks
and
H
ighw
ays h
as a
lloca
tions
for p
ublic
in
fras
truc
ture
pro
ject
s, in
clud
ing
for
land
acq
uisi
tion.
The
Pub
lic–P
riva
te
Part
ners
hip
Stra
tegi
c Su
ppor
t Fun
d w
as e
stab
lishe
d to
cov
er c
osts
for
righ
t-of
-way
acq
uisi
tions
and
rela
ted
cost
s, in
clud
ing
rese
ttle
men
t cos
ts.
The
fund
is a
lum
p-su
m a
ppro
pria
tion
incl
uded
in a
n im
plem
entin
g ag
ency
’s (I
A) b
udge
t.
In 2
015,
LM
AN
was
est
ablis
hed
to fu
nd
land
acq
uisi
tions
for i
nfra
stru
ctur
e pr
ojec
ts. T
he sc
ope
of su
ppor
t was
ex
tend
ed to
nat
iona
l str
ateg
ic p
roje
cts
by M
inis
try
of F
inan
ce R
egul
atio
n N
o.
21 (2
017)
.
cont
inue
d on
nex
t pag
e
Tabl
e A
12.1
cont
inue
d

PPP Systems in the Republic of Korea, the Philippines, and Indonesia 319
Asp
ects
Item
The
Rep
ublic
of K
orea
The
Phi
lippi
nes
Indo
nesi
a
Sele
ctio
n pr
oces
ses
Pro
ject
pr
oces
ses
and
guid
elin
es
Solic
ited
pro
ject
sD
esig
natio
n of
an
elig
ible
pro
ject
⇒
Publ
ic n
otifi
catio
n of
a re
ques
t for
pr
opos
als ⇒
Rev
iew
and
eva
luat
ion
of p
roje
ct p
lans
⇒ C
ompl
etio
n of
co
nces
sion
agr
eem
ent a
nd d
esig
natio
n of
con
cess
iona
ire
⇒ A
ppro
val o
f the
im
plem
enta
tion
plan
⇒ C
onfir
mat
ion
of c
ompl
etio
n
Uns
olic
ited
pro
ject
sPr
opos
al fi
ling
⇒ R
evie
w o
f the
pr
opos
al a
nd v
alue
-for
-mon
ey te
st
(Pub
lic a
nd P
riva
te In
fras
truc
ture
In
vest
men
t Man
agem
ent C
ente
r)
⇒ S
ubm
issi
on o
f a re
view
opi
nion
⇒
Pub
lic n
otic
e of
the
prop
osal
⇒
Rev
iew
and
eva
luat
ion
of th
e pr
opos
als
⇒ D
esig
natio
n of
con
cess
iona
ire
⇒
App
rova
l of t
he im
plem
enta
tion
plan
⇒
Con
firm
atio
n of
com
plet
ion
Solic
ited
pro
ject
sPr
ojec
t ide
ntifi
catio
n ⇒
Bus
ines
s cas
e de
velo
pmen
t ⇒ F
easi
bilit
y st
udy
⇒
Proj
ect a
ppro
val ⇒
Ten
der p
roce
ss
(bas
ed o
n th
e BO
T L
aw’s
impl
emen
ting
rule
s and
regu
latio
ns) ⇒
App
rova
l and
ex
ecut
ion
of th
e co
ntra
ct (b
ased
on
the
BOT
Law
’s im
plen
ting
rule
s and
re
gula
tions
) ⇒ N
otic
e to
com
men
ce
Solic
ited
pro
ject
sId
entifi
catio
n of
pot
entia
l pro
ject
s ⇒
Prio
ritiz
atio
n of
pro
ject
⇒
Issu
ance
of P
PP p
roje
ct p
lan
list ⇒
C
ompl
etio
n of
pre
feas
ibili
ty st
udy
⇒
Com
plet
ion
of re
adin
ess s
tudy
⇒
Gov
ernm
ent c
ontr
actin
g ag
ency
(GC
A)
prep
ares
the
proc
urem
ent p
lan
for p
ublic
te
nder
⇒ E
valu
atio
n of
pre
qual
ifica
tion
docu
men
t of p
rosp
ectiv
e bi
dder
s ⇒
Subm
issi
on o
f pro
posa
l ⇒ O
peni
ng o
f bi
ddin
g do
cum
ents
⇒ E
valu
atio
n of
off
ers ⇒
Wri
tten
reco
rd o
f pro
cure
men
t re
sults
⇒ T
ende
r win
ner s
tipul
atio
n ⇒
Stip
ulat
ion
of a
sing
le b
idde
r ⇒
Obj
ectio
ns, i
f any
, fro
m o
ther
bid
ders
⇒
Issu
ance
of i
nner
stip
ulat
ion
lett
er ⇒
Si
gnin
g of
PPP
agr
eem
ent ⇒
Fin
anci
al
clos
ure
cont
inue
d on
nex
t pag
e
Tabl
e A
12.1
cont
inue
d

Realizing the Potential of PPPs to Advance Asia’s Infrastructure Development320
Asp
ects
Item
The
Rep
ublic
of K
orea
The
Phi
lippi
nes
Indo
nesi
a
Uns
olic
ited
pro
ject
sT
he st
artin
g po
int o
f thi
s pro
cess
is th
e su
bmis
sion
by
the
priv
ate
prop
onen
t of
a c
ompl
ete
prop
osal
to th
e he
ad o
f th
e IA
⇒ A
ckno
wle
dgem
ent o
f rec
eipt
of
pro
posa
l by
the
IA ⇒
App
rova
l of
proj
ect (
Inve
stm
ent C
oord
inat
ing
Com
mitt
ee [I
CC
]/ N
ED
A b
oard
) ⇒
Eva
luat
ion
of th
e pr
opos
al a
nd
issu
ance
of o
rigi
nal p
ropo
nent
stat
us
that
no
othe
r sim
ilar p
ropo
sals
will
be
ente
rtai
ned
and
prop
onen
t giv
en th
e ri
ght t
o m
atch
com
plyi
ng c
ompa
rativ
e pr
opos
als ⇒
Sub
mis
sion
for I
CC
ap
prov
al ⇒
Neg
otia
ting
IA in
form
s pr
ivat
e pr
opon
ent o
f the
mec
hani
cs fo
r ne
gotia
tion
and
peri
od o
f neg
otia
tion⇒
So
licita
tion
of c
ompa
rativ
e pr
opos
al
(man
aged
by
Pre
-qua
lifica
tion,
Bid
s, an
d Aw
ards
Com
mitt
ee, u
sing
the
sam
e pr
inci
ples
and
tran
spar
ency
m
easu
res a
s in
a co
mpe
titiv
e te
nder
) ⇒
Eva
luat
ion
of c
ompa
rativ
e pr
opos
als
(ado
pts t
hree
stag
e ev
alua
tion:
qu
alifi
catio
n, te
chni
cal p
ropo
sal,
and
finan
cial
pro
posa
l) ⇒
Rig
ht to
m
atch
in th
e ev
ent o
f a m
ore
supe
rior
co
mpa
rativ
e pr
opos
al ⇒
App
rova
l an
d ex
ecut
ion
of c
ontr
act ⇒
Not
ice
to
com
men
ce
Uns
olic
ited
pro
ject
sSu
bmis
sion
of p
roje
ct c
once
pt d
ocum
ent
and
qual
ifica
tion
of th
e to
-be-
prop
onen
t (T
bP) ⇒
GC
A e
valu
ates
the
proj
ect
conc
ept d
ocum
ent ⇒
GC
A is
sues
app
rova
l fo
r the
TbP
to c
arry
out
feas
ibili
ty st
udy
⇒ T
bP su
bmits
the
pref
easi
bilit
y st
udy
docu
men
t ⇒ G
CA
eva
luat
es fe
asib
ility
st
udy
⇒ G
CA
issu
es a
ppro
val o
f the
fe
asib
ility
stud
y ⇒
TbP
com
plet
es a
nd
subm
its th
e fe
asib
ility
stud
y do
cum
ent
and
fulfi
llmen
t of p
requ
alifi
catio
n ⇒
G
CA
eva
luat
es fe
asib
ility
stud
y do
cum
ent
and
the
fulfi
llmen
t of p
requ
alifi
catio
n re
quir
emen
ts ⇒
GC
A d
esig
nate
s the
TbP
as
the
prop
onen
t and
det
erm
ines
the
com
pens
atio
n op
tion
⇒ G
CA
pre
pare
s te
nder
and
bid
doc
umen
ts fo
r the
co
mpe
titiv
e te
nder
pro
cess
⇒ C
alls
for
expr
essi
ons o
f int
eres
t ⇒
Bid
ders
subm
it ex
pres
sion
s of i
nter
est ⇒
Pre
qual
ifica
tion
anno
unce
men
t) ⇒
Bid
ders
take
par
t in
the
preq
ualifi
catio
n ⇒
Ann
ounc
emen
t of
requ
est f
or p
ropo
sal ⇒
Pre
qual
ified
bi
dder
s and
the
prop
onen
t may
take
par
t in
the
tend
er p
roce
ss ⇒
Bid
pre
para
tion
and
subm
issi
on ⇒
Eva
luat
ion
of b
id d
ocum
ents
⇒
Des
igna
tion
of th
e pr
efer
red
bidd
er
bonu
s-po
int o
ptio
n ⇒
Des
igna
tion
of th
e pr
efer
red
bidd
er ri
ght-
to-m
atch
opt
ion
⇒
Ann
ounc
emen
t of t
he p
refe
rred
bid
der ⇒
Si
gnin
g of
PPP
agr
eem
ent
cont
inue
d on
nex
t pag
e
Tabl
e A
12.1
cont
inue
d

PPP Systems in the Republic of Korea, the Philippines, and Indonesia 321
Asp
ects
Item
The
Rep
ublic
of K
orea
The
Phi
lippi
nes
Indo
nesi
a
Pro
ject
list
sN
one
The
PPP
Cen
ter p
ublis
hes a
nd u
pdat
es
the
stat
us o
f PPP
pip
elin
e pr
ojec
ts.
PPP
Book
, ann
ually
yea
rly
by th
e M
inis
try
of N
atio
nal D
evel
opm
ent
Plan
ning
, out
lines
the
PPP
proj
ect p
lans
.
Sour
ces:
Eco
nom
ic R
esea
rch
Inst
itute
for
ASE
AN
and
Eas
t Asi
a. 2
015.
Nat
iona
l Pub
lic–P
riva
te P
artn
ersh
ip F
ram
ewor
ks in
ASE
AN
Mem
ber
Cou
ntri
es. J
akar
ta;
Kor
ea D
evel
opm
ent I
nstit
ute.
201
5. A
Com
pari
son
Stud
y on
the
PPP
Syst
em o
f Kor
ea, P
hilip
pine
s and
Indo
nesi
a. S
ejon
g; a
nd K
orea
Dev
elop
men
t Ins
titut
e Sc
hool
of
Publ
ic P
olic
y an
d M
anag
emen
t. 20
14. M
odul
ariz
atio
n of
Kor
ea’s
Dev
elop
men
t Exp
erie
nce:
The
Exp
ropr
iatio
n an
d C
ompe
nsat
ion
Syst
em in
Kor
ea. S
ejon
g.
Not
e1
In t
he R
epub
lic o
f K
orea
, bas
ed o
n th
e m
erits
of
the
initi
al p
ropo
sal,
extr
a po
ints
with
in 1
0% o
f th
e to
tal e
valu
atio
n po
ints
can
be
awar
ded
to t
he in
itial
pr
opon
ent.
The
rate
of e
xtra
poi
nts i
s inc
lude
d in
the
requ
est f
or p
ropo
sal.
Tabl
e A
12.1
cont
inue
d

Realizing the Potential of PPPs to Advance Asia’s Infrastructure Development322
References
ADB (Asian Development Bank). 2017. Asian Development Outlook 2017 Update: Sustaining Development through Public–Private Partnership. Manila.
Economic Research Institute for ASEAN and East Asia. 2015. National Public–Private Partnership Frameworks in ASEAN Member Countries. Jakarta: Economic Research Institute for ASEAN and East Asia.
EIU (Economist Intelligence Unit). 2015. Evaluating the Environment for Public–Private Partnerships in Asia-Pacific: The 2014 Infrascope. http://www.adb.org/publications/evaluatingenvironmentppp-asia-pacific-2014-infrascope.
Korea Development Institute. 2015. A Comparison Study on the PPP System of Korea, Philippines and Indonesia. Sejong.
Korea Development Institute School of Public Policy and Management. 2014. Modularization of Korea’s Development Experience: The Expropriation and Compensation System in Korea. Sejong.
Ministry of Strategy and Finance, Government of the Republic of Korea. 2015. PPP Promotion Plan. Sejong.
———. 2017. PPP Basic Plans. Sejong.
National Development Planning Agency. 2015. 2015 PPP Book. Jakarta.
Public–Private Partnership Center of the Philippines (PPP Center). 2011. Project Development and Monitoring Facility Guidelines. Manila.
———. 2014. National Government Agency Public–Private Partnership Manual. Manila.
Ricote, Eleazar. 2016. The Philippine PPP Program: Experience and Lessons.Paper presented at the Symposium on Regional Best Practices in PPPs. Australia Awards Office Indonesia. Jakarta, September 5.

323
Contributors
Emmanuel Alano is a consultant in the Economic Research and Regional Cooperation Department of the Asian Development Bank (ADB).
Akash Deep is a senior lecturer in public policy at the Harvard Kennedy School, where he is faculty chair of the Infrastructure in a Market Economy Executive Program and faculty cochair of the International Finance Corporation Executive Program.
Raymond Gaspar is a consultant in ADB’s Economic Research and Regional Cooperation Department.
Xuehui Han is a senior economist in the Strategy, Policy and Budget Department of the Asian Infrastructure Investment Bank.
Suk Hyun is a research fellow of the Korea Capital Market Institute.
Min-Woong Jung is a specialist in the Public and Private Infrastructure Investment Management Center of the Korea Development Institute (KDI).
Alexander Jett is senior public–private partnership specialist in ADB’s Office of Public–Private Partnership.
Jin-Oh Kim is a senior research associate in KDI’s Department of Public Finance and Social Policy.
Jungwook Kim is director in KDI’s Center for Regulatory Studies.
Kang-Soo Kim is a senior fellow in KDI’s Department of Public Finance and Social Policy.
Kiwan Kim is executive director in KDI’s Public and Private Infrastructure Investment Management Center.
Yoo-Eun Koh is a senior research associate in KDI’s Public and Private Infrastructure Investment Management Center.
Hojun Lee is a fellow in KDI’s Department of Public Finance and Social Policy and an economist in the World Bank’s Development Research Group.

Realizing the Potential of PPPs to Advance Asia’s Infrastructure Development324
Minsoo Lee is senior economist and head of the Economics Unit in ADB’s PRC Resident Mission.
Donghyun Park is principal economist in ADB’s Economic Research and Regional Cooperation Department.
Mee-Soo Park is a senior research associate in KDI’s Public and Private Infrastructure Investment Management Center.
Pilipinas F. Quising is senior economics officer in ADB’s Economic Research and Regional Cooperation Department.
Vivek Rao is principal finance sector specialist in ADB’s Southeast Asia Department.
Shu Tian is an economist in ADB’s Economic Research and Regional Cooperation Department.
Michael Timbang is a consultant in ADB’s Economic Research and Regional Cooperation Department.
Mai Lin Villaruel is economics officer in ADB’s Economic Research and Regional Cooperation Department.
Suhyeon Wi is a senior research associate in KDI’s Center for Regulatory Studies.
Xun Wu is the director of the Institute for Public Policy at the Hong Kong University of Science and Technology.
Fauziah Zen is a senior economist at the Jakarta-based Economic Research Institute for ASEAN and East Asia, and a member of the faculty of economics and business at the University of Indonesia.

325
Aaccountability. See transparency and
accountabilityaccounting standards, 201–2, 202bAcemoglu, Daron, 97n8ADB. See Asian Development BankAdejumo, Adebowale O., 67n2Africa, determinants of PPPs in, 140–42,
141t. See also specific countriesAhn, Sungyoon, 115, 116, 125Akash Deep, 1Alano, Emmanuel, 15Allport, Roger, 54–55Andrés, Luis, 170, 185Araya, Gonzalo, 170, 185arbitration, 48, 206–8, 207t, 249–51Arellano, Manuel, 147–48, 151n4Arroyo, Gloria Macapagal, 250Asante, Yaw, 142Aschauer, David, 18ASEAN. See Association of Southeast
Asian NationsASEAN Plus Three, 151n7Asia and Pacific region. See also specific
countries and regionscompetitiveness index rating, 257,
257femergence of infrastructure PPPs,
16–17, 16–17ffailed PPP projects, 48–49, 48–50fhazard ratio compared globally, 64,
64–65tinfrastructure investment gap, 15infrastructure investments (2015), 6labor movements from low- to high-
productivity sectors, 32PPP environment, 287PPP process, 5PPP project performance, global
comparison, 34PPP projects, global percentage of, 3
project survival probability, 58–59, 59–60f, 61–62t, 66
rate of PPP participation, 17, 17fsovereign risks, 5spending requirements to maintain
growth, 6trends and distribution of PPPs, 4
Asian Bond Markets Initiative, 151, 151n7
Asian Development Bank (ADB)Asian Bond Markets Initiative, 151,
151n7borrowing members, risk
classification of, 167–70, 168f, 169t, 184n3
credit-enhancement tools of, 174, 175ton impact of PPPs on economic
growth, 193Independent Evaluation Department
survey on risk perceptions, 168, 168t, 184n2
infrastructure gap in Asia, 15political risk insurance from, 273Project Development and
Monitoring Fund (PDMF), 306Public–Private Partnerships defined
by, 2on success factors for PPPs, 52tariff reform and, 247on value-for-money, 198on welfare benefits of infrastructure,
197Asian financial crisis (1997)
decline in infrastructure investments during, 191
inflation during, 55mismatch in maturity and currency
during, 150PPP promotion following, 215, 225tariff increases resulting from, 249
Asia-Pacific Economic Cooperation, 209
Index
Boxes, figures, notes, and tables are indicated by italics.
Realizing the Potential of PPPs to Advance Asia’s Infrastructure Development326
Association of Southeast Asian Nations (ASEAN), 255, 275
AustraliaAgency for International
Development, 306infrastructure and institution scores
in, 257fPPP market maturity in, 53, 94
BBa, Lika, 142, 143Bangladesh
infrastructure ranking of, 1fPPP to total infrastructure
investment ratios in, 40trisk allocation in, 173
Bank for International Settlements, 143banking and financial sectors. See also
Basel III; debt financing; specific loan typesfactors affecting PPP investment,
80–81long-term savings potential of PPPs,
21project financing, 77–107. See also
bank project financingreforms for, 77structure of banks, 116syndicated loans for project
financing, 109–35. See also syndicated loans for project financing
bank liquidity, 116, 125, 132bank project financing, 9–10, 77–107
bank factors and, 80–81bank syndicate variables and, 88benefits of, 78bond financing vs., 140comparative analysis, 94default risk and, 81, 97n3future research recommendations,
94–96literature review on, 78–82macroeconomic factors and, 88–89in mature markets, 98–103t, 100–101methodology and data for, 83–87,
84–86t, 97nn4–6model estimation for, 87–88
model estimation results, 89–94, 89–91t, 97n9
monetary policy on, 79–80policy implications, 93–94project risk and, 81–82project variables and, 88structure of, 82syndicated loans, 109–35. See also
syndicated loans for project financing
Barro, Robert J., 18Basel III
bond financing and, 139capital standards of, 94, 95, 97n7, 100determinants of PPPs and, 150–51project finance lending requirements
of, 7benchmarking, 240, 246benchmark model of PPP projects, 217–19Berger, Allen N., 115, 117Berlin, Mitchell, 115Bernanke, Ben, 79, 97n1Besanko, David, 117Bester, Helmut, 117Bhattacharya, Shantanu, 52Bhattacharyay, Biswa Nath, 54bidding
costs of, 54Indonesia, 296limits on consortiums for, 230Philippines, 293–94project hazard rates and, 59, 60f, 62regulatory tools for, 240Republic of Korea, 291–92Southeast Asia, 269
bilateral treaties, 237Blanc-Brude, Frederic, 82Blinder, Alan, 97n1Blundell, Richard W., 147, 151n4Bodie, Zvi, 118Bond, Stephen R., 147, 151n4bond financing
advantages of, 7–8Asian Bond Markets Initiative, 151,
151n7bank financing vs., 7, 78–79, 82, 97n2determinants of PPP and, 137, 148,
150, 151n6

Index 327
increase in use of, 139–40, 151n3Project Bond Initiative of EU, 151project bonds, 7–8, 151, 151n6public vs. corporate, 137Republic of Korea, 199–201, 200–201trisk mitigation for, 179for social infrastructure, 179Southeast Asia, 263, 264t, 284n2
Boot, Arnoud W., 110Borio, Claudio, 79Bover, Olympia, 147–48, 151n4Bramati, Maria Caterina, 18breach of contracts, 47, 169, 174, 175t, 179Brealey, Richard A., 82, 113brownfield projects
canceled, 49fpolicy recommendations for, 283risk mitigation for, 172, 172fsurvival rates of, 60f, 61t, 63, 64t, 66
build-operate-transfer (BOT) infrastructure projectsIndonesia, 290Philippines, 289success factors for, 52
build-own-operate (BOO) infrastructure projectsIndonesia, 290Republic of Korea, 288
build–transfer–lease (BTL) infrastructure projects
completion of, 216–17investment recovery, 217Republic of Korea, 194, 195–96t,
198–200, 198t, 216, 288build–transfer–operate (BTO)
infrastructure projectsadjusted and risk sharing, 230completion of, 216–17investment recovery, 217investor composition of, 223, 224tmodel for, 220–21Republic of Korea, 194–95, 194t, 196t,
198, 198t, 216risk-sharing schemes for, 300–302,
300–301funsolicited, 202
bundling effects, 19–20, 82, 222, 228, 230–31
buyout rights, 302, 316
CCalderón, César, 18, 19Cambodia
global competitiveness index rating, 257, 257f, 272t
implementation stage of, 269, 270tinfrastructure and institution scores,
257finfrastructure ranking of, 1fpolicy recommendations for, 283–84
Campos, Javier, 192Canada, PPP market maturity in, 94canceled PPP projects. See failed PPP
projectsCanning, David, 18capital, cost of, 139, 172, 180–82capital markets, 199–200, 269capital requirements
for long-term loans, 144, 150for syndicate loans, 115
Carrillo, Patricia, 54Central Asia, rate of PPP participation
in, 17, 17f. See also specific countriesCerra, Valerie, 24Checherita, Cristina D., 63Chen, Chuan, 54Chile, unsolicited project proposals in,
202, 203tChina. See People’s Republic of ChinaChoi, Wooseok, 115, 116, 125Chong, Alberto, 19climate change, 8, 55communication technology sectors. See
information and communication technology sectors
comparative proposals, 294comparative review of PPP systems, 11,
287–322comparative analysis, 308–11government support for PPPs,
299–307, 300–301f, 303–4t, 306f
legal and regulatory frameworks, 288–90
PPP institutional frameworks, 296–99, 297–99t
PPP systems compared, 312–21project implementation processes,
290–96, 293t, 294–95f
Realizing the Potential of PPPs to Advance Asia’s Infrastructure Development328
competition for contractsconstruction costs, 230Indonesia, 296Philippines, 293–94procurement procedures as
bottlenecks to, 54project survival rates and, 59, 60f,
61t, 62unsolicited project proposals and,
203, 292conflict management, 242. See also
dispute resolutionconstruction investors, 223–30, 224t,
229t, 231n3construction subsidies, 300, 310contingent government support, 307, 317contracts for PPPs
bank project financing and, 82, 95bidding. See biddingbreach of, 47, 169, 174, 175t, 179bundled, 77, 82competition for. See competition for
contractscomplexity of, 205–6credit risks and, 81–82dispute resolution. See dispute
resolutioneconomic growth facilitation
through, 20enforcement of, 109, 114, 119management readiness for, 26, 26fpayment obligation guarantees,
172–73performance obligations in, 3, 19–20,
77PPPs defined by, 2as regulatory agencies, 239, 246renegotiation of, 66, 236, 251risk allocation strategies in, 20risk management and, 53risk mitigation for, 167–87. See also
risk mitigation and sovereign guarantees
risk perception of investors, 168–69, 168t
Southeast Asia, 269special purpose vehicles (SPVs) and, 139syndicated loans and, 110, 114termination of, 47, 66, 251, 302
Cooper, Ian A., 82, 113
Corielli, Francesco, 81, 87corporate project finance, 81, 119, 138, 148corruption
investment climate, effect on, 173as measure of political stability, 56as obstacle to PPPs, 5, 52, 53, 261opposition to PPPs because of, 308PPP investment and GDP growth,
27, 28treducing through PPPs, 20success factors for PPPs and, 64, 67
cost efficiency, 199, 278cost sharing, 304country risk
bank lending, influence on, 87cross-country analysis of, 143risk mitigation and sovereign
guarantees, 167–71, 168t, 169f, 171t, 173, 184nn3–4
court adjudication, dispute resolution and, 206, 207t, 208
credit default swaps, 123, 128, 129credit enhancement
A1 bonds for, 179Kenya, 177to lower cost of capital, 282from MDBs, 8, 168, 171, 173–74, 177,
182–83Philippines, 304–5PPP success factors, 179, 280project bond financing and, 8as risk mitigation tool, 81
credit guarantees, 172, 174, 302credit ratings, 8, 87, 122, 126, 169–71, 173credit risk, 111, 112, 115, 129, 167–70credit supply, 79–80, 95, 97nn1–2cross-border projects, 273cross-ownership, 239currency inconvertibility, 172currency revenues, 169currency risk, 87, 149
Ddata sources. See also Private
Participation in Infrastructure Database of World Bankfor bank project financing, 83–87,
84–86tfor risk assessment and management,
55–58
Index 329
debt concentration, 116, 120, 123–26, 124tdebt financing
bank project financing and, 80, 86, 95, 97n11
compensation on termination and, 302
credit ratings and, 173macroeconomic factors and, 93as percentage of project cost, 139short-term debt for, 117, 126sources of, 7–8special purpose vehicles (SVPs) and,
139debt ratings, 122De Clerck, Dennis, 54default risk
bank project financing and, 81, 97n3loan security and, 117sovereign, 88, 92strategic, 111, 114
delayed PPP projects. See failed PPP projects
Demeulemeester, Erik, 54democracy, determinants of PPPs and, 142Dennis, Steven A., 112, 115, 116, 122, 132deregulation, 236, 240design–build–finance–operate process,
216–17determinants of PPPs, 10, 137–65
correlation matrix for explanatory variables, 162t
countries studied, 151n2data for, 143–45, 144–45f, 146tdifference generalized method of
moments regression, 154–55tempirical framework for, 147–48,
151n4empirical results for, 148–50literature review on, 140–43, 141toverview of PPPs and, 138–40panel fixed effect regression, 156–57tpanel regression with fixed effect,
152–53tpolicy recommendations, 150–51system generalized method of
moments regression, 158–59tvariables defined, 160–61t
Di Lodovico, Amadeo Maria, 52direct government equity, 305direct government subsidies, 305, 306–7
discretionary regulation, 240, 247, 250dispute resolution
arbitration for, 48, 206–8, 207t, 249–51
comparative review of, 308court adjudication for, 206, 207t, 208delayed land acquisition and, 54for failed PPP projects, 48MDB assistance in, 54, 66mediation for, 206–7, 207t, 208fnegotiation for, 206–7, 207tregulation for, 236, 237Republic of Korea, 206–8, 206–7t,
208f, 297water and sanitation sector tariffs,
249–51distressed PPP projects, 48. See also
failed PPP projectsDisyatat, Piti, 79Doloi, Hemanta, 54Duterte, Rodrigo Roa, 267
EEast Asia. See also specific countries
competitiveness index rating, 257, 257f
distribution of PPPs in Asia, 4rate of PPP participation in, 17, 17f
EBRD. See European Bank for Reconstruction and Development
economic growth. See also gross domestic productdeterminants of, 22–23infrastructure investment and, 18,
21, 32long-term, 18PPP impact on, 25, 25fPPP investments and, 149, 191,
192–99, 193f, 194–99t, 255PPP readiness and, 26, 26–27fproject finance and, 118sovereign creditworthiness based
on, 170survival of PPP projects and, 63
economic regulations, 233, 235, 240, 252economic shocks, 79–80. See also Asian
financial crisis; global financial crisisEconomist Intelligence Unit (EIU),
Infrascope (2014), 4, 53, 264, 287education, 1, 217, 275–76, 277f

Realizing the Potential of PPPs to Advance Asia’s Infrastructure Development330
efficiency improvements in infrastructure, 227, 235, 247
electricity sectoraccess to and quality of
infrastructure for, 30–32tcomparative review of, 314–15failed PPP projects in, 54intermittent or lack of access to, 1, 33as pro-poor, 277renewable energy projects, 21, 227emerging economies. See also specific
countriesfinancing for infrastructure in, 150government participation in
financing infrastructure, 139infrastructure benefits, 3PPP infrastructure investment in,
144–45, 144–45f, 146tunsolicited project proposals in, 202,
203tempirical evidence and channels for effectiveness, 9, 15–45
data and empirical approach, 22–24economic growth and, 18–19emergence of infrastructure PPPs
and, 16–17, 16–17fGDP growth and, 27, 28–29tgrowth determinants, 22–23impacts of PPPs, 20–21, 21finfrastructure access and quality,
29–32, 30–32tinvestment booms, 25, 25finvestment ratios, 40tmacroeconomic impact and poverty
reduction, 24macroeconomy and, 19–20policy recommendations, 33–34PPP investment data, 23PPP readiness, 26, 26–27fsectoral employment, 38–39tvariables, definitions, and data
sources, 35–37temployment
from delivery of PPP projects, 24, 32labor movements from low- to high-
productivity sectors, 32quality of infrastructure and, 21transportation infrastructure and,
18–19
variables affecting, 38–39tempowerment, 276–77, 277fenergy sectors. See also electricity
sectorbank project financing for, 84, 84tcomparative review of, 314–15failed PPP projects in, 49, 49fKenya, PPP risk mitigation case
study, 176–78, 177fmaturity of, 17PPP projects (1985–2015), 17fas pro-poor, 277risk allocation in, 173Southeast Asian projects for, 258
equity financing, 7, 139Esty, Benjamin C., 111, 114, 118, 119, 120,
123, 130n4Ethiopia, determinants of PPPs in, 141t,
142Euromoney, 170, 184n4European Bank for Reconstruction and
Development (EBRD), 179European Commission, 212n3Europe and European Union. See also
specific countriesbudgeting and accounting rules in,
202bPPP procurement regulations in, 237Project Bond Initiative, 151European Investment Bank, 151, 179,
202bEuropean PPP Expertise Centre, 202bEurostat, 202bexchange rates, 97n8, 98t, 149
Ffailed PPP projects
as disincentive, 5factors of, 53–55foreign sponsors to reduce, 63global financial crisis and, 225government support and, 59, 138natural disasters and, 63prevention of, 273probability of occurrence, 56–57public sector, risk mitigation from, 138risk assessment based on, 48–50,
48–50f

Index 331
unmitigated risk factors and financing availability, 96
unsolicited projects, 66feasibility studiescontingent government support
based on, 307effectiveness of PPPs and, 51evaluation of, 296funding for, 267Indonesia, 290Philippines, 292in project preparation, 205purpose of, 9Republic of Korea, 197, 210, 291risk factors and, 53
Fiji, PPP to total infrastructure investment ratios in, 40t
financial sectors. See banking and financial sectors
financing for infrastructure. See also specific typesbank lending for, 77–107. See also
bank project financingbonds for. See bond financingconstruction vs. financial investors
for, 223–29, 224t, 229t, 231n3determinants of PPPs and,
137–65. See also determinants of PPPs
lack of, 66MDBs role in, 2, 8, 66mobilizing, 6–8from PPPs, 2–5from private sector, 2, 15, 33, 59, 150from public sector, 6, 33, 256risk in, 167–87. See also risk
mitigation and sovereign guarantees
risk-sharing in, 6–7, 138sources of, 7–8Southeast Asia, 255–85. See also
Southeast Asiasyndicated loans for, 109–36. See
also syndicated loans for project financing
traditional procurement for. See traditional procurement
types of, 138
first best result model of PPP projects, 217–21, 226
foreign aid, determinants of PPPs and, 142–43
foreign currency, 87, 99t, 100tforeign investment
attracting, 138, 148, 243–45, 274breach of contracts and, 47determinants of PPPs and, 149guaranteed fixed returns for, 244–45institutional and regulatory
framework, 139international dispute resolution
mechanisms and, 237local opposition to PPPs because of,
308obstacles to, 261project hazard rates and, 59, 60f, 63Southeast Asia, 269, 284n2
foreign ownership of land, 318foreign ownership of service providers,
236formation requirements for PPPs, 51–52Futagami, Koichi, 18
GGarbacik, Karl, 52Garcia-Appendini, Emilia, 97n2gas industry, 84, 84t, 314–15Gasmi, Farid, 142, 143Gaspar, Raymond, 15Gatti, Stefano, 81, 87, 97n2, 97n4, 130n4GDP. See gross domestic productgearing ratios
description and data sources for, 98tdescriptive statistics for mature
markets, 100tinfluence on bank project financing,
83, 86, 87, 89, 91–94, 101role of equity and, 109
General Agreement on Trade in Services of WTO, 237
generalized method of moments (GMM) approach, 147–50, 151n4
Gertler, Mark, 79Global Competitiveness Report
2017–2018 (WEF), 1, 1f, 5, 256, 257f, 271, 272t

Realizing the Potential of PPPs to Advance Asia’s Infrastructure Development332
global financial crisis (2008)decrease in PPP projects and, 144,
150–51Kenya, 176Philippines, 250real fixed income returns following, 78tariff increases and, 250Thailand, 211
globalization, 22GMM. See generalized method of
moments approachGodlewski, Christophe J., 111, 115, 122,
125, 130n6, 130n8Goldsmith, Hugh, 82governance mechanisms. See also
regulatory governance in PPP performancedeterminants of PPPs, 142improving, 26issues affecting PPP process in,
204–8, 205f, 206t, 208fas obstacle to PPPs, 5, 142PPP investment and GDP growth,
27, 28tPPP project success and, 3PPP readiness and, 26, 26fproject financing and, 7, 93, 97n10,
109, 118Republic of Korea, 194role of banks in, 111, 112, 114role of lead arrangers in, 113, 115Southeast Asia, 262, 282, 283success factors for PPPs and, 3World Wide Governance Indicators
of World Bank, 87, 121–22, 130n5grant funding, 172greenfield projects
canceled, 49foverinvestment in, 246risk mitigation for, 172, 172fsurvival rates of, 59, 60f, 61t, 63, 64t,
66gross domestic product (GDP)bank project financing and, 87, 88,
92–93, 97n8description and data sources for, 98tinvestment booms and, 25, 25fPPP investments and, 27, 28–29t, 32,
32t, 34n2, 149, 201
PPP investments as percentage of, 258, 259t, 264–65, 265f
private sector investment in infrastructure as percentage of, 33
survival of PPP projects and, 63Gupta, L.C., 142
HHaan, Jakob de, 23Habib, Michel A., 82, 113Hammami, Mona, 20, 63, 88, 92, 142,
143, 170Han, Xuehui, 15, 18, 47Hanson, Samuel, 81Haris, Fatimah A., 53, 261Harris, Clive, 54Hart, Oliver, 82, 215hazard analysis, 55, 57–64, 59–60f,
61–62t, 64–65t, 67n2health facilities, 1, 276, 277f. See also
social infrastructureHenckel, Timo, 16Hong Kong, China
infrastructure and institution scores, 257f
infrastructure ranking of, 1ftransportation sector in, 274
human capital, 18, 20–22, 21f, 268, 279Hyun, Suk, 137, 138
IIDA . See International Development
AssociationIEA. See International Energy AgencyIJGlobal, 3implementation. See project
implementationincome inequality, 18–19. See also
poverty and poverty reductionIndia
bank project financing in, 83–84, 84tdistribution of PPPs in Asia, 4infrastructure ranking of, 1fPPP market maturity in, 4, 53PPP to total infrastructure
investment ratios in, 40trate of PPP participation in, 17State Bank of India, 85syndicated loan use in, 110, 121

Index 333
tariffs in, 248Indonesiaagencies responsible for PPPs in,
259–60bank project financing in, 83–84, 84tCommittee for the Acceleration of
Priority Infrastructure Delivery, 260
comparison with Republic of Korea and Philippines, 287–322. See also comparative review of PPP systems
currency bond markets in, 263, 264t, 269, 284n2
global competitiveness index rating for, 256–57, 257f, 272t
government support for PPPs in, 306–7, 310–11, 316–17
implementation stage of, 269, 270tIndonesia Infrastructure Guarantee
Fund, 307, 310infrastructure eligible for PPPs, 314infrastructure gap in, 257, 264–67,
265f, 266tinfrastructure scores and ranking for,
1f, 257finstitutions, functioning of, 310legal framework for PPPs in, 261–62,
289–90, 308, 312momentum for PPPs in, 274National Development Planning
Agency for, 260, 265, 266tpolicy recommendations for, 283PPP environment classification in, 287PPP institutional frameworks in,
298–99, 299tPPP investment in, 5, 256, 258, 259t,
264–65, 265fPPP systems of, 312–21PPP to total infrastructure
investment ratios in, 40tprocurement regulations in, 238procurement types in, 290, 314renewable energy projects in, 21risk mitigation in, 273social infrastructure projects in, 276,
279–81, 281fsolicited project proposals in,
294–95, 295f, 309, 319
syndicated loan use in, 110transportation investments and
poverty in, 18–19Umbulan Water Supply Project,
279–81, 281funsolicited project proposals in, 296,
320inflationbank project financing and, 80, 87,
92, 97n8description and data sources for,
98tdeterminants of PPPs and, 143, 149growth, effect on, 22loan syndication and, 128information and communication
technology sectorsaccess and quality, 29, 30–31tcomparative review of, 314–15failed PPP projects in, 49, 49f, 54PPP projects (1985–2015), 17fas pro-poor, 277, 277ftrade flows and, 18
information asymmetryregulatory governance in PPP
performance and, 235syndicated loans and, 111–13, 116, 117,
122, 126, 130InfraInfo database, 227Infrascope (2014), 4, 53, 264, 287infrastructure. See also specific projects
and sectorsaccess and quality, 29–32, 30–32tanalyzing impact of, 22–24demand for, 271, 275economic growth and, 18, 21as economic success determinant,
18–19efficiency improvements in, 235, 247financialization of, 78financing for. See bank project
financing; financing for infrastructure; syndicated loans for project financing
foreign ownership of, 236Global Competitiveness Report
2017–2018 on, 1, 1fPPP investments vs. total
investments in, 40t

Realizing the Potential of PPPs to Advance Asia’s Infrastructure Development334
Public–Private Partnerships for. See Public–Private Partnerships
social. See social infrastructureinfrastructure gap
causes of, 2, 66narrowing, 33, 192private sector and, 236Southeast Asia, 264–68institutional and regulatory
framework for countries. See also specific countries
bank project financing and, 87, 93–94comparative analysis of, 308, 310comparative review of PPP systems,
288–90, 296–99, 297–99t, 312–13dispute resolution and, 206–8, 207t,
208f, 236European Commission on, 212n3foreign investment and, 139infrastructure and stability of, 256,
257finvestment climate, effect on, 173as measure of political stability, 56as obstacle to PPPs, 5, 53PPP investment and GDP growth,
27, 28treadiness for PPPs and, 26, 27f, 287rule of law, defined, 130n5social welfare and, 34in Southeast Asia, 261–62, 282sovereign creditworthiness based
on, 170success factors for PPPs and, 52, 64,
67, 210syndicated loans and, 109, 111, 114,
119, 121, 123, 130, 130n1insurance, 15, 21, 174–76, 179, 273insurance companies as investors, 269Inter-American Development Bank, 2interest rate levels, 80–81, 169, 175International Country Risk Guide of
PRS Group, 56, 67n1, 143, 147International Development Association
(IDA), 177–78international dispute resolution
mechanisms, 237International Energy Agency (IEA), 277International Monetary Fund, 34n1,
143
investment booms, 25, 25finvestment climate, 4, 173, 261, 271investment treaties, 237investors
confidence of, 5, 168, 236, 260descriptive statistics on, 223–30,
224t, 229t, 231n3incentives for, 77–78
Iossa, Elisabetta, 20, 215Irwin, Timothy, 173Ismail, Normaz Wana, 18Ismail, Suhaiza, 53, 261Ivashina, Victoria, 81
JJamali, Dima, 52Jandhyala, Srividya, 54Japan
currency bond markets in, 263, 264tinfrastructure and institution scores,
257fPPP market maturity in, 4, 53transportation sector in, 274
Jett, Alexander, 167Jung, Min-Woong, 287
KKang, Jun-Koo, 117, 125–26Kaplan-Meier survival curves, 56–57,
58–59, 59–60fKappeler, Andreas, 23Kashyap, Anil, 79Kasri, Rahmatina A., 143Kenya, PPP risk mitigation case study
in, 176–78, 177fKhalil, Fahad, 117–18, 125Kim, Jay-Hyung, 19Kim, Jin-Oh, 287Kim, Jungwook, 1, 191Kim, Kang-Soo, 287Kim, Kiwan, 215Kinda, Tidiane, 142Kirti, Divya, 80–81Kleimeier, Stefanie, 118knowledge sharing, 273Kodongo, Odongo, 18Koh, Yoo-Eun, 287Korea. See Republic of KoreaKorea Credit Guarantee Fund, 302

Index 335
Korea Development Institute (KDI)on BTO infrastructure projects, 194description of, 212n1on dispute resolution, 206on PPPs’ effect on economies, 193Public and Private Infrastructure
Investment Management Center of, 9, 210, 222
on value-for-money, 198on welfare benefits of infrastructure,
197Kwon, Eunkyung, 18Kyrgyz Republic
infrastructure ranking of, 1fPPP market maturity in, 4
Lland acquisitions
comparative review, 289, 304, 307, 310–11, 318
delays in, 54risk mitigation and, 172
land value capture, 274Lao People’s Democratic Republic (Lao
PDR)global competitiveness index rating,
257, 257f, 272timplementation stage of, 269, 270tinfrastructure and institution scores,
257finfrastructure ranking of, 1fpolicy recommendations for, 283–84renewable energy projects in, 21
Latin America and Caribbean. See also specific countries
failed PPP projects in, 47impact of PPPs on infrastructure
investment in, 192lead arrangers of syndicated loans,
110–13, 116, 119Lee, Hangyong, 19, 192Lee, Hojun, 215, 231n1Lee, Minsoo, 1, 15, 47, 67n2Lee, San Whi, 111, 113, 115, 117, 122, 126legal assistance, 305legal framework. See institutional and
regulatory framework for countriesletters of credit, 175–78, 176–77f, 183Li, Bing, 55
Li, Jie, 53licensing, 240loan maturity
credit risk and, 81description and data sources for, 99tdescriptive statistics for mature
markets, 100tsyndicated loans and, 116–17, 122, 126,
132loan-sale activities, 115–16, 125, 130n2,
132loan security, 117, 122, 126loan syndication. See syndicated loans
for project financingloan tranches
bank financing and, 83description and data sources for, 99tdescriptive statistics for mature
markets, 100tsyndicated loans and, 97n5, 117–18,
122, 125, 129local governmentsintergovernmental support and, 247,
267social infrastructure and, 276survival rates of PPPs and, 59, 60f
Loeys, Jan, 115long-term debt, 116–17, 150–51long-term savings potential of PPPs, 21Loosemore, Martin, 55
Mmacroeconomic factors
bank project financing and, 87, 88–89, 93
impact of PPPs on, 19–20, 25, 192–93infrastructure and stability of, 256,
257f, 282as obstacle to PPPs, 142PPP investments and, 149private investment in infrastructure
and, 143sovereign creditworthiness based on,
170–71success factors for PPPs and, 54–55survival time estimation and, 58
Mahyideen, Jamilah Mohd, 18Malaysia
bank project financing in, 83, 84t
Realizing the Potential of PPPs to Advance Asia’s Infrastructure Development336
capital market financing in, 199currency bond markets in, 263, 264t,
269, 284n2global competitiveness index rating,
272timplementation stage of, 269, 270tinfrastructure and institution scores,
257finfrastructure gap in, 267–68, 284n1infrastructure ranking of, 1flegal framework for PPPs in, 261obstacles to PPPs in, 53, 261policy recommendations for, 283PPP investment in, 5, 256, 258, 259tPPP regulations in, 242Public–Private Partnership Unit of,
259, 261social infrastructure projects in, 276syndicated loan use in, 110, 121
manufacturing sectors, 84, 84tmarket failures, 119, 139, 233Martimort, David, 20, 215McCaffer, Ronald, 55McDonald, Mott, 199McKibbin,Warwick, 16MDBs. See multilateral development
banksmediation, 206–7, 207t, 208fMegginson, William L., 111, 114, 120, 123Mendoza, Octasiano Miguel, 19Merton, Robert, 118Mester, Loretta, 115MIGA. See Multilateral Investment
Guarantee Agencyminimum payment guarantee, 81, 96,
172, 172f, 210minimum revenue guarantee, 228, 231n4mining, oil and gas sectors
bank project financing for, 84, 84tcomparative review of, 314–15
Mirzaei, Ali, 80Mirzaei, Zeynab, 80Mitsubishi UFJ Financial Group Inc., 85mobile phones, 29, 30–31t, 54Mohammed, Salah, 55monetary policy, 79–80, 129monopolies, 235, 252Moral-Benito, Enrique, 18moral hazard, 112–13, 115, 138–39, 282
Morita, Yuichi, 18Moszoro, Marian, 53Mullineaux, Donald J., 111–17, 122, 126,
132multilateral development banks
(MDBs). See also specific banksbenefits of partial risk guarantees
from, 180–83, 181–82fdescription and data sources for, 99tdescriptive statistics for mature
markets, 100tfinancing for PPPs, mobilizing, 2, 8,
66political risk insurance from, 273risk management for PPPs, 54risk-mitigation tools of, 168, 171,
173–78, 175t, 176–77fsurvival rates of PPPs and, 59, 60f,
63–64Multilateral Investment Guarantee
Agency (MIGA), 177–79Myanmar
global competitiveness index rating, 257, 257f
implementation stage of, 269, 270tpolicy recommendations for, 283–84
Nnatural disasters
El Niño weather phenomenon, 249PPP risk management and, 55survival of PPP projects and, 58, 63
natural monopolies, 235negotiation, dispute resolution and,
206–7, 207tNemoz, Mathieu, 23Nepal
infrastructure ranking of, 1fPPP to total infrastructure
investment ratios in, 40trenewable energy projects in, 21
Ng, Angie, 55Nijkamp, Peter, 53Nishizawa, Toshiro, 138Nocera, Giacomo, 97n2nonparametric analysis, 56–57nonrecourse loans, 118–19, 130n3nonrevertible facilities, 288Nose, Manabu, 57

Index 337
OOECD countries, 3oil and gas sector, 84, 84t, 314–15oil industry. See mining, oil and gas
sectorsOjah, Kalu, 18Orbis Bank Focus, 83Organisation for Economic Co-
operation and Development (OECD), 52, 167, 169–70, 169f, 209
Oshioke, Ahmadu A., 67n2Ouattara, Bazoumana, 142
PPacific region. See Asia and Pacific
regionParigi, Bruno M., 117–18, 125Park, Donghyun, 137Park, Mee-Soo, 287partial risk guarantees, 174–78, 176–78f,
180–83, 181–82fparticipant lenders of syndicated loans,
110Pavel, Christine A., 116, 125, 132payment obligation guarantees, 172–73Pedroni, Peter, 18Pennacchi, George, 115pension funds, 15, 21, 269People’s Republic of China
case study on PPP regulation in, 243–48, 244t
distribution of PPPs in Asia, 4foreign investment in, 243–45infrastructure ranking of, 1finstitutional framework for PPPs in, 26PPP market maturity in, 4, 53PPP to total infrastructure
investment ratios in, 40trate of PPP participation in, 17regulations for PPPs in, 237, 238ttransportation investments and
poverty, 19transportation sector in, 27421st Century Urban Water
Management Pilot Scheme (1997), 243
unsolicited project proposals in, 203tUrban Water Price Regulation
(1998), 243
performance undertakings, 173, 305Pham, Thi Hong Hanh, 80Philippines
agencies responsible for PPPs in, 267bank project financing in, 83, 84tBuild-Operate-Transfer Law (1994),
289, 304case study on PPP regulation in,
248–51comparison with Republic of Korea
and Indonesia, 287–322. See also comparative review of PPP systems
currency bond markets in, 263, 264tenergy company regulations in, 239global competitiveness index rating
for, 256–57, 257f, 272tgovernment support for PPPs in,
304–6, 306f, 310–11, 316–17implementation stage of, 269, 270tinfrastructure eligible for PPPs in,
314infrastructure gap in, 267infrastructure scores and ranking for,
1f, 257finstitutions, functioning of, 310land acquisitions in, 54legal framework for PPPs in, 262,
289, 308, 312–13North Luzon Expressway Project, 54Philippine Development Plan, 292,
293policy recommendations for, 283PPP environment classification in, 287PPP institutional frameworks in,
297–98, 298tPPP investment in, 5, 256, 258, 259tPPP market maturity in, 4, 53PPP systems of, 312–21PPP to total infrastructure
investment ratios in, 40tprocurement types in, 289, 314Project Development and
Monitoring Fund (PDMF), 305–6, 306f
Public–Private Partnership Center of, 9, 52, 258, 259, 260–61, 293, 310
Public–Private Partnership Strategic Support Fund, 306

Realizing the Potential of PPPs to Advance Asia’s Infrastructure Development338
social infrastructure projects in, 275–76, 279
solicited project proposals in, 292–93, 293t, 294f, 309, 319
syndicated loan use in, 110unsolicited project proposals in, 294,
320Phillis, David, 116, 125, 132physical capital, 18Platz, Daniel, 150policy recommendations
for bank project financing, 93–94determinants of PPPs, 150–51for effective PPPs, 33–34for regulatory governance in PPP
performance, 252for risk assessment and management,
66–67for Southeast Asian PPPs, 255,
282–84for syndicated loans, 129–30political instabilityassessment of, 56bank project financing and, 87, 93description and data sources for, 98tinsurance against, 174–76, 179as obstacle to PPPs, 5, 142risk perception of investors, 168–69,
168tPongsiri, Nutavoot, 52poverty and poverty reduction
channels for, 24infrastructure for, 18, 21, 276–81,
277f, 281fPPP effectiveness and, 3, 20–21, 21fspending requirements for, 6subsidies for, 279tariff subsidies for, 248
Private Participation in Infrastructure Database of World Bankbank project financing and, 87, 98–99ton canceled PPP projects, 48countries included in, 11n1as data source, 143descriptive statistics used in, 68on determinants of PPPs, 142–43impact of PPPs on economic growth,
192impact of PPPs on macroeconomy, 19
increase in infrastructure project participation, 16, 16–17f
investment data from, 23macroeconomic stability and
sovereign creditworthiness, 170reliability of data from, 23risk assessment and management,
55, 64trends in PPPs, 4
private sector. See also banking and financial sectors; Public–Private Partnershipscapital, cost of, 139formation requirements for effective
PPPs, 51government efforts to attract
financing from, 138, 148, 243–45, 274
increase in infrastructure project participation, 16, 16f, 140, 192
infrastructure financing from, 2, 15, 33, 59, 150. See also bank project financing; syndicated loans for project financing
macroeconomic conditions and, 149PPP effectiveness and, 20–21, 21fpro-poor project participation, 277regulatory governance in PPP
performance and, 236Republic of Korea, infrastructure
investment in, 195, 196trisk mitigation through, 260risk perceptions of, 168–71, 168t, 169f,
171tprivatization, 258procurement procedures
as bottlenecks to competition, 54comparative review of, 309, 314Indonesia, 290Philippines, 289regulations for, 236Republic of Korea, 288–89traditional, 15, 216, 219–22. See also
Public–Private Partnerships vs. traditional procurement
profit motive, 235project bonds, 7–8, 151, 151n6project development funds
Indonesia, 307, 310, 316

Index 339
Philippines, 305–6, 306f, 316project implementation. See also
solicited projects; unsolicited projects
comparative review of PPP systems, 290–96, 293t, 294–95f
risk assessment for, 53–55stages of, 269, 270tWorld Economic Forum on, 256
project life-cycle costs, 19–20project lists, 321project pipelines, 255, 274, 283project valuation, 274Pro-Poor Public–Private Partnership of
UNESCAP, 21PRS Group Inc., 56, 67n1, 143, 147public interest, 235–36, 246, 276–78,
277f, 308public offerings, 140Public–Private Partnership government
unitsdefined, 52importance of, 209–10as obstacles to PPPs, 5, 260project hazard rates and, 63regulatory functions and, 242Southeast Asia, 259, 260–61support role of, 8–9, 51–52
Public–Private Partnerships (PPPs), 1–12Asian landscape for, 4benefits of, 18, 19–20, 24, 199budgeting and accounting rules for,
201–2, 202bcomparative review of, 287–322. See
also comparative review of PPP systems
defined, 2, 234determinants of, 137–65. See also
determinants of PPPsempirical evidence and channels
for effectiveness, 15–45. See also empirical evidence and channels for effectiveness
failed. See failed PPP projectsfinancing mobilization, 6–8government units for. See Public–
Private Partnership government units
impetus for participation in, 3
for infrastructure development, 2–5lessons for, 8–9obstacles to, 5, 52, 53, 142, 260, 261,
274opposition to, 308prerequisites for, 9regulatory governance of, 233–53. See
also regulatory governance in PPP performance
risk management for, 47–74. See also risk assessment and management
risk mitigation for, 167–87. See also risk mitigation and sovereign guarantees
success factors for, 3, 52, 54–55, 64, 67, 179, 210, 260, 280, 283
trends in, 4Public–Private Partnerships vs.
traditional procurement, 10, 215–32capital costs and, 82, 199empirical analysis of PPP projects,
222–29, 223f, 224t, 229t, 231n3frequency of use, 33policy implications and, 229–30PPP benefits and, 15, 20, 192PPP issues and, 34PPP structure overview, 216–17, 216fregulatory governance in PPP
performance and, 236, 237frisk mitigation and, 3, 192theoretical model of procurement
contracts, 217–22time efficiency issues and, 199
public sector. See also local governments; Public–Private Partnerships; Public–Private Partnerships vs. traditional procurementallocating risk to, 172–73, 172f, 192,
210, 299bonds from, 137, 148, 150–51budgeting systems, 201–2debt, bank project management and,
87, 88, 92, 98tdebt repayment capacity, 201financing for infrastructure from, 6,
33, 256formation requirements for effective
PPPs, 51

Realizing the Potential of PPPs to Advance Asia’s Infrastructure Development340
monitoring PPPs, 8PPP government units. See Public–
Private Partnership government units
project hazard rates and, 59, 60f, 62–63, 66
regulatory governance in PPP performance and, 236
regulatory tools from, 239–40risk mitigation from, 138, 167–87. See
also risk mitigation and sovereign guarantees
risk perception of investors, 168–69, 168t
QQuising, Pilipinas F., 47
RRajan, Raghuram, 115Rao, Vivek, 77, 109regional cooperation, 54regulatory governance in PPP
performance, 10, 233–54. See also institutional and regulatory framework for countriesagencies for, 237–39, 238tcase studies on, 243–51, 244tdesigning systems for, 240–42, 241ffunctions of, 235–37, 237finstruments for, 239–40misunderstanding of, 233objectives of, 235pitfalls in, 242policy recommendations for, 252role in improvement of PPPs, 234
regulatory instruments, 239–40regulatory quality, 87, 99t, 130n7renewable energy projects, 21, 277repo rate, 123, 128, 129Republic of Korea, 10, 191–232
bank project financing in, 83, 84tcapital market financing in, 199–201,
200–201t, 202bcomparison with Philippines and
Indonesia, 287–322. See also comparative review of PPP systems
economic growth, PPP investment and, 19, 192–99, 193f, 194–99t
empirical analysis of PPP projects in, 222–29, 223f, 224t, 229t
governance issues affecting PPP process in, 204–8, 205f, 206t, 208f
government support for PPPs in, 300–301f, 300–304, 303–4t, 310–11, 316
Hwado–Yangpyeong Expressway Project, 205
Incheon International Airport Railway Project (2007), 205
increase of PPPs in, 192, 215infrastructure eligible for PPPs in,
314–16infrastructure ranking of, 1finstitutions, functioning of, 310legal framework for PPPs in, 209–10,
212n3, 288, 308, 312policy implications for, 229–30PPP environment classification in,
287PPP institutional frameworks in, 297,
297tPPP market maturity in, 53PPP structure in, 216–17, 216f, 223fPPP systems in, 312–21PPP to total infrastructure
investment ratios in, 40tprocurement types, 288–89, 314,
321n1Public and Private Infrastructure
Investment Management Center of, 9, 210, 222, 288, 291, 297, 297t, 310
Public–Private Partnership Review Committee, 222, 291–92
Public–Private Partnerships in Infrastructure Act (1994), 191, 209–10, 288–89, 290, 297, 302, 304
solicited project proposals in, 290–91, 309, 319
syndicated loan use in, 110theoretical model of procurement
contracts in, 217–22unsolicited project proposals in,
202–4, 203–4t, 290–91, 319requests for proposals (RFPs), 230, 291resettlement costs, 54, 172, 306Reside, Renato, 63

Index 341
return on average assets, 83, 87, 99t, 100trevertible facilities, 288, 302Reyes-Tagle, Gerardo, 52Rhee, Chang-Yong, 19, 192Riedl, Dominik F., 54rights-of-way, 54, 306, 310risk assessment and management, 9,
47–73bank project financing and, 81–82,
97n3benefits of PPPs for, 3, 20categorization of risks, 55construction vs. financial investors
and, 225–26in contracts, 236currency risk and, 149data and analytical framework, 55–58empirical results, 58–64, 59–60f,
61–62t, 64–65tfactors affecting outcomes of PPP
projects, 50–55, 51ffailed projects and, 48–50, 48–50fin financing for infrastructure, 6–7,
138formation requirements for PPPs,
51–52investor incentives and, 77–78loan security and, 117MDB participation and, 8policy implications, 66–67political vulnerability and, 5private sector and, 260for project implementation, 53–55public sector role in, 138, 299regulatory governance in PPP
performance for, 233, 235regulatory system design and, 240,
241f, 251Southeast Asia, 269, 273syndicate loans and, 111, 119
risk evaluations, 139risk mitigation and sovereign
guarantees, 10, 167–87case studies on, 176–79, 177fcosts of, 180government support to reduce risk,
172–73, 172fMDB partial risk guarantees, benefits
of, 180–83, 181–82f
MDBs and, 173–76, 175t, 176fpolicy implications, 183regression framework, 185risk perceptions of investors, 168–71,
168t, 169f, 171t, 184n2risk premiums, 48, 139risk sharing
benefits of, 3comparative review of, 310–11new PPP schemes for, 230, 282to prevent moral hazard, 138project finance and, 6–7regulation of, 236Republic of Korea, 191, 300–302,
300–301frevenue guarantees and, 210
Rockart, John F., 51Romp, Ward, 23Rosenstock, Michael, 52Ruhashyankiko, Jean-Francois, 20, 63,
88, 92, 170rule of law, 130n5. See also institutional
and regulatory framework for countries
rules as regulatory tools, 239–40rural areas
access to and quality of infrastructure, 29, 30–31t
renewable energy projects in, 21
SSalzmann, Astrid Juliane, 55Samii, Ramina, 52sanitation. See water and sanitation
sectorsScharfstein, David S., 81Scharle, Peter, 53Schomaker, Rahel, 20Schwartz, Jordan, 170, 185securitization, 148Seethepalli, Kalpana, 18Servén, Luis, 18, 19service fees. See user feesservices sectors, 142–43, 314–15Setboonsarng, Sununtar, 18sewage. See water and sanitation sectorsshadow bid financial models, 168, 180,
184n1Sharma, Chandan, 142

Realizing the Potential of PPPs to Advance Asia’s Infrastructure Development342
Shibata, Akihisa, 18Shivdasani, Anil, 117, 125–26short-term loans, 117, 126Simons, Katerina, 111, 115, 125Singapore
currency bond markets in, 263, 264tglobal competitiveness index rating,
256, 257f, 272timplementation stage of, 269, 270tinfrastructure and institution scores,
257finfrastructure development in, 256infrastructure ranking of, 1fPPP to total infrastructure
investment ratios in, 40tpublic funds and institutions, 256transportation sector in, 274social infrastructurecase study on, 179comparative review of, 314–16for poverty reduction, 3procurement procedures for, 217Southeast Asia, 258, 275–76, 277f,
281fwelfare effect of PPPs and, 197social regulations, 235social security, 20–21, 21fsolicited projectsIndonesia, 294–95, 295f, 309, 319Philippines, 292–93, 293t, 294f, 309,
319project hazard rates of, 59, 62Republic of Korea, 288, 290–91, 309,
319unsolicited projects vs., 203
Solvency II, 94Soomro, Mohsin, 53, 54South Asia. See also specific countries
distribution of PPPs in Asia, 4rate of PPP participation in, 17, 17f
Southeast Asia, 10–11, 255–85. See also specific countries
approaches to PPPs in, 269–75, 270t, 272t
ASEAN Connectivity 2025, support for, 275
case study on water sector in, 279–81challenges for PPPs in, 255distribution of PPPs in Asia, 4
infrastructure development in, 256–58, 257f, 259t
infrastructure gap in, 264–68infrastructure industry in, 262–64,
263f, 264tinstitutional and legal framework in,
261–62institutionalizing PPPs in, 259–61momentum for PPPs in, 274policy recommendations for, 282–84PPP spending as percentage of GDP,
258, 259tpro-poor PPPs in, 276–79, 277frate of PPP participation in, 17, 17frisk management and support in, 273social infrastructure PPPs in, 275–76,
277f, 281fsuccess of PPP projects in, 260
sovereign counter indemnity, 180–82sovereign default risks, 88, 92sovereign guarantees. See risk
mitigation and sovereign guaranteessovereign partial risk guarantees,
174–83, 176–78f, 181–82fsovereign risks, 5, 8, 167–71, 171tsovereign wealth funds, 15, 21special purpose vehicles (SPVs), 138–39,
216–17, 222stakeholders
dispute resolution and. See dispute resolution
diversity of, 272–73engagement strategies for, 51, 308incentives for, 77opportunistic behavior of, 235–36project risk and, 53, 95, 130, 230project success and, 308pro-poor projects and, 278
Standard & Poor's (S&P), 122, 126, 167, 169f, 170–71, 173, 185
Standard Chartered Bank PLC, 85Steffanoni, Alessandro, 81, 87Stein, Jeremy C., 79, 81strategic default, 111, 114Straub, Stéphane, 18subnational governments. See local
governmentssubsidies
construction, 300, 310

Index 343
direct government, 305, 306–7for poverty and poverty reduction,
248, 279subsovereign borrowers, 168–69, 168tSufi, Amir, 110, 111, 113Sumitomo Mitsui Financial Group Inc., 85survival time estimation, 57–59, 59–60f, 66syndicated loans for project financing,
10, 109–35data description, 120description and data sources for, 99tdescription of, 109–10, 130n2descriptive statistics for mature
markets, 100tempirical estimates, 123–29, 124t,
127–28t, 131–32empirical model for, 120factors affecting, 112–18literature review on, 111–19methodology and data for, 120–23motivations for use, 118–19policy implications for, 129–30statistics of key variables, 120–23,
121t, 130nn4–8
TTah, Joseph, 55Taipei,China
infrastructure ranking of, 1fPPP readiness in, 26tariffsto attract private investment, 234–35challenges in setting up, 211People’s Republic of China, 243regulatory function of, 235–36, 239,
240water and sanitation sectors and,
243, 245–51, 280tax administration
debt burden and, 201determinants of PPPs and, 143exemption for PPP projects, 302,
303–4tto finance infrastructure, 6incentives for PPP projects, 307
tax increment financing, 148, 151n5, 274telecommunications sector. See
information and communication technology sectors
telephones, 29, 30–31t, 54Terada-Hagiwara, Akiko, 18termination of contracts, 47, 66, 251, 302Tewodaj, Mengistu, 142Thailand
bank project financing in, 83, 84tcapital market financing in, 199corruption in, 261currency bond markets in, 263, 264tglobal competitiveness index rating,
272timplementation stage of, 269, 270tinfrastructure and institution scores,
257finfrastructure gap in, 268infrastructure ranking of, 1fKasikornbank PCL, 85legal framework for PPPs in, 262momentum for PPPs in, 274policy recommendations for, 283PPP investment in, 5, 256, 258, 259tPPP to total infrastructure
investment ratios in, 40tPublic–Private Partnership Unit of,
259, 262social infrastructure projects in, 276
Thakor, Anjan V., 110, 117Thomson One Banker, 83–84Thorpe, Antony, 55Tian, Shu, 137Timbang, Michael, 109time efficiency, 199time inconsistency, 234–35Tiong, Robert L. K., 52trade
determinants of PPPs and, 142economic growth and, 22survival of PPP projects and, 63transportation and communication
sectors and, 18traditional procurement, 15, 216, 219–22.
See also Public–Private Partnerships vs. traditional procurement
transferability risk guarantees, 172transparency and accountability
economic cost-benefit analysis for, 278effectiveness of PPPs and, 51–52government encouragement of, 173legal and regulatory frameworks, 288

Realizing the Potential of PPPs to Advance Asia’s Infrastructure Development344
PPP procurement methods and, 205in production costs, 246project hazard rates and, 64surveys on, 261syndicated loans and, 111, 116, 130n6
transportation sectorsaccess to and quality of
infrastructure for, 30–31tASEAN Connectivity 2010 projects,
275bank project financing for, 84, 84tcomparative review of, 314–15congestion issues, 1empirical analysis of investor
composition, 227–28failed PPP projects in, 49, 49f, 53,
54–55land value capture and, 274North Luzon Expressway Project,
Philippines, 54poverty reduction and, 18–19PPP projects (1985–2015), 17fSoutheast Asian projects for, 258,
267–68, 284n1tariffs on infrastructure for, 211trade flows and, 18welfare benefits of infrastructure in,
197Trebilcock, Michael, 52Trujillo, Lourdes, 19Turkey, PPP risk mitigation case study
in, 179, 183
UUdell, Gregory F., 115, 117Um, Paul Noumba, 142, 143underwriting, 140United Kingdom
foreign investments of, 248PPP market maturity in, 94time and cost overruns, 199water company regulations in, 239
United Nations Economic and Social Commission for Asia and the Pacific (UNESCAP), 21
unsecured loans, 117unsolicited projects
Indonesia, 296, 320Malaysia, 261
Philippines, 294, 320project hazard rates of, 59, 60f, 62Republic of Korea, 202–4, 203–4t,
288, 290–91, 319risk factors for, 53
urbanization, 29, 243user fees
BOO infrastructure projects, 288BTO infrastructure projects, 217, 220construction subsidies and, 300, 310Indonesia, 280Malaysia, 261opposition to PPPs because of, 308in pro-poor PPPs, 279Republic of Korea, 300–301
VVälilä, Timo, 82value-for-money
analysis of unsolicited proposals for, 292
computing, 212n2PPPs to enhance, 198, 198–99tregulatory governance in PPP
performance and, 235tests for, 203, 205unsolicited project proposals, 203
van der Burch, Marc, 53Vecchi, Veronica, 96, 130Veredas, David, 18Versteeg, Roald, 118viability gap funding, 172, 304, 307, 310Vidigni, Gabriella, 53Viet Nam
bank project financing in, 83–84, 84tcurrency bond markets in, 263, 264tglobal competitiveness index rating,
272timplementation stage of, 269, 270tinfrastructure and institution scores,
257finfrastructure ranking of, 1fpolicy recommendations for, 283–84PPP investment in, 5, 256, 258, 259tPPP to total infrastructure
investment ratios in, 40tPublic–Private Partnership Office of,
259syndicated loan use in, 121

Index 345
Villaruel, Mai Lin, 47Visconti, Roberto, 80
WWallich, Christine, 21Warner, Andrew, 25Wassenhove, Luk van, 52water and sanitation sectors
access to and quality of infrastructure for, 30–32t
case studies on, 243–51, 244t, 279–81, 281f
comparative review of, 314–15failed PPP projects in, 49f, 54lack of access to, 1, 33poor quality of, 1PPP projects (1985–2015), 17fas pro-poor, 277, 277f
WEF. See World Economic ForumWei, Shang-Jin, 18welfare services. See social
infrastructurewhite elephant projects, 20Wi, Suhyeon, 191Wibowo, Farid A., 143Widodo, Joko, 260, 265Winton, Andrew, 115World Bank. See also Private
Participation in Infrastructure Database of World Bankassessment of PPP performance
in Asia, 34assessment of PPP process, 5on bank regulations, 130n7
credit-enhancement tools of, 174, 175t
on greenfield projects, 63political risk insurance from, 273Public–Private Partnerships, defined,
2on rule of law, 130n5on success factors for PPPs, 52World Development Indicators
Database, 143World Wide Governance Indicators,
87, 121–22, 130n5World Bank Group, 177World Development Indicators
Database of World Bank, 143World Economic Forum (WEF),
77–78, 150, 151n1, 256. See also Global Competitiveness Report 2017–2018
World Trade Organization, 237Wu, Xun, 233
YYamada, Takeshi, 117, 125–26Yehoue, Etienne B., 20, 63, 88, 92, 170Yoshino, Naoyuki, 138
ZZen, Fauziah, 255Zerfu, Daniel, 142Zhang, Xueqing, 52, 53, 54Zhu, Haibin, 79Zou, Patrick, 53Zouggari, Mounir, 52
REALIZING THE POTENTIAL OF PUBLIC–PRIVATE PARTNERSHIPS TO ADVANCE ASIA’S INFRASTRUCTURE DEVELOPMENTJANUARY 2019
REALIZIN
G TH
E POTEN
TIAL O
F PUBLIC–PRIVATE PA
RTNERSH
IPS TO A
DVA
NCE A
SIA’S INFRA
STRUCTU
RE DEVELO
PMEN
T
Realizing the Potential of Public–Private Partnerships to Advance Asia’s Infrastructure Development
This publication highlights how public–private partnerships (PPPs) can be effective to meet Asia’s growing infrastructure needs. It shows how governments and their development partners can use PPPs to promote more inclusive and sustainable growth. The study finds that successful PPP projects are predicated on well-designed contracts, a stable economy, good governance and sound regulations, and a high level of institutional capacity to handle PPPs. It is the result of a collaboration between the Asian Development Bank, the Korea Development Institute, and other experts that supported the theme chapter “Sustaining Development through Public–Private Partnership” of the Asian Development Outlook 2017 Update.
About the Korea Development Institute KDI, established in 1971, is an independent policy-oriented research organization and a leading think-tank of the Republic of Korea. It has contributed to policy making and institutional reform by conducting research in many areas, including macroeconomics, finance, fiscal policy, social security, labor, industry, trade, economic law, and the economy. It has developed into a comprehensive policy institute of international recognition by taking up diverse roles and functions. The Public and Private Infrastructure Investment Management Center, the affiliated body of KDI, started its operations in 1999, serving as a gatekeeping agency of the Government of the Republic of Korea, then to procuring economic and social infrastructure, and enhancing efficiency and transparency of public and private infrastructure investments.
About the Asian Development Bank
ADB is committed to achieving a prosperous, inclusive, resilient, and sustainable Asia and the Pacific, while sustaining its efforts to eradicate extreme poverty. Established in 1966, it is owned by 67 members—48 from the region. Its main instruments for helping its developing member countries are policy dialogue, loans, equity investments, guarantees, grants, and technical assistance.
ASIAN DEVELOPMENT BANK6 ADB Avenue, Mandaluyong City1550 Metro Manila, Philippineswww.adb.org
KOREA DEVELOPMENT INSTITUTE263(Bangok-dong, Korea Development Institute)Namsejong-ro, Sejong-si 30149, Republic of Korea www.kdi.re.kr