Embed Size (px)
Citation preview

REA analysisand
E-R diagramming
December 2, 2008

What are we hoping to achieve?
• Tool for designing a database system to meet the needs of the organization
• REA modeling is a method of analyzing and thinking about the system
• E-R diagramming is a means of diagramming what the database should look like based upon the analysis above.
What are we hoping to achieve?
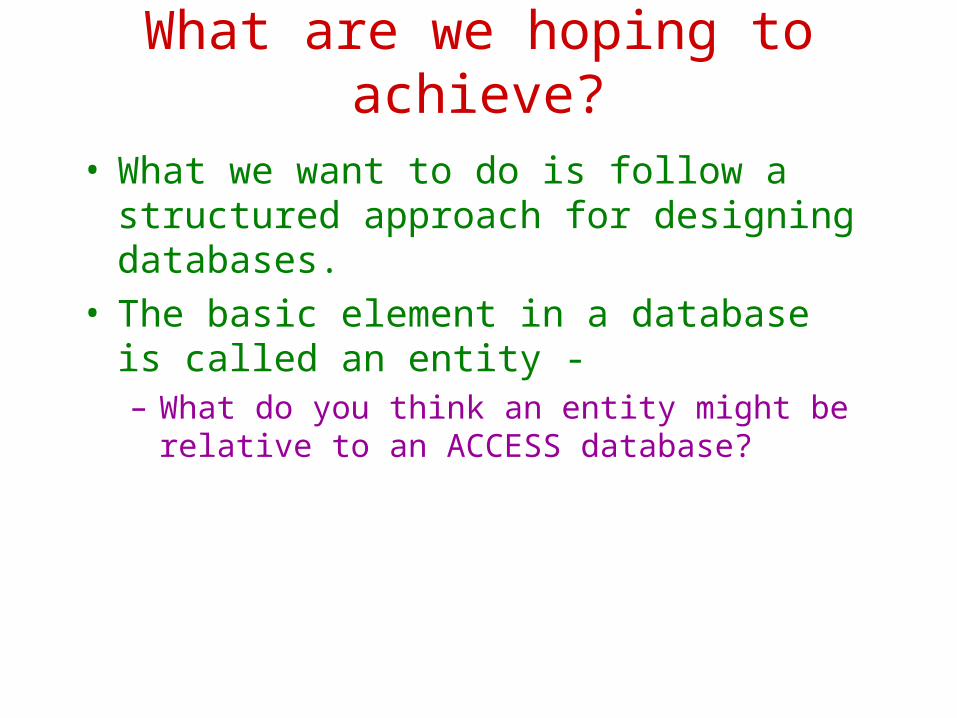
• What we want to do is follow a structured approach for designing databases.
• The basic element in a database is called an entity -– What do you think an entity might be relative to an ACCESS database?

Some of the usual suspects…
• Entities (people)• Events• Resources• Locations

Resource-Event-Agent modeling
• REA modeling is a hot topic in systems circles
• It has gone through several name/content variations
• Some books combine REA and E-R diagramming and some make no distinction– IT CAN GET CONFUSING

Resource-Event-Agent(-Location) analysis and
modeling• We focus on events, which are things that get recorded in our system
• For each event we will possibly have– The event itself– Resources consumed or obtained– Internal agents (entities)– External agents (entities)– Perhaps a location
• The reason that the word entities is in parentheses is that with this type of modeling, all five of these things are referred to as “entities”.
• This sounds a lot like narratives, DFDs and flowcharts, huh?

REA analysis
• Think back to the purchase order in the SUA that we looked at a few days ago…
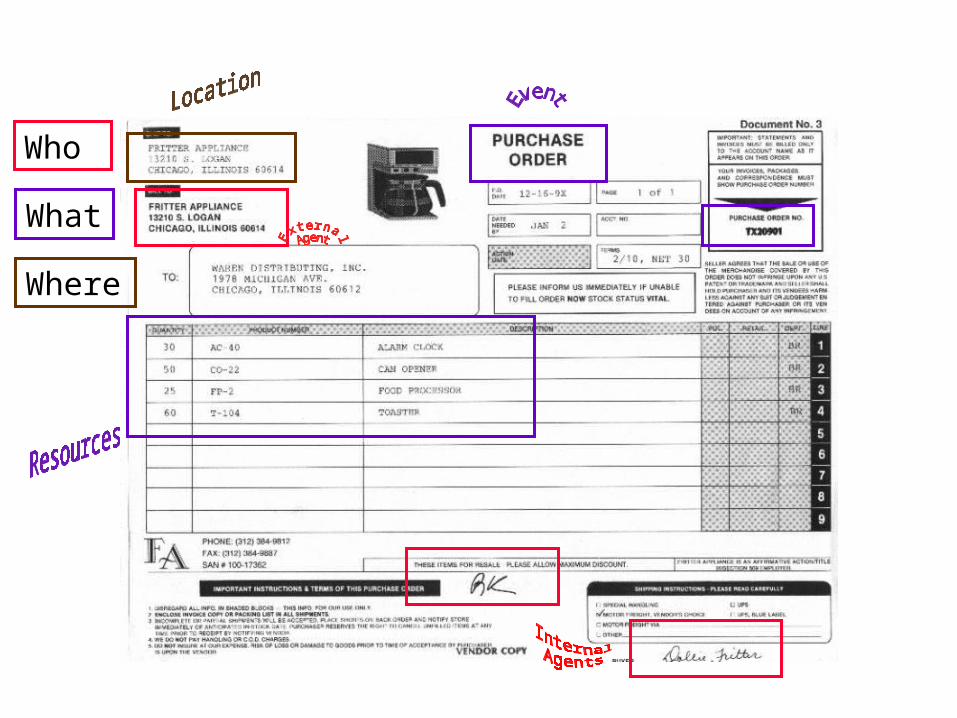
Where
Who
What

Entity-Relationship diagramming
• It uses three symbols– A rectangle
• An entity (but not the same as in DFDs and flowcharts
– A diamond• A relationship
– An oval• An attribute
• A specific form of E-R model is called REA (Resource-Event-Agent) modeling

Resource-Event-Agent modelingbasic template
Event
ResourceInternalagent
Location(if needed)
ExternalAgent
(if needed)
Event
ResourceInternalagent
Location(if needed)
ExternalAgent
(if needed)
These are allconsideredentities

Entity-Resource-Agent modeling
Example
SellMerchandise
MerchandiseSalesperson
Customer
ReceiveCustomerpayment
Cash
CashRegister
decreases
increases
Takes place at
Takes place at
Collects payment
Sold by
Sold to
Receiv
ed fro
m
Resultsin
Now we add relations

Entity-Resource-Agent modelingwith diamonds
SellMerchandise
MerchandiseSalesperson
CashRegister
Customer
ReceiveCustomerpayment
Cash
decreases
increases
Takes place
at
Collects payment
Sold by
Sold to
Receiv
ed fro
mTakes place at
Result
s in

Entity-Resource-Agent modeling
Entity
Relationship -Describes how two entities relate
Attribute -Provides specifics for an entity (the column information)
-Resource - such as merchandise or cash-Person (what we referred to as entities in DFDs)-Event

Entity-Relationship diagrams
• There is a distinction between REA modeling and E-R diagramming!– This distinction is not really important, though.
• E-R diagrams can be used to graphically show the REA model
• This type of modeling is useful for designing databases
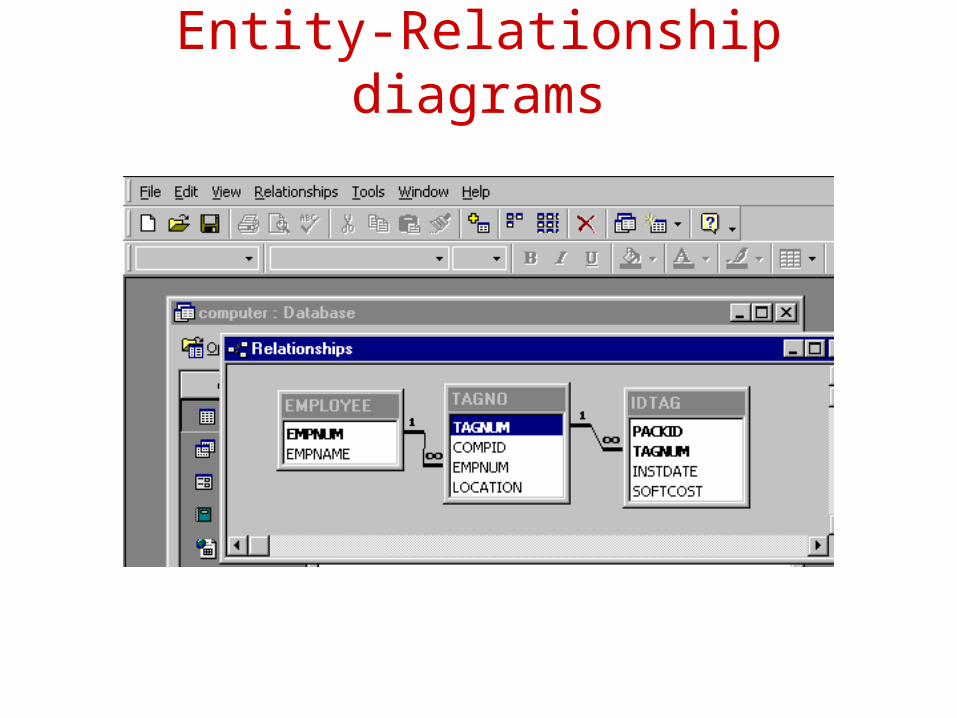
• Notice that the database/relationships design for the Ch03.mdb database looks very much like the ER diagram
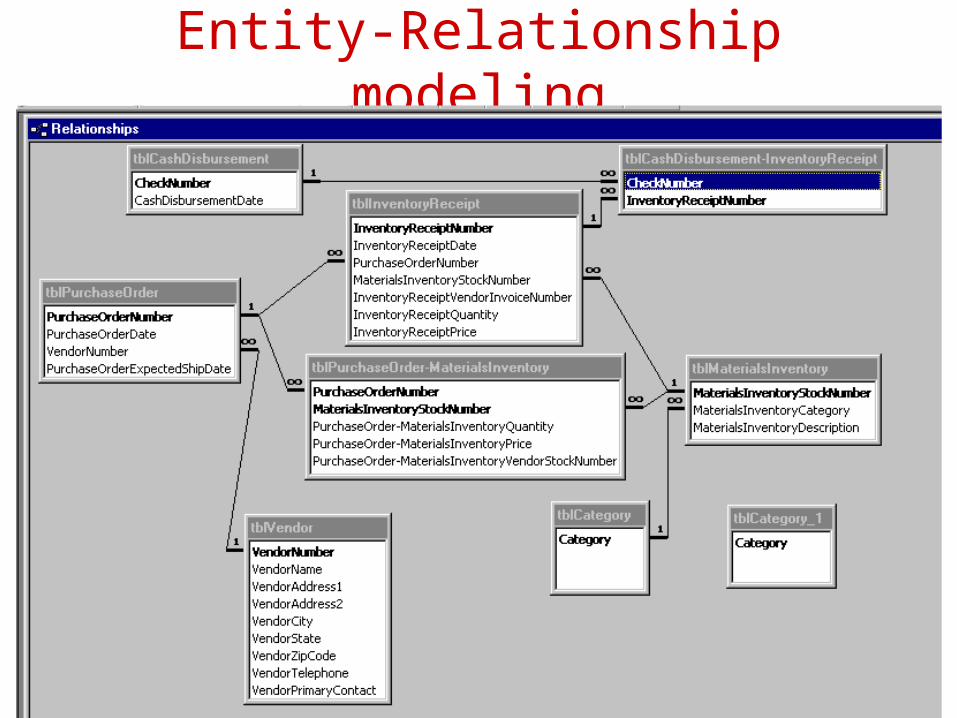
Entity-Relationship modeling

Entity-Relationship modeling
tblCashDisbursementCheck No.
tblPurchaseOrderPO No.
tblCashDisbursementInventoryReceipt
Inv Rec No. + Chk No
tblInventoryReceiptInv Rec No
tblMaterialsInventoryInv. Stck No
tblVendorVendor No.
tblPOInventoryReceipt
PO No. + Inv Stck No.
CheckNo.
InvReceiptNo.
VendorNo.
PONo.
PONo.
InvStockNo.
Date
Inventory data
Vendor data
Entity-Relationship modeling
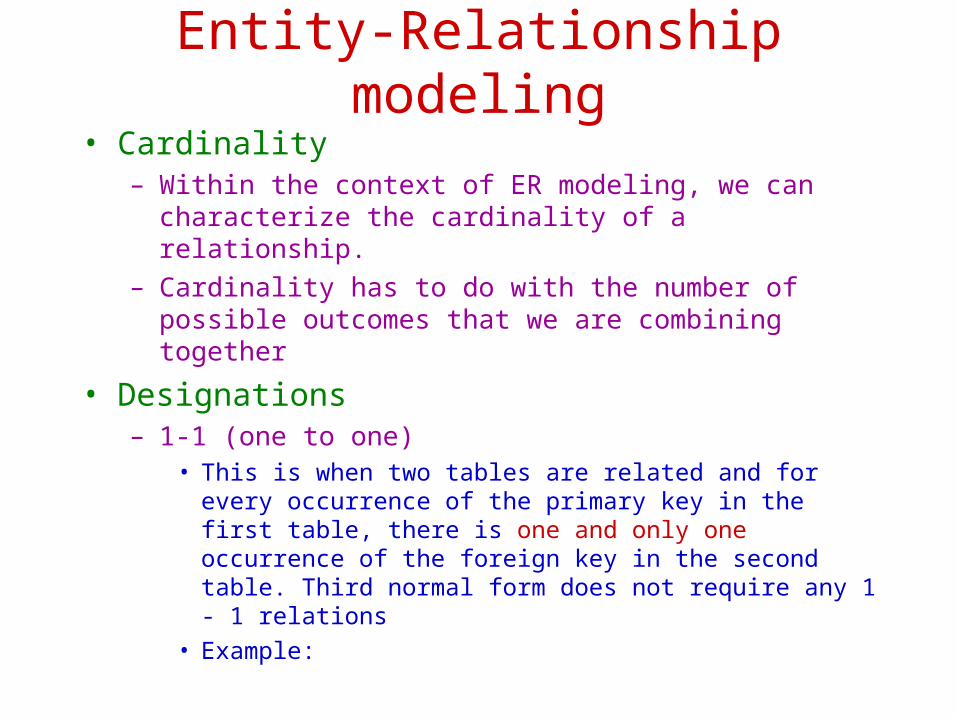
• Cardinality– Within the context of ER modeling, we can characterize the cardinality of a relationship.
– Cardinality has to do with the number of possible outcomes that we are combining together
• Designations– 1-1 (one to one)
• This is when two tables are related and for every occurrence of the primary key in the first table, there is one and only one occurrence of the foreign key in the second table. Third normal form does not require any 1 - 1 relations
• Example:
Let’s rewrite this ONE table as two separate tables (like we did last class)
Entity-Relationship modeling
REGISTRATIONSSN LAST_NAME FIRST_NAME PHONE_NO LIC_PLATE_ST LIC_PLATE_NO123-34-5678 Curry Dorothy (916)358-4448 CA 123 MCD134-56-7783 Fong May (916)563-7865 CA 253 DAL
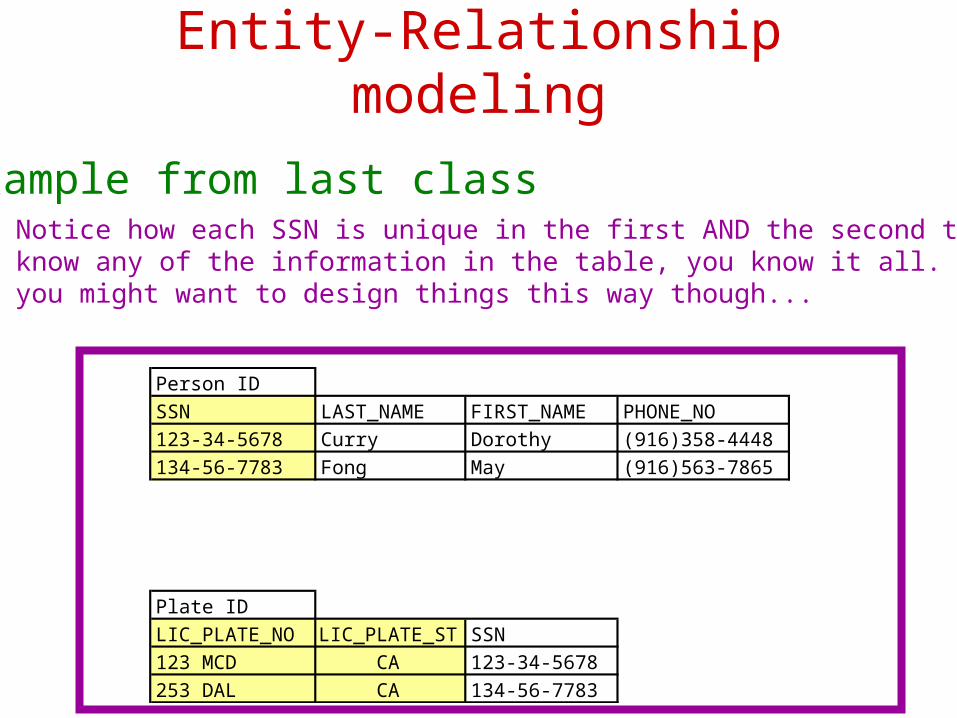
Example from last classNotice how each SSN is unique in the first AND the second table. If youknow any of the information in the table, you know it all. There are reasonsyou might want to design things this way though...
Person IDSSN LAST_NAME FIRST_NAME PHONE_NO123-34-5678 Curry Dorothy (916)358-4448134-56-7783 Fong May (916)563-7865
Plate IDLIC_PLATE_NO LIC_PLATE_ST SSN123 MCD CA 123-34-5678253 DAL CA 134-56-7783

Entity-Relationship modeling
• Designations– 1-1 (one to one)
Person ID Plate IDSSN

Entity-Relationship modeling
• Designations– 1-M (one to many)
• This is the most common relationship• The primary key of the first table is unique in the second table
• Consider a customer table and an invoice table
– Each customer may have MANY invoices– Each invoice relates to ONLY ONE customer
tblCustomerCustNo.
tblInvoiceInvoiceNo.
CustNo.
(1,M)
Entity-Relationship modeling
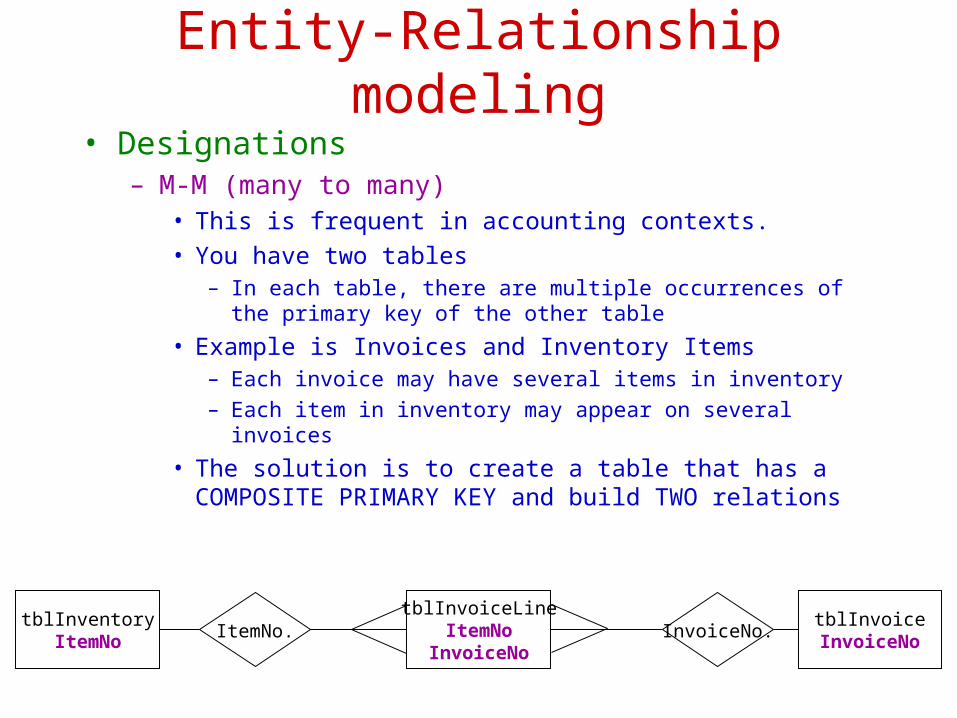
• Designations– M-M (many to many)
• This is frequent in accounting contexts.• You have two tables
– In each table, there are multiple occurrences of the primary key of the other table
• Example is Invoices and Inventory Items– Each invoice may have several items in inventory– Each item in inventory may appear on several invoices
• The solution is to create a table that has a COMPOSITE PRIMARY KEY and build TWO relations
tblInventoryItemNo
tblInvoiceInvoiceNoItemNo. InvoiceNo.
tblInvoiceLineItemNo
InvoiceNo
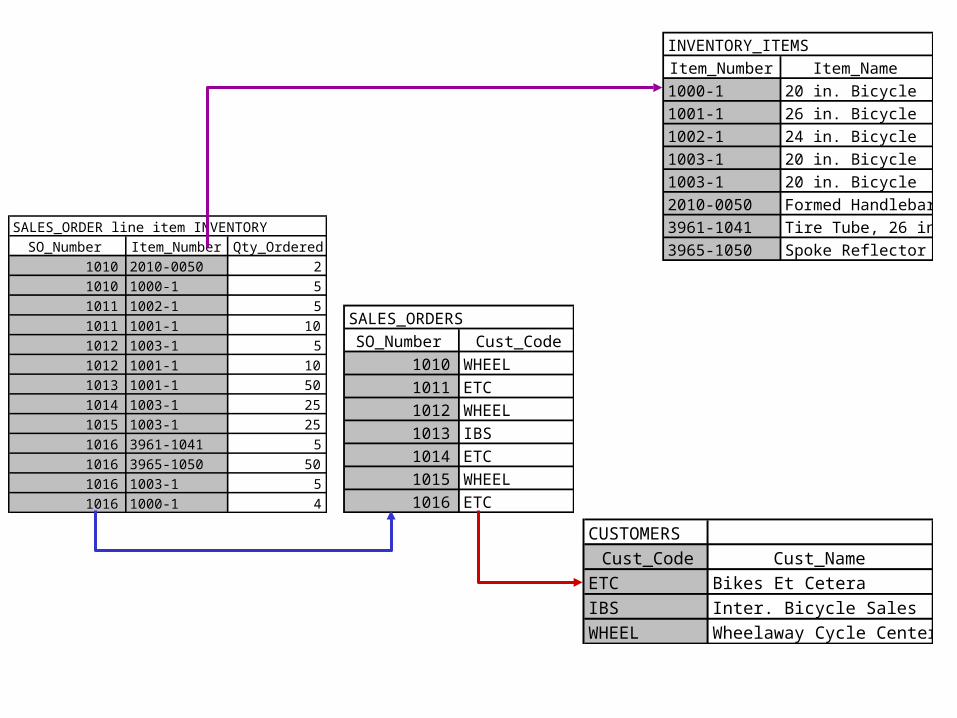
SALES_ORDER line item INVENTORYSO_Number Item_Number Qty_Ordered
1010 2010-0050 21010 1000-1 51011 1002-1 51011 1001-1 101012 1003-1 51012 1001-1 101013 1001-1 501014 1003-1 251015 1003-1 251016 3961-1041 51016 3965-1050 501016 1003-1 51016 1000-1 4
SALES_ORDERSSO_Number Cust_Code
1010 WHEEL1011 ETC1012 WHEEL1013 IBS1014 ETC1015 WHEEL1016 ETC
INVENTORY_ITEMSItem_Number Item_Name1000-1 20 in. Bicycle1001-1 26 in. Bicycle1002-1 24 in. Bicycle1003-1 20 in. Bicycle1003-1 20 in. Bicycle2010-0050 Formed Handlebar3961-1041 Tire Tube, 26 in.3965-1050 Spoke Reflector
CUSTOMERSCust_Code Cust_Name
ETC Bikes Et CeteraIBS Inter. Bicycle SalesWHEEL Wheelaway Cycle Center
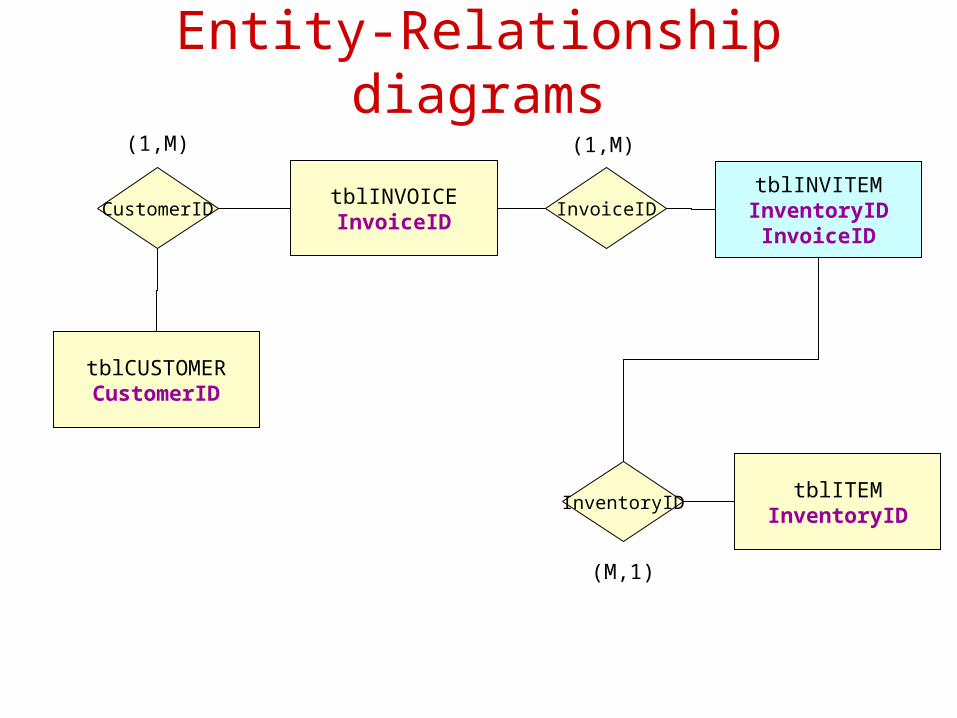
Entity-Relationship diagrams
tblCUSTOMERCustomerID
CustomerIDtblINVOICEInvoiceID
tblINVITEMInventoryIDInvoiceID
tblITEMInventoryID
InvoiceID
InventoryID
(1,M) (1,M)
(M,1)
tblINVITEMInventoryIDInvoiceID

Entity-Relationship diagrams

PACKID TAGNUM INSTDATE SOFTCOSTAC01 32808 9/13/95 754.95 DB32 32808 12/13/95 380.00 DB32 37691 6/15/95 380.00 DB33 57772 5/27/95 412.77 WP08 37691 6/15/95 227.50 WP08 57772 5/27/95 170.24 WP09 59836 10/30/95 35.00 WP09 77740 5/27/95 35.00
ID_TAGTAGNOTAGNUM COMPID EMPNUM LOCATION
32808 M579 611 Accounting37691 B121 124 Sales57772 C007 567 Info Systems59836 B221 124 Home77740 M579 567 Home
EMPLOYEEEMPNUM EMPNAME
124 Alvarez, Ramon567 Feinstein, Betty611 Dinh, Melissa
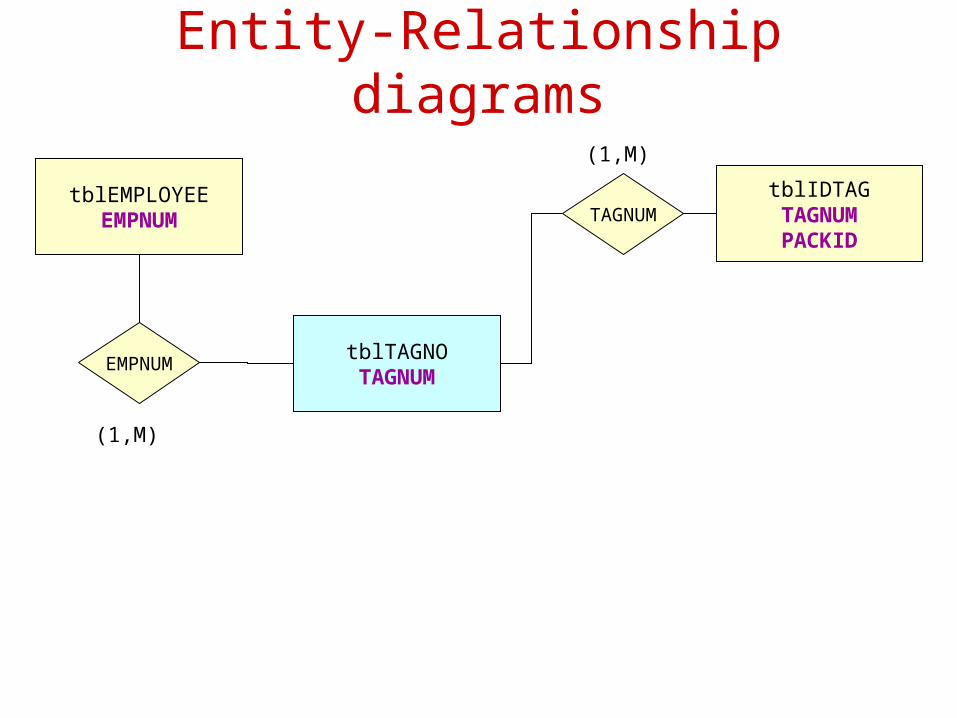
Entity-Relationship diagrams
tblEMPLOYEEEMPNUM
EMPNUM
tblIDTAGTAGNUMPACKID
tblTAGNOTAGNUM
TAGNUM
(1,M)
(1,M)
tblTAGNOTAGNUM
Entity-Relationship diagrams

REGISTRATIONLIC_PLATE_NO LIC_PLATE_ST SSN
123 MCD CA 123-34-5678253 DAL CA 134-56-7783
FINESCODE FINE
A 10$ B 20$ C 50$
INDIVIDUALSSSN LAST_NAME FIRST_NAME PHONE_NO123-34-5678 Curry Dorothy (916)358-4448134-56-7783 Fong May (916)563-7865
TICKET_NO LIC_PLATE_NO LIC_PLATE_ST DATE CODE10151 123 MCD CA 10/15/98 A10152 123 MCD CA 10/16/98 B10121 123 MCD CA 11/12/98 B10231 253 DAL CA 10/23/98 C12051 253 DAL CA 12/5/98 A
PARKING TICKETS
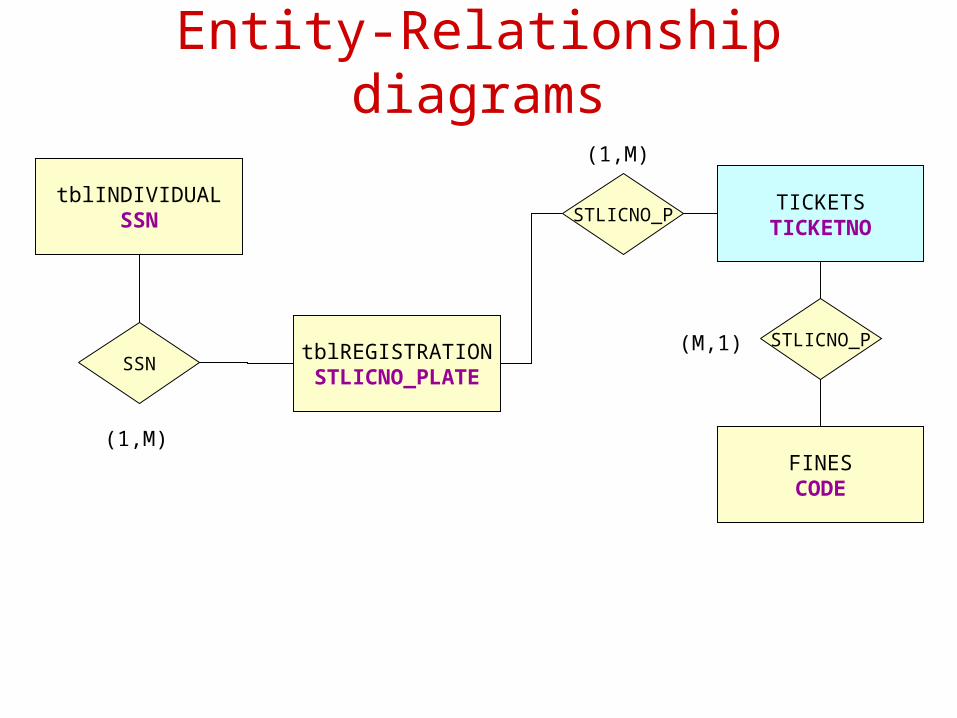
Entity-Relationship diagrams
tblINDIVIDUALSSN
SSN
TICKETSTICKETNO
tblREGISTRATIONSTLICNO_PLATE
STLICNO_P
FINESCODE
STLICNO_P
(1,M)
(1,M)
(M,1)
TICKETSTICKETNO

Entity-Relationship diagrams

REA data model
• REA is specifically for Accounting Information Systems
• 3 types of entities– Resources– Events– Agents
• Basic Template
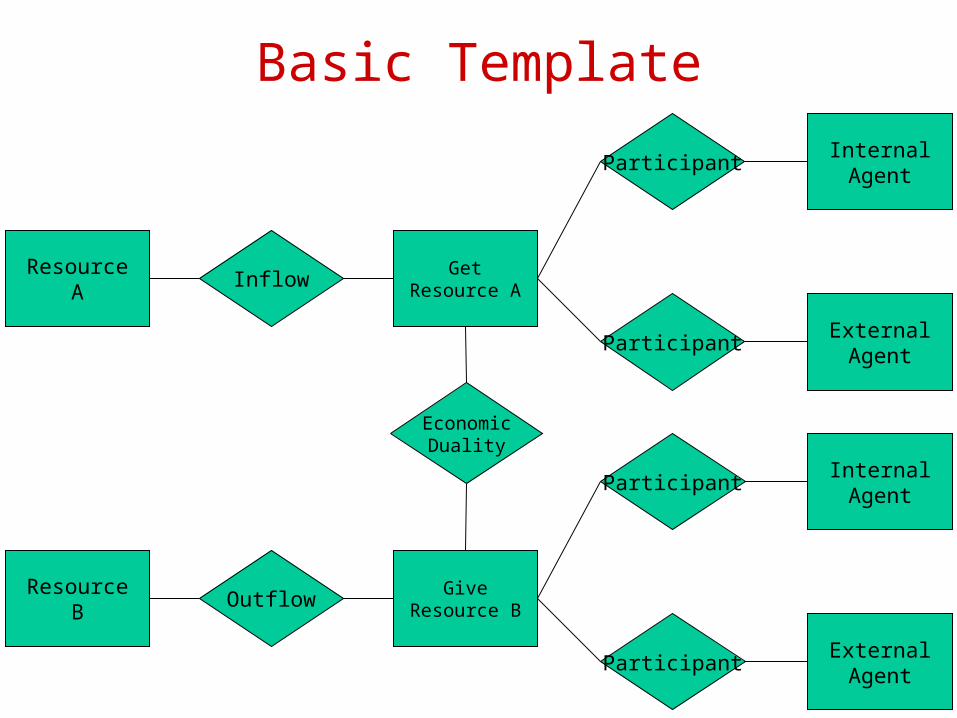
Basic Template
ResourceA
GetResource A
InternalAgent
ExternalAgent
Inflow
Participant
Participant
ResourceB
GiveResource B
InternalAgent
ExternalAgent
Outflow
Participant
Participant
EconomicDuality

Basic Template
• This is a slightly more restrictive view than we previously took.– Exchange event is two sided (balance sheet equation)
– Commitment events (inquiry events?) LEAD TO exchange events
– Every exchange must have an internal and external agent
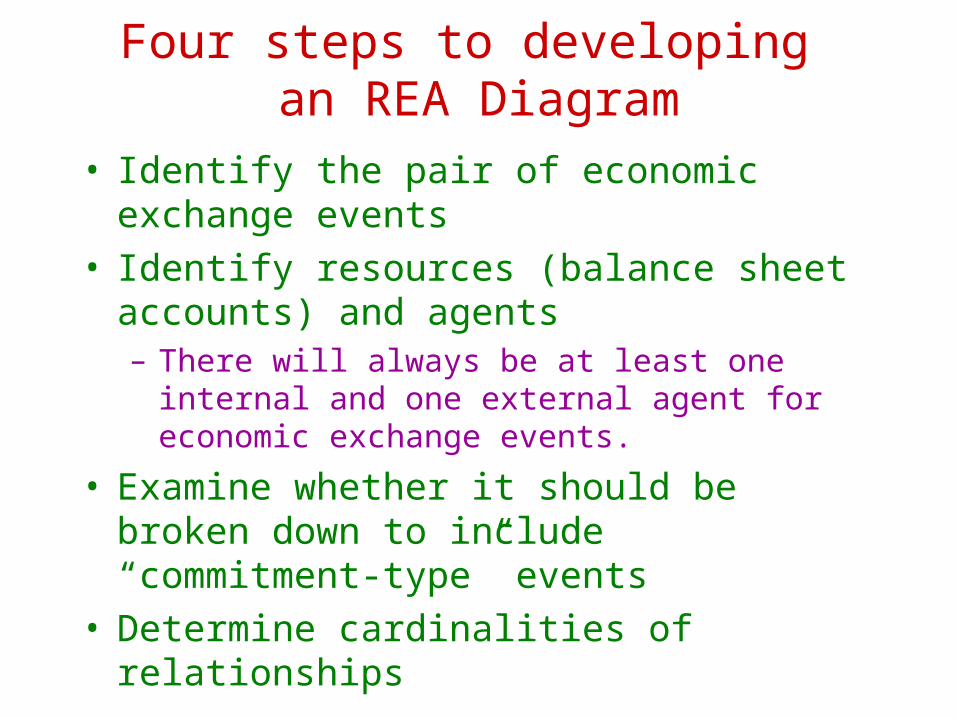
Four steps to developing an REA Diagram
• Identify the pair of economic exchange events
• Identify resources (balance sheet accounts) and agents– There will always be at least one internal and one external agent for economic exchange events.
• Examine whether it should be broken down to include “commitment-type” events
• Determine cardinalities of relationships

Identify the pair of economic exchange events
GiveInventory
GetCash
Example - Revenue Cycle:
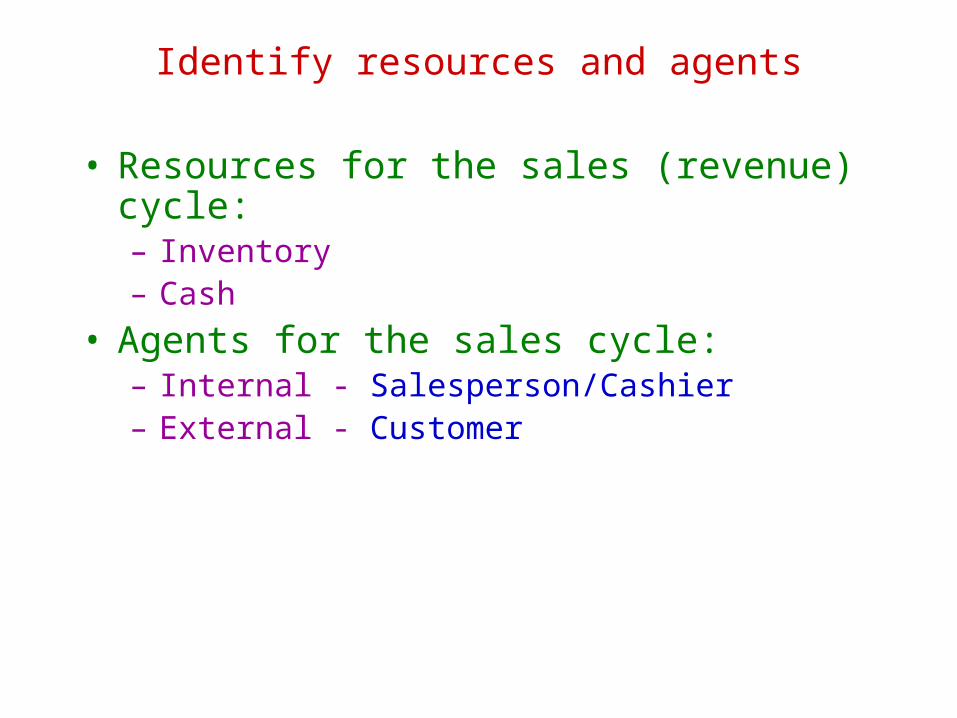
Identify resources and agents
• Resources for the sales (revenue) cycle:– Inventory– Cash
• Agents for the sales cycle:– Internal - Salesperson/Cashier– External - Customer

Cardinality
• How many “instances” (e.g. rows) in one entity can be linked to a specific instance in the other entity.
• A new concept:– Minimum cardinality– Maximum cardinality
• This is the number that we previously referred to a “cardinality”
• Notation for cardinality is (min,max) for one side of a relation or A:B for cardinality as we have discussed it.
Each of the panels in figure 5-7 describes one possible way that the company mightstructure the relationship between Sales and Cash Receipts.
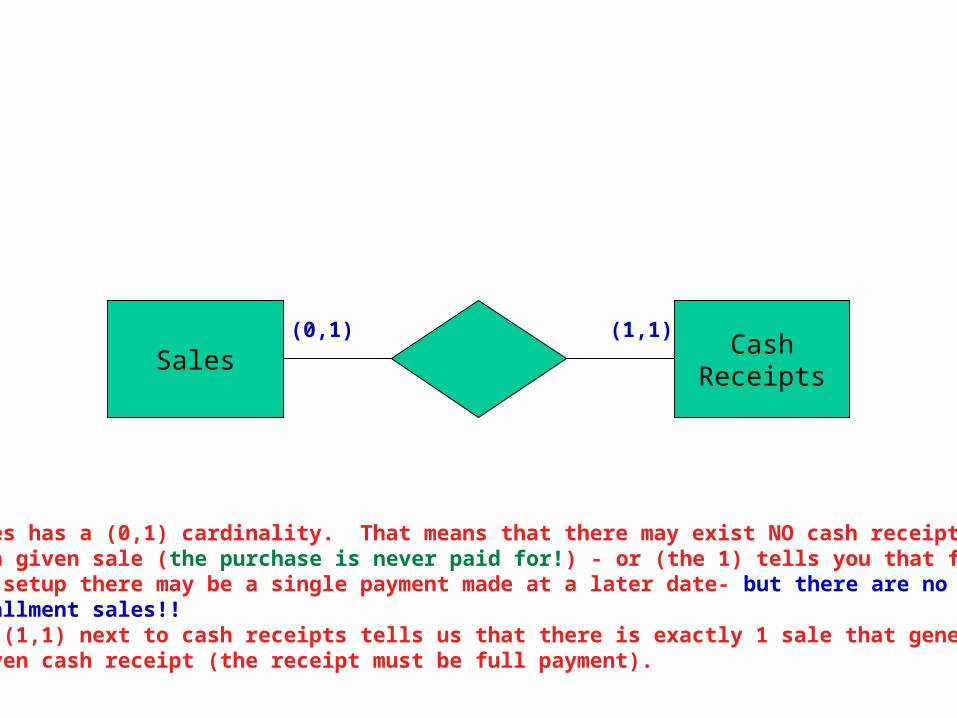
The CARDINALITY TELLS YOU QUITE A BIT ABOUT THE STRUCTURE OF THEDATABASE
•Sales has a (0,1) cardinality. That means that there may exist NO cash receiptfor a given sale (the purchase is never paid for!) - or (the 1) tells you that forthis setup there may be a single payment made at a later date- but there are noinstallment sales!!•The (1,1) next to cash receipts tells us that there is exactly 1 sale that generateda given cash receipt (the receipt must be full payment).
SalesCash
Receipts
(0,1) (1,1)

• Sales has a (0,N) cardinality. Again, there may exist NO cash receiptfor a given sale (the purchase is never paid for)
• For this setup, the customer CAN make installments (more than one cash receipt transaction for a given sale)
• The (1,1) next to cash receipts tells us that there is exactly 1 sale that generateda given cash receipt (you can’t have a revolving account where payment is “on account”) - each payment is by Invoice - but may only be a partial payment on theinvoice
SalesCash
Receipts
(0,N) (1,1)

• Sales has (0,1) cardinality - Again, there may exist NO cash receiptfor a given sale (the purchase is never paid for) or it may have a single subsequent payment - but NO INSTALLMENTS
• Each cash receipt of course must relate to some sale (the minimum of 1) and it may cover MORE THAN ONE SALE. So a payment can cover one or several invoices, but no partial payments are allowed!
SalesCash
Receipts
(0,1) (1,N)

• Sales has (0,N) cardinality - Again, there may exist NO cash receiptfor a given sale (the purchase is never paid for) or it may have subsequent payments (including installments)
• Each cash receipt of course must relate to some sale (the minimum of 1) and it may cover MORE THAN ONE SALE.
• This is what we typically think of as a revolving credit account
SalesCash
Receipts
(0,N) (1,N)
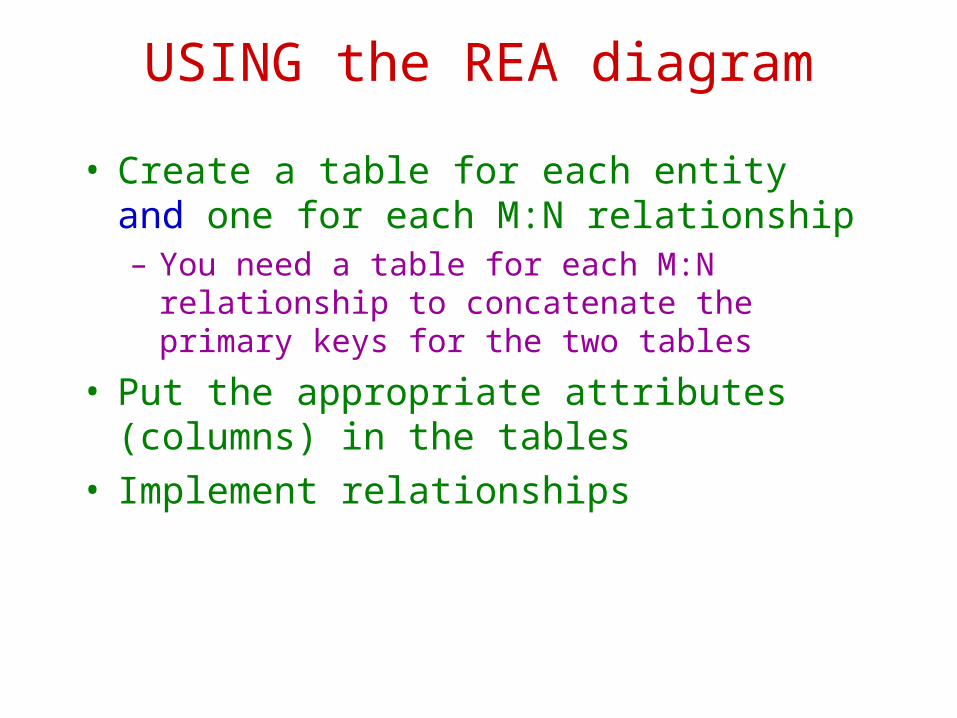
USING the REA diagram
• Create a table for each entity and one for each M:N relationship– You need a table for each M:N relationship to concatenate the primary keys for the two tables
• Put the appropriate attributes (columns) in the tables
• Implement relationships

![Diagramming Review II - WCUSD15 · about sentence diagramming. classes are excited ... -ed, -d, -t, or ... Diagramming Review II [Compatibility Mode]](https://img.dokumen.tips/doc/110x75/5af7254d7f8b9a9271913b29/diagramming-review-ii-sentence-diagramming-classes-are-excited-ed-d-t.jpg)