Embed Size (px)
Citation preview

Race/Ethnic Differences in Intracerebral Hemorrhage
Daniel Woo, MD, MS

Basic Epidemiology
• Primary Spontaneous ICH• Accounts for roughly 10-15% of all strokes• 40-50% mortality rate• Over 70% of survivors with significant
morbidity/disability• Half of the mortality occurs in the first two days
after stroke
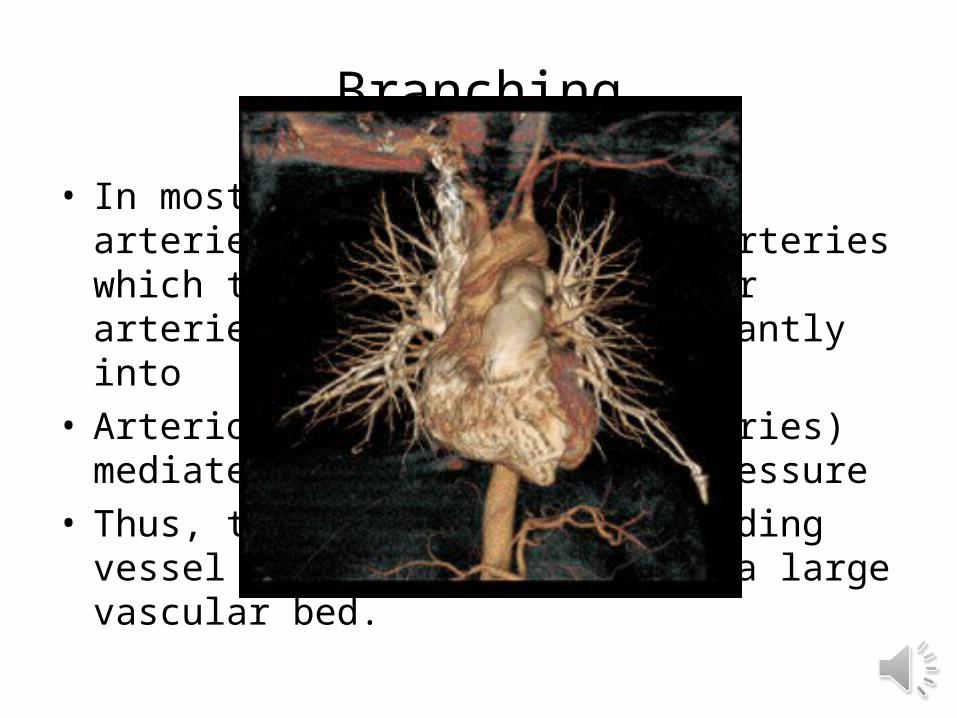
Branching
• In most vascular beds, large arteries branch into medium arteries which then branch into smaller arteries and then most importantly into
• Arterioles (smaller than arteries) mediate most of that blood pressure
• Thus, the pressure at the feeding vessel is distributed across a large vascular bed.

4
5

6

7

Hypertension and Cerebral Small Vessel Disease
• Theoretically, the pressure on lenticulostriates and small capillaries branching off of the MCA and Basilar artery without an intervening resistance bed is very high
• Population attributable risk is proportion of disease that would have been prevented if the risk factor did not exist
8

9

Importance of Location
• At one time, hypertension was felt to be the cause of ICH in all locations and cerebral amyloid angiopathy to be a rare cause of ICH
• Population-based studies – – To determine the attributable risk of each risk factor– To control for regional differences in risk factor
10

Cerebral Amyloid Angiopathy
• Amyloid plaques made of beta-sheets of proteins, make blood vessels more rigid and fragile.
• CAA occurs in 70% of Alzheimer’s disease patients
• In less than 10% of people less than 70 years of age but more than 50% of people age >90 years
• Occurs almost exclusively in the lobar regions of the brain and cerebellum
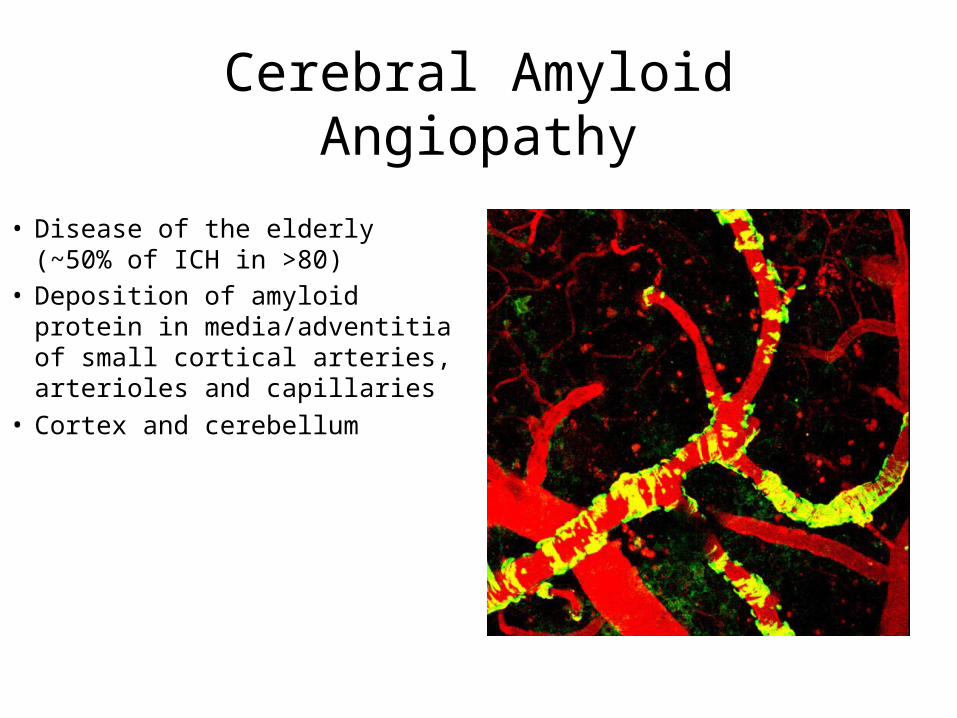
Cerebral Amyloid Angiopathy
• Disease of the elderly (~50% of ICH in >80)
• Deposition of amyloid protein in media/adventitia of small cortical arteries, arterioles and capillaries
• Cortex and cerebellum

Cerebral Amyloid Angiopathy
• Pathology– Destruction of normal
cortical vasculature
• Microbleeds on MRI GRE sequences– More common in blacks
with ICH?*– (Microbleeds also caused
by HTN)
• Lobar ICH• Association with Apo
E2/E4
*(Kidwell) Neurology 2008;71:1176-1182.*(Kidwell) Neurology 2008;71:1176-1182.
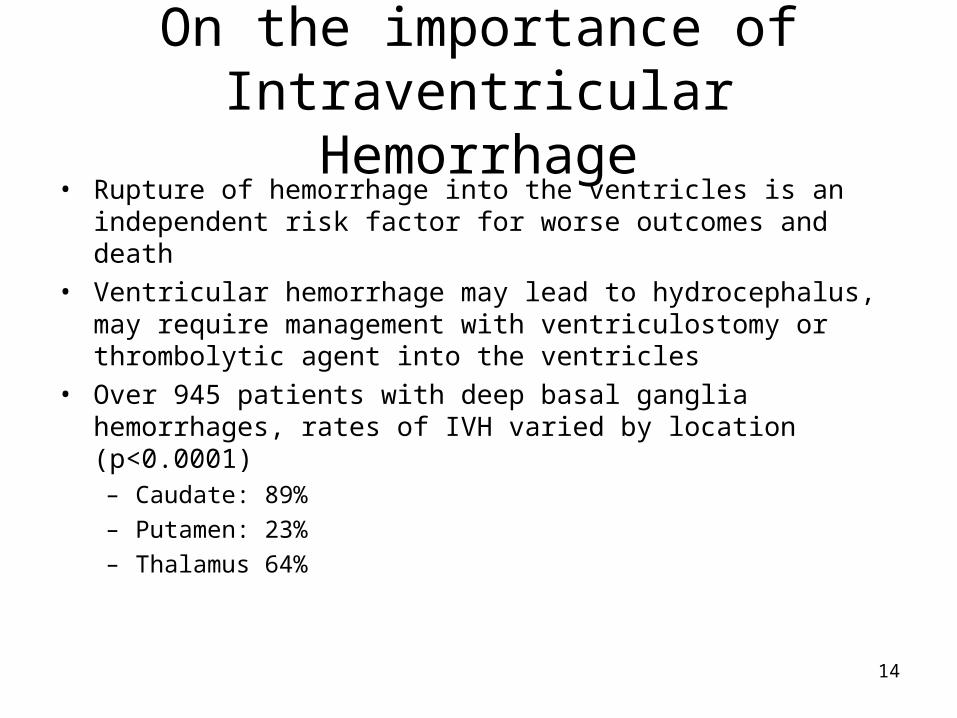
On the importance of Intraventricular Hemorrhage
• Rupture of hemorrhage into the ventricles is an independent risk factor for worse outcomes and death
• Ventricular hemorrhage may lead to hydrocephalus, may require management with ventriculostomy or thrombolytic agent into the ventricles
• Over 945 patients with deep basal ganglia hemorrhages, rates of IVH varied by location (p<0.0001)– Caudate: 89%
– Putamen: 23%
– Thalamus 64%
14

GERFHS – Discovery Set ERICH – Replication Set
Variables Incontinence Dysmobility Incontinence Dysmobility
OR (CI) p-value OR (CI) p-value OR (CI) p-value OR (CI) p-value
IVH Volume 1.50
(1.10, 2.06)0.0117
1.58
(1.17, 2.15)0.0031
1.42
(1.27, 1.60)
<.0001 1.40
(1.24, 1.57)
<.0001
Age (per year)1.07 (1.04,1.10) <.0001
1.06
(1.03, 1.09)<.0001
1.04
(1.03, 1.05)
<.0001 1.04
(1.03, 1.05)
<.0001
ICH Volume 1.78
(1.25, 2.54).0015
1.85
(1.32, 2.60)0.0004
1.77
(1.51, 2.06)
<.0001 2.22
(1.91, 2.58)
<.0001
Location
-Lobar
-Deep
-Brainstem
-Cerebellar
-Primary IVH
0.33 (0.15,0.72)
REF
5.22 (1.05, 25.95)
1.73 (0.62, 4.83)
.005
REF
.043
.30
0.18 (0.09, 0.40)
REF
1.84 (0.35, 9.62)
1.48 (0.55, 3.99)
<.0001
REF
.4712
.4419
0.51 (0.36,0.72)
REF
3.39 (1.83, 6.29)
0.70 (0.41, 1.20)
1.72 (0.58, 5.03)
.0001
REF
.0001
.19
.33
0.27 (0.19, 0.37)
REF
3.71 (2.06,6.69)
0.77 (0.48 1.24)
1.54 (0.55, 4.32)
<.0001
REF
<.0001
.28
.42
GCS at presentation
(per point)
0.89
(0.77 1.03).1198
0.88
(0.76, 1.03)0.1020
0.90
(0.87, 0.94)
<.0001 0.88
(0.84, 0.93)
<.0001
mRS before ICH 1.65 (1.24, 2.18) .0006 1.71 (1.29, 2.26) .00021.62
(1.38, 1.91)
<.0001 1.45
(1.22, 1.71)
<.0001
Female 1.42 (0.79, 2.57) 0.2412 0.99 (0.56, 1.75) 0.96481.51 (1.15, 2.00) 0.0036 1.68 (1.29, 2.18) 0.0001
15

How does this impact minority populations?
• Hypothesis: If hypertension is the predominant cause of non-lobar ICH and amyloid is the predominant cause of lobar ICH, how does the varying prevalence of hypertension and risk factors for amyloid affect the presentation of ICH in minority populations?
16

Race/Ethnic Variations of Hypertension
17

ICH among Blacks
• Annual incidence rate per 100,000– 48.9 for AAs vs. 26.6 for whites– Highest risk ages 35-44 years (OR=5.0)
• Is it all Hypertension?– Deep (OR=4.8 vs. whites)– Lobar (OR=2.8 vs. whites)
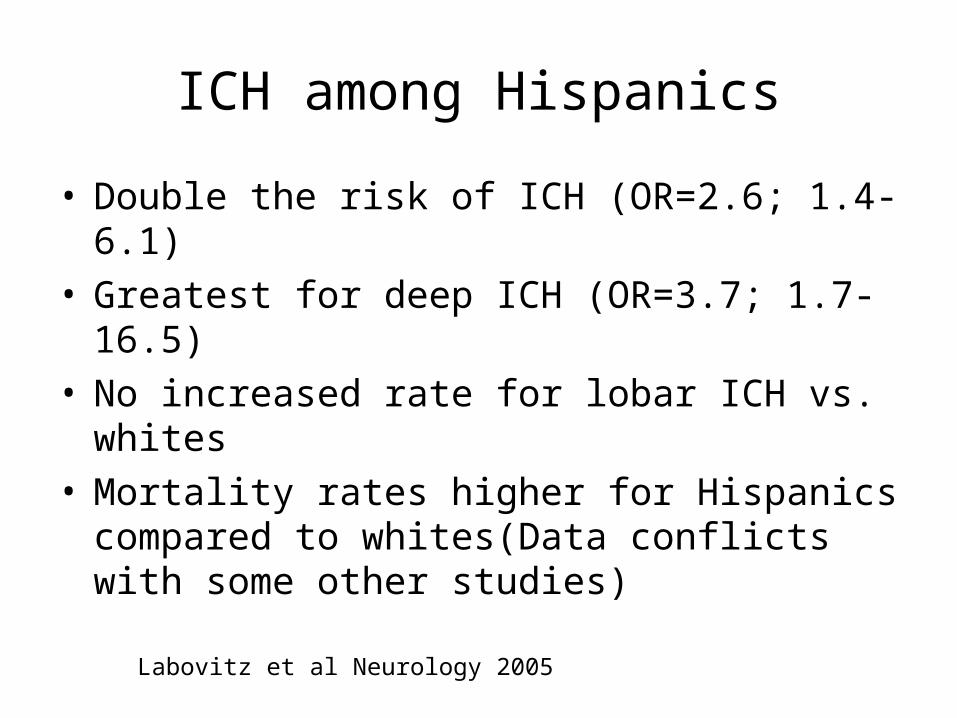
ICH among Hispanics
• Double the risk of ICH (OR=2.6; 1.4-6.1)• Greatest for deep ICH (OR=3.7; 1.7-16.5)• No increased rate for lobar ICH vs. whites• Mortality rates higher for Hispanics compared to
whites(Data conflicts with some other studies)
Labovitz et al Neurology 2005
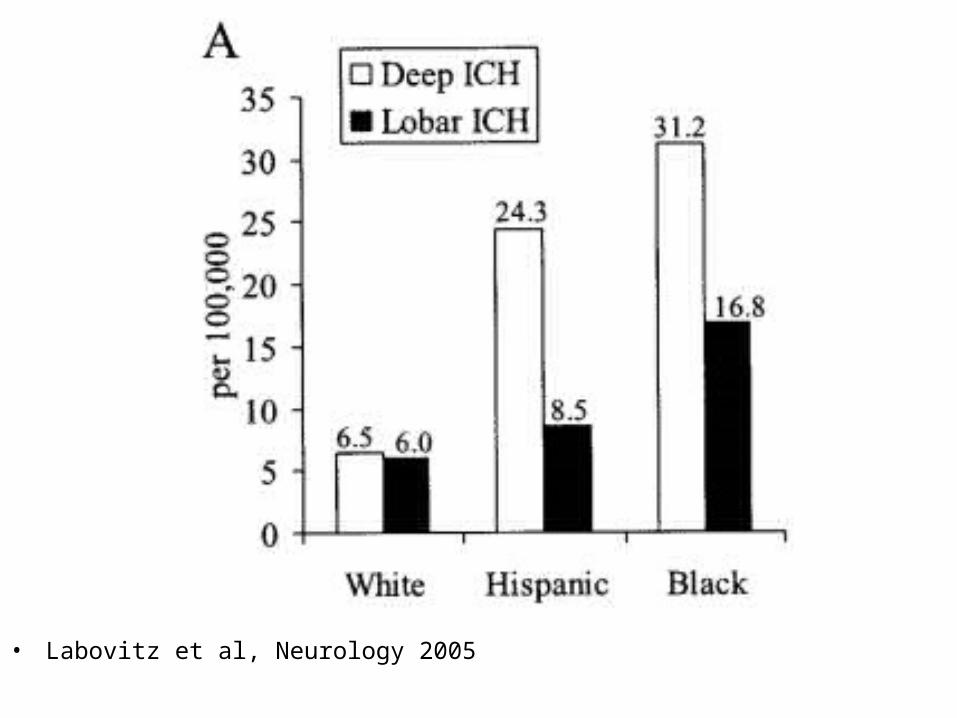
• Labovitz et al, Neurology 2005


Importance of Untreated Hypertension
22

• Per the US Census Bureau in 2010– 16% are Hispanic (up from 14.8% in 2000) or roughly
50.5 million Americans– 12.3% are African-American
• Minorities affected disproportionately for stroke and ICH in particular.

Hispanics
• Uninsured rate of 32.7% (19.5% for blacks and 11.1% for whites)
• 1/3 never married• Per capita income of Hispanics is one half
that of whites• Household net worth is less than one tenth
that of whites• Drop out of high school 3 times the white rate
and twice the black rate


Wealth

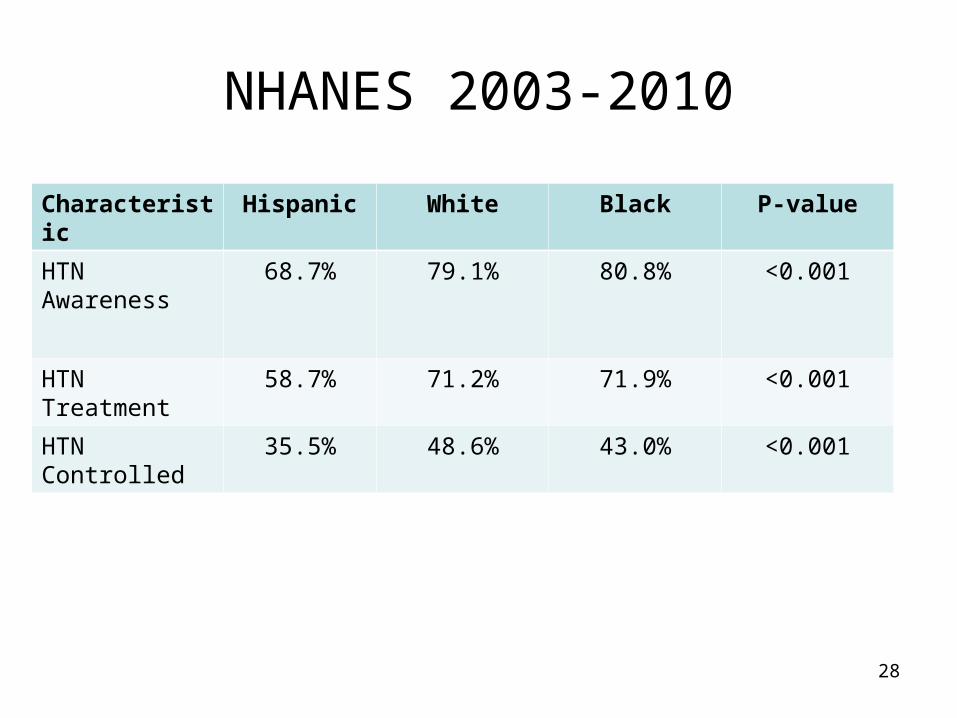
NHANES 2003-2010
28
Characteristic Hispanic White Black P-value
HTN Awareness
68.7% 79.1% 80.8% <0.001
HTN Treatment 58.7% 71.2% 71.9% <0.001
HTN Controlled 35.5% 48.6% 43.0% <0.001
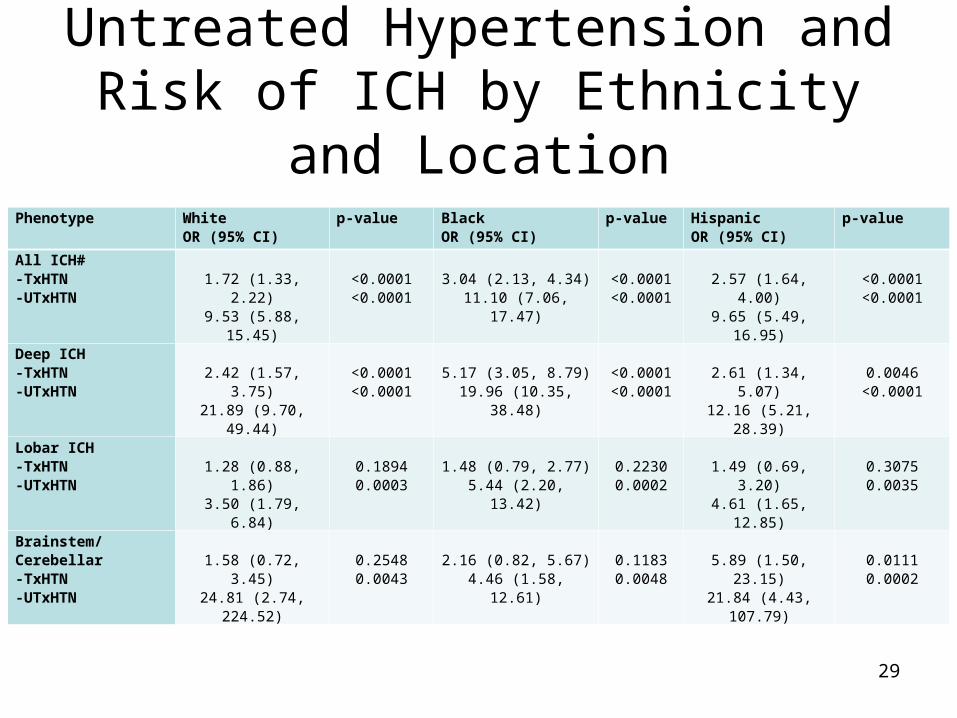
Untreated Hypertension and Risk of ICH by Ethnicity and Location
Phenotype White OR (95% CI)
p-value BlackOR (95% CI)
p-value HispanicOR (95% CI)
p-value
All ICH#-TxHTN-UTxHTN
1.72 (1.33, 2.22)
9.53 (5.88, 15.45)
<0.0001<0.0001
3.04 (2.13, 4.34)
11.10 (7.06, 17.47)
<0.0001<0.0001
2.57 (1.64, 4.00)
9.65 (5.49, 16.95)
<0.0001<0.0001
Deep ICH-TxHTN-UTxHTN
2.42 (1.57, 3.75)
21.89 (9.70, 49.44)
<0.0001<0.0001
5.17 (3.05, 8.79)
19.96 (10.35, 38.48)
<0.0001<0.0001
2.61 (1.34, 5.07)
12.16 (5.21, 28.39)
0.0046
<0.0001
Lobar ICH-TxHTN-UTxHTN
1.28 (0.88, 1.86)3.50 (1.79, 6.84)
0.18940.0003
1.48 (0.79, 2.77)
5.44 (2.20, 13.42)
0.22300.0002
1.49 (0.69, 3.20)
4.61 (1.65, 12.85)
0.30750.0035
Brainstem/Cerebellar-TxHTN-UTxHTN
1.58 (0.72, 3.45)
24.81 (2.74, 224.52)
0.25480.0043
2.16 (0.82, 5.67)
4.46 (1.58, 12.61)
0.11830.0048
5.89 (1.50, 23.15)
21.84 (4.43, 107.79)
0.01110.0002
29

Not all Hypertension?
• Untreated hypertension is a markedly greater risk of ICH than treated hypertension, especially for regions of the brain that are associated with hypertensive ICH.
• Although lack of treatment may explain the higher rate of ICH among Hispanics, AAs have similar rates of awareness, treatment and controlled HTN as whites
• Is there some other risk factor?
30

Hypercholesterolemia and Intracerebral Hemorrhage
• 1976 – Konishi et al; Autopsy study in the Akita Prefecture found little arteriosclerotic change in cerebral blood vessels of hypertensive ICH patients; no risk from hypercholesterolemia
• 1988 – Ueda et al; Prospective population-based study; Higher serum cholesterol level associated with 50% reduction in rate of ICH.

Hypercholesterolemia and Intracerebral Hemorrhage
• 1989 – Honolulu Heart Program• 1993 – Akita Pathology Study• 1994 – MRFIT Study• 1995 – Copenhagen Stroke Study • 1996 - Kaiser Permanente Medical Care Study• 1996 - Melbourne Risk Factor Study• 1997 – Kim et al• 1999 – Segal et al

Hypercholesterolemia and Intracerebral Hemorrhage
• 2001 – Korea medical insurance co. study• 2002 – GERFHS - Cincinnati• 2003 – Ariesen et al – Meta-analysis• 2003 – Ko et al - • 2004 – GERFHS – Statin and ICH• 2007 – NOMAS• 2012 – Martini et al
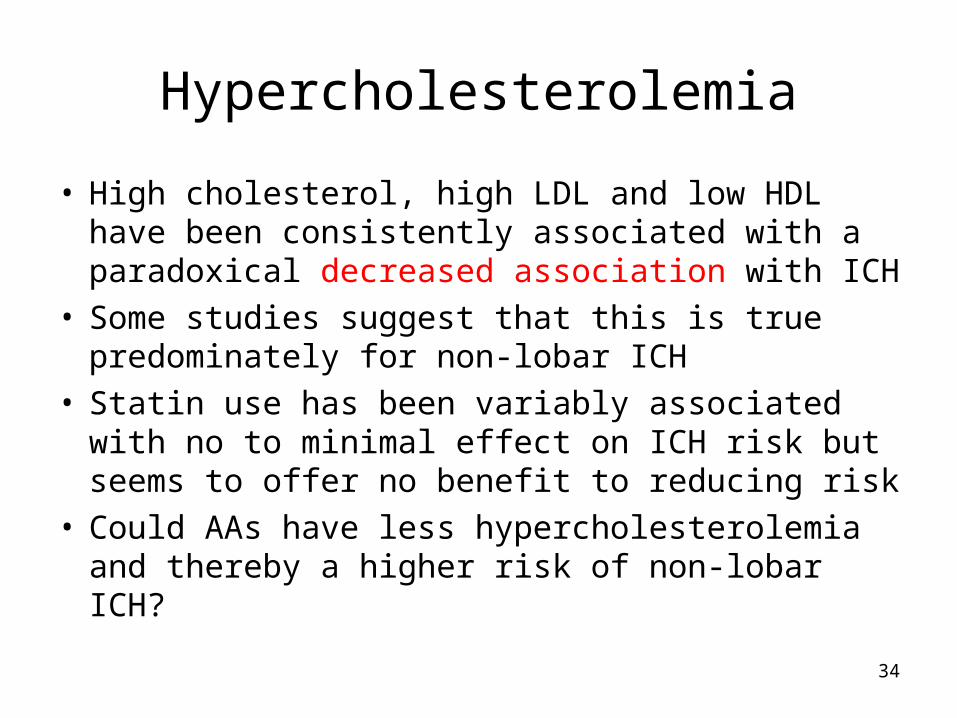
Hypercholesterolemia
• High cholesterol, high LDL and low HDL have been consistently associated with a paradoxical decreased association with ICH
• Some studies suggest that this is true predominately for non-lobar ICH
• Statin use has been variably associated with no to minimal effect on ICH risk but seems to offer no benefit to reducing risk
• Could AAs have less hypercholesterolemia and thereby a higher risk of non-lobar ICH?
34

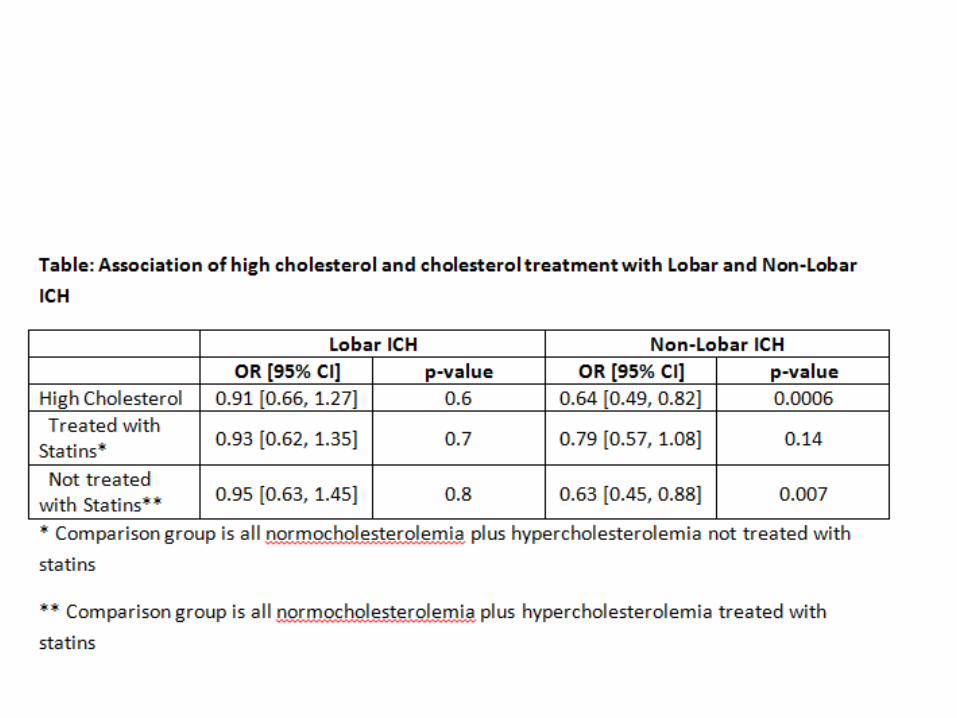
By Location
• Non-lobar ICH: – OR 0.58 (0.45-0.71; p<0.001); – AR: -29.9
• Lobar ICH:– OR 0.85 (0.61-1.19; p=0.34)– AR: N.D.
• Almost a third of non-lobar ICH is attributable to effects from Cholesterol but no protective effect appears for lobar ICH

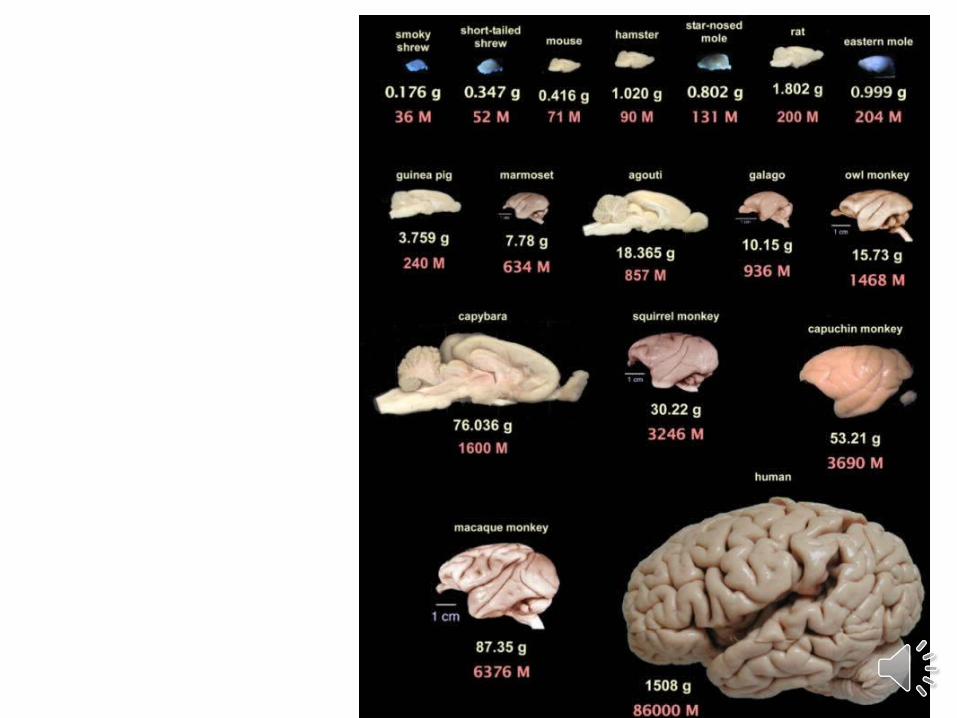
Brain and Cholesterol
• The brain is the largest repository of cholesterol in the human body (moreso than even the liver)
• Largely in myelin sheaths but also essential to inflammation, neurovascular unit and vascular blood-brain barrier integrity
• 95% of all brain cholesterol is synthesized locally. – Minor uptake of serum cholesterol– Brain cholesterol is metabolized locally but
synthesized using the same processes as liver

Apolipoprotein E
• Apo E is a major lipoprotein– Transport of chol from liver to tissues– Reverse transport from tissue to liver– E4 – associated with Alzheimer’s and cardiovascular
disease and lobar ICH– E2 – Protective of AD and CV disease but a risk for
lobar ICH

Hypercholesterolemia by location of Stroke

Apo E2’s effect modified by Hypercholesterolemia
Lobar ICH cases Lobar ICH controls OR (95% CI)
E2 containing
All others E2 containing
All others
No HC 33 (38.3%) 86 (72.2%) 53 (18.5%) 232 (81.4%) 1.7 (1.1-2.8)
HC 28 (33%) 57 (67%) 27 (12.1%) 196 (87.8%) 3.6 (1.9-6.5)
• Hypercholesterolemia roughly doubles the risk of lobar ICH with an Apo E2 containing genotype

Apo E4’s effect not modified by Hypercholesterolemia
• Stratifying by HC did not affect risk of Apo E4 containing genotypes for lobar ICH
Lobar ICH cases Lobar ICH controls OR (95% CI)
E4 containing All others E4 containing All others
No HC 42 (35.3%) 77 (64.7%) 73 (25.6%) 212 (74.3%) 1.5 (0.8-2.3)
HC 33 (38.8%) 52 (61.2%) 73 (32.7%) 160 (71.7%) 1.4 (0.8-2.3)

Statins
• SPARCL study – Ischemic stroke cases in secondary prevention with high dose Lipitor– Found an increased risk of ICH with statin treatment
• McKinney et al – Meta-analysis of over 90,000 cases and 90,000 controls (sometimes treated with low dose statins) and found no increased risk of ICH.

Statin use by Apo E Genotype
• Compared to Apo E3/E3• No significant differences in non-lobar ICH• In lobar ICH:
– E4/E4 with statins: OR=4.5 (1.3-16.2; p=0.02)– E2/E4 with statins: OR=11.3 (2-64; p=0.005)– E2/E3 with statins: OR=2.8 (1.0-7.5; p=0.06)
• Without statins:– E4/E4: OR=1.6 (0.27-9.4; p=0.63)

To summarize
• Hypercholesterolemia is well established to have a protective association with ICH
• This protective effect appears to be greatest in non-lobar ICH
• But the protection appears to go away with statin use – suggests it is the actual cholesterol level and not a confounder

To summarize
• In lobar ICH, Apo E2’s risk is increased in the setting of hypercholesterolemia
• Statin use increases the risk of lobar ICH for Apo E4 containing genotypes, particularly E2/E4 and E4/E4
• OR statin plus Apo E3 is most protective
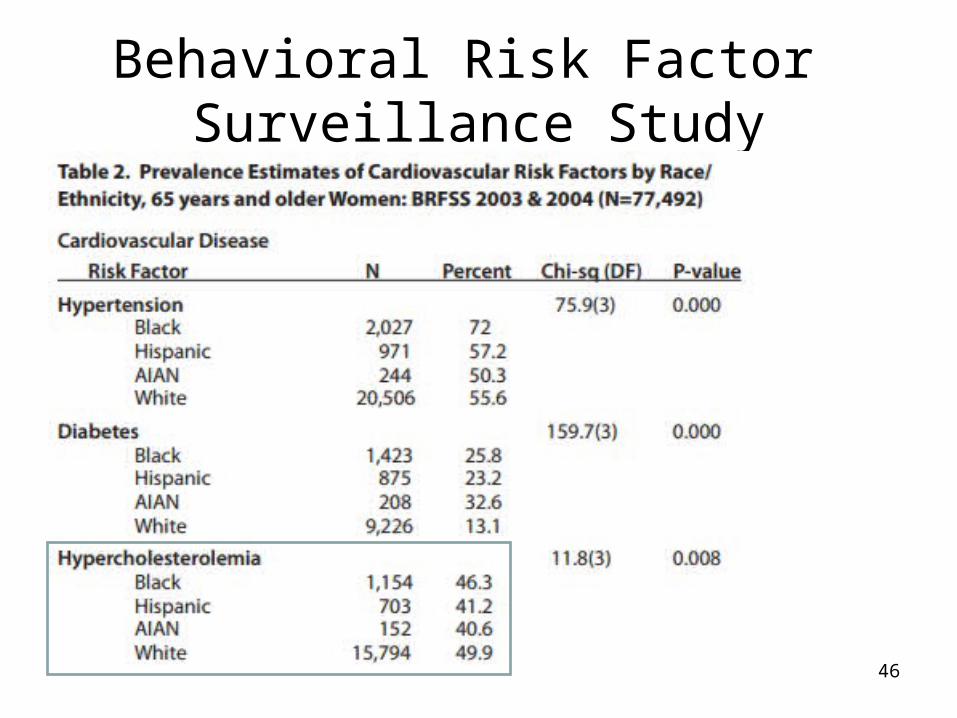
Behavioral Risk Factor Surveillance Study
46

• AAs have a higher prevalence of HTN but similar rates of treated and untreated HTN; Higher rate of ICH from higher prevalence
• Hispanics have a similar rate of HTN to whites but a higher rate of untreated HTN; Higher risk from untreated HTN
• AAs have a higher prevalence of Hypercholesterolemia to Whites; no protection
• Hispanics have less hypercholesterolemia than whites; more risk of ICH
More and Younger
• Both minority groups tend to have ICH at a younger age than whites with the greatest risk in the most economically productive periods
• Both minority groups have markedly increased incidence rates
• However, non-Hispanic blacks, who actually have better healthcare attendance than Hispanics, still have a higher rate.
• Suggests that biologic as well as social factors contribute to disparity

Dementia Treatment and ICH
• Prior history of dementia is more common in cases of stroke than controls.
• Treated risk factors tend to lower risk but would treating dementia make any difference to risk of ICH?
• Using both GERFHS and ERICH, we evaluated treated dementia among 234 cases and 36 controls with a prior history of Alzheimer’s disease
– Memantine (19.2% vs. 25.0% - OR 0.71; p=0.42)– Donepezil (32.1% vs. 61.1% - OR 0.30; p=0.0011)– Treated dementia associated with decreased risk of ICH (OR=0.18; p=0.0002)
independent of hypertension, hypercholesterolemia, anticoagulant use and prestroke disability.
• Eunji Yim et al
49

SSRI and ICH
• SSRI are widely used and have been associated with a very slight increased bleeding risk.
• Evaluating 4134 ICH cases and 4945 controls, – In univariate analysis SSRI was actually protective (OR=0.85,
p=05) but no association with risk in multivariate– Combination of SSRI and warfarin use produced a higher point
estimate than warfarin alone but did not reach statistical significance (p=0.09)
• SSRI use was not associated with an increased risk of ICH
• Obeidat et al
50

DVT/PE and ICH
• Prior studies suggest DVT/PE is more common in ICH patients than ischemic stroke (3% vs. 1.67%) and patients cannot be anticoagulated after developing these complications
• Comparing 2276 cases of ICH; 63 had DVT/PE complications (3%)
• Predictors included– Prior history of DVT/PE (OR=8.5; p<0.001)– Inbubation (OR=3.9; p<0.001)– Presence of IVH (OR=1.9; p=0.28)
• Confirm that the complication is rare but that special attention should be given with risk factors
• Osborne et al 51

Discharge Dispositon
• Although clinical severity may vary, once controlled for, should not see a different disposition after ICH to home versus facility by race/ethnicity
52

Independent risk factors for discharge to facility
53
Characteristics OR 95% CI P-valuePost mRS (0-3 vs 4-5) 8.18 5.95-11.25 <0.0001ICH volume (log volume+1) 2.70 2.24-3.27 <0.0001Insurance (relative to Medicaid) 0.0007 Private Insurance 1.49 1.08-2.05 0.014 Medicare 1.88 1.26-2.81 0.0020 VA 1.84 0.51-6.61 0.35Age (OR for 5-year change) 1.09 1.02-1.17 0.013Ethnicity 0.0015 Black vs. White 1.34 0.90-1.98 0.15 Hispanic vs White 0.71 0.47-1.06 0.092 Blacks vs. Hispanic 1.89 1.336-2.667 0.0003Location 0.0007 Primary IVH vs lobar 13.76 4.20-45.10 0.0026 Brainstem vs lobar 20.18 9.03-45.10 <0.0001 Cerebellum vs lobar 3.09 1.72-5.55 <0.0001 Deep vs lobar 3.83 2.64-5.55 <0.0001

Discharge disposition and Outcome• Although Hispanics were more likely to be discharged home after
controlling for severity measures, patients were more likely to continue to be disabled if discharged to a medical facility than home(!)
• mRS=3 at discharge; follow-up mRS>=3 (OR=2.7, p=0.015)• mRS=4 at discharge; follow-up mRS>=4 (OR=3.8, p=0.04)• This paradoxical relationship was independent of age, presenting
GCS, location of ICH, presence of IVH, prior history of dementia• Regardless, the variation in discharge disposition does not appear
to affect outcomes• Osborne et al.
54
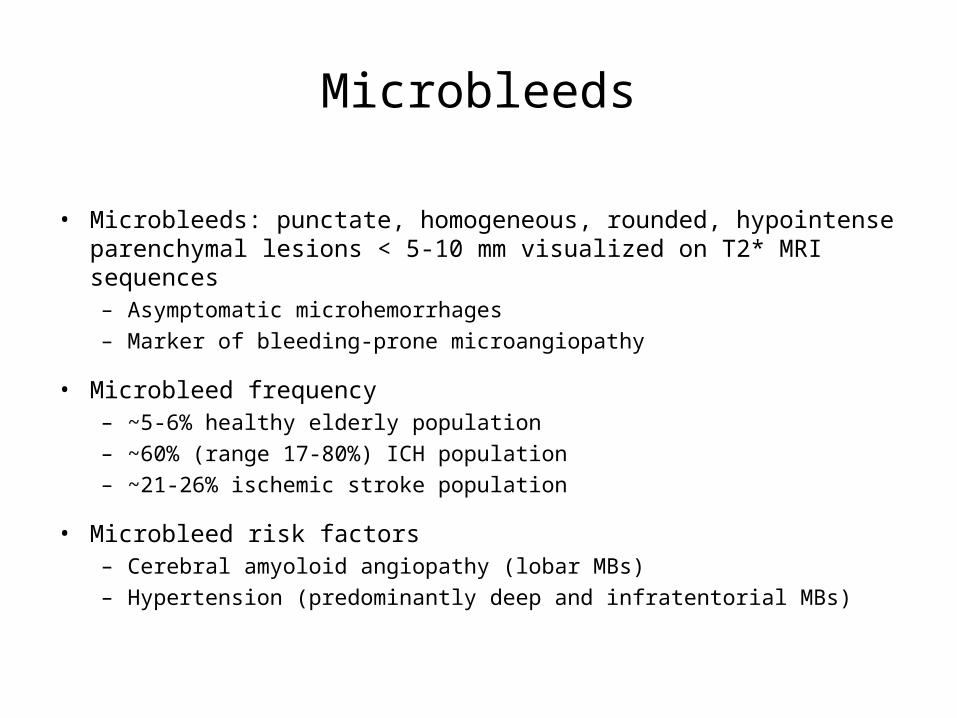
Microbleeds
• Microbleeds: punctate, homogeneous, rounded, hypointense parenchymal lesions < 5-10 mm visualized on T2* MRI sequences– Asymptomatic microhemorrhages
– Marker of bleeding-prone microangiopathy
• Microbleed frequency– ~5-6% healthy elderly population
– ~60% (range 17-80%) ICH population
– ~21-26% ischemic stroke population
• Microbleed risk factors– Cerebral amyoloid angiopathy (lobar MBs)
– Hypertension (predominantly deep and infratentorial MBs)

Background: Microbleeds
• Microbleeds presence and burden associated with– Recurrent symptomatic ICH
– Cognitive impairment
– Severity of small vessel disease and leukoaraiosis
• Recent studies suggestive of racial / ethnic differences in microbleed frequency, burden, and associated risk factors
• Goal of current analysis – Explore by race/ethnicity the frequency and characteristics of
microbleeds in patients enrolled in ERICH
– Explore impact of microbleeds on long-term functional outcome
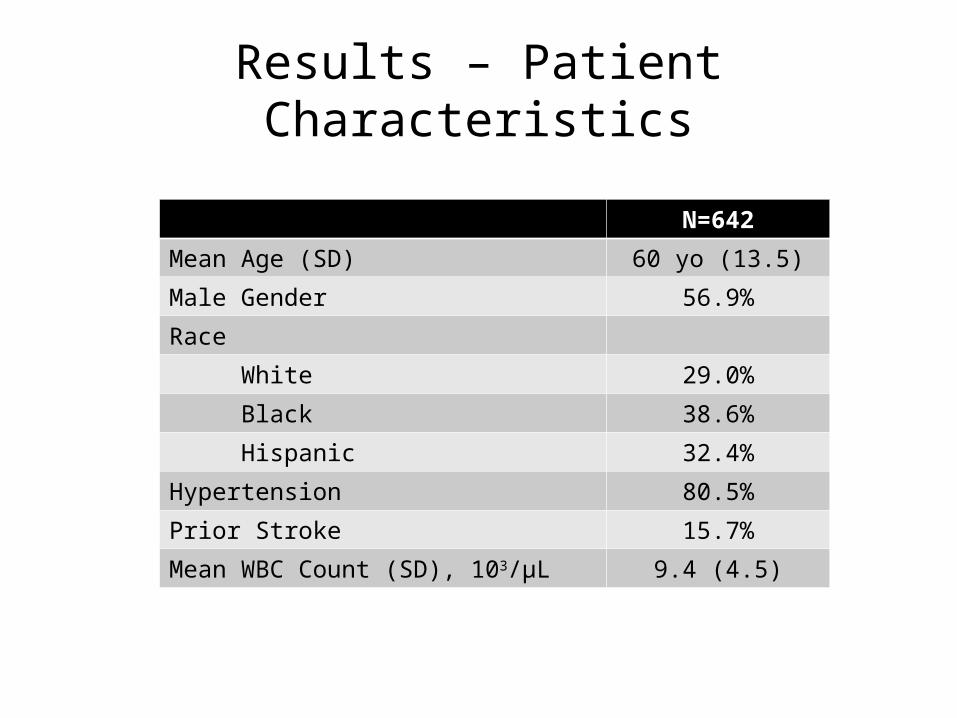
Results – Patient Characteristics
N=642
Mean Age (SD) 60 yo (13.5)
Male Gender 56.9%
Race
White 29.0%
Black 38.6%
Hispanic 32.4%
Hypertension 80.5%
Prior Stroke 15.7%
Mean WBC Count (SD), 103/µL 9.4 (4.5)

Results – Imaging Characteristics
N=642
Mean ICH Volume, cc 15.6 (18.2)
Presence of MBs 48.9%
MB count
Mean 13 (27)
Median (IQR) 4 (2-11)
Median WMD Score (IQR) 6 (4-8)

Case Example 1
54 yo white male with HTN, DM, lobar ICH; predominantly lobar MBs

Case Example 2
39 yo Hispanic male with deep ICH and predominantly deep MBs; moderate leukoaraiosis
GRE FLAIR

Case Example 2
39 yo Hispanic male with deep ICH and predominantly deep MBs; moderate leukoaraiosis
GRE FLAIR

Case Example 3
64 yo black male with HTN and left deep ICH, both lobar and deep MBs

Microbleed Locations
*Deep includes infratentorial
n=314

Microbleed Location by ICH Location
n=312
p=0.039
Overall p=0.0001

Univariate Analysis: Microbleed Presence
MB +n=314
MB -n=328
p value
Age (SD) 60.5 (12.8) 59.9 (14.2) 0.531
Hypertension 86% 76% 0.001
Prior Stroke 21% 11% <0.001
Baseline WBC Count (SD) 9.7 (5.3) 9.0 (3.6) 0.038
Pre-stroke Antiplatelet 39% 40% 0.78
Pre-Stroke Anticoagulation 8% 7% 0.759
Median WMD Score (IQR) 8 (6-10) 4 (4-6) <0.001
Mean ICH Volume (SD) 13.6 (16.3) 17.4 (19.7) 0.01
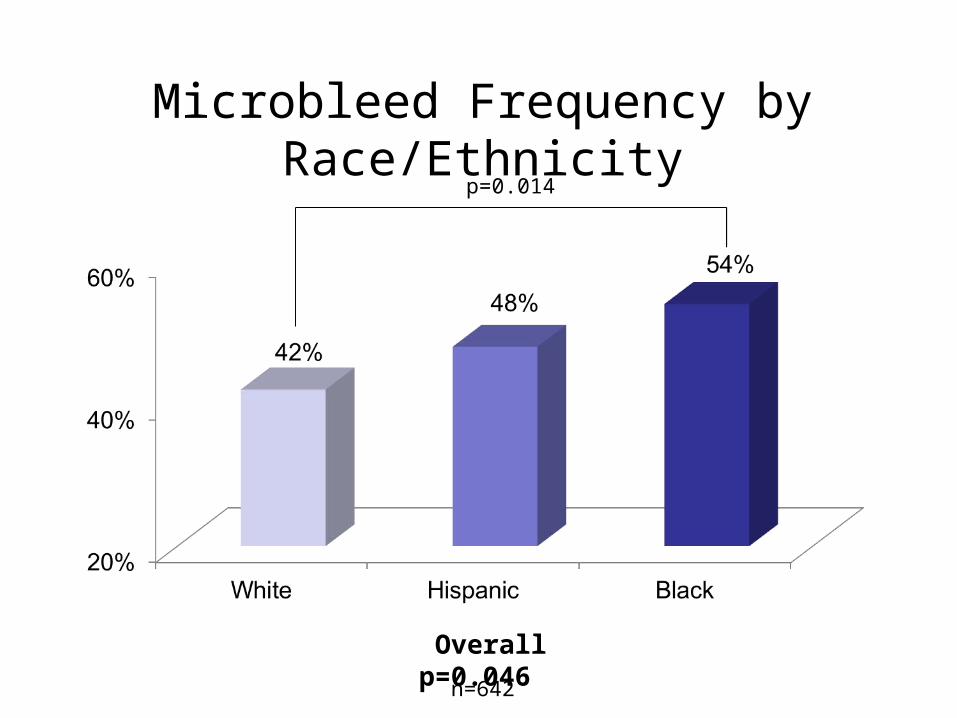
Microbleed Frequency by Race/Ethnicity
Overall p=0.046
p=0.014
n=642

Univariate Analysis: Racial Comparison of MB+ Cases
Whiten=186
Blackn=248
Hispanicn=208
p value
Age (SD) 67.5 (13.0) 58.3 (11.0) 58.1 (13.0) <0.0001*
Hypertension 79.7% 95.5% 79% <0.001†
Prior Stroke 13.9% 28.1% 17% 0.0244‡
Baseline WBC Count (SD) 10.1 (4.0) 9.4 (6.8) 9.9 (3.5) 0.593
Pre-stroke Antiplatelet 44.3% 37.8% 36% 0.498
Pre-Stroke Anticoagulation 11.4% 6.7% 6% 0.343
Median WMD Score (IQR) 8 (4-8) 8 (6-10) 6 (5-9) 0.028±
Mean ICH Volume (SD) 16.7 (20.7) 13.6 (16.3) 11.3 (11.3) 0.09
*p<0.0001 for W vs. B, and W vs. H†p<0.001 for W vs. B, and for B vs. H‡p= 0.017 for W vs. B, and p=0.046 for B vs. H±p=0.04 for B vs. W, 0.06 for H vs. W, and 0.042 for B vs. H

Microbleed Location by Race
n=314
Overall p=0.167

Multivariable Logistic Regression: Presence of Microbleeds
OR p value
Hypertension 1.62 0.037
WMD Score 1.36 <0.0001
WBC Count (103/µL) 1.06 0.012
Race/ethnicity 0.111
Black vs. White 1.53 0.056
Hispanic vs. White 1.49 0.078

Multivariable Logistic Regression: Poor Outcome (6 Month mRS 4-6)
OR p value
Presence of Microbleed(s)* 2.21 0.001
ICH Volume 1.04 <0.001
GCS Score 0.82 <0.001
Intraventricular Hemorrhage (IVH) 1.98 0.003
Age (5 year OR) 1.21 <0.001
*WMD score and presence of microbleeds highly colinear

Conclusions
• This study demonstrates substantial differences in microbleed rates across race/ethnicities
• This is the first study to report an intermediate microbleed rate among Hispanics relative to white and black ICH cases
• In addition to hypertension and leukoaraiosis, our model suggests that inflammation may be an important factor contributing to microbleeds
• As a biomarker of progressive vasculopathy and poor outcome, microbleeds may provide a valuable surrogate measure in future studies of therapies targeting optimal approaches to risk factor control

Background: ICH and BP Management
• Elevated BP in acute ICH associated with hematoma expansion, increased mortality, and perihematomal edema
• Current guidelines recommend maintaining SBP < 180 mmHg
• Recent trials designed to evaluate intensive treatment acutely (e.g. SBP < 140 mmHg)– The INTERACT2 trial: no reduction in rate of death or severe
disability; association with improved functional outcomes– ATACH II trial ongoing

Background: ICH and Remote DWI Lesions
• Remote acute ischemic lesions visualized on DWI in 11-41% of patients with acute ICH (7 studies to date)
• Many, but not all, prior studies demonstrated an association with large fluctuations in BP in the acute hospital setting
• Several studies also suggest association between DWI lesions and poor outcome
Prabhakaran, Stroke 2010Gregoire, Brain 2011Menon, Ann Neurol 2012Garg, Stroke 2012
Kang, Neurology 2012Arsava, JSCVD 2013Tsai, PLOS ONE 2014
Methods
• The Ethnic/Racial Variations of Intracerebral Hemorrhage (ERICH) study
– Multi-center, prospective, case-control study of ICH in white, black, and Hispanic patients
– Overall goal: identify genetic variation that affects risk of ICH

Methods
• In addition to clinically performed MRI, 1 in every 5 cases has a research-required MRI (to avoid biases on clinical indication for MRI) – MRI includes DWI, GRE, FLAIR sequences
– MRI are interpreted by central core lab blinded to clinical data • ICH volume and location• DWI lesion number, location, and acuity
• Delta MAP calculated as difference between highest and lowest MAP prior to MRI
• Statistical analyses were performed using SPSS version 21

Results: Patient Characteristics
N = 601
Mean Age (SD) 60.7 (13.6)
Race
White 33.1%
Black 35.4%
Hispanic 31.4%
Male Gender 55.4%
Hypertension 79%
Prior Stroke 16.1%
Mean GCS (SD) 13.3 (3)
Mean Delta MAP, mmHg (SD) 43.7 (25.3)

Imaging Results
N = 601
Mean ICH Volume, cc (SD) 15.7 (17.6)
Presence of DWI Lesion(s) 26%
Mean DWI Lesion Count (SD) 5.5 (12.5)
Median WMD Score (IQR) 6 (4-8)
Presence Microbleed(s) 53.8%
IVH Present 34.3%

Case Example 1
DWI ADC GRE
Left periventricular ICH in 45 yo black male with hx of HTN; MAP was 106 mmHg

Case Example 2
Left thalamic ICH in 50 yo Hispanic male with hx of HTN; MAP was 125 mmHg

Univariate Analysis
DWI +n=156
DWI –n=445
p value
Mean Age (SD) 57.3 (13.3) 61.9 (13.6) < 0.001
Race/Ethnicity 0.005
White 19.6% 80.4%
Black 33.3% 66.7%
Hispanic 24.3% 75.7%
Male Gender 62.8% 52.8% 0.03
Hypertension 81.9% 78.3% 0.347
Prior Stroke 21.8% 14.2% 0.026
Mean Delta MAP, mmHg (SD) 52.2 (28.2) 40.3 (23.3) <0.001

DWI Frequency by Race/Ethnicity
Overall p=0.005*
n=601
p=0.002
p=0.048
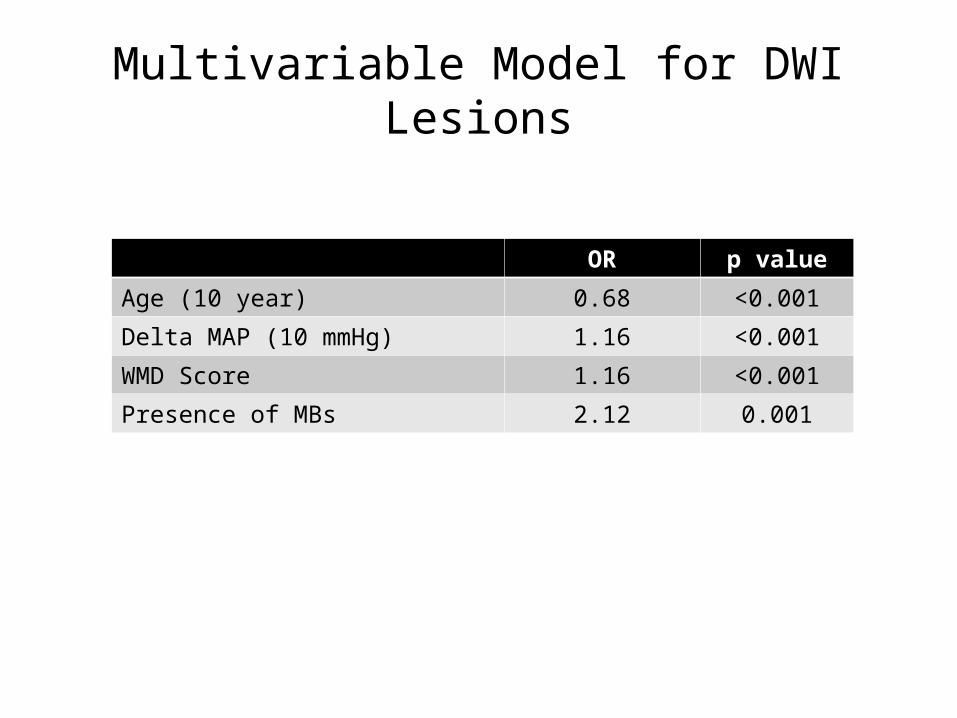
Multivariable Model for DWI Lesions
OR p value
Age (10 year) 0.68 <0.001
Delta MAP (10 mmHg) 1.16 <0.001
WMD Score 1.16 <0.001
Presence of MBs 2.12 0.001

Multivariable Model for Poor Outcome
OR p value
Age (10 year) 1.44 <0.0001
GCS (1 unit) 0.86 <0.0001
ICH Volume (cc) 1.35 <0.0001
Presence of IVH 2.10 0.002
DWI Lesion Presence 1.84 0.021
Poor Outcome = 6 month mRS 4-6

6 Month mRS
DWI +N=138
DWI -N=415
Patients (%)

Conclusions
• The ERICH study confirms that– Large fluctuations in blood pressure during the acute hospitalization period are
associated with DWI lesions – DWI lesions are associated with poor outcomes
• We hypothesize that – Substantial reductions in BP precipitate acute small vessel ischemia in those ICH
patients with a more severe underlying diseased vasculature– Or, alternatively, DWI lesions may be a biomarker of autoregulatory failure
• If DWI lesions are precipitated by BP fluctuations, further studies are needed to determine – Whether there is a level of acute blood pressure reduction at which the risks outweigh
the benefits– Whether there is a subgroup of patients at greater risk of ischemia (and potential harm)
from acute antihypertensive treatment

Genome Wide Association Studies
• Cincinnati based study• MGH – Multi-center study

SNP Quality
• 868,157 autosomal markers• 241,009 SNPs dropped:
– 38,710 SNPs with call rate < 95%– 174,189 SNPs with MAF < 0.05 (see class R1 for exception)– 16,321 SNPS with significant differential missingness
between cases and controls– 9,172 SNPs with significant departures from Hardy-
Weinberg Equilibrium– 2,615 SNPs whose MAF for controls fell outside of a 99.9%
confidence interval of the Hapmap CEU MAF– 2 duplicate SNPs
• 627,148 SNPs used in analysis

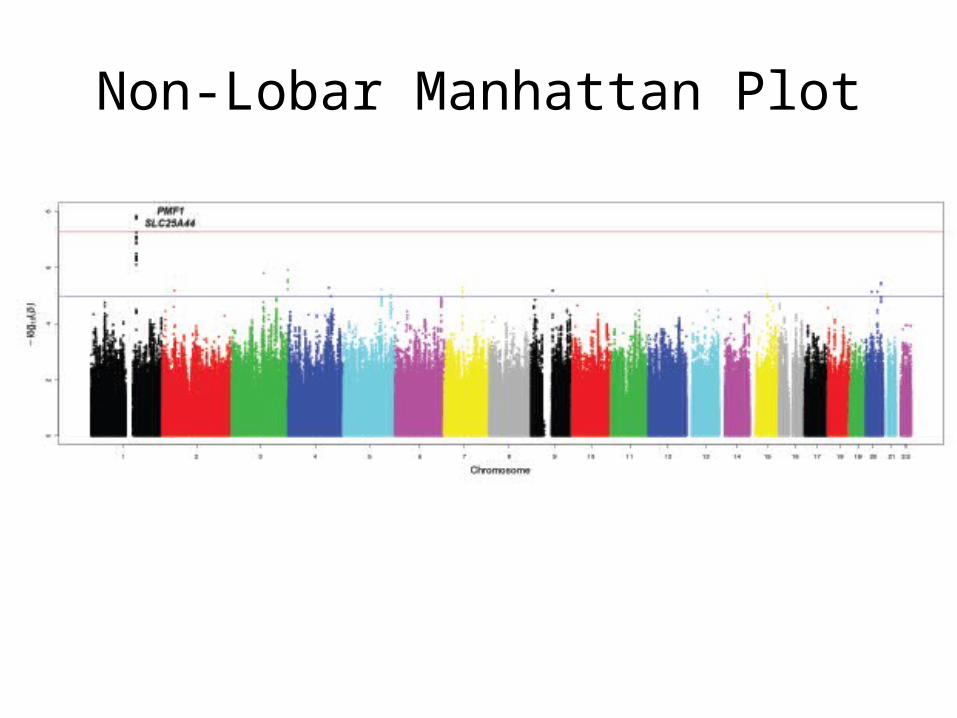
Non-Lobar Manhattan Plot
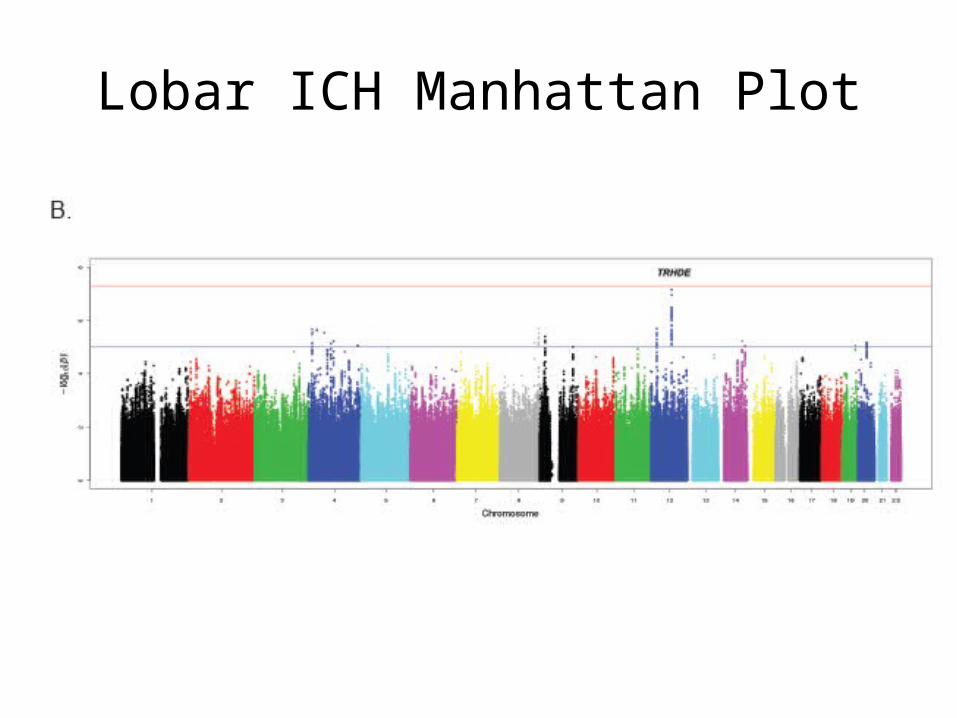
Lobar ICH Manhattan Plot


Overlap with Leukoaraiosis
• CHARGE Consortium– Framingham– Atherosclerosis Risk in Communities Study– Age, Gene, Environment, Susceptibility Study– Rotterdam Study– Cardiovascular Health Study
• Multi-ethnic Study of Atherosclerosis (MESA)• Jackson Heart Study

• CHARGE consortium analysis identifies the identical SNPs and region for association with white matter hyperintensity
• Genome wide significant – ISC 2014

• The hit has had reported replications now in:– Leukoariaosis – CHARGE consortium– Leukoariaosis – Lothian birth cohort– Microbleeds – CHARGE consortium– Deep ICH – RACE study (Pakistani ICH study)
96

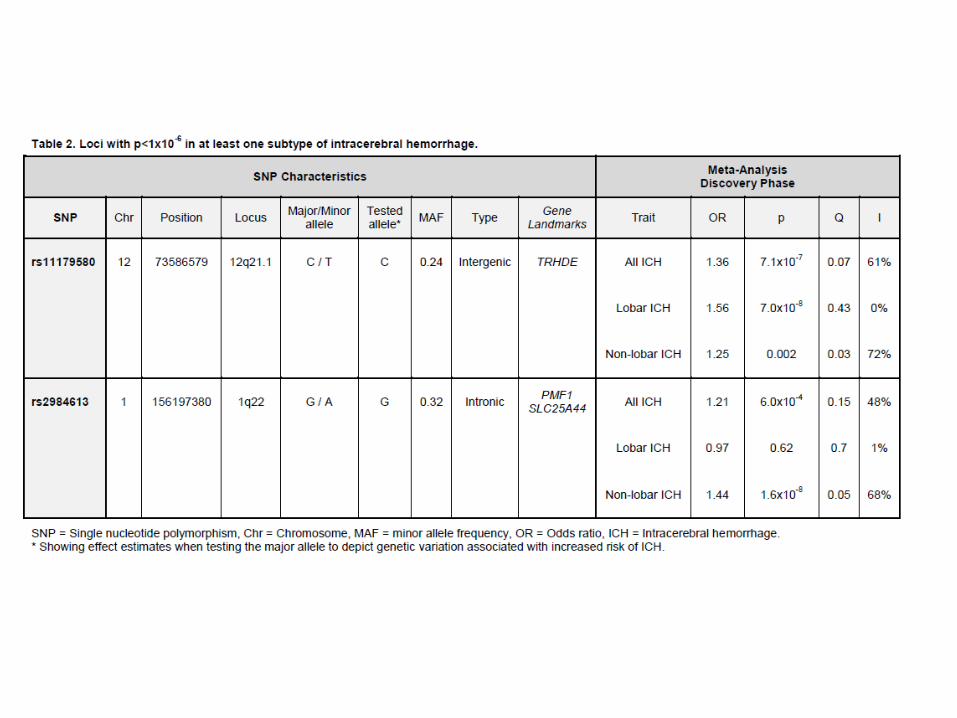
To summarize
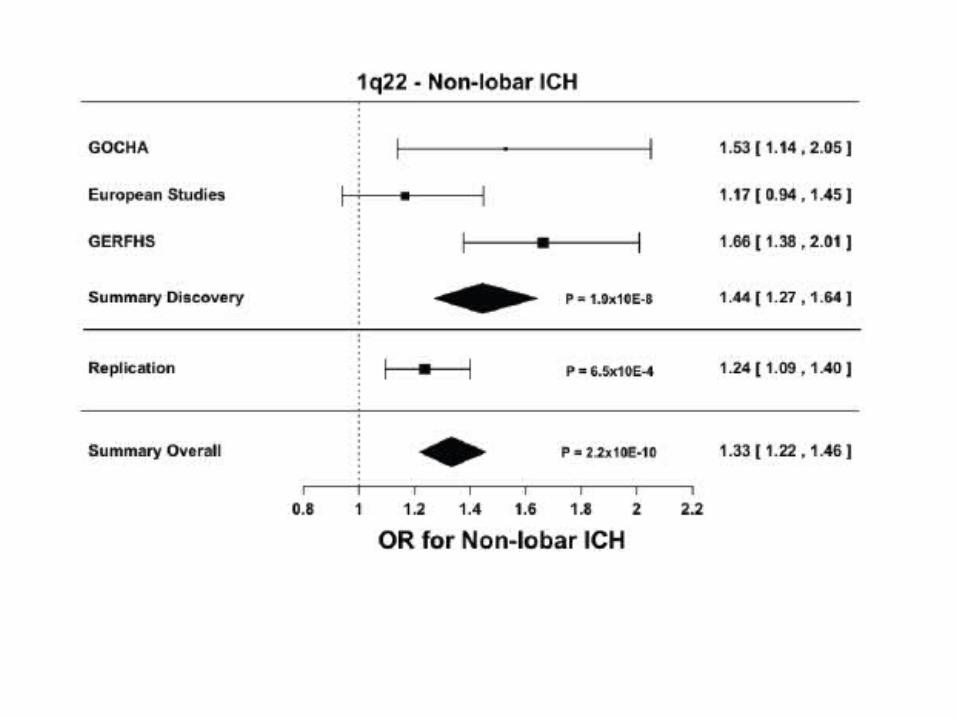
• Genome wide significant association for non-lobar ICH
• Identified in a discovery set of 5 different cohorts• Replicated in a 19 center multi-ethnic study of ICH• Identical location to a genome wide significant
association for leukoaraiosis• Greatest risk in AA populations and white
populations, not seen in Hispanic• Replicates in Asian populations
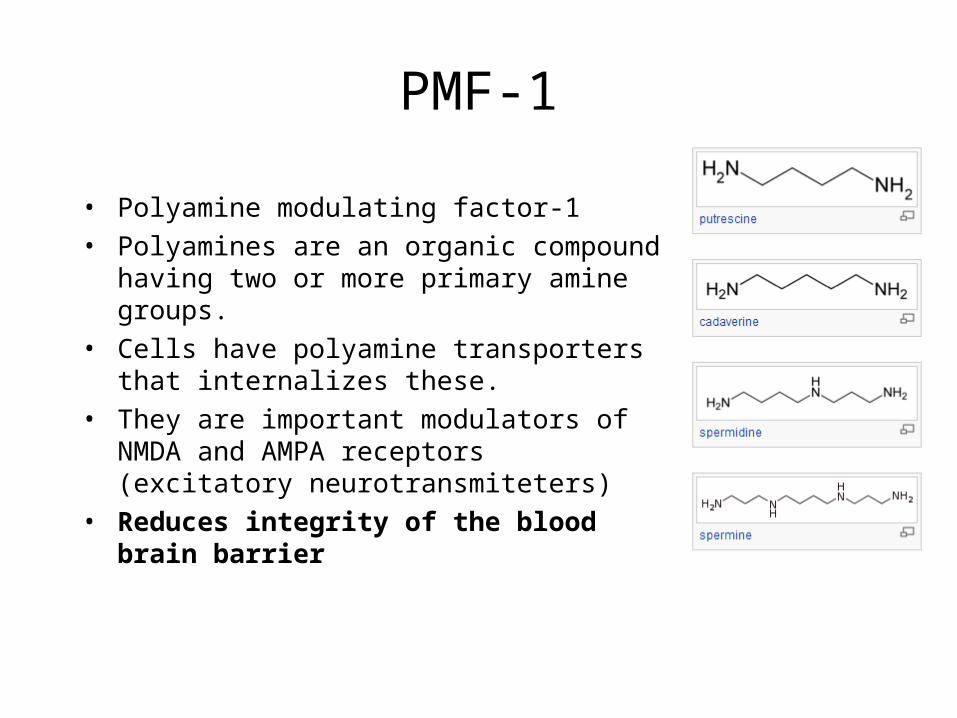
PMF-1
• Polyamine modulating factor-1• Polyamines are an organic compound having
two or more primary amine groups.• Cells have polyamine transporters that
internalizes these.• They are important modulators of NMDA and
AMPA receptors (excitatory neurotransmiteters)
• Reduces integrity of the blood brain barrier

Final Thoughts
• Importance of understanding risk by location of ICH
• Social factors explain a portion of greater risk among Hispanics
• Prevalence of hypertension and hypercholesterolemia may explain part of disparities among AA and Hispanics
• A significant proportion of attributable risk remains unexplained
99

Thank you!
100