Embed Size (px)
Citation preview

D3 in JSON
V. Batagelj
JSON
JSONskestoritve
JSON inPython
JSON in R
JSON, D3.jsin prikaziomrezij
Prikazovalnik
Viri
Prikazi omrezij z D3.js in JSON
Vladimir Batagelj
IMFM Ljubljana in IAM UP Koper
PON racunalniski seminarKoper, 18. januar 2016
V. Batagelj D3 in JSON

D3 in JSON
V. Batagelj
JSON
JSONskestoritve
JSON inPython
JSON in R
JSON, D3.jsin prikaziomrezij
Prikazovalnik
Viri
Kazalo
1 JSON2 JSONske storitve3 JSON in Python4 JSON in R5 JSON, D3.js in prikazi omrezij6 Prikazovalnik7 Viri
Vladimir Batagelj: [email protected]
Zadnja razlicica teh prosojnic (18. januar 2016 ob 11 : 31):http://vladowiki.fmf.uni-lj.si/doku.php?id=vis
V. Batagelj D3 in JSON

D3 in JSON
V. Batagelj
JSON
JSONskestoritve
JSON inPython
JSON in R
JSON, D3.jsin prikaziomrezij
Prikazovalnik
Viri
JSON, D3.js in prikazi omrezij
Stvari sem se lotil, ker v Pythonu nisemnasel dobre knjiznice za prikaz omrezij.Knjiznica matplotlib, ki jo uporablja Ne-tworkX, je usmerjena v prikaze stati-sticnih podatkov.Obstaja pa izvrstna knjiznica D3.js za pri-kaze podatkov na spletu v obliki SVG.Vecina podatkov je za prikaz pripravljenav obliki JSON. Obstaja vec zgledov upo-rabe pri prikazih grafov in omrezij.
Zamisel je naslednja
omrezje → JSON → SVG → { PDF, PNG, EPS }
z orodji: Python, pregledovalnik (JS) in Inkscape.
V. Batagelj D3 in JSON

D3 in JSON
V. Batagelj
JSON
JSONskestoritve
JSON inPython
JSON in R
JSON, D3.jsin prikaziomrezij
Prikazovalnik
Viri
Cilji
• cilj 1: ponuditi uporabnikom JSONsko obliko zapisa, kiomogoca razmeroma preprosto izmenjavo omreznihpodatkov med razlicnimi programi. Razviti programskoopremo za pripravo in vzdrzevanje omreznih podatkov.
• cilj 2: ponuditi obliko zapisa, ki omogoca tudi opiseprikazov omrezij.
• cilj 3: ponuditi uporabnikom (programerjem postopkovanalize omrezij) enostaven, a obenem zmogljiv prikazniizhod z moznostjo prikaza na spletu in tiskani obliki. NadD3.js razviti zbirko razlicnih prikazov omrezij (krozni,koordinatni, matricni, vzmetni, itd.), ki delujejo nadustvarjenimi opisi.
V. Batagelj D3 in JSON

D3 in JSON
V. Batagelj
JSON
JSONskestoritve
JSON inPython
JSON in R
JSON, D3.jsin prikaziomrezij
Prikazovalnik
Viri
JSON
JSON (JavaScript Object Notation) je oblika zapisa (format)podatkov na znakovni datoteki, ki ohranja zgradbo podatkov.
Zacetno razlicico oblike JSON je razvil Douglas Crockford (okrog2002). Naslonil se je na zapis podatkov v programskem jezikuJavascript. Osnovna zamisel je bila: ce uporabimo nad nizom znakovz opisom podatkov Javascriptovo funkcijo eval, dobimo ustreznipodatkovni objekt. JSON je jezikovno neodvisen, odprtokodnistandard za izmenjavo podatkov med programi.
Za JSON obstajata dva standarda:
• The JSON Data Interchange Format. Standard ECMA-404,oktober 2013.
• The JavaScript Object Notation (JSON) Data InterchangeFormat Request for Comments: 7159, marec 2014.
V. Batagelj D3 in JSON

D3 in JSON
V. Batagelj
JSON
JSONskestoritve
JSON inPython
JSON in R
JSON, D3.jsin prikaziomrezij
Prikazovalnik
Viri
JSON
{"firstName": "John","lastName": "Smith","isAlive": true,"age": 25,"address": {"streetAddress": "21 2nd Street","city": "New York","state": "NY","postalCode": "10021-3100"
},"phoneNumbers": [{
"type": "home","number": "212 555-1234"
},{
"type": "office","number": "646 555-4567"
}],"children": [],"spouse": null
} Wikipedia
V. Batagelj D3 in JSON

D3 in JSON
V. Batagelj
JSON
JSONskestoritve
JSON inPython
JSON in R
JSON, D3.jsin prikaziomrezij
Prikazovalnik
Viri
XML api – JSON api
Google trends
V. Batagelj D3 in JSON

D3 in JSON
V. Batagelj
JSON
JSONskestoritve
JSON inPython
JSON in R
JSON, D3.jsin prikaziomrezij
Prikazovalnik
Viri
JSON
XML je ustreznejsi za opis zgradbe besedil, JSON prevzema mestopri opisu zgradbe podatkov. JSON ima enostavnejso slovnico, jepreglednejsi in usklajen s podatkovnimi strukturami v sodobnihprogramskih jezikih (seznami in slovarji).
Vsi kljuci (imena) so v dvojnih narekovajih.
Datoteke JSON temeljijo na kodi Unicode (privzeto UTF-8).
Zvrst MIME za datoteke JSON je application/json, priporocenipodaljsek pa .json.
Za uporabo datotek JSON obstaja programska podpora za vecinopomembnejsih programskih jezikov http://www.json.org/.
V. Batagelj D3 in JSON

D3 in JSON
V. Batagelj
JSON
JSONskestoritve
JSON inPython
JSON in R
JSON, D3.jsin prikaziomrezij
Prikazovalnik
Viri
Slovnica oblike zapisa JSON
V. Batagelj D3 in JSON
D3 in JSON
V. Batagelj
JSON
JSONskestoritve
JSON inPython
JSON in R
JSON, D3.jsin prikaziomrezij
Prikazovalnik
Viri
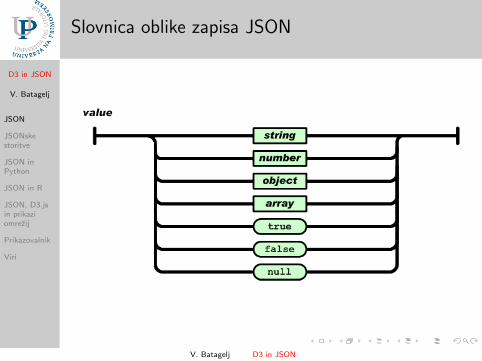
Slovnica oblike zapisa JSON
V. Batagelj D3 in JSON
D3 in JSON
V. Batagelj
JSON
JSONskestoritve
JSON inPython
JSON in R
JSON, D3.jsin prikaziomrezij
Prikazovalnik
Viri
Slovnica oblike zapisa JSON
V. Batagelj D3 in JSON

D3 in JSON
V. Batagelj
JSON
JSONskestoritve
JSON inPython
JSON in R
JSON, D3.jsin prikaziomrezij
Prikazovalnik
Viri
Slovnica oblike zapisa JSON
V. Batagelj D3 in JSON

D3 in JSON
V. Batagelj
JSON
JSONskestoritve
JSON inPython
JSON in R
JSON, D3.jsin prikaziomrezij
Prikazovalnik
Viri
Slovnica oblike zapisa JSON
V. Batagelj D3 in JSON

D3 in JSON
V. Batagelj
JSON
JSONskestoritve
JSON inPython
JSON in R
JSON, D3.jsin prikaziomrezij
Prikazovalnik
Viri
eval in JSON.parse
<html><head><title>JSON: eval in parse</title></head><body><script>var data=’["abc",{"a":[true, null,3.14],"b":"BBBBB","c":12e+5}]’alert("JSON: " + data);document.write("JSON:<tt>"+data+"</tt><br>");var value = eval(’(’ + data + ’)’);console.log("eval:"); console.log(value);document.write("eval:<tt>"+JSON.stringify(value)+"</tt><br>");var json = JSON.parse(data);console.log("JSON.parse:"); console.log(json);</script></body></html>
eval.html. Za izvedbo programa sem uporabil pregledovalnik GoogleChrome. Do konzole pridemo z izbiroCustomize and Control GC / More tools / Developer tools
V. Batagelj D3 in JSON

D3 in JSON
V. Batagelj
JSON
JSONskestoritve
JSON inPython
JSON in R
JSON, D3.jsin prikaziomrezij
Prikazovalnik
Viri
eval in JSON.parse
V. Batagelj D3 in JSON

D3 in JSON
V. Batagelj
JSON
JSONskestoritve
JSON inPython
JSON in R
JSON, D3.jsin prikaziomrezij
Prikazovalnik
Viri
eval in JSON.parse
<html><head><title>JSON import</title><script src="./person.js"></script></head><body><script>document.write("JSON:<tt>"+person+"</tt><br>");document.write("string:<tt>"+JSON.stringify(person)+"</tt><br>");console.log("JSON:"); console.log(person);</script></body></html>
person.js. import.html.
V. Batagelj D3 in JSON
D3 in JSON
V. Batagelj
JSON
JSONskestoritve
JSON inPython
JSON in R
JSON, D3.jsin prikaziomrezij
Prikazovalnik
Viri
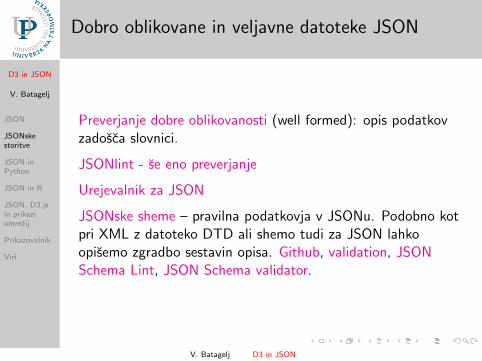
Dobro oblikovane in veljavne datoteke JSON
Preverjanje dobre oblikovanosti (well formed): opis podatkovzadosca slovnici.
JSONlint - se eno preverjanje
Urejevalnik za JSON
JSONske sheme – pravilna podatkovja v JSONu. Podobno kotpri XML z datoteko DTD ali shemo tudi za JSON lahkoopisemo zgradbo sestavin opisa. Github, validation, JSONSchema Lint, JSON Schema validator.
V. Batagelj D3 in JSON
D3 in JSON
V. Batagelj
JSON
JSONskestoritve
JSON inPython
JSON in R
JSON, D3.jsin prikaziomrezij
Prikazovalnik
Viri
Dvojiske datoteke in JSON
JSON-Base64
Universal Binary JSON Specification
BSON
V. Batagelj D3 in JSON

D3 in JSON
V. Batagelj
JSON
JSONskestoritve
JSON inPython
JSON in R
JSON, D3.jsin prikaziomrezij
Prikazovalnik
Viri
Storitve, ki uporabljajo JSON
• Open Weather Map
• Fetching JSON data from REST APIs
• 26 Weather APIs, 12 support JSON
• individual apis.json
• OECD Data API Documentation
• Using JSON in the Google Data Protocol
• REST API – The foundation of all digital integrations withLinkedIn
• Pulling JSON data from a public data API
V. Batagelj D3 in JSON
D3 in JSON
V. Batagelj
JSON
JSONskestoritve
JSON inPython
JSON in R
JSON, D3.jsin prikaziomrezij
Prikazovalnik
Viri
Amazonovi podatki
Pred kratkim je Julian McAuley z UCSD ponudil na spletuobsezno zbirko podatkov Amazon product data. Podatkovjevsebuje mnenja in metapodatke o izdelkih z Amazona – 143.7milijonov mnenj iz obdobja maj 1996 – julij 2014.
Podatki so opisani v obliki JSON in nato poZIPani. Vspremljajocih navodilih so podani primeri, kako se obdelavepodatkov lotimo v Pythonu.
V. Batagelj D3 in JSON

D3 in JSON
V. Batagelj
JSON
JSONskestoritve
JSON inPython
JSON in R
JSON, D3.jsin prikaziomrezij
Prikazovalnik
Viri
JSON in R
{"nodes":[{"name":"Myriel","group":1},{"name":"Napoleon","group":1}, ...{"name":"Brujon","group":4},{"name":"Mme.Hucheloup","group":8}],"links":[{"source":1,"target":0,"value":1},{"source":2,"target":0,"value":8}, ...{"source":76,"target":48,"value":1},{"source":76,"target":58,"value":1}]}
Pretvorba Pajkovih datotek NET in CLU v JSON
setwd("C:/Users/Batagelj/test/python/2012/amazon")library(rjson)
net2json <- function(netF,cluF,jsonF){net <- file(netF,"r"); clu <- file(cluF,"r")b <- unlist(strsplit(readLines(net,n=1)," "))n <- as.integer(b[length(b)])N <- readLines(net,n=n); nam <- character(n)for(i in 1:n) nam[i] <- unlist(strsplit(N[i],’"’))[2]skip <- readLines(clu,n=1); C <- as.integer(readLines(clu,n=n))skip <- readLines(net,n=1); L <- readLines(net,n=-1)M <- matrix(as.integer(unlist(strsplit(sub(’^\\s+’,’’,L),’\\s+’))),ncol=3,byrow=TRUE)nods <- vector(’list’,n)for(i in 1:n) nods[[i]] <- list(name=nam[i],group=C[i])m <- nrow(M); lnks <- vector(’list’,m)for(i in 1:m) lnks[[i]] <- list(source=M[i,1]-1,target=M[i,2]-1,value=M[i,3])data <- list(nodes=nods,links=lnks)jstr <- toJSON(data)json <- file(jsonF,"w"); cat(jstr,file=json)close(json); close(net); close(clu)
}
net2json("islands.net","islands.clu","islands.json")
primer
V. Batagelj D3 in JSON

D3 in JSON
V. Batagelj
JSON
JSONskestoritve
JSON inPython
JSON in R
JSON, D3.jsin prikaziomrezij
Prikazovalnik
Viri
Enostaven primergraph.json
{"info":{"org":0,"nNodes":4},"nodes":[{"name":"Ann","x":0.2,"y":0.2,"Num":1,"Size":100},{"name":"Ben","x":0.2,"y":0.8,"Num":4,"Size":500},{"name":"Tim","x":0.8,"y":0.2,"Num":2,"Size":200},{"name":"Zoe","x":0.8,"y":0.8,"Num":3,"Size":400}
],"links":[{"source":0,"target":1,"Count":1,"Weight":100},{"source":1,"target":2,"Count":1,"Weight":100},{"source":2,"target":3,"Count":1,"Weight":100},{"source":1,"target":3,"Count":2,"Weight":300}
]}
V datoteki graph.js je JSONovski izraz prirejen spremenljivki graph:
graph = {"info":{"org":0,"nNodes":4},"nodes":[
...]
}V. Batagelj D3 in JSON

D3 in JSON
V. Batagelj
JSON
JSONskestoritve
JSON inPython
JSON in R
JSON, D3.jsin prikaziomrezij
Prikazovalnik
Viri
Krozni prikazprirejeno po Brath in Jonker, str. 257-258
<!DOCTYPE html><html><head><meta charset="utf-8"><script src="./graph.js"></script><!-- script src="./class.js"></script --><script src="http://d3js.org/d3.v3.min.js"></script></head><body><script>// set up the drawing areavar width = 500,
height = 500;var svg = d3.select("body").append("svg")
.attr("width", width)
.attr("height", height)
.attr("xmlns", "http://www.w3.org/2000/svg");// angle and radius for layout assistancevar ang = 2 * Math.PI / graph.nodes.length;var rad = width / 2.5;
V. Batagelj D3 in JSON
D3 in JSON
V. Batagelj
JSON
JSONskestoritve
JSON inPython
JSON in R
JSON, D3.jsin prikaziomrezij
Prikazovalnik
Viri
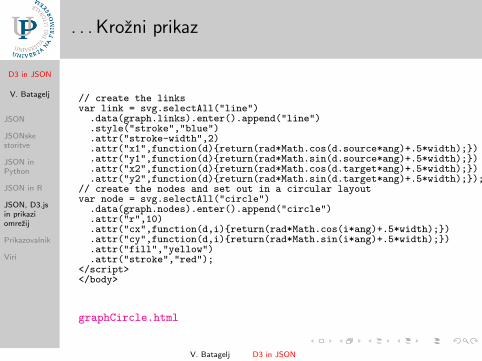
. . . Krozni prikaz
// create the linksvar link = svg.selectAll("line")
.data(graph.links).enter().append("line")
.style("stroke","blue")
.attr("stroke-width",2)
.attr("x1",function(d){return(rad*Math.cos(d.source*ang)+.5*width);})
.attr("y1",function(d){return(rad*Math.sin(d.source*ang)+.5*width);})
.attr("x2",function(d){return(rad*Math.cos(d.target*ang)+.5*width);})
.attr("y2",function(d){return(rad*Math.sin(d.target*ang)+.5*width);});// create the nodes and set out in a circular layoutvar node = svg.selectAll("circle")
.data(graph.nodes).enter().append("circle")
.attr("r",10)
.attr("cx",function(d,i){return(rad*Math.cos(i*ang)+.5*width);})
.attr("cy",function(d,i){return(rad*Math.sin(i*ang)+.5*width);})
.attr("fill","yellow")
.attr("stroke","red");</script></body>
graphCircle.html
V. Batagelj D3 in JSON

D3 in JSON
V. Batagelj
JSON
JSONskestoritve
JSON inPython
JSON in R
JSON, D3.jsin prikaziomrezij
Prikazovalnik
Viri
SVG
<?xml version="1.0" encoding="UTF-8" standalone="yes"?><svg width="500" height="500" xmlns="http://www.w3.org/2000/svg"><line stroke-width="2" x1="450" y1="250" x2="250" y2="450" style="stroke: blue;"></line><line stroke-width="2" x1="250" y1="450" x2="50" y2="250" style="stroke: blue;"></line><line stroke-width="2" x1="50" y1="250" x2="250" y2="50" style="stroke: blue;"></line><line stroke-width="2" x1="250" y1="450" x2="250" y2="50" style="stroke: blue;"></line><circle r="10" cx="450" cy="250" fill="yellow" stroke="red"></circle><circle r="10" cx="250" cy="450" fill="yellow" stroke="red"></circle><circle r="10" cx="50" cy="250" fill="yellow" stroke="red"></circle><circle r="10" cx="250" cy="50" fill="yellow" stroke="red"></circle></svg>
V. Batagelj D3 in JSON

D3 in JSON
V. Batagelj
JSON
JSONskestoritve
JSON inPython
JSON in R
JSON, D3.jsin prikaziomrezij
Prikazovalnik
Viri
Opis omrezij v obliki JSONclass.json
{ "network": "class","info":{ "org": 1, "nNodes": 15, "nArcs" : 30, "nEdges": 13,
"nWeak" : 1,"title" : "borrowing study materials","meta" : { "date": "October 2015", "author": "V. Batagelj" }
},"nodes": [
{ "id": 1, "short": "m02", "x": 0.1857, "y": 0.2781, "size": 1 },{ "id": 2, "short": "m03", "x": 0.5482, "y": 0.6169, "size": 1 },{ "id": 3, "short": "w07", "x": 0.2219, "y": 0.4526, "size": 2 },{ "id": 4, "short": "w09", "x": 0.8078, "y": 0.3223, "size": 2 },
...{ "id": 14, "short": "m89", "x": 0.4000, "y": 0.8469, "size": 1 },{ "id": 15, "short": "m96", "x": 0.3482, "y": 0.1778, "size": 1 }
],"links": [
{ "type": "arc", "source": 6, "target": 15, "weight": 1 },{ "type": "arc", "source": 2, "target": 7, "weight": 1 },
...{ "type": "arc", "source":15, "target": 3, "weight": 1 },{ "type": "edge", "source": 6, "target": 12, "weight": 1 },
...{ "type": "edge", "source": 4, "target": 12, "weight": 1 },{ "type": "edge", "source": 6, "target": 13, "weight": 1 }
]}
V. Batagelj D3 in JSON

D3 in JSON
V. Batagelj
JSON
JSONskestoritve
JSON inPython
JSON in R
JSON, D3.jsin prikaziomrezij
Prikazovalnik
Viri
Branje podatkov z datotek JSON
<!DOCTYPE html><head><meta charset="utf-8"><script src="http://d3js.org/d3.v3.min.js"></script></head><body><input type=’file’ accept=’application/json’ onchange=’openFile(event)’><script>function process(graph) {// set up the drawing areavar width = 500,
height = 500; s = graph.info.org;var svg = d3.select("body").append("svg")
.attr("width", width)
.attr("height", height)
.attr("xmlns", "http://www.w3.org/2000/svg");// draw the linksvar link = svg.selectAll("line")
.data(graph.links).enter().append("line")
.style("stroke", function(d,i) {return((d.type=="arc" ? "magenta" : "blue"))})
.attr("stroke-width", 2)
.attr("x1", function(d) {return(graph.nodes[d.source-s].x*width);})
.attr("y1", function(d) {return(graph.nodes[d.source-s].y*height);})
.attr("x2", function(d) {return(graph.nodes[d.target-s].x*width);})
.attr("y2", function(d) {return(graph.nodes[d.target-s].y*height);});// draw the nodesvar node = svg.selectAll("circle")
.data(graph.nodes).enter().append("circle")
.attr("r", 15)
.attr("cx", function(d,i) {return(d.x*width);})
.attr("cy", function(d,i) {return(d.y*height);})
.attr("fill", "yellow")
.attr("stroke", "red");}
V. Batagelj D3 in JSON
D3 in JSON
V. Batagelj
JSON
JSONskestoritve
JSON inPython
JSON in R
JSON, D3.jsin prikaziomrezij
Prikazovalnik
Viri
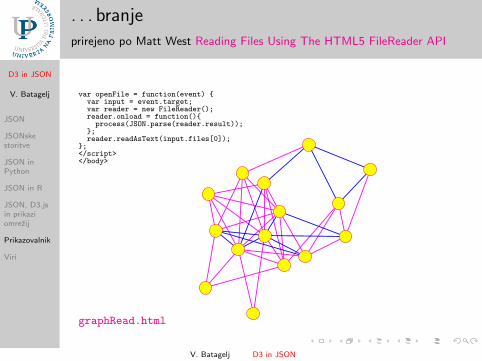
. . . branjeprirejeno po Matt West Reading Files Using The HTML5 FileReader API
var openFile = function(event) {var input = event.target;var reader = new FileReader();reader.onload = function(){
process(JSON.parse(reader.result));};reader.readAsText(input.files[0]);
};</script></body>
graphRead.html
V. Batagelj D3 in JSON

D3 in JSON
V. Batagelj
JSON
JSONskestoritve
JSON inPython
JSON in R
JSON, D3.jsin prikaziomrezij
Prikazovalnik
Viri
Nalaganje datoteke JSON s streznikaprirejeno po Ying Kit Yuen jQuery & Javascript -– Read JSON files on server
<!DOCTYPE html><head><meta charset="utf-8"><title>Load JSON file from server</title><!-- http://eureka.ykyuen.info/2013/09/25/jquery-javascript-read-json-files-on-server/ --><script src="http://ajax.googleapis.com/ajax/libs/jquery/1.10.2/jquery.min.js"></script><script src="http://d3js.org/d3.v3.min.js"></script></head><body><select id="data">
<option value="graph.json">graph.json</option><option value="class.json">class.json</option>
</select><button id="btn">Read</button><script>function process(graph) {// set up the drawing area
... telo funkcije process je enako kot pri branju datotek JSON
.attr("stroke", "red");}
$("#btn").click(function(){$.getJSON($("#data").val(), function(json) {process(json);});
});</script></body>
graphLoad.html
V. Batagelj D3 in JSON

D3 in JSON
V. Batagelj
JSON
JSONskestoritve
JSON inPython
JSON in R
JSON, D3.jsin prikaziomrezij
Prikazovalnik
Viri
Zametek prikazovalnika graphXY
graphXY.html
V. Batagelj D3 in JSON
D3 in JSON
V. Batagelj
JSON
JSONskestoritve
JSON inPython
JSON in R
JSON, D3.jsin prikaziomrezij
Prikazovalnik
Viri
References I
Anthony Bargnesi, Anselmo DiFabio, William Hayes: JSON Graph.GitHub
Vladimir Batagelj: Complex Networks, Visualization of. R.A. Meyers,ed., Encyclopedia of Complexity and Systems Science, Springer 2009:1253-1268.
Vladimir Batagelj, Andrej Mrvar: Pajek manual.
Jernej Bodlaj: Network Data File Formats. in Reda Alhajj, Jon Rokne(eds.): Encyclopedia of Social Network Analysis and Mining. Springer,New York, 2014, p. 1076-1091.
Richard Brath, David Jonker: Graph Analysis and Visualization:Discovering Business Opportunity in Linked Data. John Wiley & Sons,Indianapolis, Indiana, 2015.
Emden Gansner, Eleftherios Koutsofios, Stephen North: Drawinggraphs with dot, January 26, 2006
V. Batagelj D3 in JSON
D3 in JSON
V. Batagelj
JSON
JSONskestoritve
JSON inPython
JSON in R
JSON, D3.jsin prikaziomrezij
Prikazovalnik
Viri
References II
Michael Himsolt: GML: A portable Graph File Format. report
Wouter De Nooy, Andrej Mrvar, Vladimir Batagelj: Exploratory SocialNetwork Analysis with Pajek; Revised and Expanded Second Edition.Structural Analysis in the Social Sciences, Cambridge UniversityPress, September 2011.
Matthew Roughan, Jonathan Tuke: Unravelling Graph-Exchange FileFormats. arXiv:1503.02781, submitted on 10 Mar 2015.
Wikipedia: JSON
Leland Wilkinson: The Grammar of Graphics. Springer-Verlag, NewYork, 2005.
V. Batagelj D3 in JSON