Embed Size (px)
Citation preview

25/02/2021
1
Portfolio Management
Risk & Return
• Return
• Income received on an investment (Dividend) plus any
change in market price( Capital gain), usually expressed
as a percent of the beginning market price of the
investment
Dt + (Pt-1 - Pt )
Pt
R =
1
2

25/02/2021
2
• Kamal has purchased shares of A Ltd for Rs. 10 per
share 1 year ago. The stock is currently trading at
Rs.9.50 per share and he just received a Rs1 dividend.
What return was earned over the past year?
Average Rate of Return
3
4

25/02/2021
3
Expected Return
• Expected Rate of Return given a probability distribution of possible returns (ri): E(r)
n
E(R) = S Pi Rii=1
Expected Return
◼ Normal 40% Return 20% = .08
◼ Bad 30% Return 5% = .015
◼ Good 30% Return 35% = .105
=Expected ave return = 20%
5
6

25/02/2021
4
Risk
– Uncertainty - the possibility that the actual
return may differ from the expected return
– Probability - the chance of something
occurring
– Expected Returns - the sum of possible
returns times the probability of each return
Measurement of Risk
• Studies of stock returns indicate they are approximatelynormally distributed. Two statistics describe a normaldistribution, the mean and the standard deviation (which is thesquare root of the variance). The standard deviation shows howspread out is the distribution.
• relevant risk measure is the total risk of expected cash flowsmeasured by standard deviation ()
.
7
8

25/02/2021
5
Standard Deviation
Standard Deviation is a statistical measure of the variability
of a distribution around its mean. It is the square root of
variance
Variance (2) - the expected value of squared deviations
from the mean
Standard deviation is the square root of the variance
=
=n
i 1
i
2
ii
2 P)]E(R-R[)( Variance
i.e• Kamal has invested in A Ltd shares & forecasted
expected returns under different economic conditions are
as follows.
• Depression -20%
• Recession 10%
• Normal 30%
• Boom 50%
• Determine the variance & risk of the security
9
10

25/02/2021
6
Example 2
• Suppose Kamal have predicted the following returns for stocks A and B in three possible states of nature. What are the expected returns?
– State Probability A B
– Boom 0.3 0.15 0.25
– Normal 0.5 0.10 0.20
– Recession 0.2 0.02 0.01
• RA = .3(.15) + .5(.10) + .2(.02) = .099 = 9.99%
• RB = .3(.25) + .5(.20) + .2(.01) = .177 = 17.7%
• Consider the previous example. What are the variance and standard deviation for each stock?
• Stock A
– 2 = .3(.15-.099)2 + .5(.1-.099)2 + .2(.02-.099)2 = .002029
– = .045
• Stock B
– 2 = .3(.25-.177)2 + .5(.2-.177)2 + .2(.01-.177)2 = .007441
– = .0863
11
12

25/02/2021
7
Trade off between risk & return
• When comparing securities, the one with the largest
standard deviation is the riskier
• If returns and standard deviations between two securities
are different, the investor must make a decision between
the tradeoff of the expected return and the standard
deviation of each
Portfolio Theory
• Asset may seem very risky in isolation, but whencombined with other assets, risk of portfolio may besubstantially less—even zero
• When combining different securities, it is important tounderstand how outcomes are related to each other
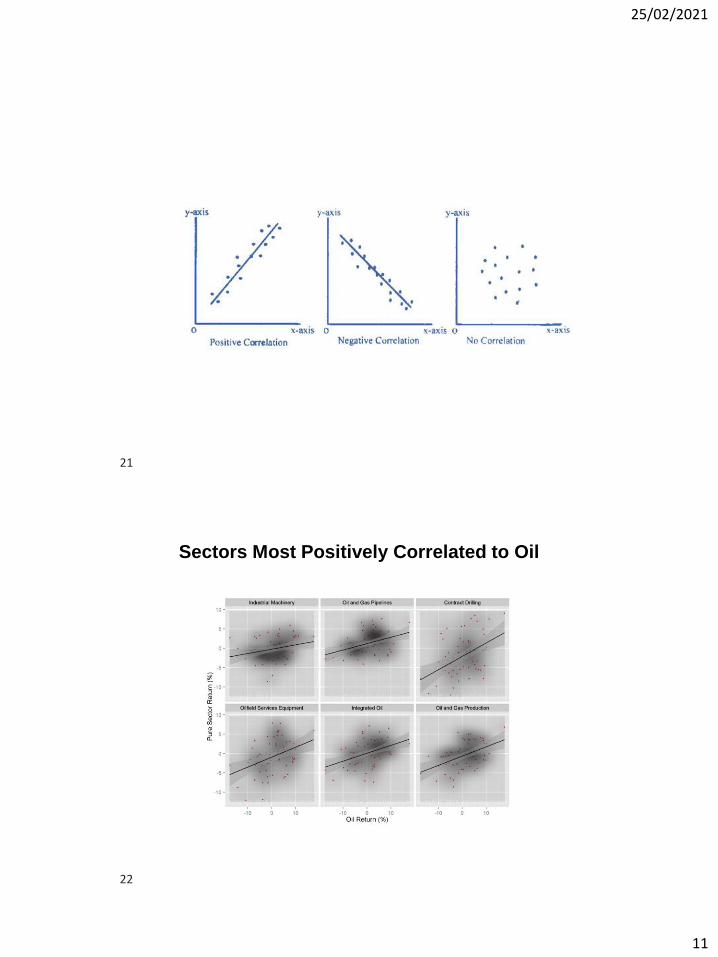
– Returns of two or more securities are positivelycorrelated indicating they move in same direction
– Returns of two or more securities are negativelycorrelated-move in opposite directions
– Combining a securities would greatly reduce the riskof the portfolio
13
14

25/02/2021
8
• A portfolio is a collection of assets
• An asset’s risk and return is important in how it affects
the risk and return of the portfolio
• The risk-return trade-off for a portfolio is measured by
the portfolio expected return and standard deviation, just
as with individual assets
Portfolios
Covariance & Correlation
• Variance & Standard deviation measures the variability
of individual stock.
• Covariance & Correlation is determine how two variables
are related with each other
• Covariance of Returns measure of the degree to which
two variables “move together” relative to their individual
mean values over time
15
16

25/02/2021
9
Covariance
• Covariance indicates how two variables are related. A positive
covariance means the variables are positively related, while a negative
covariance means the variables are inversely related. The formula for
calculating covariance of sample data is shown below.
• I.e Kamal has invested in A Ltd shares & B ltd shares
forecasted expected returns under different economic
conditions are as follows.
A B
• Depression -20% 5%
• Recession 10% 20%
• Normal 30% -12%
• Boom 50% 9%
Determine the covariance between securities of A & B
17
18

25/02/2021
10
Correlation coefficient
Correlation is another way to determine how two variables are related. In
addition to telling you whether variables are positively or inversely
related, correlation also tells you the degree to which the variables tend
to move together.
The correlation coefficient is obtained by standardizing (dividing) the
covariance by the product of the individual standard deviations
Correlation coefficient varies from -1 to +1
jt
iti
ij
R ofdeviation standard the
R ofdeviation standard the
returns oft coefficienn correlatio ther
:where
Covr
=
=
=
=
j
ji
ij
ij
• This means that returns for the two assets move together in a completely linearmanner. A value of –1 would indicate perfect correlation. This means that thereturns for two assets have the same percentage movement, but in oppositedirections
• If the correlation coefficient is one, the variables have a perfect positivecorrelation. This means that if one variable moves a given amount, the secondmoves proportionally in the same direction. A positive correlation coefficient lessthan one indicates a less than perfect positive correlation, with the strength of thecorrelation growing as the number approaches one.
• If correlation coefficient is zero, no relationship exists between the variables. Ifone variable moves, you can make no predictions about the movement of theother variable; they are uncorrelated.
• If correlation coefficient is –1, the variables are perfectly negatively correlated (orinversely correlated) and move in opposition to each other. If one variableincreases, the other variable decreases proportionally. A negative correlationcoefficient greater than –1 indicates a less than perfect negative correlation, withthe strength of the correlation growing as the number approaches –1.
19
20
25/02/2021
11
Sectors Most Positively Correlated to Oil
21
22

25/02/2021
12
Sector Oil Correlation p-value
Industrial Machinery 0.29 0.0117
Oil and Gas Pipelines 0.31 0.0075
Contract Drilling 0.37 0.0018
Oilfield Services Equipment 0.38 0.0016
Integrated Oil 0.41 0.0006
Oil and Gas Production 0.43 0.0003
Sectors Most Negatively Correlated to Oil
23
24

25/02/2021
13
Sector Oil Correlation p-value
Real Estate Investment Trusts -0.43 0.0003
Airlines -0.36 0.0021
Aerospace and Defense -0.34 0.0044
Multi Line Insurance -0.33 0.0053
Hotels Resorts Cruiselines -0.32 0.0067
Casinos Gaming -0.28 0.0142
Expected Returns of Portfolio
• The expected return of a portfolio is theweighted average of the expected returns foreach asset in the portfolio
• You can also find the expected return by findingthe portfolio return in each possible state andcomputing the expected value as we did withindividual securities
25
26

25/02/2021
14
• i.e
• Kamal has invested his wealth 60% of security
A & 40% in security B. Expected return from
Security A is 20% & from Security B is 10%
• Determine the portfolio return
Variance & Standard Deviation of portfolio
ji
ijij
ij
2
i
i
port
n
1i
n
1i
ijj
n
1i
i
2
i
2
iport
rCov where
j, and i assetsfor return of rates ebetween th covariance theCov
iasset for return of rates of variancethe
portfolio in the valueof proportion by the determined are weights
whereportfolio, in the assets individual theof weightstheW
portfolio theofdeviation standard the
:where
Covwww
=
=
=
=
=
+= = = =
27
28
25/02/2021
15
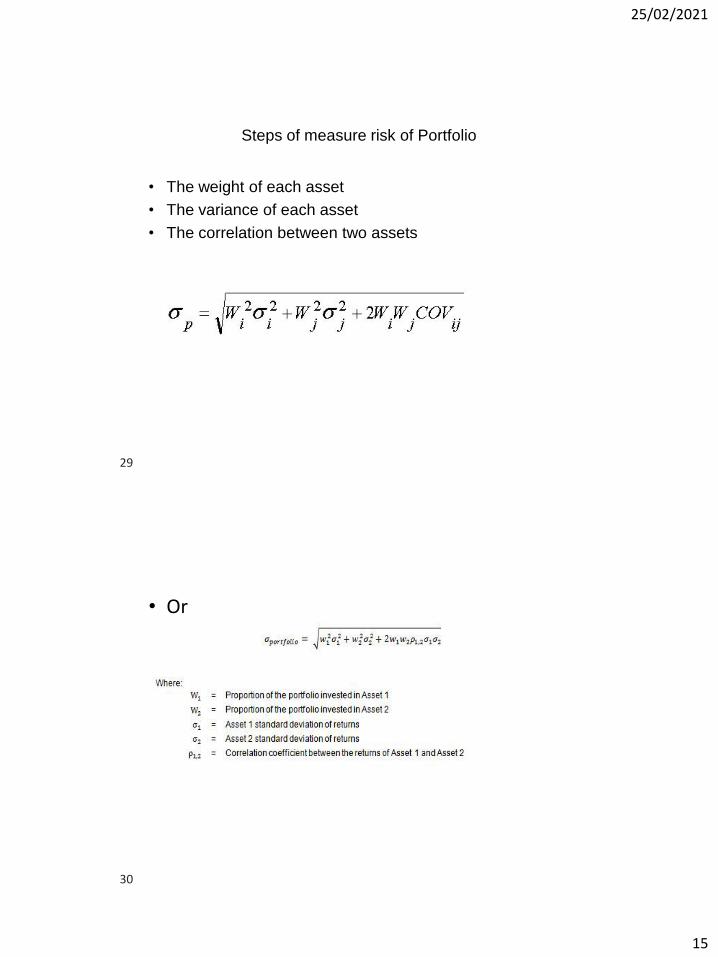
Steps of measure risk of Portfolio
• The weight of each asset
• The variance of each asset
• The correlation between two assets
• Or
29
30

25/02/2021
16
Example 1
Investment 100,000 150,000
Expected Return 10% 15%
Standard Deviation 20% 25%
Correlation coefficient 0.3
• Any asset of a portfolio may be described by two
characteristics:
– The expected rate of return
– The expected standard deviations of returns
• The correlation, measured by covariance, affects the
portfolio standard deviation
• Low correlation reduces portfolio risk while not affecting
the expected return
31
32

25/02/2021
17
• I.e Kamal has invested 60% of wealth in A Ltd shares &
other 40% wealth B ltd shares forecasted expected
returns under different economic conditions are as
follows.
A B
• Depression -20% 5%
• Recession 10% 20%
• Normal 30% -12%
• Boom 50% 9%
Determine the return from the portfolio & standard deviation of the
portfolio
Portfolio Risk-Return Plots for Different
Weights
-
0.05
0.10
0.15
0.20
0.00 0.01 0.02 0.03 0.04 0.05 0.06 0.07 0.08 0.09 0.10 0.11 0.12
Standard Deviation of Return
E(R)
Rij = 0.00
Rij = +1.00
f
gh
ij
k1
2With uncorrelated
assets it is possible
to create a two asset
portfolio with lower
risk than either single
asset
33
34

25/02/2021
18
The Efficient Frontier
• The efficient frontier represents that set of portfolios with
the maximum rate of return for every given level of risk,
or the minimum risk for every level of return
• Frontier will be portfolios of investments rather than
individual securities
– Exceptions being the asset with the highest return and the asset
with the lowest risk
Efficient Frontier for Alternative Portfolios
Efficient Frontier
A
B
C
E(R)
Standard Deviation of Return
35
36

25/02/2021
19
37
Efficient Markets
• Efficient markets are a result of investors trading on the
unexpected portion of announcements
• The easier it is to trade on surprises, the more efficient
markets should be
• Efficient markets involve random price changes because
we cannot predict surprises
38
Systematic Risk
• Risk factors that affect a large number of assets
• Also known as non-diversifiable risk or market
risk
• Includes such things as changes in GDP,
inflation, interest rates, etc.
37
38

25/02/2021
20
39
Unsystematic Risk
• Risk factors that affect a limited number of
assets
• Also known as unique risk and asset-specific
risk
• Includes such things as labor strikes, part
shortages, etc.
40
Diversifiable Risk
• The risk that can be eliminated by combining
assets into a portfolio
• Often considered the same as unsystematic,
unique or asset-specific risk
• If we hold only one asset, or assets in the same
industry, then we are exposing ourselves to risk
that we could diversify away
39
40

25/02/2021
21
41
Total Risk
• Total risk = systematic risk + unsystematic risk
• The standard deviation of returns is a measure of total
risk
• For well diversified portfolios, unsystematic risk is very
small
• Consequently, the total risk for a diversified portfolio is
essentially equivalent to the systematic risk
Measuring Systematic Risk
• How do we measure systematic risk?
• We use the beta coefficient to measure systematic risk
• What does beta tell us?
– A beta of 1 implies the asset has the same systematic risk as the overall market
– A beta < 1 implies the asset has less systematic risk than the overall market
– A beta > 1 implies the asset has more systematic risk than the overall market
41
42

25/02/2021
22
Security Market Line-SML
• The security market line is commonly used by investors
in evaluating a security for inclusion in an
investment portfolio in terms of whether the security
offers a favorable expected return against its level of risk
• SML line drawn on a chart that serves as a graphical
representation of the capital asset pricing model
(CAPM), which shows different levels of systematic, or
market, risk of various marketable securities plotted
against the expected return of the entire market at a
given point in time
43
44