Embed Size (px)
Citation preview

HAL Id: inserm-00881821https://www.hal.inserm.fr/inserm-00881821
Submitted on 6 May 2014
HAL is a multi-disciplinary open accessarchive for the deposit and dissemination of sci-entific research documents, whether they are pub-lished or not. The documents may come fromteaching and research institutions in France orabroad, or from public or private research centers.
L’archive ouverte pluridisciplinaire HAL, estdestinée au dépôt et à la diffusion de documentsscientifiques de niveau recherche, publiés ou non,émanant des établissements d’enseignement et derecherche français ou étrangers, des laboratoirespublics ou privés.
Population pharmacokinetic analysis of free and boundaflibercept in patients with advanced solid tumors.
Hoai-Thu Thai, Christine Veyrat-Follet, France Mentré, Emmanuelle Comets
To cite this version:Hoai-Thu Thai, Christine Veyrat-Follet, France Mentré, Emmanuelle Comets. Population pharma-cokinetic analysis of free and bound aflibercept in patients with advanced solid tumors.. CancerChemotherapy and Pharmacology, Springer Verlag, 2013, 72 (1), pp.167-80. 10.1007/s00280-013-2182-1. inserm-00881821
1
Population pharmacokinetic analysis of free and bound aflibercept in patients with advanced solid tumors Hoai-Thu Thai1,2, Christine Veyrat-Follet1, France Mentré2 , Emmanuelle Comets2
1 Drug Disposition Department, Sanofi, Paris, France 2 INSERM, UMR 738, F-75018 Paris, France; Univ Paris Diderot, Sorbonne Paris Cité, UMR 738, F-75018 Paris, France Correspondance:
Hoai-Thu Thai
Sanofi R&D Disposition Safety & Animal Research 1, avenue Pierre Brossolette 91380 Chilly-Mazarin France Tel: + 33 1 60 49 65 12 Fax: +33 1 60 49 71 61 Email: [email protected]
Keywords: Population pharmacokinetics, target-mediated drug disposition, aflibercept, VEGF,
covariate effect, dosing schedule
Word count: 5100
Number of tables: 4
Number of figures: 6
2
Abstract
Objective Aflibercept (Zaltrap®) is a novel anti-angiogenic agent that binds to vascular
endothelial growth factor (VEGF) and inhibits VEGF-dependent tumor growth. We aimed to
characterize the population pharmacokinetics (PK) of free and bound aflibercept in patients with
solid tumors, to examine the influence of covariates on their PK and to evaluate the proposed
dosing regimens by simulation.
Methods Data from 9 clinical trials with 1506 cancer patients receiving aflibercept (2-9 mg/kg
every 2 or 3 weeks; 1 hour IV infusion) as a monotherapy or in combination with various
chemotherapies were included. Free and bound aflibercept concentrations were analyzed using a
nonlinear mixed-effects modeling approach with MONOLIX 4.1.2.
Results An approximation of a target mediated-drug disposition model with irreversible binding
of free aflibercept to VEGF adequately described the PK of free and bound aflibercept. The
typical estimated clearances for free (CLf) and bound aflibercept (CLb) were 0.88 and 0.19 L/day,
respectively. The volumes of distribution for free (Vp) and bound (Vb) aflibercept were similar
(~4 L). CLf and Vp increased with body weight and were lower in women. Patients with low
albumin (ALB) or high alkaline phosphatase (ALK) had faster CLf compared to a typical patient.
Pancreatic cancer may be associated with changes in binding of aflibercept to VEGF. Simulations
of different dosing regimens showed that adequate saturation of circulating VEGF was achieved
with a dose of 4 mg/kg every 2weeks.
Conclusions Aflibercept kinetics was most affected by gender, body weight, ALB, ALK and
pancreatic cancer. Simulations supported the rationale for the recommended dose of 4 mg/kg
every 2 weeks for aflibercept.
3
Introduction
Malignant tumors are dependent on angiogenesis to maintain a source of nutrition and oxygen
supporting their growth and metastasis [1]. Vascular endothelial growth factor (VEGF) is a
homodimeric protein that activates two high-affinity receptors on the vascular endothelium
(VEGFR1 and VEGFR2), promoting the formation of blood vessels that are required for normal
and neoplastic tissue growth. VEGF has become a major target for anti-angiogenic therapy in
managing cancers because its overexpression in several tumor types is associated with increased
tumor vascularity, proliferation, progression, invasion, metastasis, and poor prognosis [2-4].
Preclinical studies have shown that inhibition of VEGF results in tumor growth inhibition in
several human tumor xenografts in the nude mouse model, including colorectal cell lines [5].
Aflibercept (known as ziv-aflibercept in the United States; Sanofi, Paris, France, and Regeneron
Pharmaceuticals, Tarrytown, NY) is a novel antiangiogenic agent [6]. It is a recombinant protein
consisting of human VEGF receptor extracellular domains (domain 2 from VEGFR1 and domain
3 from VEGFR2) fused to the Fc portion of human immunoglobulin G1 (IgG1). Aflibercept
binds to all isoforms of VEGF-A, VEGF-B and to placental growth factor (PlGF) [7]. It interferes
with the biological actions of VEGF by forming a complex with VEGF in the blood stream and
extravascular space and preventing it from interacting with its receptors on endothelial cells. The
affinity of aflibercept for VEGF-A (Kd in vitro = 0.5 pM) is higher than that of anti-VEGF
monoclonal antibodies, such as bevacizumab (Kd in vitro = 500 pM) [8,9].
Preclinical studies in mice have demonstrated the effects of aflibercept on capillary regression,
narrowing of vessels, blood flow cessation as well as endothelial cell apoptosis [10]. Inhibition of
tumor growth and tumor angiogenesis, inhibition of metastases and improved survival have been
observed with aflibercept in tumor xenografts for various cancers [6,11,12]. Phase I dose-
escalation studies, Phase II and Phase III trials have explored the antitumor activity of aflibercept
as a single agent or in combination with a number of chemotherapy agents/regimens, including in
patients with non-small cell lung, ovarian, pancreatic and colorectal cancers [6,13-16]. Recently,
aflibercept at 4 mg/kg every 2 weeks plus FOLFIRI (combination of 5-fluorouracil, leucovorin
and irinotecan) has been demonstrated to improve overall survival, progression-free survival and
response rate in patients with metastatic colorectal cancer [17-19].
4
During clinical development, data is accrued from different sources, such as phase I trials in
healthy subjects and phase I to III trials in cancer patients. Modelling pharmacokinetic (PK) data
allows us to integrate data from different clinical trials to update our knowledge about aflibercept
and support drug development strategy. Following this approach, a population PK study was
initiated with the aim of characterising the PK of aflibercept and quantifying parameter changes
in different populations.
Previously, we reported the results of a population PK analysis of free and VEGF-bound
aflibercept in 56 healthy subjects receiving single intravenous (i.v.) doses of 1 to 4 mg/kg
recruited in two phase I clinical studies [20]. An approximation of a target mediated-drug
disposition (TMDD) model with Michaelis-Menten (MM) type binding of free aflibercept to
VEGF in the peripheral compartment was used to describe the PK profile of both free and bound
aflibercept. This model adequately characterized the nonlinear binding of aflibercept to VEGF in
this healthy subject population.
The objectives of this analysis were (i) to characterize the population PK of free and bound
aflibercept in cancer patients by extending the model developed in healthy subjects; (ii) to
investigate covariates that could influence their PK and (iii) to evaluate various dosing regimens
by simulation.
Methods
Patient population and study design
A total of 9 clinical trials of aflibercept from Phase I to Phase III in 1506 patients with advanced
solid tumors were included in the population analysis. Aflibercept was used as a single agent in 4
trials and in combination with cytotoxic chemotherapy regimens in 5 trials. A summary of
clinical trials included in the analysis is given in Table 1. Phase I trials were conducted in patients
with various types of solid tumors while Phase II and Phase III trials were conducted in patients
with ovarian, pancreatic, lung and colorectal cancer. In these studies, aflibercept was
administered as a 1 hour i.v. infusion at dose levels ranging from 2 to 7 mg/kg every 2 or 3 weeks
and up to 9 mg/kg in every 3 weeks schedule only. Dose adjustments and/or cycle delays were
5
permitted in case of toxicity. An intensive PK sampling scheme was implemented in Phase I
studies as presented in Table 1. For Phase II and Phase III trials, PK samples were collected pre-
dose and at the end of aflibercept infusion on Day 1 (Cycle 1), then every odd cycle before
treatment administration and at approximately 30 and 90 days after the last aflibercept treatment.
All study protocols were in accordance with recommendations of the 18th World Health
Congress (Helsinki, 1964) and complied with the laws and regulations, as well as any applicable
guidelines, of the countries where the studies were conducted. All patients gave written informed
consent.
Assay method
For all clinical trials, free aflibercept and bound aflibercept (VEGF:aflibercept complex) plasma
concentrations were measured using enzyme-linked immunosorbent assay (ELISA) method. The
anti-drug-antibodies (ADA) were also detected by a titer-based, bridging immunoassay to
evaluate the potential effect of immunogenicity on the PK of aflibercept. Blood samples were
collected in tubes (containing 1 mL of citrate buffer, sodium citrate, and 4.2 mg of citric acid)
and were centrifuged at 2000 g for 15 minutes at room temperature. Plasma was stored at -80°C
until analyzed.
In the assay of free aflibercept, human VEGF165 initially adsorbed to the surface of a polystyrene
solid support was used to capture free aflibercept in the samples and then bound to a mouse anti-
human specific VEGFR-1 monoclonal antibody. After that, the immobilized murine monoclonal
complex was bound to a goat antimouse IgG antibody conjugated to Horseradish Peroxidase for
detection. The limit of quantification (LOQ) for free aflibercept in plasma was initially 31.3
ng/mL (for TED6115/TED6116), and then 15.6 ng/mL (for subsequent studies).
The assay of bound aflibercept was similar to that of free aflibercept, except for the use of the
anti-human VEGF165 antibody instead of human VEGF165 a as the capture reagent in the coated
plate. The LOQ for bound aflibercept in plasma was 43.9 ng/mL.
Since bound aflibercept contains one molecule of endogenous VEGF and one molecule of
aflibercept, bound aflibercept concentrations were expressed as free aflibercept equivalents for

6
PK analyses using 0.717, the ratio of molecular weights between free and bound aflibercept. The
units of free and bound aflibercept concentrations were µg/mL and µg.eq/mL, respectively.
Population pharmacokinetic analysis
The population PK analysis was performed using a nonlinear mixed-effects modeling approach
with MONOLIX 4.1.2 [21] implementing the SAEM algorithm [22]. The model control files
were written using MLXTRAN script. Graphical analyses for model evaluation were performed
with R 2.14.1.
Structural model
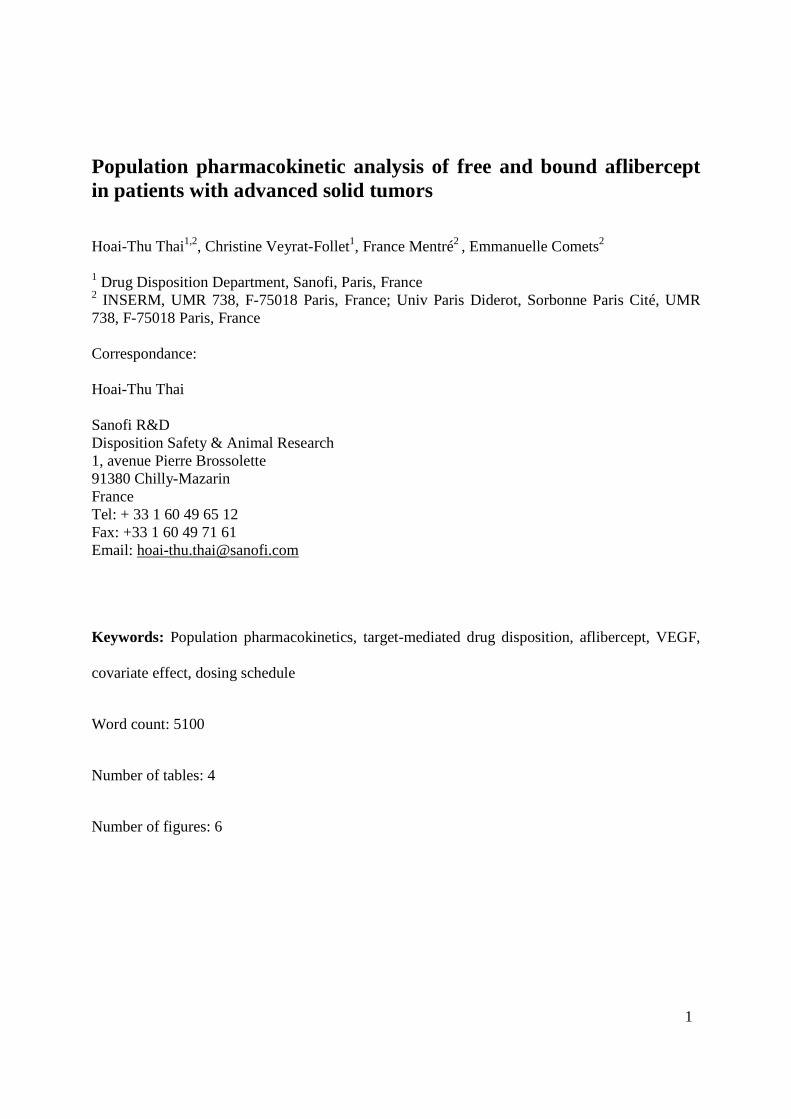
The previous population PK analysis of free and bound aflibercept in healthy subjects
demonstrated that the irreversible MM (IB-MM) approximation of TMDD model was the best
PK model for aflibercept. This model is shown in Figure 1 and includes 2 compartments for free
aflibercept, 1 compartment for bound aflibercept and irreversible MM type binding of free
aflibercept to VEGF in the peripheral compartment [20]. In addition, the dissociation rate
constant (koff) which gives back free aflibercept and free VEGF was assumed to be negligible and
is not represented on the Figure 1. The same model was applied to patient data.
In this model, the concentration of free aflibercept in central compartment (Cp), in tissue
compartment (Ct) and the concentration of bound aflibercept (Cb) are described by the following
system of differential equations:
in which Rinf is the infusion rate, kel (day-1) is the first order elimination rate constant of free
aflibercept from the central compartment, ktp and kpt (day-1) are the first order rate constants
between the central and the peripheral compartment, kint (day-1) is the first order rate constant of
bound aflibercept internalization, Vp (L) is the central volume of distribution of free aflibercept,
btm
t
b
b
tm
t
tttp
t
pppt
t
p
tttppptel
p
p
CkC+K
CV
V=
dt
dC
C+K
CV
VCk
V
VCk=
dt
dC
V
VCk+C)k+(k
V
R=
dt
dC
..1
.1.
..
...
intmax
max
inf
−⋅
⋅−−
−
7
Vt (L) is the peripheral volume of distribution of free aflibercept, Vb (L) is the volume of
distribution of bound aflibercept, Vmax (mg/day) is the maximum binding capacity, Km (µg/mL) is
the concentration of free aflibercept corresponding to half of maximum binding capacity.
The clearances of free and bound aflibercept (CLf and CLb) and the intercompartmental clearance
of free aflibercept (Q) between the central and the peripheral compartments are derived from the
micro-constant as follows:
= .
= .
= . = .
The parameters to be estimated in this model are: CLf, Vp, Q, Vt, CLb, Vb, Vmax, and Km.
Statistical model
Denoting f the function describing the PK structural model, the statistical model for observed
concentration Cij of subjects i for sampling time tij is:
= , +
where is the vector of parameters of subject i and is the residual error.
The interindividual variability (IIV) on all parameters was modeled with an exponential model,
implying a log-normal distribution for the parameters, e.g. for CL:
= ,
where ηCL,i denotes the random effect in subject i, CLi the individual clearance parameter and CL
the typical value of the population. Random effects were assumed to follow a normal distribution
with zero mean and variance matrix Ω, which was modeled as diagonal.
The residual variability was modeled using a combined additive and proportional model for both
free and bound aflibercept. The residual errors for free aflibercept (ε free,ij) and bound aflibercept
(ε bound,ij) are assumed to be independent and normally distributed with mean zero and a
heteroscedastic variance σ² free,ij and σ² bound,ij respectively, given by:
8
,! = (# + (, ))²
&' (,! = (# + ( , ))²
where σ fa and σ fp are respectively the additive and proportional coefficients of the residual error
model of free aflibercept; σ ba and σ bp are respectively the additive and proportional coefficients
of the residual error model of bound aflibercept.
Estimation of potential interoccasion variability (IOV) was not performed in this analysis because
the data was very sparse, containing a trough concentration every two cycles for 90% of the
patients.
The variability models were investigated. For parameters with an estimated low level of IIV, we
tested whether IIV could be removed from the model. The likelihood ratio test was used to
discriminate between variability models through the difference in log likelihood (-2LL),
computed using important sampling [23]. A p-value of 0.05 was considered statistically
significant.
Covariate analysis
The covariate analysis was performed after obtaining the base model and focused on the main
parameters describing the PK of free and bound aflibercept and their binding to VEGF: CLf, Vp,
Vmax, Km and CLb.
The following covariates were included in the analysis: patient demographics (age, gender,
weight and ethnicity), laboratory measurements at baseline (albumin (ALB), serum alkaline
phosphatase (ALK), total bilirubin (BIL), aspartate amino transferase (AST), alanine amino
transferase (ALT), total protein (TP), and creatinine clearance (CLCR)) and concomitant
chemotherapy (irinotecan/5-FU/LV in TCD6118, docetaxel in VITAL and TDC6120,
gemcitabine in VANILLA and FOLFIRI in VELOUR).
In this work, the effect of study and the effect of cancer type were not tested as these were
confounded with the effect of chemotherapy (see Table 1). The effect of baseline endogenous

9
VEGF concentrations on PK aflibercept would have been interesting to investigate; however the
large amount of missing values (62% of patients) precluded this as a covariate in the modeling.
The parameter-covariate relationships were modeled multiplicatively as follows (e.g. for CL):
= ) *+,*+,-./01
23, for continuous covariates
where β are the regression coefficient to be estimated, 45(# is the median value of
covariates.
or = . 3.*+,, for dichotomous covariates 4taking 0 or 1 values
The construction of the covariate model was performed with hypothesis testing using the Wald
test [24] in two steps:
- Step 1: For covariate screening, each potential parameter-covariate relationship was included
one by one in the base model and the parameters were estimated. The significance of a covariate
effect was then assessed using the Wald test.
- Step 2: All the significant covariates were included in the base model. The final model was built
using a backward stepwise procedure by removing the non-significant covariates one by one,
starting from the full model and removing the effect having the largest non-significant p-value of
the Wald test. This step was repeated until only significant covariates remain in the model.
A p-value of 0.05 was considered statistically significant in both steps.
Model evaluation
Internal evaluation of the model was based on goodness-of-fit (GOF) plots, including plots of
observations versus individual and population predictions. Plots of normalized prediction
distribution error (NPDE) [25,26] versus time since last dose (TimeL) were used to assess model
predictive performance, based on the simulation of 1000 datasets. The NPDE plots with 95%
prediction intervals around the 10th, 50th and 90th percentiles were generated using the package
NPDE 2.0 for R [27]. We also computed the η-shrinkage for each parameter and ε-shrinkage
separately for free and bound aflibercept data to quantify the amount of information in the
10
individual data about the parameters [28]. Model evaluation was performed for both the base
model and the final model.
Model-based simulations
In order to compare the time course of free and bound aflibercept concentrations after different
dosing regimens (2, 4 or 6 mg/kg q2wk or q3wk), the estimates of the fixed and random effects
obtained in the final model were used to simulate the steady-state PK profiles of free and VEGF-
bound aflibercept in 1000 virtual patients. To mimic the actual treated population, the covariates
were obtained by resampling 1000 patients from the 1506 patients in the study and collecting the
set of covariates characterising each patient. The median bound concentrations of different doses
for every 2 and 3 weeks regimens were compared to evaluate the optimal dosing regimen for
achieving VEGF blockade. The median, 5th and 95th percentiles of free and bound aflibercept
concentrations versus time were plotted for the recommend dose (4 mg/kg q2wk) to confirm the
saturation of the binding of free aflibercept to VEGF during the treatment period.
Results
Demographics
The database for this population PK analysis consisted of 1506 patients including 151 patients
from Phase I studies, 282 patients from Phase II studies and 1073 patients from Phase III studies.
Patients found to be ADA positive were only found to have low titer levels and ADA positivity
did not result in any observed impact on aflibercept PK (data not shown). As the result, all ADA
positive patients (less than 5% of the analysis population) including those found to be ADA
positive only at baseline were included in this analysis. The characteristics of these patients are
shown in Table 2.
The majority of patients included in this analysis were Caucasians aged 65 years old and over and
equally balanced between genders. Almost all the patients had normal renal function (CLCR: >80
mL/min) or mild renal dysfunction (CLCR: 50-80 mL/min). In this analysis, approximately one
third of the patients had colorectal cancer, one third had lung cancer and the remaining third had
other various solid tumors. Most patients received aflibercept in combination with chemotherapy.
11
Approximately 90% of patients were recruited in phase II and III studies and had limited
pharmacokinetic sampling with only one peak and multiple trough concentrations of free and
bound aflibercept.
Population pharmacokinetic model building
Base model development was performed using a data set including 1506 patients with 7916 free
aflibercept concentrations and 6977 bound aflibercept concentrations greater than LOQ. The
below quantification limit (BQL) data for free aflibercept (5.7%) and bound aflibercept (17.2%)
were omitted in this analysis. The concentrations of both free and bound aflibercept were
measured for 1378 patients while only free aflibercept concentrations were available for 128
remaining patients.
The TMDD model with IB-MM approximation previously developed in healthy subjects
provided an adequate fit to the PK data of both free and bound aflibercept in patients. The IIV on
maximum binding capacity (Vmax) was found to be small (6%) and poorly estimated. Removing
the variability for this parameter did not degrade the fit, with even a decrease of 5 points in -2LL
values, probably as a result of improved model stability and estimation of other parameters. A
combined additive and proportional residual error was retained for both free and bound
aflibercept. The parameter estimates of the base model are shown in Table 3. Both fixed and
random effects were precisely estimated with relative standard errors (RSEs) of less than 22%.
The η-shrinkage was large for most parameters, reflecting the lack of information in the patients
with sparse sampling, representing 90% of the subjects in the pooled dataset: CLf (37%), Vp
(69%), Q (86%), Vt (64%), Vb (73%), Km (95%), CLb (48%). The ε-shrinkage was 23 % for the
data of free aflibercept and 19% for the data of bound aflibercept.
Seventeen potential covariates were evaluated for aflibercept by testing them on CLf, Vp, Km, and
CLb in the base model. They were not tested on Vmax as its IIV was set to zero. Based on the Wald
test of the univariate analysis using modeling, the following covariates were found to have an
influence on PK parameters and were considered for inclusion in the model: gender, age, weight,
CLCR, ALB, ALK, AST, ALT and all the concomitant chemotherapies. Ethnicity appeared to
have no significant effect on aflibercept PK. After removing non significant covariates one by

12
one starting from the full model, the final model was achieved, with parameter estimates and the
coefficients of all significant covariates presented in the Table 3.
The parameters in the final model were estimated with reasonable precision: RSEs ≤ 10% for PK
parameters, RSEs ≤ 42% for random effects and RSEs ≤ 46% for the coefficients of the
significant covariates. The PK parameter estimates of the final model were similar to those of the
base model. In the final model, the typical estimated clearance for free aflibercept was about 4.6
times faster than that of bound aflibercept (0.88 and 0.19 L/day, respectively). The volumes of
distribution for free aflibercept (Vp) and bound aflibercept (Vb) were similar (~ 4 L). The
maximum binding capacity was 0.82 mg/day and the concentration of free aflibercept
corresponding to half of maximum binding capacity in this patient data set was 1.92 µg/mL.
The IIV on model parameters was moderate to high, ranging from 22.3% (CLb) to 85.5% (CLf).
There was a small decrease in the estimates of the variabilities of all parameters, except Q and Vt
when including covariates in the model. Residual variability was moderate for free aflibercept
(proportional errors of 32.9%) but low for bound aflibercept (proportional errors of 9.01%).
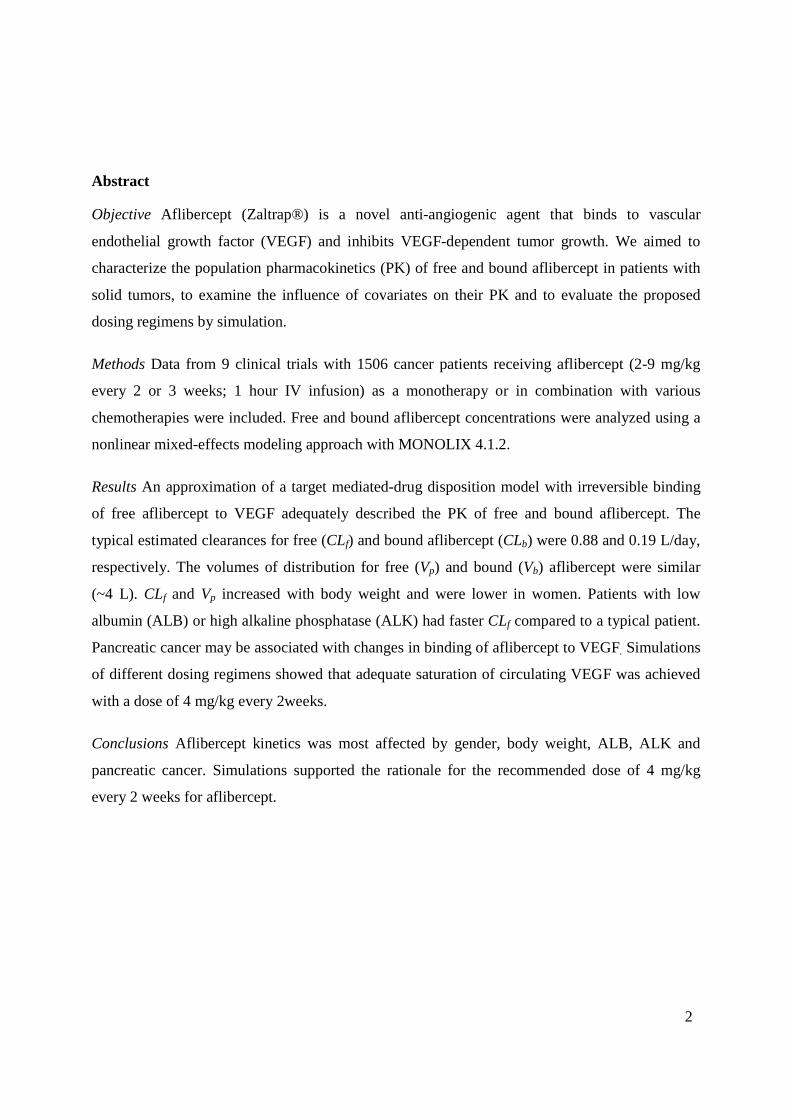
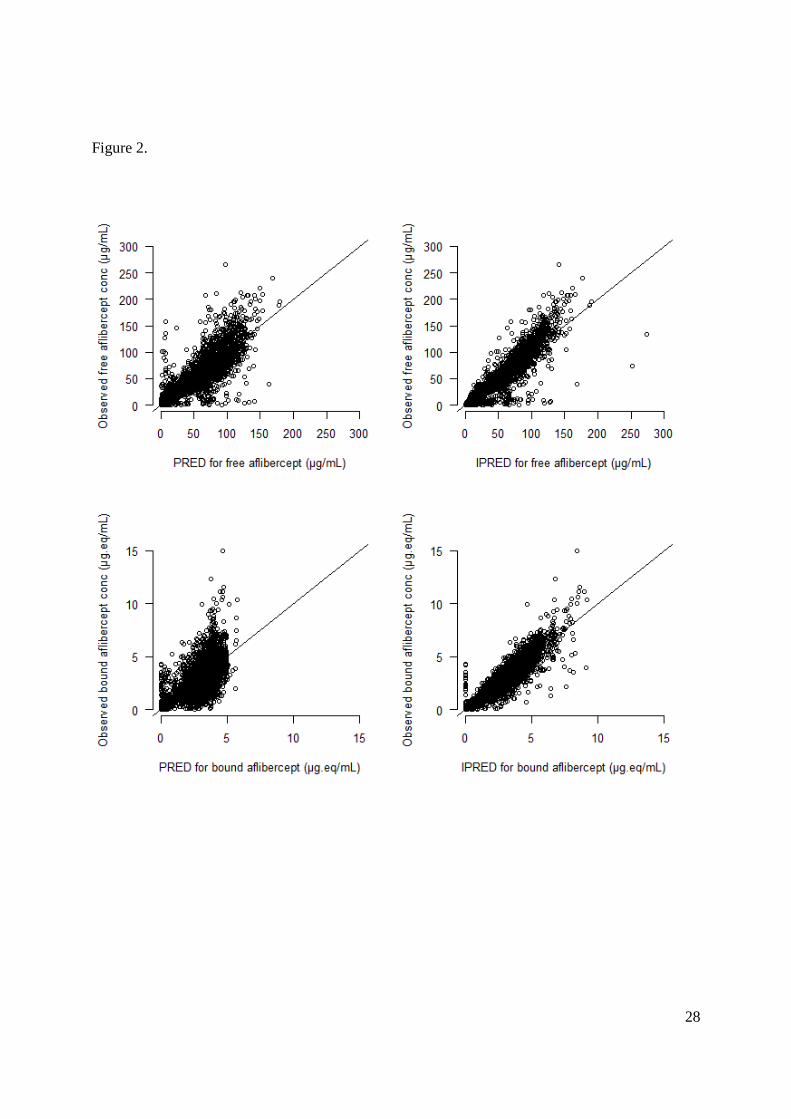
The goodness-of-fit plots of the final model with covariates are shown in Figures 2 and 3. The
plots of observations versus population and individual predictions (Figure 2) indicated that the
model adequately described the observations despite an underprediction of high concentrations of
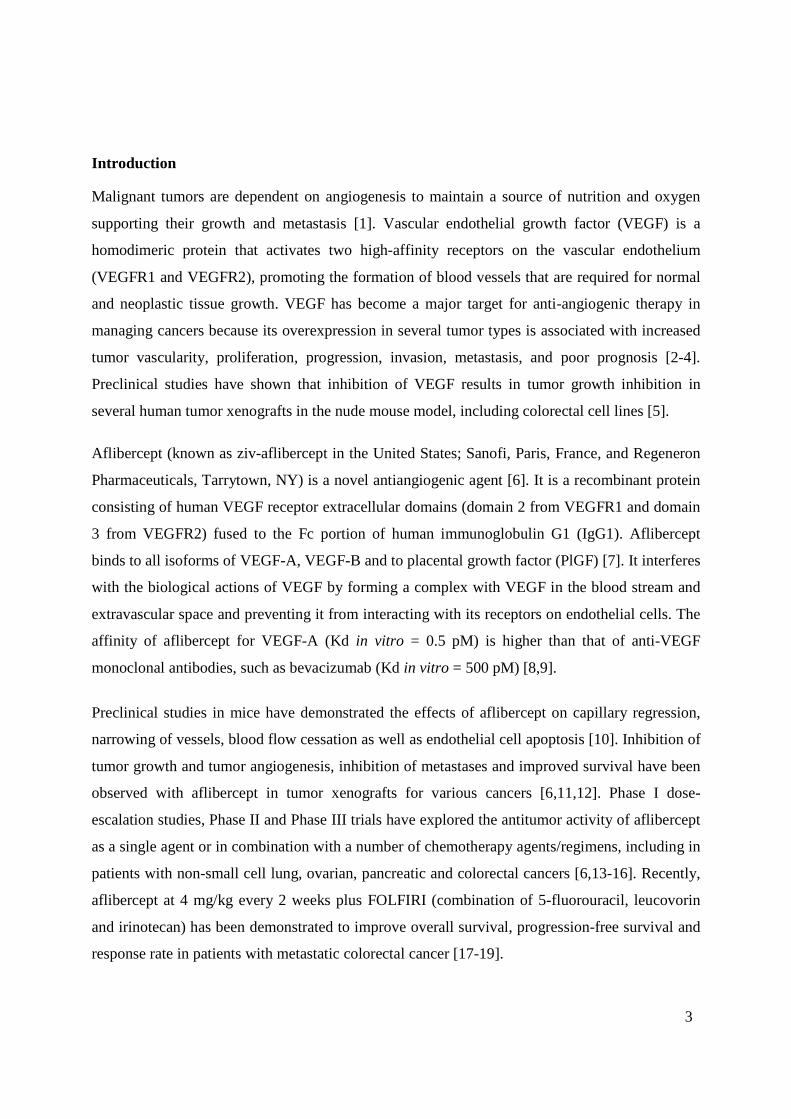
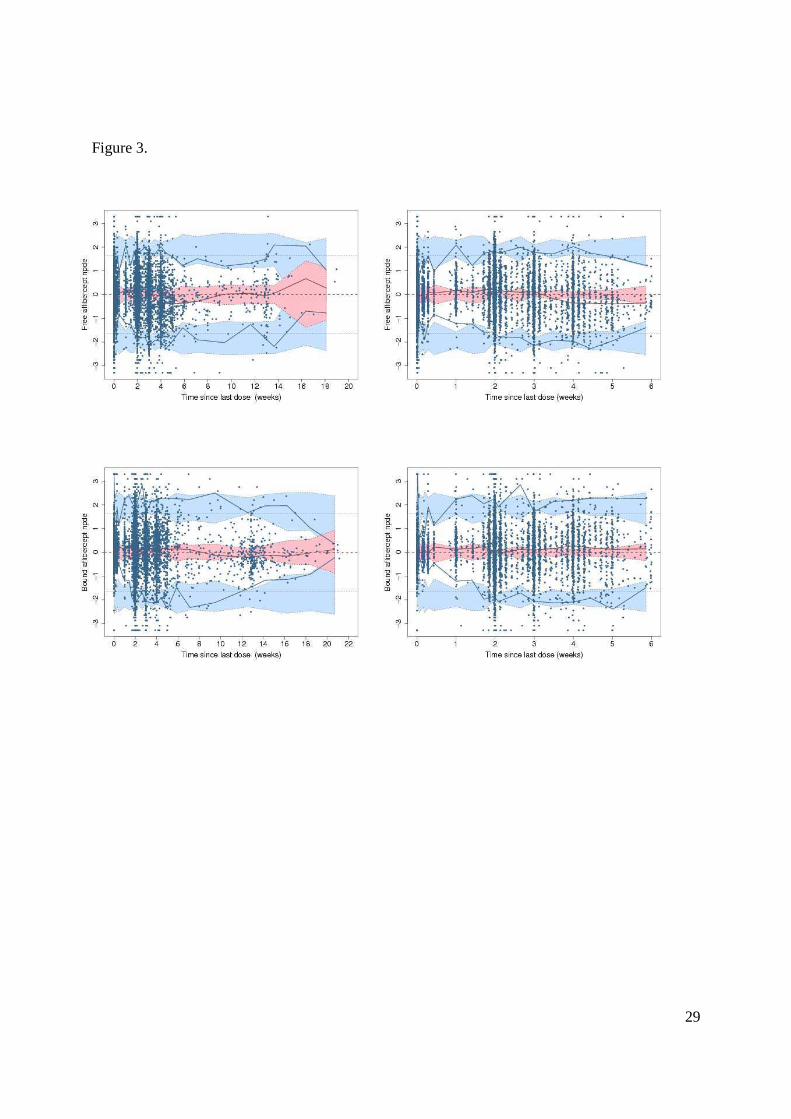
free aflibercept. The plots of NPDE versus time since last dose (timeL) are presented in Figure 3
for the duration of the study (timeL≤ 22 weeks). Here, NPDE plots are more appropriate than
VPC (visual predictive check) plots because of the heterogeneity in sample times and doses
[25,26]. An inset is shown plotting only the data for 6 weeks after the last treatment (timeL≤ 6
weeks), which was the period of time where most of the observations were collected. The NPDE
plots showed a symmetric distribution around zero for both free and bound aflibercept. The
prediction bands indicated good model adequacy except for two issues. First, prediction intervals
appear to be too large at timeL≥ 14 weeks; this could be an artifact due to the small number of
measurements late after the last dose. Second, the variability at early times for bound aflibercept
is underestimated; this could be a consequence of the BQL data not being included in the
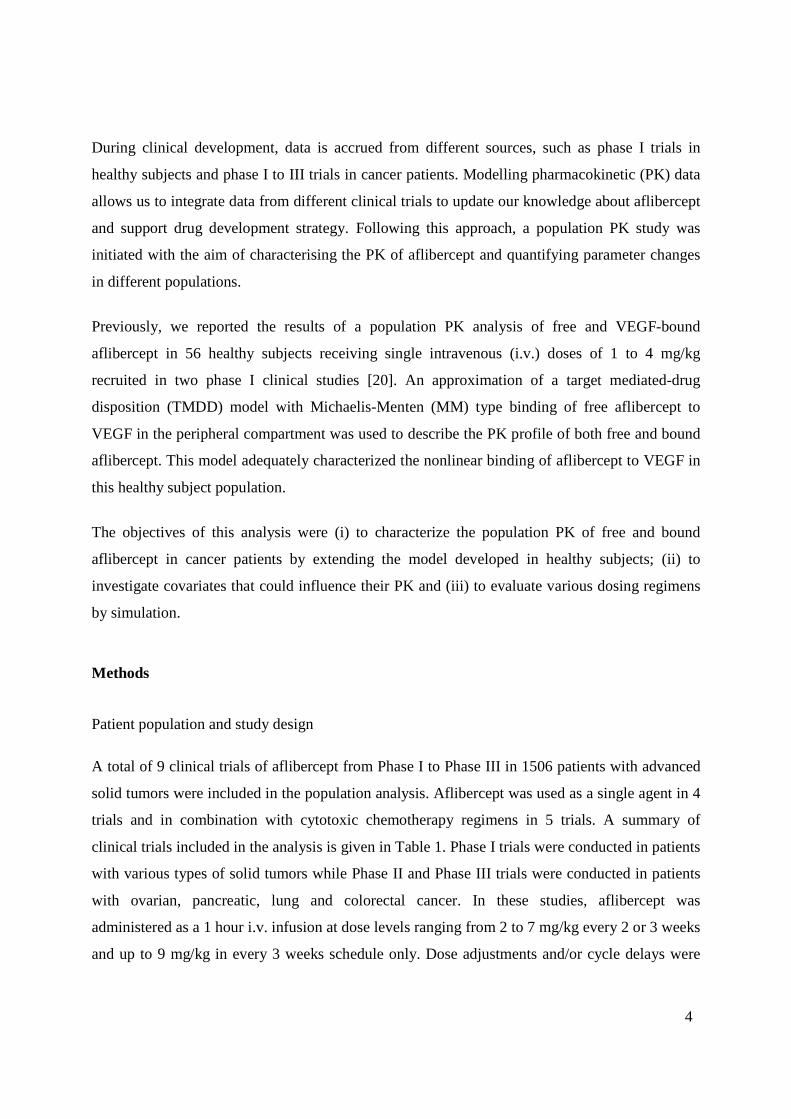
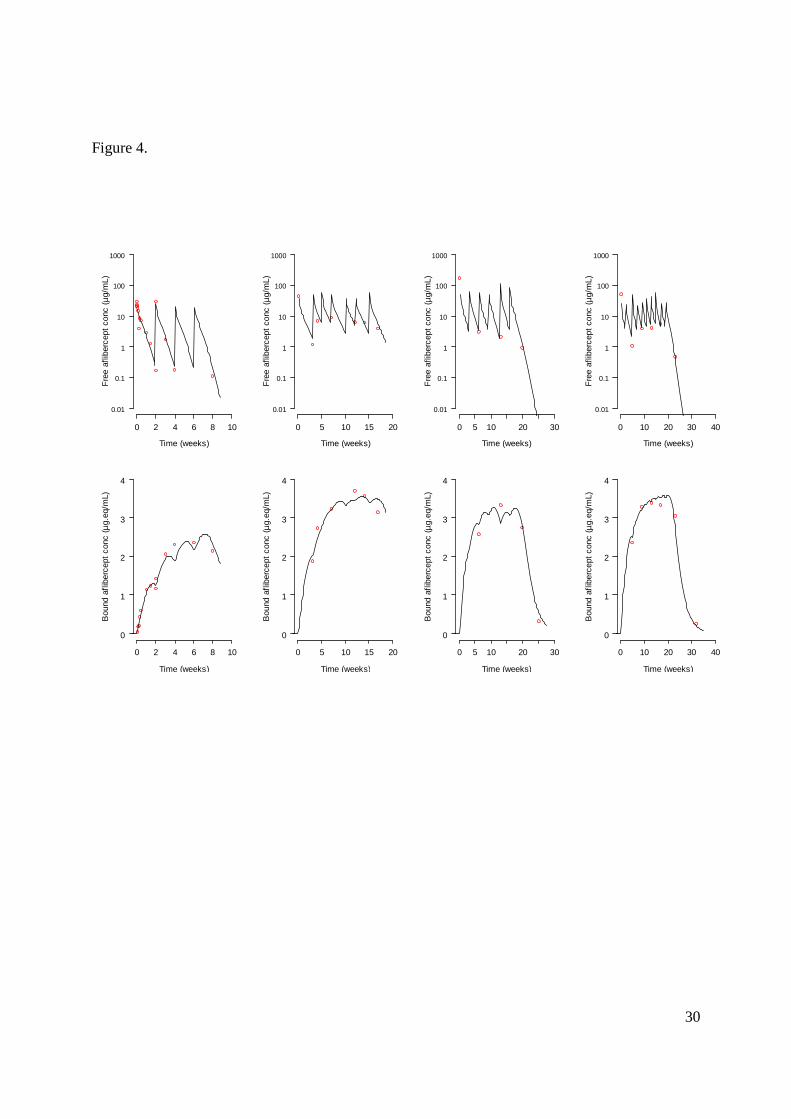
database. Individual plots for free and bound aflibercept are shown in Figure 4 for 4 subjects
from 4 different studies. For most subjects, the model described reasonably well the observations
for both free and bound aflibercept.
13
Assessment of covariate effects
The magnitude of the effect of covariates on aflibercept PK parameters in the final model is
shown in Table 4. Gender, body weight, ALB and ALK had the largest effects on CLf. CLf
increased 12% for patients with a WT of 99 kg compared to the value of a typical 70 kg male
subject and was 14% smaller in women compared to men. A patient with low serum ALB
(normalized ALB of 0.57) would be expected to have 14.06% faster CLf while patients with a
high concentration of ALK (normalized ALK of 1.01) would have a 14.41% faster CLf compared
to a patient with median values of ALB and ALK. Gender and body weight also had significant
effects on Vp with a 14.6% increase for a WT of 99 kg and a 19% decrease in women.
Conversely, the covariate effects on CLb were very small with less than 10% changes in CLb
compared to a typical subject, except for the effect of chemotherapy for irinotecan/5-FU/LV with
a decrease of 12% of CLb. The most important covariate associated with a change in the binding
kinetics of aflibercept to VEGF, expressed by the irreversible binding constant Km, was observed
in patients with pancreatic cancer treated with gemcitabine in the study VANILLA. These
patients had a Km increased by 82% compared to the typical patient receiving aflibercept as a
monotherapy. A decrease of 20% in Km was also observed in women compared to typical men
while an increase in Km was also observed in patients with high level of ALT or low level of AST
compared to the typical patient. However, the high positive correlation between ALT and AST
implies a small overall effect on Km, with less than 10% of change compared to the typical value
of 1.92. Combining all the covariate effects on Km explained 31.5 % of the IIV in this parameter.
For other parameters, the covariate effects explained very little the IIV on their parameters:
12.2% for CLf, 16.4% for Vp and 5% for CLb.
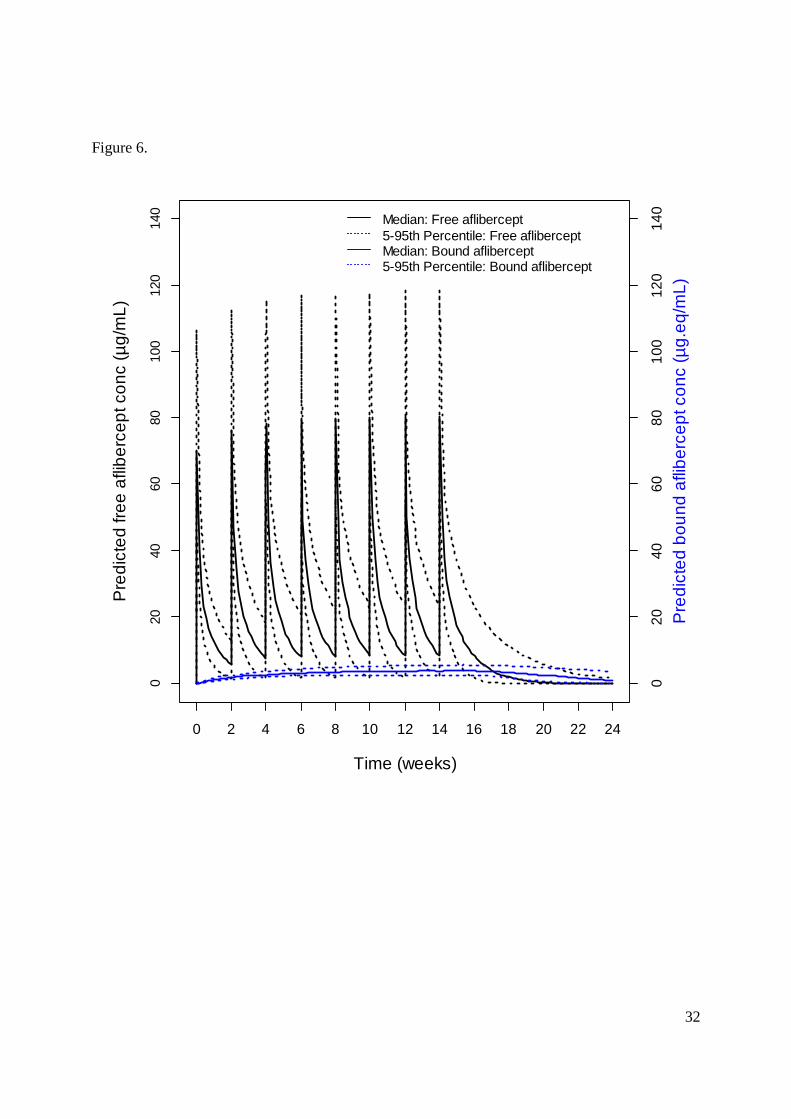
Simulation of various dosing regimens
The final PK model was used to simulate the concentration-time courses at steady-state of free
and bound aflibercept for 1000 virtual patients receiving 8 doses of 2, 4 or 6 mg/kg every 2
weeks or 6 doses of 2, 4 or 6 mg/kg every 3 weeks. Figure 5 presents the predicted median
profiles of bound aflibercept at steady-state for these different dosing regimens. Similar bound
aflibercept levels were observed between 4 mg/kg and 6 mg/kg for q2wk regimen, indicating
saturation of binding of aflibercept to circulating VEGF was reached at doses ≥ 4 mg/kg. In
addition, same bound aflibercept levels were shown between the 4 mg/kg q2wk regimen and the
14
6 mg/kg q3wk regimen, suggesting similar saturation of circulating VEGF for these two
regimens. The predicted steady-state concentrations of free and bound aflibercept are presented in
Figure 6. It illustrated that the free aflibercept concentrations remain greater than bound
aflibercept concentrations throughout all the dosing intervals in most patients receiving 4 mg/kg
q2wk. As aflibercept binds to VEGF with a 1:1 ratio, maintaining free drug concentrations above
bound drug concentrations throughout the dosing intervals would maximize binding of
aflibercept to endogenous VEGF.
Discussion
In this study, we present a population PK analysis of free and bound aflibercept in 1506 patients
with advanced solid tumors from 9 clinical trials. Aflibercept was administered intravenously
every two weeks as a single agent, every two or three weeks in combination with various
chemotherapy drugs at dose levels ranging from 2 to 7 mg/kg and up to 9 mg/kg in the every 3
weeks schedule only. The influence of covariate effects on aflibercept pharmacokinetics was
studied and quantified.
Based on the mechanism of action, aflibercept exhibits a target-mediated drug disposition
(TMDD) as the binding of the drug to the target influence the pharmacokinetics of the drug. A
general TMDD model describes the elimination pathway of drug plasma concentrations as the
combination of first-order elimination from the central compartment and specific target binding
clearance followed by internalization of drug-target complex [29]. The binding of the drug to the
target can occur predominantly in the central or the peripheral compartment [30]. The full TMDD
model is however complex and generally overparameterised. As a result, several approximations
of TMDD model have been proposed: quasi equilibrium (QE), quasi steady state (QSS) and
Michaelis-Menten (MM) [31-33]. The QE approximation is based on the assumption that the
drug-target binding is much faster than all other system processes. The QSS approximation
assumes the drug-target complex concentration changes more slowly than the binding and
internalization process. The MM approximation describes the system when the target
concentration is small relative to the free drug concentration and the dosing regimens result in the
target being fully saturated [32]. Recently, a new derivation of MM approximation of TMDD
model, the irreversible binding MM (IB-MM) model, can be used when the dissociation rate
constant is negligible [33]. This is the model we used previously in healthy subjects. In this

15
model, the MM parameters (Vmax, Km) are related to TMDD model parameters: Vmax=ksyn.VR and
Km=KIB=kdeg/kon, where VR is the volume of distribution of target and KIB, ksyn, kdeg are the
irreversible binding constant, target production rate and target degradation rate, respectively [6].
In the present study, the same structural model was applied successfully in patients, suggesting
the similarity in binding kinetics of aflibercept to VEGF in cancer patients and healthy subjects:
irreversible binding occurring dominantly in the peripheral compartment (extravascular space).
This is in agreement with large quantities of VEGF in tumors and skeletal muscle [34].
Compared to healthy subjects, the population estimates for the clearance of free aflibercept in
typical 70 kg male cancer patients were the same (0.88 L/hr) while the clearance of bound
aflibercept was slightly faster (0.14 vs 0.19 L/day). Similar values of Vp and Vb (around 4 L) were
also observed, indicating a low level of tissue diffusion of aflibercept in both healthy subjects and
patients. In this analysis, the volume of distribution Vb was correctly estimated with similar value
to Vp while it had to be fixed to the value of Vp in the analysis of healthy subjects due to
identifiability issues. The MM parameters (Vmax and Km), reflecting the binding of aflibercept to
VEGF, were however lower in cancer patients than in healthy subjects (0.82 mg/day and 1.92
µg/mL vs 0.99 mg/day and 2.91 µg/mL, respectively). These findings were not expected. Km
should be similar for these two populations and Vmax should be higher in cancer patients because
of the faster secretion rate of VEGF and larger volume of distribution of VEGF in tumor tissue
than in healthy tissue [35]. The comparison of binding kinetics between healthy subjects and
patients is somewhat difficult because the designs and the studied doses were quite different in
these two populations. The binding parameter estimates obtained in the previous study for
healthy subjects may be impacted by the lower doses (e.g 1 mg/kg) given as single
administration, and non available data of bound aflibercept at late time points compared to those
measured in patients. It may also explain slightly faster clearance estimation for bound
aflibercept. However, PK findings in healthy volunteers addressed many aspects of general
clinical pharmacology and helped us to well identify the model structure thanks to homogenous
data before moving to heterogeneous data pooled from different clinical studies, containing a lot
of sparse data.
The covariate screening was performed using the modeling approach rather than using the
Empirical Bayes Estimates of individual parameters because of the large shrinkage of parameters

16
in the base model. A backward stepwise elimination procedure was used to build the final model
using the Wald test. Among all covariates tested, gender had the largest effects on both CLf and
Vp while gemcitabine had the largest effect on Km. Body weight also had important effect on CLf
and Vp. The impact of the correlation between body weight and gender was found to be less
significant due to the large varibilities in body weight observed in men and women. Moreover,
the inclusion of both gender and body weight improved the model fit.
Patients with low serum albumin concentrations or high concentrations of alkaline phosphatase had
approximately 14% faster CLf and 32% lower exposure to free aflibercept compared to a typical
patient with normal ALB or ALK. These effects were also found for total bevacizumab [36]. Low
albumin and high alkaline phosphatase are generally indicative of disease severity and tumor
burden [36] and may be the underlying cause of this association. In addition, an effect of albumin
on clearance has been shown in the PK analysis of the monoclonal antibody, infliximab in
patients with ulcerative colitis [37].
A finding of note in this study is the important increase (82%) of the irreversible binding constant
(Km or KIB) found in pancreatic cancer patients treated with gemcitabine in the VANILLA study.
However, it may be not be reasonable to assume that the affinity of aflibercept for VEFG varies
from one cancer to another, and this increase may in fact reflect differences in Vmax. Indeed, in the
first steps of modeling, variability was included in the model for both Vmax and Km, but the former
was removed because the model was not stable enough and the variability was very small and
poorly estimated. However, since the correlation between Vmax and Km was very high (0.9), the
apparent elevated value of Km may indicate a decrease in maximal binding capacity (Vmax) or in
production rate of VEGF (ksyn). This would be related to the poorly vascularised nature of
pancreatic tumors [38]. Unlike many other solid tumor types where the formation of new blood
vessels (angiogenesis) promotes tumor growth by ensuring proper blood supply to the tumor,
delivering nutrients and oxygen; pancreatic tumors do not need to create new blood vessels. They
are able to survive with poor vasculature and under very low oxygen conditions, which makes
drug delivery to pancreatic tumors especially difficult [39]. This has been suggested to be the
reason why pancreatic cancer patients often have poor response to chemotherapy, even in
combination with anti-VEGF agents administered intravenously [39,40].
17
Although several covariates were found significant in the final model, their contribution to
aflibercept pharmacokinetics was mostly small with potential changes less than 20% (ranging
from 3 to 18%) in CLf, CLb and Vp. As a result, the impact on VEGF inhibition would be minimal
from a pharmacodynamic point of view. Conversely, the change in the maximal binding capacity
of aflibercept to VEGF in patients with pancreatic cancer was much more important and may
have contributed to the outcome of the VANILLA study in pancreatic cancer with the 4 mg/kg
every 2 weeks regimen for aflibercept.
The final PK model was used to simulate the concentration-time courses of free and VEGF-
bound aflibercept for 1000 virtual patients for different doses of aflibercept. Assuming the level
of VEGF-bound aflibercept can be used as a marker of VEGF blockade [41], this simulation
allowed us to confirm the choice of the recommended dose of 4 mg/kg every 2 weeks which is
sufficient to saturate circulating VEGF in most patients. The developed model can be used to
simulate and predict the concentration-time profiles of free and bound aflibercept in a patient
population of interest, for example obese patients and patients with low albumin, with new
dosing regimens. From a clinical perspective, it would be interesting to model the relationship
between concentrations and a direct marker of aflibercept efficacy, such as the tumor sizes.
In summary, the present model adequately described the pharmacokinetics of free and bound
aflibercept in cancer patients. The most important covariates affecting aflibercept kinetics were
gender, body weight, ALB, ALK and pancreatic cancer. This model supported the rationale for
the recommended dose of 4 mg/kg every 2 weeks for aflibercept in colorectal cancer.
Conflict of Interests
During this work, Hoai-Thu Thai was a PhD student with a research grant funded by Sanofi and
UMR 738 INSERM- University Paris Diderot (head Professor France Mentré) had a research
grant from Sanofi. Christine Veyrat-Follet is employee of Sanofi.
References
1. Folkman J (1997) Addressing tumor blood vessels. Nat Biotechnol 15 (6):510 2. Takahashi Y, Kitadai Y, Bucana CD, Cleary KR, Ellis LM (1995) Expression of vascular endothelial growth factor and its receptor, KDR, correlates with vascularity, metastasis, and proliferation of human colon cancer. Cancer Res 55 (18):3964-3968

18
3. Takebayashi Y, Aklyama S, Yamada K, Akiba S, Aikou T (1996) Angiogenesis as an unfavorable prognostic factor in human colorectal carcinoma. Cancer 78 (2):226-231 4. Radinsky R, Ellis LM (1996) Molecular determinants in the biology of liver metastasis. Surg Oncol Clin North Am 5 (2):215-229 5. Ferrara N, Davis-Smyth T (1997) The biology of vascular endothelial growth factor. Endocr Rev 18 (1):4-25 6. Gaya A, Tse V (2012) A preclinical and clinical review of aflibercept for the management of cancer. Cancer Treat Rev 38 (5):484-493 7. Sternberg CN (2008) Systemic chemotherapy and new experimental approaches in the treatment of metastatic prostate cancer. Ann Oncol 19 Suppl 7:vii91-95 8. Chu QS (2009) Aflibercept (AVE0005): an alternative strategy for inhibiting tumour angiogenesis by vascular endothelial growth factors. Exp Opin Biol Ther 9 (2):263-271 9. Lockhart AC, Rothenberg ML, Dupont J, Cooper W, Chevalier P, Sternas L, Buzenet G, Koehler E, Sosman JA, Schwartz LH, Gultekin DH, Koutcher JA, Donnelly EF, Andal R, Dancy I, Spriggs DR, Tew WP (2009) Phase I study of intravenous vascular endothelial growth factor trap, aflibercept, in patients with advanced solid tumors. J Clin Oncol 28 (2):207-214 10. Baffert F, Le T, Sennino B, Thurston G, Kuo CJ, Hu-Lowe D, McDonald DM (2006) Cellular changes in normal blood capillaries undergoing regression after inhibition of VEGF signaling. Am J Physiol 290 (2):H547-559 11. Holash J, Davis S, Papadopoulos N, Croll SD, Ho L, Russell M, Boland P, Leidich R, Hylton D, Burova E, Ioffe E, Huang T, Radziejewski C, Bailey K, Fandl JP, Daly T, Wiegand SJ, Yancopoulos GD, Rudge JS (2002) VEGF-Trap: a VEGF blocker with potent antitumor effects. Proc Nat Acad Sci USA 99 (17):11393-11398 12. Eichten A, Adler A, Cooper B, Griffith J, Wei Y, Yancopoulos G, Lin H, Thurston G (2012) Rapid decrease in tumor perfusion following VEGF blockade predicts long-term tumor growth inhibition in preclinical tumor models. Angiogenesis 16(2):429-441 13. Freyer G, Isambert N, You B, Zanetta S, Falandry C, Favier L, Trillet-Lenoir V, Assadourian S, Soussan-Lazard K, Ziti-Ljajic S, Fumoleau P (2012) Phase I dose-escalation study of aflibercept in combination with docetaxel and cisplatin in patients with advanced solid tumours. British J Cancer 107(4):598-603 14. Coleman RL, Duska LR, Ramirez PT, Heymach JV, Kamat AA, Modesitt SC, Schmeler KM, Iyer RB, Garcia ME, Miller DL, Jackson EF, Ng CS, Kundra V, Jaffe R, Sood AK (2011) Phase 1-2 study of docetaxel plus aflibercept in patients with recurrent ovarian, primary peritoneal, or fallopian tube cancer. Lancet Oncol 12 (12):1109-1117 15. Colombo N, Mangili G, Mammoliti S, Kalling M, Tholander B, Sternas L, Buzenet G, Chamberlain D (2012) A phase II study of aflibercept in patients with advanced epithelial ovarian cancer and symptomatic malignant ascites. Gynecol Oncol 125 (1):42-47 16. Ramlau R, Gorbunova V, Ciuleanu TE, Novello S, Ozguroglu M, Goksel T, Baldotto C, Bennouna J, Shepherd FA, Le-Guennec S, Rey A, Miller V, Thatcher N, Scagliotti G (2012) Aflibercept and docetaxel versus docetaxel alone after platinum failure in patients with advanced or metastatic non-small-cell lung cancer: a randomized, controlled phase III trial. J Clin Oncol 30 (29):3640-3647 17. He K, Cui B, Li G, Wang H, Jin K, Teng L (2012) The effect of anti-VEGF drugs (bevacizumab and aflibercept) on the survival of patients with metastatic colorectal cancer (mCRC). OncoTargets and therapy 5:59-65 18. Wang TF, Lockhart AC (2012) Aflibercept in the treatment of metastatic colorectal cancer. Clin Med Insights 6:19-30

19
19. Van Cutsem E, Tabernero J, Lakomy R, Prenen H, Prausova J, Macarulla T, Ruff P, van Hazel GA, Moiseyenko V, Ferry D, McKendrick J, Polikoff J, Tellier A, Castan R, Allegra C (2012) Addition of aflibercept to fluorouracil, leucovorin, and irinotecan improves survival in a phase III randomized trial in patients with metastatic colorectal cancer previously treated with an oxaliplatin-based regimen. J Clin Oncol 30 (28):3499-3506 20. Thai HT, Veyrat-Follet C, Vivier N, Dubruc C, Sanderink G, Mentre F, Comets E (2011) A mechanism-based model for the population pharmacokinetics of free and bound aflibercept in healthy subjects. British J Clin Pharmacol 72 (3):402-414 21. Lavielle M (2008) MONOLIX (MOdèles NOn LInéaires à effets miXtes). Orsay, France: MONOLIX group. 22. Kuhn E, Lavielle M (2005) Maximum likelihood estimation in nonlinear mixed effects models. Comput Stat Data Anal 49 (4):1020-1038 23. Samson A, Lavielle M, Mentre F (2007) The SAEM algorithm for group comparison tests in longitudinal data analysis based on non-linear mixed-effects model. Stat Med 26 (27):4860-4875 24. Wald A (1943) Tests of statistical hypotheses concerning several parameters when the number of observations is large. Trans Amer Math Soc 54 (3):426-482 25. Brendel K, Comets E, Laffont C, Laveille C, Mentre F (2006) Metrics for external model evaluation with an application to the population pharmacokinetics of gliclazide. Pharm Res 23 (9):2036-2049 26. Comets E, Brendel K, Mentre F (2008) Computing normalised prediction distribution errors to evaluate nonlinear mixed-effect models: the npde add-on package for R. Comput Methods Programs Biomed 90 (2):154-166 27. Comets E, Brendel K, Mentré F (2010) Model evaluation in nonlinear mixed effect models, with applications to pharmacokinetics. J Soc Fr Stat 151:106-128 28. Savic RM, Karlsson MO (2009) Importance of shrinkage in empirical Bayes estimates for diagnostics: problems and solutions. AAPS J 11 (3):558-569 29. Mager DE, Jusko WJ (2001) General pharmacokinetic model for drugs exhibiting target-mediated drug disposition. J Pharmacokinet Pharmacodyn 28 (6):507-532 30. Mager DE (2006) Target-mediated drug disposition and dynamics. Biochem Pharmacol 72 (1):1-10 31. Mager DE, Krzyzanski W (2005) Quasi-equilibrium pharmacokinetic model for drugs exhibiting target-mediated drug disposition. Pharm Res 22 (10):1589-1596 32. Gibiansky L, Gibiansky E, Kakkar T, Ma P (2008) Approximations of the target-mediated drug disposition model and identifiability of model parameters. J Pharmacokinet Pharmacodyn 35 (5):573-591 33. Gibiansky L, Gibiansky E (2010) Target-Mediated Drug Disposition: New Derivation of the Michaelis-Menten Model, and Why It Is Often Sufficient for Description of Drugs with TMDD. PAGE 19, Abstr 1728 [www.page-meeting.org/?abstract=1728] 34. Kut C, Mac Gabhann F, Popel AS (2007) Where is VEGF in the body? A meta-analysis of VEGF distribution in cancer. British J Cancer 97 (7):978-985 35. Stefanini MO, Wu FT, Mac Gabhann F, Popel AS (2008) A compartment model of VEGF distribution in blood, healthy and diseased tissues. BMC Syst Biol 2:77 36. Lu JF, Bruno R, Eppler S, Novotny W, Lum B, Gaudreault J (2008) Clinical pharmacokinetics of bevacizumab in patients with solid tumors. Cancer Chemother Pharmacol 62 (5):779-786

20
37. Fasanmade AA, Adedokun OJ, Ford J, Hernandez D, Johanns J, Hu C, Davis HM, Zhou H (2009) Population pharmacokinetic analysis of infliximab in patients with ulcerative colitis. Eur J Clin Pharmacol 65 (12):1211-1228 38. Kerbel R, Folkman J (2002) Clinical translation of angiogenesis inhibitors. Nat Rev Cancer 2 (10):727-739 39. Li J, Wientjes MG, Au JL (2010) Pancreatic cancer: pathobiology, treatment options, and drug delivery. AAPS J 12 (2):223-232 40. Kindler HL, Niedzwiecki D, Hollis D, Sutherland S, Schrag D, Hurwitz H, Innocenti F, Mulcahy MF, O'Reilly E, Wozniak TF, Picus J, Bhargava P, Mayer RJ, Schilsky RL, Goldberg RM (2010) Gemcitabine plus bevacizumab compared with gemcitabine plus placebo in patients with advanced pancreatic cancer: phase III trial of the Cancer and Leukemia Group B (CALGB 80303). J Clin Oncol 28 (22):3617-3622 41. Rudge JS, Holash J, Hylton D, Russell M, Jiang S, Leidich R, Papadopoulos N, Pyles EA, Torri A, Wiegand SJ, Thurston G, Stahl N, Yancopoulos GD (2007) VEGF Trap complex formation measures production rates of VEGF, providing a biomarker for predicting efficacious angiogenic blockade. Proc Nat Acad Sci USA 104 (47):18363-18370

21
Tables
Table 1. Summary of clinical trials of aflibercept included in the analysis
Study Aflibercept dose (mg/kg)
Dosing frequency
Concomitant chemotherapy
Sampling scheme frequency
Number of patients with PK data
Phase I
TED6115/6116: dose-escalation, solid tumors
2, 3, 4, 5, 7 q2wk single agent full profilea
(n=12-15) 37
TCD6118: dose-escalation, combination, solid tumors
2, 4, 5, 6 q2wk irinotecan/5-FU /LV
full profileb
(n=19) 61
TCD6120: dose-escalation, combination,solid tumors
2, 4, 5, 6, 7, 9 q3wk docetaxel full profilec
(n=12) 53
Phase II
ARD6122: dose-escalation, ovarian cancer
2, 4 q2wk single agent peak (Cycle 1) & multiple troughs
175
ARD6123: NSCLC 4 q2wk single agent peak (Cycle 1) & multiple troughs
77
EFC6125: ovarian cancer with ascites
4 q2wk single agent peak (Cycle 1) & multiple troughs
30
Phase III
VANILLA: combination, pancreatic cancer
4 q2wk gemcitabine peak (Cycle 1) & multiple troughs
204
VITAL: combination, NSCLC
6 q3wk docetaxel peak (Cycle 1) & multiple troughs
370
VELOUR: combination, colorectal cancer
4 q2wk FOLFIRI peak (Cycle 1) & multiple troughs
500
n: number of sampling times per patient, NSCLC: non small cell lung carcinoma, LV: leucovorin, 5-FU: 5-fluorouracil q2wk/q3wk: every two/three weeks, FOLFIRI: combination of irinotecan.5-FU/LV with different doses to that in TCD6118 a For study TED6115, samples were taken at pre-dose and at 1, 2, 4, 8, 24, 30, 48, 96, 168 hours post-dose of the first administration; pre-dose, post-dose and 7 days post-dose of the second administration. For study TED6116, an extension of TED6115, samples were taken prior to and at the end of each cycle in all cohorts and then at the end of the study and 3 months after the last dose. bThis study was in 2 parts, part 1 open-label, multicenter, dose-escalation design and part 2 started double-blind, multicenter, randomized, parallel group, placebo controlled design. For part 1, samples were taken 5 minutes prior to dosing and at 1, 2, 4, 8, 24, 30, and 48 hours, and 7 days after dosing on Day 1 of Cycles 1 and 2. For all subsequent cycles, samples were collected 5 minutes prior to dosing, and at the end of aflibercept treatment. For part 2, samples were taken 5 minutes prior to dosing for all cycles, and at the end of aflibercept treatment, a final sample was collected.
cDuring Cycle 1, samples were taken before administration of aflibercept, and at 1, 2, 4, 8, 24 (Day 2), and 48 hours (Day 3) and 7 (Day 8) and 14 (Day 15) days, after the start of aflibercept infusion. For all subsequent cycles, samples were collected only before the administration of aflibercept.

22
Table 2. Characteristics of the patient study population at the entrance of the trial
Number of
patients (%) Mean ± SD Median (5-95%) Patient demographics Age (years) 59.3 ± 10.3 60.0 (41.0-75.0) Weight (kg) 71.8 ± 16.1 70.0 (49.0-99.1)
< 50 kg 88 (5.8) 50-100 kg 1344 (89.2) >=100 kg 74 (4.9)
Sex Male 767 (50.9) Female 739 (49.1)
Ethnicity Caucasian 1377 (91.4) Black 27 (1.8) Asian 75 (5.0) Other 27 (1.8)
Laboratory measurements Albumin (ALB)* 0.79 ± 0.22 0.80 (0.57-0.97) Alkaline phosphatase (ALK)* 1.18 ± 0.94 0.86 (0.42- 3.32) Alanine amino transferase (ALT)* 0.70 ± 0.53 0.55 (0.22-1.65) Aspartate amino transferase (AST)* 0.88 ± 0.62 0.72 (0.33-2.06) Bilirubin (BIL)* 0.51 ± 0.26 0.46 (0.20-1.00) Total protein (TP)* 0.88 ± 0.10 0.88 (0.74-1.03) Creatitine clearance (CLCR) (mL/min) 89.9 ± 31.5 84.2 (47.9-148) Cancer type
Colorectal 499 (33.1) Non-small cell lung 447 (29.7) Pancreatic 204 (13.5) Ovarian 205 (13.6) Other solid tumors 151 (10.0)
Cancer treatment monotherapy 319 (21.2) combined chemotherapy 1187 (78.8)
docetaxel 423 (28.1) irinotecan/5-FU /LV 61 (4.1) gemcitabine 204 (13.5) FOLFIRI 499 (33.1)
Dose regimen 4 mg/kg q2wk 939 (62.3) 6 mg/kg q3wk 399 (26.5) other multiple doses 168 (11.1)
Pharmacokinetic sampling Intensive 151 (10.0) Peak and trough 1355 (90.0)
*The measurements were normalized to the upper normal limit value of each laboratory

23
Table 3. Parameter estimates of the base and final model
Base model Final model
Parameter Estimate (RSE %) IIV (RSE%) Estimate (RSE %) IIV (RSE %)
CLf (L/day) 0.85 (2) 35.2 (3) 0.88 (2) 30.9 (3)
βCLf, female - - -0.15 (16) -
βCLf, weight - - 0.33 (19) -
βCLf, CLCR - - 0.18 (20) -
βCLf, ALB - - -0.39 (14) -
βCLf, ALK - - 0.10 (18) -
βCLf, ALT - - -0.06 (30) -
βCLf, gemcitabine - - 0.09 (37) -
Vp (L) 3.87 (1) 26.8 (5) 4.35 (2) 22.4 (6)
βVp, female - - -0.21 (12) -
βVp, weight - - 0.39 (16) -
βVp, CLCR - - 0.10 (39) - Q (L/day) 1.68 (8) 81.9 (9) 1.49 (9) 85.5 (9)
Vt (L) 3.75 (5) 64.2 (4) 3.72 (5) 65.8 (4)
Vb (L) 3.92 (10) 29.1 (5) 4.14 (10) 27.5 (6)
Vmax (mg/day) 0.77 (10) - 0.82 (10) -
Km (µg/mL) 1.79 (7) 41.2 (22) 1.92 (9) 28.2 (42)
βKm, female - - -0.23 (35) -
βKm, ALT - - 0.26 (46) -
βKm,AST - - -0.26 (37) -
βKm, gemcitabine - - 0.60 (17) - CLb (L/day) 0.18 (10) 23.5 (3) 0.19 (10) 22.3 (3)
βCLb,age - - 0.18 (26) -
βCLb,CLCR - - 0.09 (31) -
βCLf, ALB - - -0.13 (33) -
βCLf,ALT - - -0.08 (27) -
βCLf, irinotecan/5-FU/LV - - -0.13 (26) -
βCLf, docetaxel - - 0.06 (30) -
σfa (µg/mL) 0.04 (6) - 0.04 (6) -
σfp (%) 32.90 (1) - 32.80 (1) -
σba (µg.eq/mL) 0.34 (2) - 0.34 (2) -
σbp (%) 9.01 (4) - 9.04 (4) -

24
Table 4. Assessment of covariate effects on aflibercept pharmacokinetic parameters
Covariate Quantiles CL f (L/day)
% Change
Vp (L)
% Change
K m (µg/mL)
% Change
CL b (L/day)
% Change
Typical patient*
0.88 4.35 1.92 0.19
Sex Female 0.76 -14.1 3.53 -18.9 1.53 -20.2 - WT 5%: 49 0.79 -11.0 3.78 -13.1 - -
95%: 99.1 1.00 12.0 4.99 14.6 Age 5%: 41 - - - 0.18 -6.6
95%: 75 0.20 4.1 CLCR 5%: 47.9 0.80 -9.3 4.13 -5.1 - 0.18 -4.6
95%: 148.1 0.98 11.2 4.60 5.9 0.20 5.2 ALB 5%: 0.57 1.00 14.1 - - 0.20 4.6
95%: 0.965 0.82 -7.0 0.19 -2.5 ALK 5%: 0.423 0.82 -7.0 - - -
95%: 3.233 1.01 14.4 ALT 5%: 0.222 0.93 5.8 - 1.52 -20.6 0.20 7.6
95%: 1.646 0.82 -6.6 2.54 32.5 0.17 -8.5 AST 5%: 0.333 - - 2.35 22.3 -
95%: 2.058 1.46 -24.0 Combination gemcitabine 0.96 9.2 - 3.49 82.0 -
irinotecan/ 5-FU/LV - - - 0.17 -12.5
docetaxel - - - 0.20 6.5
*: male, 60 years, 70 kg, normalized ALB of 0.80, normalized ALK of 0.86, normalized ALT of 0.55, normalized AST of 0.72, CLCR of 82.2 mL/min, receiving aflibercept as a monotherapy
theoretical effect (% change with respect to the typical value) of the covariate considered alone, the other covariate being set to its median value
% changes in PK parameters greater than 20% are presented in bold

25
Figure legends
Figure 1
Proposed structural model for free and bound aflibercept. Free aflibercept in plasma distributes
first to tissues then binds to VEGF to form a complex. Binding to VEGF occurs in the peripheral
compartment, follows the law of mass action and can be characterised by a nonlinear equation
with MM constants (Vmax, Km). Bound aflibercept (complex) is assumed to be directly eliminated
through internalisation (kint).
Figure 2
Goodness-of-fit plots: (top) observed versus predicted concentrations for free aflibercept;
(bottom) observed versus predicted concentrations for bound aflibercept. The plots on the left
present observed versus the population predicted concentration (PRED) while the plots on the
right present observed versus individual predicted concentrations (IPRED). One outlier was
removed from the plots.
Figure 3
Normalised prediction distribution error (NPDE) vs time since last dose (TimeL) for free
aflibercept (top) and bound aflibercept (bottom) with 95% prediction intervals around the the
10th, 50th ,90th percentiles. NPDE plots for TimeL ≤ 22 weeks are presented in the left and for
TimeL ≤ 6 weeks in the right. Observed data are plotted using a circle (). The solid line
represents the 10th, 50th and 90th percentiles of the npde corresponding to observed data. The
shaded area represents 95% prediction intervals for the selected percentiles (pink for 50th
percentiles and blue for others).
Figure 4
Examples of individual fits of free and bound aflibercept for 4 subjects in different studies. From
left to right: study TED6115 (phase I), study ARD6123 (phase II), study Vital (phase III), and
study VELOUR (phase III). Fits for free aflibercept are presented in the top, bound afibercept in
the bottom. Observed data are plotted using a circle (). The line (−) represents the prediction of
model.
26
Figure 5
Predicted median profiles of bound aflibercept at steady-state with different dosing regimens (2,
4, 6 mg/kg q2wk or q3wk) illustrated by vertical lines to x-axis (blue for q2wk and grey for q3wk
dosing regimen).
Figure 6
Predicted steady-state concentrations of free aflibercept (left y-axis) and bound aflibercept (right
y-axis) following 8 aflibercept doses of 4mg/kg q2wk during 24 weeks.

27
Figures
Figure 1.
Plasma free aflibercept
Cp, Vp
Tissue free aflibercept
Ct, Vt
Boundaflibercept
Cb, Vb
Vmax, Km
kintkel
kpt
ktp
Infusion
28
Figure 2.
29
Figure 3.
30
Figure 4.
0 2 4 6 8 10
Time (weeks)
Fre
e af
liber
cept
con
c (µ
g/m
L)
0.01
0.1
1
10
100
1000
0 5 10 15 20
Time (weeks)
Fre
e af
liber
cept
con
c (µ
g/m
L)
0.01
0.1
1
10
100
1000
0 5 10 20 30
Time (weeks)
Fre
e af
liber
cept
con
c (µ
g/m
L)
0.01
0.1
1
10
100
1000
0 10 20 30 40
Time (weeks)
Fre
e af
liber
cept
con
c (µ
g/m
L)
0.01
0.1
1
10
100
1000
0 2 4 6 8 10
0
1
2
3
4
Time (weeks)
Bou
nd a
flibe
rcep
t co
nc (
µg.
eq/m
L)
0 5 10 15 20
0
1
2
3
4
Time (weeks)
Bou
nd a
flibe
rcep
t co
nc (
µg.
eq/m
L)
0 5 10 20 30
0
1
2
3
4
Time (weeks)
Bou
nd a
flibe
rcep
t co
nc (
µg.
eq/m
L)
0 10 20 30 40
0
1
2
3
4
Time (weeks)
Bou
nd a
flibe
rcep
t co
nc (
µg.
eq/m
L)

31
Figure 5. 0
12
34
Time (weeks)
Pre
dic
ted
bo
und
afli
berc
ept
co
nc (µ
g.eq
/mL)
0 2 4 6 8 10 12 14 16 18 20 22 24
6mg/kg q2wk4mg/kg q2wk2mg/kg q2wk6mg/kg q3wk4mg/kg q3wk2mg/kg q3wk
32
Figure 6.
020
4060
8010
012
014
0
Time (weeks)
Pre
dict
ed
free
afli
ber
cep
t co
nc (µ
g/m
L)
0 2 4 6 8 10 12 14 16 18 20 22 24
Median: Free aflibercept5-95th Percentile: Free afliberceptMedian: Bound aflibercept5-95th Percentile: Bound aflibercept
020
4060
8010
012
014
0
Pre
dict
ed
bou
nd a
flib
erce
pt c
onc
(µg.
eq/m
L)