Embed Size (px)
Citation preview
ORIGINAL RESEARCH ARTICLE
A Population Pharmacokinetic and Pharmacodynamic ModellingApproach to Support the Clinical Development of RBP-6000,a New, Subcutaneously Injectable, Long-Acting, Sustained-Release Formulation of Buprenorphine, for the Treatmentof Opioid Dependence
Azmi F. Nasser • Christian Heidbreder •
Roberto Gomeni • Paul J. Fudala • Bo Zheng •
Mark K. Greenwald
Published online: 12 July 2014
� Springer International Publishing Switzerland 2014
Abstract
Background and Objectives This study implemented
pharmacokinetic/pharmacodynamic modelling to support
the clinical development of RBP-6000, a new, long-acting,
sustained-release formulation of buprenorphine for the
treatment of opioid dependence. Such a formulation could
offer advantages over existing buprenorphine pharmaco-
therapy by improving patient compliance and reducing the
diversion of the product.
Methods A population pharmacokinetic model was devel-
oped using 36 opioid-dependent subjects who received single
subcutaneous doses of RBP-6000. Another pharmacokinetic/
pharmacodynamic model was developed using l-opioid
receptor occupancy (lORO) data to predict efficacy of RBP-
6000 after repeated doses. It was also assessed how bupr-
enorphine plasma concentrations were correlated with opioid
withdrawal symptoms and hydromorphone agonist blockade
data from 15 heroin-dependent subjects.
Results The resulting pharmacokinetic model accurately
described buprenorphine and norbuprenorphine plasma
concentrations. A saturable maximum effect (Emax) model
with 0.67 ng/mL effective concentration at 50 % of max-
imum (EC50) and 91 % Emax best described lORO versus
buprenorphine plasma concentrations. Linear relationships
were found among lORO, withdrawal symptoms and
blockade of agonist effects.
Conclusion Previously published findings have demon-
strated lORO C70 % is needed to achieve withdrawal
suppression and blockade of opioid agonist subjective
effects. Model simulations indicated that a 200 mg RBP-
6000 dose should achieve 2–3 ng/mL buprenorphine
average concentrations and desired efficacy.
Key Points
This study demonstrated the relationship among
buprenorphine plasma concentrations, l-opioid
receptor occupancy (lORO) and blockade of opioid
agonist effects.
A saturable maximum effect (Emax) model was
established between buprenorphine plasma levels
and lORO. The desired buprenorphine activity was
achieved at lORO C70 %. A buprenorphine plasma
concentration of 2 ng/mL is required to achieve a
lORO of approximately 70 %.
This analysis provided new insight into the long-
acting pharmacokinetic and pharmacokinetic/lORO
profiles of RBP-6000.
1 Introduction
Opioid addiction is a neurobehavioural syndrome charac-
terized by repeated compulsive seeking and use of an
A. F. Nasser (&) � C. Heidbreder � P. J. Fudala � B. Zheng
Reckitt Benckiser Pharmaceuticals Inc., 10710 Midlothian
Turnpike, Suite 430, Richmond, VA 23235, USA
e-mail: [email protected]
R. Gomeni
Alleantis, Research Triangle Park, NC 27709, USA
M. K. Greenwald
Wayne State University, Detroit, MI 48202, USA
Clin Pharmacokinet (2014) 53:813–824
DOI 10.1007/s40262-014-0155-0
opioid despite adverse social, psychological and/or physi-
cal consequences. Opioid addiction is a problem with high
costs to individuals, families and society. The use of pre-
scription opioids has tremendously increased in the past
decade in the USA (from 174 million in 2000 to 257
million in 2009) because of the widespread availability and
variety of prescription opioid products, and changes in
treatment paradigms [1]. Opioid abuse, addiction, overdose
and other health and social consequences of opioid misuse
are taking a rapidly growing toll on individuals and insti-
tutions in the USA. It is estimated that 2.2–2.4 million
individuals initiate non-medical use of opioids in the USA
each year and non-medical opioid use now exceeds use of
many conventional street drugs, including cocaine and
heroin [2]. Overdose deaths from prescription drugs have
exceeded those from street drugs since 2002 and have
surpassed traffic accidents as a cause of accidental death [3,
4]. In 2011, over 1,252,500 of 2.5 million emergency
department (ED) visits associated with drug abuse or
addiction involved illicit drugs, including 258,482 ED
visits related to heroin and about 420,040 ED visits related
to narcotic pain relievers [5].
Opioid receptors are located in both the central nervous
system (CNS) and the periphery. In the CNS, they are
found in high concentrations in the limbic system and the
spinal cord. The natural ligands for the opioid receptors are
a group of neuropeptides known as endorphins. Opioid
analgesics mimic the action of these natural ligands, but
have a more prolonged action as they are not subject to
rapid local metabolism. Three major opioid receptor sub-
classes have been identified: l-, j- and d-. Buprenorphine
is a partial opioid agonist at the l-opioid receptor, with
antagonist properties at the j-opioid receptor. In contrast to
a full agonist, buprenorphine at the l-opioid receptor has
less maximal euphoric effect, and a ceiling on its respira-
tory depressant effects [6]. By binding to l-opioid recep-
tors in the brain, buprenorphine reduces craving for opioids
and opiate withdrawal symptoms, minimizing the need for
opioid-dependent patients to use illicit opiate drugs. For the
maintenance treatment of opioid dependence, sublingual
buprenorphine or buprenorphine/naloxone is typically
given as a single daily dose ranging from 4 to 24 mg per
day, with the recommended buprenorphine dosage being
16 mg per day [7].
A major issue in the pharmacological treatment of opi-
oid dependence is the high rate of non-adherence [8, 9].
Currently, there is no approved, parenterally administered,
sustained-release buprenorphine product indicated for the
treatment of opioid dependence. Such a product could offer
advantages over existing buprenorphine pharmacotherapy
by improving patient compliance and reducing diversion,
abuse and unintended exposure, particularly regarding
children. In this respect, a new, sustained-release
formulation of buprenorphine, RBP-6000, is being devel-
oped for injection by the subcutaneous route. RBP-6000
contains 200 mg/mL of buprenorphine base in the ATRI-
GEL� Delivery System and provides sustained release of
buprenorphine over a minimum of 28 days. Following
administration of RBP-6000, day-to-day compliance over
the ensuing month would not be a potential issue as it is
with existing products that are administered sublingually
on a daily basis. Also, since RBP-6000 contains bupr-
enorphine base in a sustained-release delivery system
(ATRIGEL�), the safety profile and clinical efficacy of
RBP-6000 are expected to be similar to those of sublin-
gually administered buprenorphine and buprenorphine/
naloxone treatment.
The primary goal of the present study was to develop a
model-based approach to rationally support and justify the
dose and dosing regimen of RBP-6000 in phase 2 and 3
trials. For this purpose, a modelling strategy was imple-
mented to characterize the population pharmacokinetics of
buprenorphine and norbuprenorphine (a major metabolite),
and to assess the relationship between buprenorphine and
l-opioid receptor occupancy (lORO). In addition, the
relationship between plasma concentration, lORO, with-
drawal symptoms and attenuation (i.e. blockade) of
hydromorphone challenge agonist effects was explored.
Trial simulations were used for predicting the expected
lORO after repeated subcutaneous injections of different
doses of RBP-6000 administered once monthly. The
model-based approach aimed to determine the RBP-6000
dosage range that is expected to sustain a lORO level of
70 % and to establish the corresponding levels of with-
drawal symptom suppression and blockade of the effects of
exogenously administered opioids.
2 Methods
2.1 Study Design
The clinical study protocol, informed consent forms and all
other appropriate study-related documents were reviewed
and approved by an independent and appropriately con-
stituted institutional review board (IRB). The IRB was
constituted and operated in accordance with the principles
and requirements described in the US Code of Federal
Regulations (21 CFR Part 56). The study was conducted in
accordance with good clinical practice (GCP) as required
by US Food and Drug Administration (FDA) regulations,
International Conference on Harmonisation (ICH) guide-
lines and standard operating procedures for clinical inves-
tigation and documentation in force at Reckitt Benckiser
Pharmaceuticals Inc. (RBP). Compliance with these
requirements also indicated conformity with the ethical
814 A. F. Nasser et al.
principles that have their origins in the Declaration of
Helsinki. Informed consent was obtained before a subject
was enrolled in the study and prior to the commencement
of any protocol-driven activities. The investigator (or
designated staff member) met with the subject and
explained the study in sufficient detail to permit an
informed decision to participate.
The present study was a single-centre, open-label,
sequential-cohort, single-ascending-dose study. Thirty-six
opioid-dependent (by Diagnostic and Statistical Manual of
Mental Disorders, Fourth Edition, Text Revision criteria)
subjects were randomized to receive 50, 100 or 200 mg of
RBP-6000. Subjects in each cohort received a single sub-
cutaneous dose of RBP-6000 on day 1. On day 1, blood
samples for measuring plasma concentrations were drawn
at 0.5, 1, 2, 4, 6, 8 and 12 h post-dose, daily on day 2
through day 22, and on days 25, 28, 31, 35, 42, 49, 56, 63,
70, 77, 84, 112, 140 and 150. Human ethylenediaminete-
traacetic acid (EDTA)-treated plasma samples were ana-
lysed for buprenorphine and norbuprenorphine using a
validated liquid chromatography coupled to tandem mass
spectrometry (LC–MS/MS) method. Human plasma con-
taining buprenorphine, norbuprenorphine and the internal
standards, buprenorphine-D4 and norbuprenorphine-D3,
was extracted with an organic solvent mixture after the
addition of sodium hydroxide solution (liquid–liquid
extraction). After extraction, the extract was evaporated
and reconstituted, and an aliquot was injected on a Sciex
API 5000 LC–MS/MS equipped with an ultra-performance
liquid chromatography column. Quantitation was per-
formed using separate weighted (1/x2 for buprenorphine
and 1/x for norbuprenorphine) linear least squares regres-
sion analyses generated from fortified plasma calibration
standards prepared immediately prior to each run. The
method was validated for specificity, linearity, lower limit
of quantitation, precision, accuracy, recovery and stability
for ranges of 0.0250–5.0 ng/mL for buprenorphine and
0.0200–4.00 ng/mL for norbuprenorphine, based on the
analysis of 0.500 mL of plasma. The overall precision for
both analytes was better than 6.3 %; the overall accuracy
was within ±10.3 %. The recoveries for both analytes and
internal standards were above 80 %. The established short-
term and long-term stability covered the maximum sample
storage time (methods unpublished).
2.2 Population Pharmacokinetic Analysis
All data preparation, summary statistics (mean, median,
standard deviation and other measures, as appropriate),
logistic regression analysis, reports and graphical display
presentation were performed using R version 2.14.1 soft-
ware [10]. The population pharmacokinetic analysis was
conducted using NONMEM version 7.2 software [11].
NONMEM was run in a Windows Vista operating system
using the Fortran compiler gfortran version 4.6.0. Diag-
nostic graphics, exploratory analyses and post-processing
of NONMEM outputs were performed using R and Xpose
version 4.3 software [12]. The Perl-based software Perl-
speaks-NONMEM (PsN) version 3.4.2 was used to perform
bootstrapping and visual predictive checks (VPCs) [13].
The first-order conditional estimation (FOCE) with
interaction (FOCE-I) method was used for estimating the
fixed- and random-effect parameters using a nonlinear
mixed-effect approach. Appropriateness of the model was
evaluated using various goodness-of-fit criteria, including
diagnostic scatter plots, likelihood ratio tests (LRTs) and
measures of model stability and adequacy (successful
convergence, significant digits, matrix singularity). The
results of LRTs were considered statistically significant if
decreases in the objective function value (OFV) of nested
models were more than 3.84 (P \ 0.05, 1 degree of free-
dom) throughout the model-building process.
The inter-individual variability on all the model
parameters was assumed to be log-normally distributed.
The residual variability, which comprised, but was not
limited to, intra-individual variability, experimental errors,
process noise and/or model misspecifications, was mod-
elled using additive, proportional and combined error
structures.
2.3 Handling of Outliers
An outlier was defined as an aberrant observation that sig-
nificantly deviated from the rest of observations in a par-
ticular individual and did not refer to a subject as an outlier.
The proportion of outliers in a data set should be low and
such points may be excluded from the analysis given the
potential for these observations to negatively impact the
convergence and/or parameter estimates (i.e. which may
cause a bias) [14]. Outlier detection was based initially on
visual examination of individual and pooled pharmacoki-
netic profiles. Additionally, data points identified with an
absolute conditional weighted residual (|CWRES|) [3
during the initial model-building process were excluded
from the analysis. The CWRES are weighted residuals
calculated using the FOCE method and have been shown to
represent a reliable estimate of the distribution of residuals
[15]. Given the theoretical distribution of CWRES, it is
expected that 99.73 % of the CWRES should lie within the
interval -3 to 3; for this reason, values outside this interval
were considered as outliers.
2.4 Base Structural Model Development
Buprenorphine is metabolized primarily by cytochrome
P450 3A4 to norbuprenorphine [16]. Buprenorphine
Population Pharmacokinetic/Pharmacodynamic Model of RBP-6000 815
undergoes extensive first pass in the liver, thus it is
administered sublingually with 50–60 % bioavailability.
The population pharmacokinetic model was developed to
describe simultaneously the concentrations of buprenor-
phine and norbuprenorphine.
2.5 Covariate Analysis
Age, sex, race and dose were considered in the covariate
analysis. Covariate model-building was a step-wise process
consisting of a forward and a backward selection proce-
dure. The LRT was used to evaluate the significance of
incorporating or removing fixed effects in the population
model based on alpha levels that were set a priori. Initially,
each covariate was individually included in the base model.
A covariate was retained in the model if a reduction in the
OFV was C3.84 (v2 \ 0.05). After defining the full model,
the significance of each covariate was tested individually
by removing each one from the full model. A covariate was
retained in the model if, upon removal, the OFV increased
by more than 6.64 points (v2 \ 0.001).
2.6 Model Evaluation
A non-parametric bootstrap resampling method was used to
evaluate the stability and robustness of the final pharma-
cokinetic model [17]. Resampling with replacement gen-
erated 100 bootstrap data sets and the final population
pharmacokinetic model was fitted repeatedly to each of the
100 bootstrap data sets. The medians and 95 % confidence
intervals of parameters obtained from this step were com-
pared with the final parameter estimates. In addition, a
VPC was also performed. Results from the VPC were
assessed using graphical comparison of the appropriate
90 % prediction intervals from simulated data with over-
laid observed data from the original data set.
2.7 Pharmacodynamics: Pharmacokinetics, l-Opioid
Receptor Occupancy, Opioid Withdrawal
Syndrome and Agonist Effects
It is recognized that the medication-assisted treatment of
opioid dependence is related to the opioid pharmacother-
apy occupying brain l-opioid receptors. The level of
receptor occupancy is expected to mediate the abuse and
dependence potential of opioids and to predict clinical
efficacy. Specifically, higher medication doses are
hypothesized to decrease l-opioid receptor availability (or
‘binding potential’) and provide agonist replacement that
minimizes withdrawal symptoms and prevents the rein-
forcing, euphoric and other effects of abused opioids
resulting in greater clinic attendance [18]. Opioid with-
drawal symptoms are the body’s physical response to the
absence of the opioid, which include muscle aches, restless
anxiety, diarrhoea, abdominal cramping, nausea and vom-
iting. In clinical trials, subjective opioid withdrawal scales
are used to quantify these withdrawal effects. In addition,
the blockade of hydromorphone challenge agonist effects is
measured by subjective drug-effect assessments, which
often employ ratings on visual analogue scales using
adjectives that reflect abuse potential such as ‘liking’ or
‘good effect’. These measures are quantitative and exhibit
dose–response sensitivity to opioid exposure.
The experimental individual values for buprenorphine
plasma concentrations, lORO, opioid withdrawal syn-
drome and opioid-like agonist effects were provided from
two previously published clinical trials by coauthor M.K.G.
In trial 1, five heroin-dependent subjects underwent bupr-
enorphine induction from 4 mg/day on day 1 to 16 mg/day
by day 7 and were maintained at 32 mg/day for 12 days.
On the eighth day of the maintenance period, subjects were
challenged with the opioid agonist hydromorphone and
subjective drug effects were ascertained, and on day 9,
blood samples for the measurement of buprenorphine and
norbuprenorphine were collected following buprenorphine
administration. On the 10th and 11th days of the mainte-
nance period, opioid withdrawal symptoms were measured
prior to buprenorphine administration and 1, 2, 3, 6 and
12 h afterwards. On the 12th and final day of the mainte-
nance period, a positron emission tomography (PET) scan
with [11C]-carfentanil was administered 4 h after bupr-
enorphine administration to measure lORO. Subjects were
titrated down to the subsequent maintenance periods at
buprenorphine doses of 16 mg/day for 12 days, 2 mg/day
for 12 days and 0 mg/day for 12 days. During each sub-
sequent maintenance period, subjects underwent the
hydromorphone challenge, measurement of opioid with-
drawal symptoms and a PET scan [18].
In trial 2, ten heroin-dependent subjects were initially
maintained for C2 weeks on 16 mg/day buprenorphine
given as sublingual tablets. Plasma buprenorphine con-
centrations, opioid withdrawal symptoms and four hydro-
morphone challenges (to measure subjective opioid agonist
drug effects) or four PET brain scans with [11C]-carfentanil
(to measure lORO) were conducted at 4, 28, 52 and 76 h
after the last daily buprenorphine dose. In addition to
characterizing the relationship between buprenorphine
plasma concentration and lORO, the study assessed the
relationship between lORO and two key clinical effects—
opioid withdrawal syndrome and blockade of hydromor-
phone agonist subjective drug effects [19].
In both trials, opioid agonist and withdrawal symptoms
were assessed by using an Opioid Symptom Questionnaire
with 16 agonist and 16 withdrawal scale items. Each item
was scored from 0 (‘not at all’) to 4 (‘extremely’), yielding
total scores ranging from 0 to 64. Buprenorphine
816 A. F. Nasser et al.
attenuation (blockade) of hydromorphone agonist effects
was measured by six visual analogue scale ratings includ-
ing ‘any drug effect’, ‘high’, ‘good drug effect’, ‘bad drug
effect’, ‘stimulated’ and ‘sedated’ [18, 19]. From both
trials, whole-brain imaging results were used to calculate
l-opioid receptor availability. The percentage lORO was
calculated as (100 minus l-opioid receptor availability).
3 Results
3.1 Population Pharmacokinetic Modelling
Table 1 presents a demographic summary of the subjects
included in the analysis. The analysis data set included 36
subjects for a total of 2,797 observations with 66 obser-
vations below the lower limit of quantification. These
values were considered as missing in the NONMEM ana-
lysis. The buprenorphine and norbuprenorphine measure-
ments were simultaneously fitted using the ADVAN5
TRANS1 routine in NONMEM. The absorption of RBP-
6000 from the subcutaneous injection site was described by
a dual model that was described by a first-order absorption
process associated with the rapid absorption and the first
observed peak; and a delayed delivery process that was
described by a transit compartment absorption model to
mimic the ATRIGEL� Delivery System [20]. The dispo-
sition model was a one-compartment model with first-order
elimination and first-order conversion to norbuprenorphine.
This metabolite was subsequently distributed in a periph-
eral compartment and eliminated according to a first-order
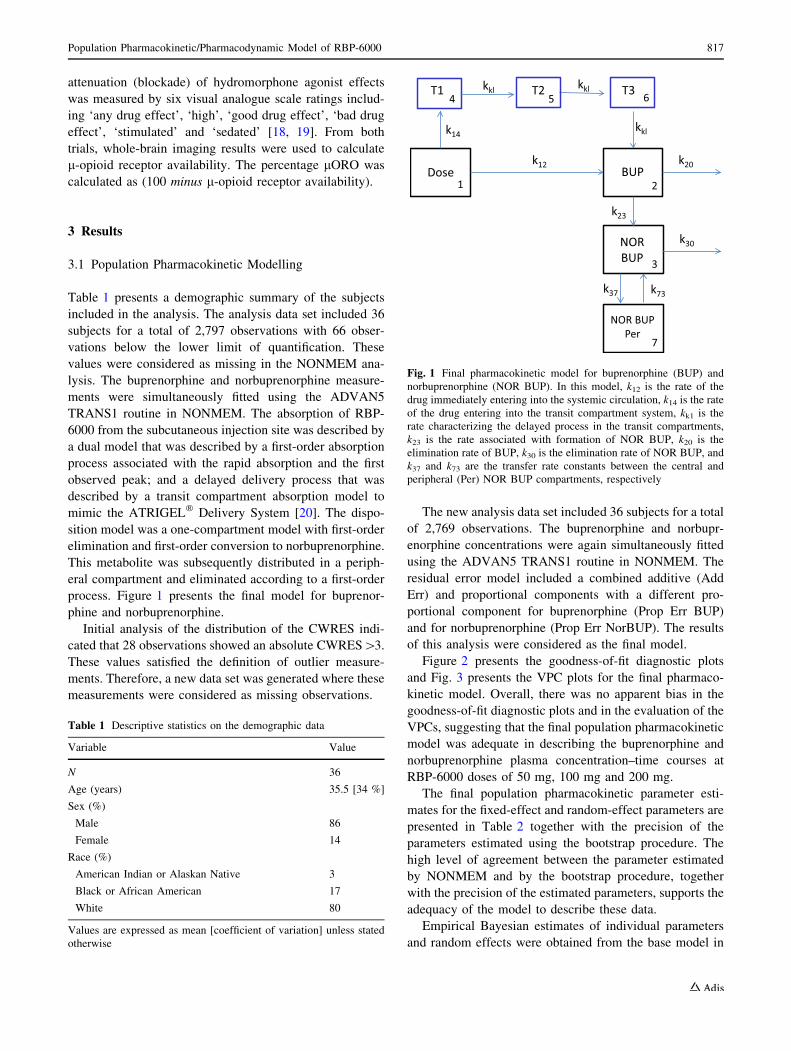
process. Figure 1 presents the final model for buprenor-
phine and norbuprenorphine.
Initial analysis of the distribution of the CWRES indi-
cated that 28 observations showed an absolute CWRES[3.
These values satisfied the definition of outlier measure-
ments. Therefore, a new data set was generated where these
measurements were considered as missing observations.
The new analysis data set included 36 subjects for a total
of 2,769 observations. The buprenorphine and norbupr-
enorphine concentrations were again simultaneously fitted
using the ADVAN5 TRANS1 routine in NONMEM. The
residual error model included a combined additive (Add
Err) and proportional components with a different pro-
portional component for buprenorphine (Prop Err BUP)
and for norbuprenorphine (Prop Err NorBUP). The results
of this analysis were considered as the final model.
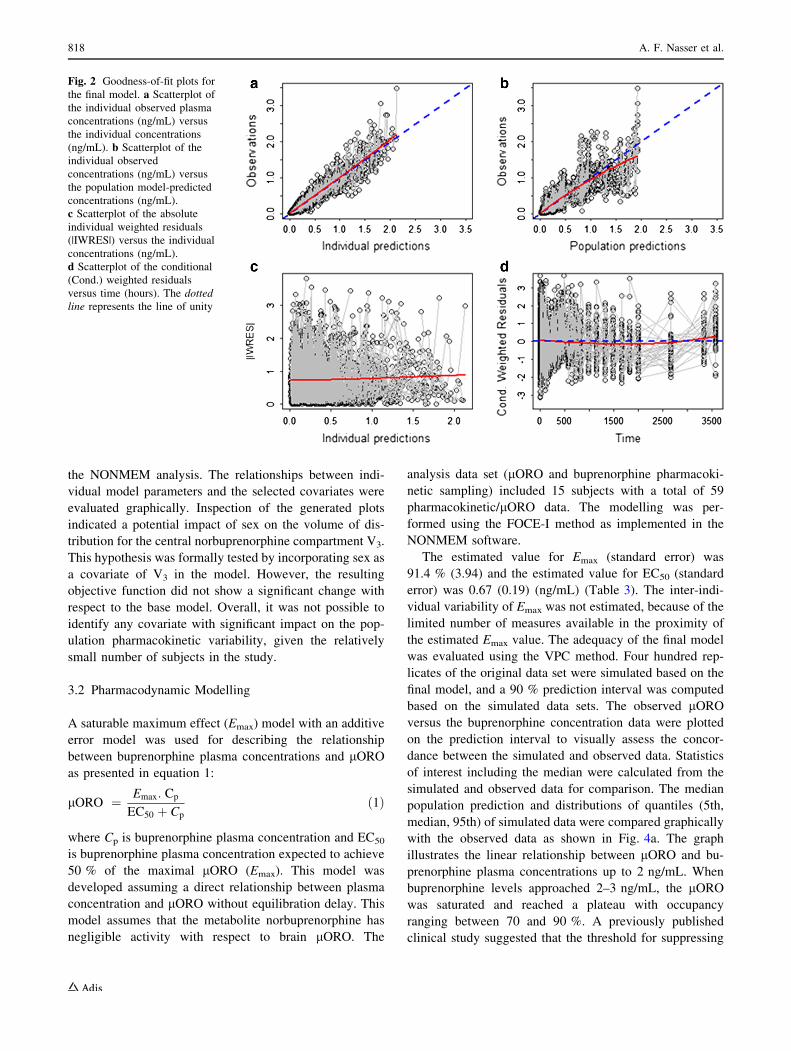
Figure 2 presents the goodness-of-fit diagnostic plots
and Fig. 3 presents the VPC plots for the final pharmaco-
kinetic model. Overall, there was no apparent bias in the
goodness-of-fit diagnostic plots and in the evaluation of the
VPCs, suggesting that the final population pharmacokinetic
model was adequate in describing the buprenorphine and
norbuprenorphine plasma concentration–time courses at
RBP-6000 doses of 50 mg, 100 mg and 200 mg.
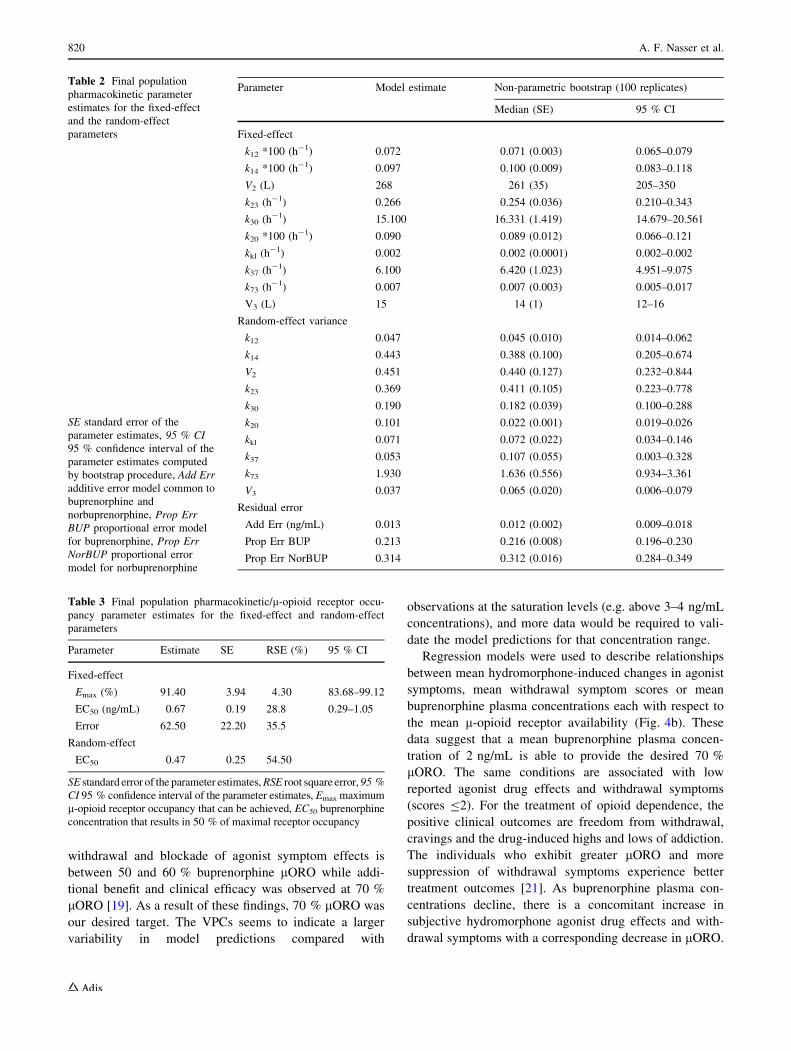
The final population pharmacokinetic parameter esti-
mates for the fixed-effect and random-effect parameters are
presented in Table 2 together with the precision of the
parameters estimated using the bootstrap procedure. The
high level of agreement between the parameter estimated
by NONMEM and by the bootstrap procedure, together
with the precision of the estimated parameters, supports the
adequacy of the model to describe these data.
Empirical Bayesian estimates of individual parameters
and random effects were obtained from the base model in
Fig. 1 Final pharmacokinetic model for buprenorphine (BUP) and
norbuprenorphine (NOR BUP). In this model, k12 is the rate of the
drug immediately entering into the systemic circulation, k14 is the rate
of the drug entering into the transit compartment system, kk1 is the
rate characterizing the delayed process in the transit compartments,
k23 is the rate associated with formation of NOR BUP, k20 is the
elimination rate of BUP, k30 is the elimination rate of NOR BUP, and
k37 and k73 are the transfer rate constants between the central and
peripheral (Per) NOR BUP compartments, respectively
Table 1 Descriptive statistics on the demographic data
Variable Value
N 36
Age (years) 35.5 [34 %]
Sex (%)
Male 86
Female 14
Race (%)
American Indian or Alaskan Native 3
Black or African American 17
White 80
Values are expressed as mean [coefficient of variation] unless stated
otherwise
Population Pharmacokinetic/Pharmacodynamic Model of RBP-6000 817
the NONMEM analysis. The relationships between indi-
vidual model parameters and the selected covariates were
evaluated graphically. Inspection of the generated plots
indicated a potential impact of sex on the volume of dis-
tribution for the central norbuprenorphine compartment V3.
This hypothesis was formally tested by incorporating sex as
a covariate of V3 in the model. However, the resulting
objective function did not show a significant change with
respect to the base model. Overall, it was not possible to
identify any covariate with significant impact on the pop-
ulation pharmacokinetic variability, given the relatively
small number of subjects in the study.
3.2 Pharmacodynamic Modelling
A saturable maximum effect (Emax) model with an additive
error model was used for describing the relationship
between buprenorphine plasma concentrations and lORO
as presented in equation 1:
lORO ¼ Emax: Cp
EC50 þ Cp
ð1Þ
where Cp is buprenorphine plasma concentration and EC50
is buprenorphine plasma concentration expected to achieve
50 % of the maximal lORO (Emax). This model was
developed assuming a direct relationship between plasma
concentration and lORO without equilibration delay. This
model assumes that the metabolite norbuprenorphine has
negligible activity with respect to brain lORO. The
analysis data set (lORO and buprenorphine pharmacoki-
netic sampling) included 15 subjects with a total of 59
pharmacokinetic/lORO data. The modelling was per-
formed using the FOCE-I method as implemented in the
NONMEM software.
The estimated value for Emax (standard error) was
91.4 % (3.94) and the estimated value for EC50 (standard
error) was 0.67 (0.19) (ng/mL) (Table 3). The inter-indi-
vidual variability of Emax was not estimated, because of the
limited number of measures available in the proximity of
the estimated Emax value. The adequacy of the final model
was evaluated using the VPC method. Four hundred rep-
licates of the original data set were simulated based on the
final model, and a 90 % prediction interval was computed
based on the simulated data sets. The observed lORO
versus the buprenorphine concentration data were plotted
on the prediction interval to visually assess the concor-
dance between the simulated and observed data. Statistics
of interest including the median were calculated from the
simulated and observed data for comparison. The median
population prediction and distributions of quantiles (5th,
median, 95th) of simulated data were compared graphically
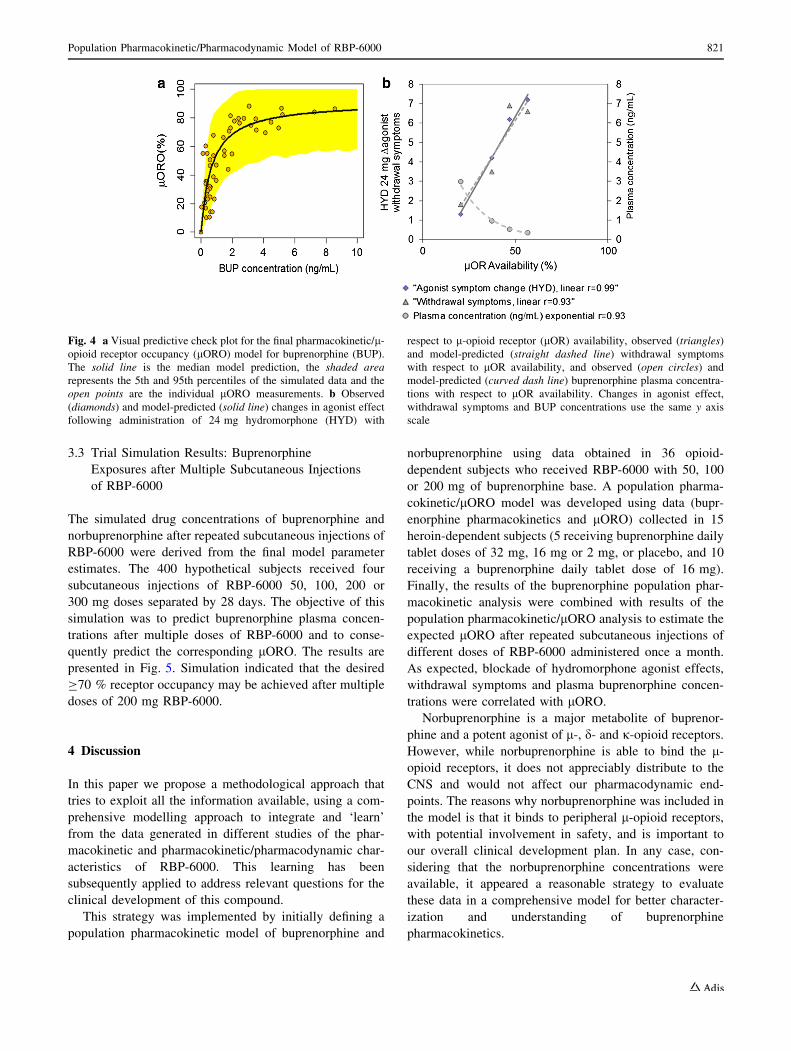
with the observed data as shown in Fig. 4a. The graph
illustrates the linear relationship between lORO and bu-
prenorphine plasma concentrations up to 2 ng/mL. When
buprenorphine levels approached 2–3 ng/mL, the lORO
was saturated and reached a plateau with occupancy
ranging between 70 and 90 %. A previously published
clinical study suggested that the threshold for suppressing
Fig. 2 Goodness-of-fit plots for
the final model. a Scatterplot of
the individual observed plasma
concentrations (ng/mL) versus
the individual concentrations
(ng/mL). b Scatterplot of the
individual observed
concentrations (ng/mL) versus
the population model-predicted
concentrations (ng/mL).
c Scatterplot of the absolute
individual weighted residuals
(|IWRES|) versus the individual
concentrations (ng/mL).
d Scatterplot of the conditional
(Cond.) weighted residuals
versus time (hours). The dotted
line represents the line of unity
818 A. F. Nasser et al.
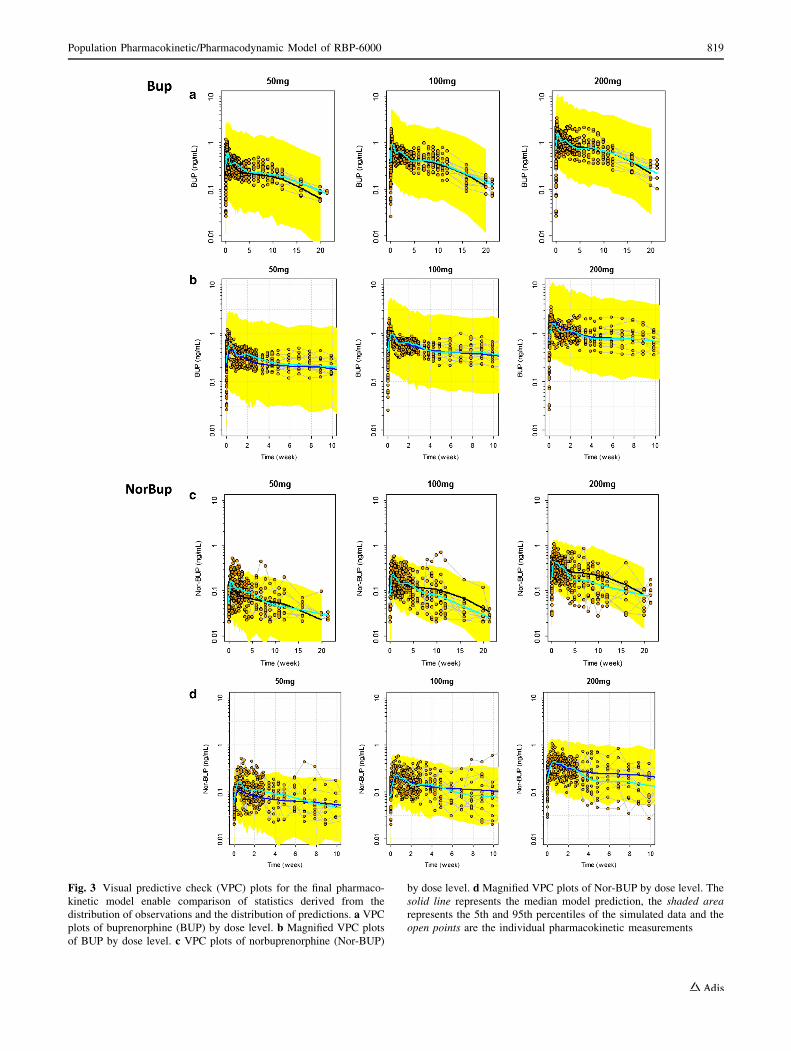
Fig. 3 Visual predictive check (VPC) plots for the final pharmaco-
kinetic model enable comparison of statistics derived from the
distribution of observations and the distribution of predictions. a VPC
plots of buprenorphine (BUP) by dose level. b Magnified VPC plots
of BUP by dose level. c VPC plots of norbuprenorphine (Nor-BUP)
by dose level. d Magnified VPC plots of Nor-BUP by dose level. The
solid line represents the median model prediction, the shaded area
represents the 5th and 95th percentiles of the simulated data and the
open points are the individual pharmacokinetic measurements
Population Pharmacokinetic/Pharmacodynamic Model of RBP-6000 819
withdrawal and blockade of agonist symptom effects is
between 50 and 60 % buprenorphine lORO while addi-
tional benefit and clinical efficacy was observed at 70 %
lORO [19]. As a result of these findings, 70 % lORO was
our desired target. The VPCs seems to indicate a larger
variability in model predictions compared with
observations at the saturation levels (e.g. above 3–4 ng/mL
concentrations), and more data would be required to vali-
date the model predictions for that concentration range.
Regression models were used to describe relationships
between mean hydromorphone-induced changes in agonist
symptoms, mean withdrawal symptom scores or mean
buprenorphine plasma concentrations each with respect to
the mean l-opioid receptor availability (Fig. 4b). These
data suggest that a mean buprenorphine plasma concen-
tration of 2 ng/mL is able to provide the desired 70 %
lORO. The same conditions are associated with low
reported agonist drug effects and withdrawal symptoms
(scores B2). For the treatment of opioid dependence, the
positive clinical outcomes are freedom from withdrawal,
cravings and the drug-induced highs and lows of addiction.
The individuals who exhibit greater lORO and more
suppression of withdrawal symptoms experience better
treatment outcomes [21]. As buprenorphine plasma con-
centrations decline, there is a concomitant increase in
subjective hydromorphone agonist drug effects and with-
drawal symptoms with a corresponding decrease in lORO.
Table 2 Final population
pharmacokinetic parameter
estimates for the fixed-effect
and the random-effect
parameters
SE standard error of the
parameter estimates, 95 % CI
95 % confidence interval of the
parameter estimates computed
by bootstrap procedure, Add Err
additive error model common to
buprenorphine and
norbuprenorphine, Prop Err
BUP proportional error model
for buprenorphine, Prop Err
NorBUP proportional error
model for norbuprenorphine
Parameter Model estimate Non-parametric bootstrap (100 replicates)
Median (SE) 95 % CI
Fixed-effect
k12 *100 (h-1) 0.072 0.071 (0.003) 0.065–0.079
k14 *100 (h-1) 0.097 0.100 (0.009) 0.083–0.118
V2 (L) 268 261 (35) 205–350
k23 (h-1) 0.266 0.254 (0.036) 0.210–0.343
k30 (h-1) 15.100 16.331 (1.419) 14.679–20.561
k20 *100 (h-1) 0.090 0.089 (0.012) 0.066–0.121
kkl (h-1) 0.002 0.002 (0.0001) 0.002–0.002
k37 (h-1) 6.100 6.420 (1.023) 4.951–9.075
k73 (h-1) 0.007 0.007 (0.003) 0.005–0.017
V3 (L) 15 14 (1) 12–16
Random-effect variance
k12 0.047 0.045 (0.010) 0.014–0.062
k14 0.443 0.388 (0.100) 0.205–0.674
V2 0.451 0.440 (0.127) 0.232–0.844
k23 0.369 0.411 (0.105) 0.223–0.778
k30 0.190 0.182 (0.039) 0.100–0.288
k20 0.101 0.022 (0.001) 0.019–0.026
kkl 0.071 0.072 (0.022) 0.034–0.146
k37 0.053 0.107 (0.055) 0.003–0.328
k73 1.930 1.636 (0.556) 0.934–3.361
V3 0.037 0.065 (0.020) 0.006–0.079
Residual error
Add Err (ng/mL) 0.013 0.012 (0.002) 0.009–0.018
Prop Err BUP 0.213 0.216 (0.008) 0.196–0.230
Prop Err NorBUP 0.314 0.312 (0.016) 0.284–0.349
Table 3 Final population pharmacokinetic/l-opioid receptor occu-
pancy parameter estimates for the fixed-effect and random-effect
parameters
Parameter Estimate SE RSE (%) 95 % CI
Fixed-effect
Emax (%) 91.40 3.94 4.30 83.68–99.12
EC50 (ng/mL) 0.67 0.19 28.8 0.29–1.05
Error 62.50 22.20 35.5
Random-effect
EC50 0.47 0.25 54.50
SE standard error of the parameter estimates, RSE root square error, 95 %
CI 95 % confidence interval of the parameter estimates, Emax maximum
l-opioid receptor occupancy that can be achieved, EC50 buprenorphine
concentration that results in 50 % of maximal receptor occupancy
820 A. F. Nasser et al.
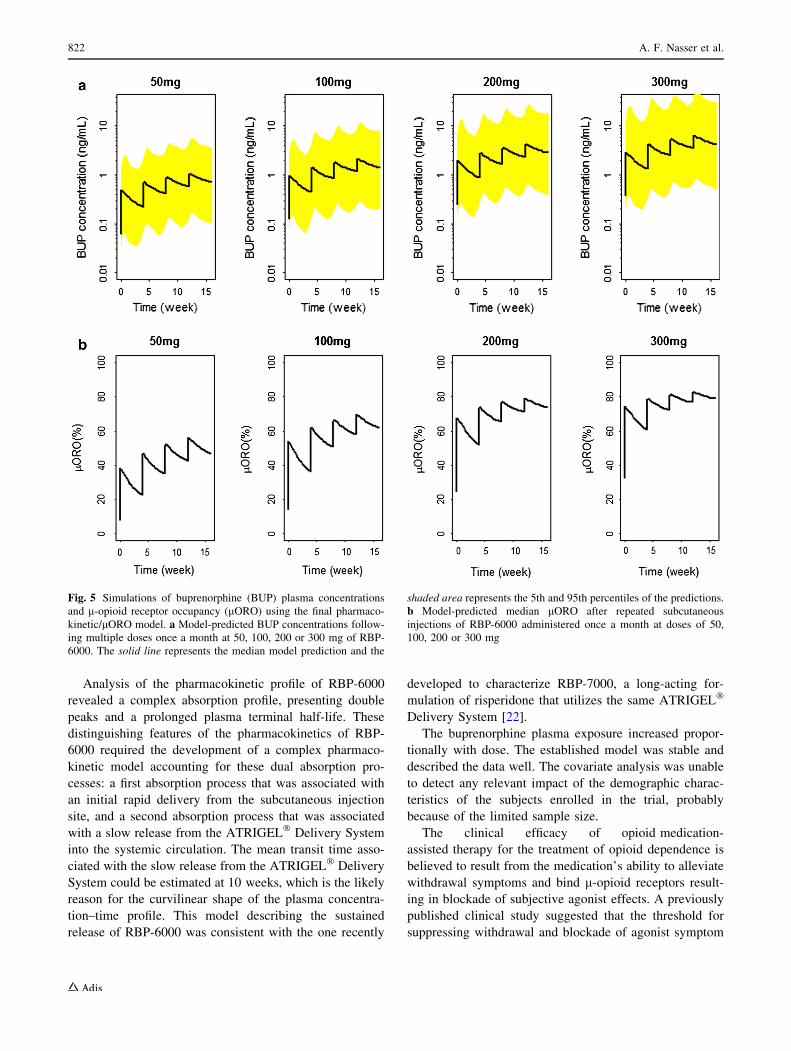
3.3 Trial Simulation Results: Buprenorphine
Exposures after Multiple Subcutaneous Injections
of RBP-6000
The simulated drug concentrations of buprenorphine and
norbuprenorphine after repeated subcutaneous injections of
RBP-6000 were derived from the final model parameter
estimates. The 400 hypothetical subjects received four
subcutaneous injections of RBP-6000 50, 100, 200 or
300 mg doses separated by 28 days. The objective of this
simulation was to predict buprenorphine plasma concen-
trations after multiple doses of RBP-6000 and to conse-
quently predict the corresponding lORO. The results are
presented in Fig. 5. Simulation indicated that the desired
C70 % receptor occupancy may be achieved after multiple
doses of 200 mg RBP-6000.
4 Discussion
In this paper we propose a methodological approach that
tries to exploit all the information available, using a com-
prehensive modelling approach to integrate and ‘learn’
from the data generated in different studies of the phar-
macokinetic and pharmacokinetic/pharmacodynamic char-
acteristics of RBP-6000. This learning has been
subsequently applied to address relevant questions for the
clinical development of this compound.
This strategy was implemented by initially defining a
population pharmacokinetic model of buprenorphine and
norbuprenorphine using data obtained in 36 opioid-
dependent subjects who received RBP-6000 with 50, 100
or 200 mg of buprenorphine base. A population pharma-
cokinetic/lORO model was developed using data (bupr-
enorphine pharmacokinetics and lORO) collected in 15
heroin-dependent subjects (5 receiving buprenorphine daily
tablet doses of 32 mg, 16 mg or 2 mg, or placebo, and 10
receiving a buprenorphine daily tablet dose of 16 mg).
Finally, the results of the buprenorphine population phar-
macokinetic analysis were combined with results of the
population pharmacokinetic/lORO analysis to estimate the
expected lORO after repeated subcutaneous injections of
different doses of RBP-6000 administered once a month.
As expected, blockade of hydromorphone agonist effects,
withdrawal symptoms and plasma buprenorphine concen-
trations were correlated with lORO.
Norbuprenorphine is a major metabolite of buprenor-
phine and a potent agonist of l-, d- and j-opioid receptors.
However, while norbuprenorphine is able to bind the l-
opioid receptors, it does not appreciably distribute to the
CNS and would not affect our pharmacodynamic end-
points. The reasons why norbuprenorphine was included in
the model is that it binds to peripheral l-opioid receptors,
with potential involvement in safety, and is important to
our overall clinical development plan. In any case, con-
sidering that the norbuprenorphine concentrations were
available, it appeared a reasonable strategy to evaluate
these data in a comprehensive model for better character-
ization and understanding of buprenorphine
pharmacokinetics.
Fig. 4 a Visual predictive check plot for the final pharmacokinetic/l-
opioid receptor occupancy (lORO) model for buprenorphine (BUP).
The solid line is the median model prediction, the shaded area
represents the 5th and 95th percentiles of the simulated data and the
open points are the individual lORO measurements. b Observed
(diamonds) and model-predicted (solid line) changes in agonist effect
following administration of 24 mg hydromorphone (HYD) with
respect to l-opioid receptor (lOR) availability, observed (triangles)
and model-predicted (straight dashed line) withdrawal symptoms
with respect to lOR availability, and observed (open circles) and
model-predicted (curved dash line) buprenorphine plasma concentra-
tions with respect to lOR availability. Changes in agonist effect,
withdrawal symptoms and BUP concentrations use the same y axis
scale
Population Pharmacokinetic/Pharmacodynamic Model of RBP-6000 821
Analysis of the pharmacokinetic profile of RBP-6000
revealed a complex absorption profile, presenting double
peaks and a prolonged plasma terminal half-life. These
distinguishing features of the pharmacokinetics of RBP-
6000 required the development of a complex pharmaco-
kinetic model accounting for these dual absorption pro-
cesses: a first absorption process that was associated with
an initial rapid delivery from the subcutaneous injection
site, and a second absorption process that was associated
with a slow release from the ATRIGEL� Delivery System
into the systemic circulation. The mean transit time asso-
ciated with the slow release from the ATRIGEL� Delivery
System could be estimated at 10 weeks, which is the likely
reason for the curvilinear shape of the plasma concentra-
tion–time profile. This model describing the sustained
release of RBP-6000 was consistent with the one recently
developed to characterize RBP-7000, a long-acting for-
mulation of risperidone that utilizes the same ATRIGEL�
Delivery System [22].
The buprenorphine plasma exposure increased propor-
tionally with dose. The established model was stable and
described the data well. The covariate analysis was unable
to detect any relevant impact of the demographic charac-
teristics of the subjects enrolled in the trial, probably
because of the limited sample size.
The clinical efficacy of opioid medication-
assisted therapy for the treatment of opioid dependence is
believed to result from the medication’s ability to alleviate
withdrawal symptoms and bind l-opioid receptors result-
ing in blockade of subjective agonist effects. A previously
published clinical study suggested that the threshold for
suppressing withdrawal and blockade of agonist symptom
Fig. 5 Simulations of buprenorphine (BUP) plasma concentrations
and l-opioid receptor occupancy (lORO) using the final pharmaco-
kinetic/lORO model. a Model-predicted BUP concentrations follow-
ing multiple doses once a month at 50, 100, 200 or 300 mg of RBP-
6000. The solid line represents the median model prediction and the
shaded area represents the 5th and 95th percentiles of the predictions.
b Model-predicted median lORO after repeated subcutaneous
injections of RBP-6000 administered once a month at doses of 50,
100, 200 or 300 mg
822 A. F. Nasser et al.
effects is between 50 and 60 % buprenorphine lORO
while additional benefit and clinical efficacy was observed
at 70 % lORO [19]. As a result from these previously
published findings, the dose selection criterion for the late-
phase RBP-6000 drug development was based on the
selection of a dose appropriate to reaching and maintaining
a lORO greater than 70 % after multiple doses.
The population pharmacokinetic/lORO model fully
characterized the relationship between buprenorphine
plasma levels and lORO. The relationship between bupr-
enorphine plasma concentration and lORO was best
described by an Emax model with EC50 of 0.67 ng/mL and
Emax of 91 %. The Emax model showed a linear relationship
between lORO up to the desired 70 % receptor occupancy
and buprenorphine concentrations up to approximately
2 ng/mL. At buprenorphine concentrations greater than
2 ng/mL, saturation occurred on lORO where a 4.5-fold
increase in observed buprenorphine concentrations resulted
in observed lORO between 70 % and less than 90 %.
Thus, once lORO is saturated, increasing doses are not
expected to exert any appreciable effect. A linear correla-
tion was established between buprenorphine clinical effi-
cacy (withdrawal suppression and blockade of
hydromorphone agonist subjective effects) and lORO.
Trial simulation indicated that C70 % receptor occu-
pancy may be achieved after multiple doses of 200 mg
RBP-6000 once every 28 days. Currently, a multiple-
ascending-dose study (50–300 mg) of RBP-6000 is ongo-
ing, and the preliminary observed data of buprenorphine
plasma concentrations indicated adequate model predic-
tions at each dose level.
5 Conclusion
A comprehensive model-based approach was developed to
describe the population pharmacokinetics of RBP-6000 in
opioid-dependent subjects and to define the relationships
between buprenorphine plasma concentrations, lORO and
clinical efficacy. The results of these analyses provided
new insight into the long-acting pharmacokinetic and
pharmacokinetic/lORO profiles of RBP-6000. These
findings indicated that RBP-6000 has the potential to
become an effective treatment of opioid dependence by
addressing compliance and reducing diversion, abuse and
unintended exposure associated with conventional treat-
ments. To our knowledge, this is the first study that
empirically combines clinical molecular neuroimaging and
plasma concentration and pharmacodynamic data to predict
a potentially effective dosing regimen for a novel formu-
lation of an addiction medication, and one of very few
studies in the CNS medication development arena to
leverage such data. As a general statement of caution, the
relatively small sample size of the population enrolled in
the pharmacokinetic and lORO studies and the associated
variability represent a limitation for generalization of the
findings derived from the population pharmacokinetic and
population pharmacokinetic/lORO analyses presented
here. The modelling and simulation conclusions will be
tested in future phase 2 and 3 studies.
Acknowledgments The authors would like to acknowledge Bradley
Vince, DO, President and Medical Director at Vince & Associates
(10103 Metcalf Avenue, Overland Park, KS 66212, USA) for patient
recruitment in this study.
Conflict of Interest/Disclosure At the time this manuscript was
submitted for publication, A.F. Nasser, C. Heidbreder, P.J. Fudala and
B. Zheng were full-time employees of Reckitt Benckiser Pharma-
ceuticals Inc. M.K. Greenwald was a full-time employee of Wayne
State University, and was a paid consultant for Reckitt Benckiser
Pharmaceuticals Inc. R. Gomeni was a paid consultant for Reckitt
Benckiser Pharmaceuticals Inc.
References
1. Katz NP, et al. Prescription opioid abuse: challenges and
opportunities for payers. Am J Manag Care. 2013;19:295–302.
2. Katz NP, et al. Foundations of opioid risk management. Clin J
Pain. 2007;23:103–18.
3. Paulozzi LJ, Ryan GW. Opioid analgesics and rates of fatal drug
poisoning in the United States. Am J Prev Med. 2006;31:506–11.
4. Kochanek KD, Xu J, Murphy SL, Minino AM, Kung H-C.
Deaths: preliminary data for 2009. Natl Vital Stat Rep.
2011;59:1–51.
5. Substance Abuse and Mental Health Services Administration,
Drug Abuse Warning Network (2011). National estimates of
drug-related emergency department visits. HHS publication no.
(SMA) 13-4760, DAWN series D-39. Rockville: Substance
Abuse and Mental Health Services Administration; 2013.
6. Walsh SL, Preston KL, Stitzer ML, Cone EJ, Bigelow GE.
Clinical pharmacology of buprenorphine: ceiling effects at high
doses. Clin Pharm Ther. 1994;55:569–80.
7. SUBOXONE� sublingual film label. http://www.accessdata.fda.
gov/drugsatfda_docs/label/2013/022410s015lbl.pdf. Accessed 31
Jan 2014.
8. Weiss RD. Adherence to pharmacotherapy in patients with
alcohol and opioid dependence. Addiction. 2004;99:1382–92.
9. Boothby LA, Doering PL. Buprenorphine for the treatment of
opioid dependence. Am J Health-Syst Pharm. 2007;64:266–72.
10. R Foundation for Statistical Computing (2009). R: a language and
environment for statistical computing. http://www.R-project.org.
Accessed 14 Dec 2013.
11. Beal S, Sheiner LB, Boeckmann A, Bauer RJ. NONMEM user’s
guides, 1989–2013. Ellicott City: Icon Development Solutions;
2013.
12. Jonsson EN, Karlsson MO. Xpose—an S-PLUS based population
pharmacokinetic/pharmacodynamic model building aid for
NONMEM. Comput Meth Prog Biomed. 1999;58:51–64.
13. Lindbom L, Pihlgren P, Jonsson EN. PsN-Toolkit—a collection
of computer intensive statistical methods for non-linear mixed
effect modeling using NONMEM. Comput Meth Prog Biomed.
2005;79:241–57.
14. Food and Drug Administration (1999). Guidance for industry:
population pharmacokinetics. http://www.fda.gov/downloads/
Drugs/Guidances/UCM072137.pdf. Accessed 16 Dec 2013.
Population Pharmacokinetic/Pharmacodynamic Model of RBP-6000 823
15. Hooker AC, Staatz CE, Karlsson MO. Conditional weighted
residuals (CWRES): a model diagnostic for the FOCE method.
Pharm Res. 2007;24(12):2187–97.
16. Kobayashi K, et al. Human buprenorphine N-dealkylation is
catalyzed by cytochrome P450 3A4. Drug Metab Disp.
1998;26:818–21.
17. Parke J, Holford NH, Charles BG. A procedure for generating
bootstrap samples for the validation of nonlinear mixed-effects
population models. Comput Meth Prog Biomed. 1999;59:19–29.
18. Greenwald MK, et al. Effects of buprenorphine maintenance dose
on mu-opioid receptor availability, plasma concentrations, and
antagonist blockade in heroin-dependent volunteers. Neuropsy-
chopharmacology. 2003;28:2000–9.
19. Greenwald MK, et al. Buprenorphine duration of action: mu-
opioid receptor availability and pharmacokinetic and behavioral
indices. Biol Psychiatry. 2007;61:101–10.
20. Savic RM, Jonker DM, Kerbusch T, Karlsson MO. Implemen-
tation of a transit compartment model for describing drug
absorption in pharmacokinetic studies. J Pharmacokinet Phar-
macodyn. 2007;34:711–26.
21. Greenwald MK, Steinmiller CL. Imaging opioid receptors:
applications to substance use disorders. In: Dean R, Negus SS,
Bilsky E, editors. Opioid receptors and antagonists: from bench to
clinic. New York: Humana Press 2009; p. 45–65.
22. Gomeni R, Heidbreder C, Fudala PJ, Nasser AF. A model-based
approach to characterize the population pharmacokinetics and the
relationship between the pharmacokinetic and safety profiles of
RBP-7000, a new, long-acting, sustained-release formulation of
risperidone. J Clin Pharmacol. 2013;53:1010–9.
824 A. F. Nasser et al.