Embed Size (px)
Citation preview

OPEN ACCESS International Journal of Pharmacology
ISSN 1811-7775DOI: 10.3923/ijp.2018.276.284
Research ArticlePopulation Pharmacokinetic Modeling and Simulation ofAfloqualone to Predict Steady-state Exposure Levels1Hyun-moon Back, 2Sudeep Pradhan, 3Young-ran Yoon, 4Wonku Kang, 1Jung-woo Chae, 5Nayoung Han,6Nakajima Miki, 1Kwang-il Kwon, 1Sang-kyum Kim and 1Hwi-yeol Yun
1College of Pharmacy, Chungnam National University, Daejeon, Korea2School of Pharmacy, University of Otago, 9054 Dunedin, New Zealand3Clinical Trial Center, School of Medicine, Kyungpook National University, Daegu, Korea4College of Pharmacy, Chungang University, Seoul, Korea5College of Pharmacy, Seoul National University, Seoul, Korea6Faculty of Pharmaceutical Sciences, Kanazawa University, Kanazawa, Japan
1st and 2nd authors contributed equally to this study, 9th and 10th authors contributed equally
AbstractBackground and Objective: Afloqualone (AFQ) is a quinazoline family GABAergic drug used as muscle relaxant. After oral administrationof AFQ, greatly elevated exposure in some individuals were observed which might cause severe side effects. The aim of this study wasto develop a population pharmacokinetic model of AFQ and search possible reason of high inter-individual variability (IIV) in the clinicalstudy and further demonstrate its impact on exposure on AFQ through simulation. Methodology: To evaluate the exposure of AFQ andconfirm the high difference between subjects, non-compartmental analysis was assessed. A Population PK model of AFQ was developedusing healthy human AFQ PK data and simulation study was performed with final PK model. Results: A two-compartment model withfirst order absorption and elimination was used to explain the pharmacokinetics of AFQ. The high level of HIV in AFQ exposure wasexplained through assumption two subject group with high exposure group (HEG) or normal exposure group (NEG). Through simulations,it was proved that big difference of AFQ exposure between subjects could be observed in some individual and dose of AFQ needs to bereduced for such subjects in HEG. Conclusion: Population PK model of AFQ for explaining high IIV was successfully developed andexposure of AFQ between subjects was simulated. Finally, suggesting an appropriate dose of AFQ in HEG which could be had possibilityof genetic polymorphism.
Key words: Afloqualone, pharmacokinetics, population analysis, inter-individual variability, high exposure group
Received: September 08, 2017 Accepted: November 28, 2017 Published: January 15, 2018
Citation: Hyun-moon Back, Sudeep Pradhan, Young-ran Yoon, Wonku Kang, Jung-woo Chae, Nayoung Han, Nakajima Miki, Kwang-il Kwon, Sang-kyumKim and Hwi-yeol Yun, 2018. Population pharmacokinetic modeling and simulation of afloqualone to predict steady-state exposure levels. Int. J. Pharmacol.,14: 276-284.
Corresponding Author: Hwi-yeol Yun, College of Pharmacy, Chungnam National University, Daejeon, Korea Tel: +82-42-821-5941/ Fax: +82-42-823-6566
Copyright: © 2018 Hyun-moon Back et al. This is an open access article distributed under the terms of the creative commons attribution License, whichpermits unrestricted use, distribution and reproduction in any medium, provided the original author and source are credited.
Competing Interest: The authors have declared that no competing interest exists.
Data Availability: All relevant data are within the paper and its supporting information files.

Int. J. Pharmacol., 14 (2): 276-284, 2018
INTRODUCTION
Afloqualone (AFQ), 6-Amino-2-fluoromethyl-3-(o-tolyl)-4-(3H)-quinazolinone, is a quinazoline family GABAergic drugand is an analog of methaqualone developed in 19761. It hassedative and muscle-relaxant effects resulting from its agonistactivity at the $-subtype of the GABAA receptors2. AFQ seemsto be devoid of a hypnotic action and has different effects onthe sleep-wakefulness cycle than those of both the hypnoticsand the other muscle relaxants used3. The pharmacologicalproperties (muscle relaxation and motor depression) ofAFQ, as related to behavior (excitatory) differ from thoseof anti-anxiety drugs, hypnotics and stimulants(chlordiazepoxide, diazepam, meprobamate andpentobarbital-Na)4.
AFQ has clinical uses such as neck-shoulder-armsyndrome, lumbago and spastic paralysis. It has minor sideeffects like headache, dizziness, drowsiness, lethargy, diarrhea,vomiting, abdominal pain and constipation5. Rarely it cancause skin problems such as dermatitis, pruritus andphotosensitization that leads to discontinuation of the drug’suse6-8. Ultraviolet light is the main action spectrum to elicitphotosensitive skin reactions in patients medicated with AFQ.In addition to sunburn-like eruption and exudative erythema,AFQ also induces a skin eruption resembling lichen planus, aknown immunologic skin disorder in which T-lymphocytes areinvolved9.
The metabolic process of AFQ includes acetylation ofthe aromatic amino group, followed by hydroxylation atthe methyl carbon of either the acetyl or 2-Methyl residueand direct conjugation of AFQ with glucuronic acid at thearomatic amino group. In vitro examination of commerciallyavailable recombinant UGT microsomes revealed thatUGT1A3 and UGT1A4 possessed the highest AFQN-glucuronosyltransferase activities among the UGT isoformsexamined. Furthermore, inhibition studies and correlationanalyses with typical substrates for UGT isoforms performedusing human liver and jejunum microsomes indicated thatUGT1A4 would mainly catalyze the AFQ N-glucuronidation inliver, whereas both UGT1A3 and UGT1A4 would catalyze theAFQ N-glucuronidation in intestine10.
Moreover, clinical study has shown that when AFQ isgiven orally, the parent AFQ and its metabolites are excretedin urine (20% of dose), among which AFQ N-glucuronide is themajor metabolite (8% of dose) in human urine11. In addition,systemic exposure of afloqualone in healthy human wasobserved with high inter-individual variability (IIV) and a fewprevious studies suggested, this phenomenon was relatedwith AFQ N-glucuronidation because this type of conjugation
is common in primary aromatic amines but the N-glucuronideof AFQ has not been seen in rats, dogs and monkeys11,12.
Despite of potential possibility of over-exposure for AFQ,it is in use without dose adjustment in clinical situationbecause of lack of knowledge about AFQ. Therefore, this studywas to develop the population PK model of AFQ anddemonstrate difference of AFQ exposure between subjectthrough population modeling and simulation techniques.
MATERIALS AND METHODS
Clinical study data: The clinical study data used in theanalysis was collated data from three different clinical trialsperformed in 2006 at Kyungpook National University Hospital(KNUH; Daegu, Korea) re-evaluating AFQ in healthy subjects.In the study, 8 subjects were enrolled in each trial, with totalof 24 subjects providing a total of 287 plasma concentrations.A single oral dose of AFQ 20 mg (Arobest) tablet with 240 mLof water was administered to each subject after an overnightfast. Blood samples (~6 mL) were taken before and at 0.5, 1, 2,3, 4, 6, 8, 10, 12 and 24 h after the dose for the determinationof AFQ.
Inclusion criteria for participants to be involved in thestudy were age between 19-55 with no innate or chronicdisease and non-pregnant females. Subjects involved in thestudy were healthy, which were confirmed by physicians aftercheckup before initiating the study. Demographics andlaboratory data of the subjects are summarized in the Table 1.Studies were performed in compliance with the InternationalConference of Harmonization (ICH), guideline for good clinicalpractice13, the declaration of Helsinki on the ethical conduct ofmedical research14 and regulatory guidelines from theInstitutional Review Board (IRB) of the trial center.
Table 1: Demographic characteristics and laboratory test values of studypopulation
Demographic Mean (Range)Age (years) 23 (20-26)Weight (kg) 70.67 (57-81.70)Height (cm) 174.40 (167.20-182.00)Aspartate transaminase (IU LG1) 21.38 (13.00-63.00)Alanine transaminase (IU LG1) 18.00 (5.00-64.00)Alkaline phosphatase (IU LG1) 73.21 (44.00-117.00)Glucose (mg dLG1) 87.50 (78.00-99.00)Total protein (g dLG1) 7.70 (6.90-8.40)Albumin (g dLG1) 4.75 (4.40-5.00)Total bilirubin (mg dLG1) 0.89 (0.51-1.49)Cholesterol (mg dLG1) 157.08 (102.00-211.00)Blood urea nitrogen (mg dLG1) 13.07 (6.60-21.00)Serum creatinine (mg dLG1) 0.81 (0.68-0.97)kg: Kilogram, cm: Centimeter, IU: International unit, L: Liter, mg: Milligram,dL: Deciliter, g: gram
277

Int. J. Pharmacol., 14 (2): 276-284, 2018
2nd level of randomeffects
(Inter-occasion or inter-site variability)
Stepwise covariatemodeling (SCM) Final model
Determination of structure model
(1 or 2 or 3compartment model)
Absorptionmodulation
(Lag time, Transitcompartment)
Eliminationmodulation
(Nonlinear, nonlinear+linear)
Explainingdifference between
HEG and NEG
Step 1 Step 2 Step 3 Step 4
Step 5 Step 6
Collected blood samples were centrifuged at 1360 rpm for10 min and the resulting plasma samples were stored frozen at -80EC until analysis. Plasma AFQ concentrations weremeasured by fully validated methods at three different centers with different systems. API2000 and API4000 liquidchromatography-tandem mass spectrometry (LC-MS/MS)system (Sciex Division of MDS, Canada) and acquityultra-performance liquid chromatography (UPLC) system(Waters, USA) was used to analyze the samples. The lower limitof quantification of the assay was 0.5 ng mLG1 and the limit ofdetection was 0.1 ng mLG1 for all the methods used15.
Pharmacokinetic analysisNon-compartmental analysis: Non-compartmental analysis(NCA) of the clinical data was done in the Phoenix WinNonlinsoftware (Pharsight, Palo Alto, CA). To determine the outliersamong the 24 subjects in this study, a modified Z-score test(Iglewicz and Hoaglin’s robust test for multiple outliers)16 wasapplied on AUC and Cmax values. Three out of 24 subjects wereshown to be potential outliers for the test.
Population PK modelingGeneral modeling strategy: Model development wasperformed step by step process using NONMEM (ICON, EllicottCity, Maryland). At first step, a model with log-transformedplasma AFQ concentration data was developed. To describethe huge difference in the AUC and Cmax among theindividuals, those with outlier AUC and Cmax were grouped asHEG and others as NEG. CL/F and Ka were separatelycomputed for HEG and NEG in the model. Other availablecovariates were tested on the base model. The final covariatemodel was then determined after excluding implausiblecovariates and only retaining those with statistical significanceand clinical or physiological relevance.
Base model development: Step by step modeling strategyfollowed for population PK modeling is illustrated in Fig. 1.
Base model was developed in a step by step manner wherethe best model was chosen and was taken to the next step. Atstep 4, different relations were tested to compute CL/F insubjects with HEG and NEG on the best model from step 3. Aparameter to account for the first pass effect (FPE) separatelyon each group was also incorporated in this step. This wasconducted by specifying F1, the parameter represents thefraction absorbed from the absorption compartment. Aseparate ka was also added for HEG and NEG.
Second level of random effects in PK model parameterswas tested at step 5 with model carried forward from step 4.
Covariate modeling: The covariates available from the clinicalstudy were age, weight, height, aspartate transaminase,alanine transaminase, alkaline phosphatase, glucose, totalprotein, albumin, total bilirubin, cholesterol, blood ureanitrogen and creatinine level. In step 6, potentially significantcovariates were selected from the plots of the covariatesversus the between subject variability (BSV) of the parameterestimates. Covariates were further evaluated for statisticalsignificance using a stepwise covariate modeling (SCM) optionin PsN, which uses forward addition (p<0.05) and backwardelimination (p<0.01).
Model evaluation and simulation: The predictiveperformance and sufficiency of the model to characterize AFQclinical data were evaluated from the visual predictive checks(VPC). Thousand data sets were generated with the finalmodel based on the estimated parameter values. Theobserved concentrations and the median, 2.5th and 97.5thpercentiles along with their corresponding 95% confidenceinterval of the observed concentrations were plotted. Theplots were stratified based on their group to evaluate themodel prediction separately for HEG and NEG subjects.
The final model of AFQ was used to simulate the timecourse of AFQ after single oral administration of AFQ tablet insubjects with HEG and NEG, for 24 h (n = 1,000).
Fig. 1: Step by step modeling strategy for population PK model of AFQ
278

Int. J. Pharmacol., 14 (2): 276-284, 2018
For further assessment of the AFQ exposure in clinicalsituations, simulations were performed with TID dose of AFQfor 7 days in subjects classified as HEG and NEG (n = 1,000).
A numeric predictive check was performed to determinethe dose adjustment needed for the subjects in HEG.Comparison of average plasma concentration at the steadystate Css and Cmax_ss were done between the subjects in NEG at20 mg AFQ with subjects in HEG at different level of dose(2-10 mg). A simulation with 1,000 subjects was done for theeach dose tested for both HEG and NEG subjects. Css and Cmaxfrom NEG subjects were taken from 5th to 95th percentiles asa reference range to compare the difference dose of AFQ inHEG subjects.
RESULTS
Study population and pharmacokinetic data: The clinicaldata used for modeling incorporated 287 AFQ plasma samplesfrom 24 healthy subjects. The concentrations that wereobserved ranged from 0.65-268.75 ng mLG1. Only oneconcentration data were below the lower limit ofquantification (LLOQ) and appeared at the start of thesampling period. Samples below the limit of quantification(BLQ) were excluded. As there was only one sample BLQ, it didnot affect the parameter estimates and the AFQ data wereunaffected by censoring.
Population pk modeling and simulationsBase model: The selected structural model was atwo-compartment with first-order absorption model andrandom variability terms on CL/F and apparent central volumeof distribution (V2/F) parameters.
At step 4 the impact of exposure group was examined onCL/F. The model that was the best among the tested onesincorporated the separate CL/F for subjects classified as HEGand NEG and was carried forward to the next step.Additionally, inclusion of the parameter to specify the FPEand separate Ka parameter for HEG and NEG further reducedthe dOFV and also improved the prediction of absorption phase in the HEG subjects. The models at step 5 wereextended by the addition of inter-trial variability as a 2ndlevel of random effects in two ways as Between OccasionVariability (BOV) on random effects parameters and using$LEVEL to model inter-trial variability so that several subjectsbelong to a site. Addition of second level of random effect didnot resulted in improvement of models, which suggests thatthe inter-site variability was not significantly larger than BSV.Therefore, no further changes were done to the model fromstep 4 and it was considered as the final model.
The final model included BSV on the CL/F and V2/F. Allfinal model parameters were reasonably precise (RSE%<38%,except V3/F with RSE% = 55% and CL/F parameter for HEGwith RSE% = 68%) and diagnostic plots showed that themodel were able to describe the observed data well, with nosystemic bias.
Covariate models: Besides the covariates used in basestructural model, other potential significant covariaterelationships assessed during covariate modeling buildingwere age, body weight, height, cholesterol and glucose levelson both CL/F and V2/F and aspartate transaminase, alaninetransaminase, alkaline phosphatase, total protein, albumin,total bilirubin, blood urea nitrogen and creatinine level onCL/F only. Addition of any of the covariates did not improvedthe model further.
Table 2 shows that, all estimated parameters were precise(except for the V3/F and CL/F for HEG) and shrinkage ofrandom parameters was below 12%. The goodness-of-fit plots(GOF) in Fig. 2 revealed that the data were equally dispersedabout the lines with unit slope and no major systematic biaswas seen. The observed versus individual predictedconcentrations were closely dispersed about the identity linethrough the range of measured values, signifying that thesedata were sufficiently described by the model. Moreover, theconditional weighted residual did not show any trend over thetime of observations.
Model evaluation and simulation: The visual predictivecheck (VPC) plots for AFQ are presented in Fig. 3. The VPC ofAFQ revealed that the final model has good predictiveperformance for the observed plasma concentration profile.The time course of the median, 2.5th and 97.5th percentiles
Table 2: Population parameter estimates of AFQ from the final population PKmodel
Parameter Population mean RSE (%)ka for NEG (1 hG1) 0.24 26ka for HEG (1 hG1) 0.41 22CL/F for NEG (L hG1) 34.20 23CL/F for HEG (L hG1) 18.00 68V2/F (L) 71.80 46Q/F (L hG1) 39.90 13V3/F (L) 975.00 55BSV (CV% (shrinkage%)BSV-CL/F 39.10 (12.00) 33BSV-V2/F 81.40 (11.00) 26Residual variabilityProportional error (CV%) 45.30 13ka : Absorption rate constant, CL/F: Apparent clearance, V2/F: Apparent centralvolume of distribution, Q/F: Apparent inter-compartmental clearance, V3/F: Apparent peripheral volume of distribution, BSV: Between subjectvariability, CV: Coefficient of variation, RSE: Relative standard error
279

Int. J. Pharmacol., 14 (2): 276-284, 2018
Fig. 2(a-c): Goodness-of-fit plots for the final model of AFQ (a) Observed concentrations (ng mLG1) versus population predictedconcentrations (ng mLG1), (b) Observed concentrations (ng mLG1) versus individual predicted concentrations(ng mLG1) and (c) Conditional weighted residuals versus time. The solid line represents the line of unity
for the observed and 95% confidence interval (CI) ofsimulated-based concentrations were similar.
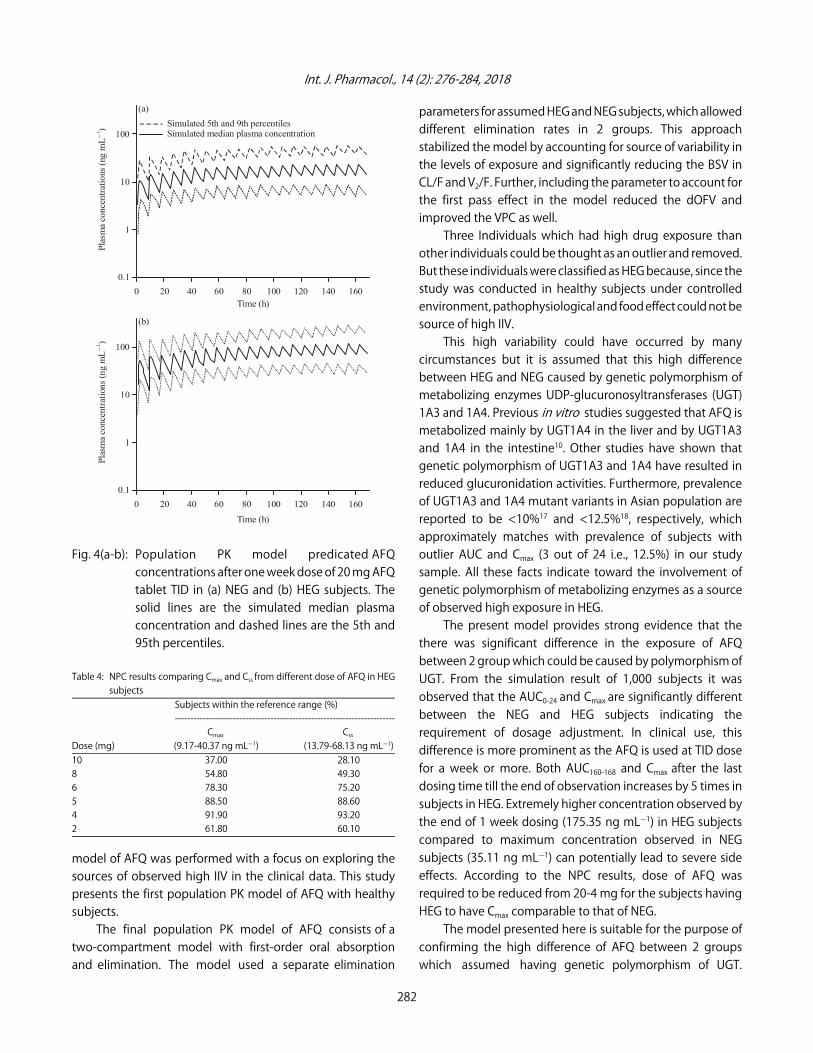
From the simulation with TID dose of 20 mg AFQ tablet,a significant difference in the exposure of AFQ in HEG andNEG subjects were observed. AUC160-168 from last dosing time(160 h) till end of observation and Cmax values in the HEG wassignificantly higher than that in the NEG (p<0.05). It can be
seen in the plasma concentration versus time graph inFig. 4 and Table 3, maximum observed concentration in NEGsubjects was 35.11 ng mLG1, where it was 137.35 ng mLG1 inHEG subjects i.e., 5 time greater in HEG subjects.
NPC (Numerical predictive check) results showed that theexposure of AFQ was very high in HEG subjects. Even at thehalf dose (10 mg) of AFQ, approximately only 1/3rd of the
280
(b)
6
4
2
0
-2
Obs
erve
d co
ncen
trat
ions
(ng
mL)
1 )
(a)
-2 0 2 4 6
Population predicted concentration (ng mL)1)
6
4
2
0
-2
Obs
erve
d co
ncen
trat
ions
(ng
mL)
1 )
-2 0 2 4 6
Individual predicted concentration (ng mL)1)
6
4
2
0
-2
Obs
erve
d co
ncen
trat
ions
(ng
mL)
1 )
(c)
0 2 4 6 8 10 12 14 16 18 20 22 24
Time (h)
(b)

Int. J. Pharmacol., 14 (2): 276-284, 2018
Fig. 3(a-b): Visual predictive checks of AFQ for single dose of 20 mg AFQ tablet for (a) NEG and (b) HEG subjects. Open circlesrepresents observed AFQ concentrations. The solid line represents the median of the observed concentrations andthe dashed line represents the 2.5th and 97.5th percentiles of the simulated concentrations. The region with diagonallines represent the 95% confidence interval of the 2.5, 50 and 97.5th percentiles of the simulated concentrations
Table 3: AUC160-168 and Cmax computed from the population PK model aftera week of 20 mg AFQ tablet TID dose in subjects with HEG and NEG
Mean (2.5th and 97.5th percentile)-------------------------------------------------------------------------------
Parameters AUC160-168 (ng h mLG1) Cmax (ng mLG1)NEG 174.41 (74.44-322.75) 35.11 (14.03-67.99)HEG 869.91 (402.53-1516.75) 175.35 (75.12-324.54)AUC160-168: AUC (Area under curve) from last dosing time (160 h) till end ofobservation
1000 subjects were attaining the Css and Cmax within thereference range. The recommended dose from the NPC would
be 4 mg of AFQ for subjects classified as HEG. The resultsof NPC are shown in Table 4.
DISCUSSION
A population PK model was developed for AFQ usingsingle-dose oral data collected from three clinical trials withtotal of 24 healthy subjects. High IIV in exposure was observedamong the subjects. Therefore, developing population PK
281
Observed plasma concentration Observed median plasma concentration Observed 2.5th and 97.5th percentile plasma 95% CI of simulated median plasma concentration 95% CI of 2.5th percentile plasma concentration 955 CI of simulated 97.5th percentile plasma concentration
100
10
1
0.1
Pla
sma
con
cent
rati
ons
(ng
mL)
1 )
(a)
(b)
100
10
1
0.1
Pla
sma
con
cent
rati
ons
(ng
mL)
1 )
0 5 10 15 20 25
Time (h)
0 5 10 15 20 25
Time (h)
Int. J. Pharmacol., 14 (2): 276-284, 2018
100
10
1
0.1
Pla
sma
conc
entr
atio
ns (
ng m
L)
G1
0 20 40 60 80 100 120 140 160Time (h)
Simulated 5th and 9th percentilesSimulated median plasma concentration
(a)
100
10
1
0.1
Plas
ma
conc
entr
atio
ns (
ng m
L)
G1
0 20 40 60 80 100 120 140 160
Time (h)
(b)
Fig. 4(a-b): Population PK model predicated AFQconcentrations after one week dose of 20 mg AFQtablet TID in (a) NEG and (b) HEG subjects. Thesolid lines are the simulated median plasmaconcentration and dashed lines are the 5th and95th percentiles.
Table 4: NPC results comparing Cmax and Css from different dose of AFQ in HEGsubjects
Subjects within the reference range (%)-----------------------------------------------------------------------
Cmax Css Dose (mg) (9.17-40.37 ng mLG1) (13.79-68.13 ng mLG1)10 37.00 28.108 54.80 49.306 78.30 75.205 88.50 88.604 91.90 93.202 61.80 60.10
model of AFQ was performed with a focus on exploring thesources of observed high IIV in the clinical data. This studypresents the first population PK model of AFQ with healthysubjects.
The final population PK model of AFQ consists of a two-compartment model with first-order oral absorptionand elimination. The model used a separate elimination
parameters for assumed HEG and NEG subjects, which alloweddifferent elimination rates in 2 groups. This approachstabilized the model by accounting for source of variability inthe levels of exposure and significantly reducing the BSV inCL/F and V2/F. Further, including the parameter to account forthe first pass effect in the model reduced the dOFV andimproved the VPC as well.
Three Individuals which had high drug exposure thanother individuals could be thought as an outlier and removed.But these individuals were classified as HEG because, since thestudy was conducted in healthy subjects under controlledenvironment, pathophysiological and food effect could not besource of high IIV.
This high variability could have occurred by manycircumstances but it is assumed that this high differencebetween HEG and NEG caused by genetic polymorphism ofmetabolizing enzymes UDP-glucuronosyltransferases (UGT)1A3 and 1A4. Previous in vitro studies suggested that AFQ ismetabolized mainly by UGT1A4 in the liver and by UGT1A3and 1A4 in the intestine10. Other studies have shown thatgenetic polymorphism of UGT1A3 and 1A4 have resulted inreduced glucuronidation activities. Furthermore, prevalenceof UGT1A3 and 1A4 mutant variants in Asian population arereported to be <10%17 and <12.5%18, respectively, whichapproximately matches with prevalence of subjects withoutlier AUC and Cmax (3 out of 24 i.e., 12.5%) in our studysample. All these facts indicate toward the involvement ofgenetic polymorphism of metabolizing enzymes as a sourceof observed high exposure in HEG.
The present model provides strong evidence that thethere was significant difference in the exposure of AFQbetween 2 group which could be caused by polymorphism ofUGT. From the simulation result of 1,000 subjects it wasobserved that the AUC0-24 and Cmax are significantly differentbetween the NEG and HEG subjects indicating therequirement of dosage adjustment. In clinical use, thisdifference is more prominent as the AFQ is used at TID dosefor a week or more. Both AUC160-168 and Cmax after the lastdosing time till the end of observation increases by 5 times insubjects in HEG. Extremely higher concentration observed bythe end of 1 week dosing (175.35 ng mLG1) in HEG subjectscompared to maximum concentration observed in NEGsubjects (35.11 ng mLG1) can potentially lead to severe sideeffects. According to the NPC results, dose of AFQ wasrequired to be reduced from 20-4 mg for the subjects havingHEG to have Cmax comparable to that of NEG.
The model presented here is suitable for the purpose ofconfirming the high difference of AFQ between 2 groupswhich assumed having genetic polymorphism of UGT.
282

Int. J. Pharmacol., 14 (2): 276-284, 2018
Therefore, screening of the polymorphism of UGT should beperformed in the studied subjects. Moreover, assessment ofUGT1A3 polymorphism and determination of FPE caused byUGT1A3 as well as UGT1A4 are warranted for further refiningthe final model. Subsequently after this studies, the presentedmodel can be refined to determine dose adjustment requiredfor the patients with UGT1A4 and UGT1A3 polymorphism. Thiswill help in preventing severe skin reactions such as dermatitisand pruritus and photosensitization that leads todiscontinuation of the use of AFQ.
However, one should be careful in applying outcomes ofthe present study in clinical use of AFQ because of the lack ofreal pharmacogenetic data in this study, high variability inkinetics and inherent BSV in AFQ absorption as well asdisposition. Another limitation of the present analysis is thatthe study was done on healthy subjects with normalphysiological conditions but in clinical situations there may bepatients with wide range of difference in physiologicalconditions and diseases affecting the absorption anddisposition of AFQ. Therefore, at present the utility of presentmodel cannot be justified for clinical use for dose adjustmentof the AFQ in patients with any of medical conditions.
CONCLUSION
This study successfully developed the populationpharmacokinetics model of AFQ and explained the bigdifference of AFQ exposure in some subjects and suggestedan appropriate dose of AFQ in HEG which could havepossibility of genetic polymorphism.
SIGNIFICANCE STATEMENT
This study discovered the possibility of UGT geneticpolymorphism which can highly affect the total exposure ofAFQ. This will help the researcher to uncover the critical areasof AFQ adverse effect and high exposure in some subjects thatmany researchers were not able to explore. Thus, a new theoryon UGT polymorphism effect on AFQ may be arrived at.
ACKNOWLEDGMENTS
This research was supported by the Basic ScienceResearch Program through the National ResearchFoundation of Korea (NRF), funded by the Ministry of Science,ICT and Future Planning under Grant [2009-0093815 and2014R1A1A1006006].
This research was also supported by a grant of the KoreaHealth Technology R and D Project through the Korea Health
Industry Development Institute (KHIDI), funded by the Ministryof Health and Welfare, Republic of Korea under Grant[HI17C0927] and research funds from Chungnam NationalUniversity.
REFERENCES
1. Inoue, I., T. Oine, Y. Yamada, J. Tani, R. Ishida and T. Ochiai,1976. 2-Fluoromethyl-3-o-tolyl-6-amino-4(3H)-quinazolinone.US Patent 3966731. https://www.google.com/patents/US3966731
2. Ochiai, T. and R. Ishida, 1982. Pharmacological studies on6-amino-2-fluoromethyl-3-(O-tolyl)-4(3H)-quinazolinone(afloqualone), a new centrally acting muscle relaxant. (II)Effects on the spinal reflex potential and the rigidity. Jpn. J.Pharmacol., 32: 427-438.
3. Kojima, M., Y. Kudo and R. Ishida, 1981. [Effects ofafloqualone, a centrally acting muscle relaxant, on the sleep-wakefulness cycle in cats with chronically implantedelectrodes]. Nihon Yakurigaku Zasshi, 78: 471-482, (InJapanese).
4. Yamamura, M., T. Ochiai and R. Ishida, 1981. [Effects ofafloqualone, a new centrally acting muscle relaxant, onDRL response and CER in rats]. Nihon Yakurigaku Zasshi,78: 381-392, (In Japanese).
5. Hur, G.Y., E.K. Hwang, J.Y. Moon, Y.M. Ye, J.J. Shim, H.S. Parkand K.H. Kang, 2012. Oral muscle relaxant may induceimmediate allergic reactions. Yonsei Med. J., 53: 863-865.
6. Takeshi, I., K. Ryoichi and N. Michihito, 1994. Photoleukomelanodermatitis (Kobori) induced byafloqualone. J. Dermatol., 21: 430-433.
7. Takeuchi, A., Y. Kuroki, F. Iitsuka and Y. Toshihar, 2011.[Survey of the current conditions in acute poisoning dueto antispasmodic agents-special reference to eperisone hydrochloride and afloqualone]. Chudoku Kenkyu,24: 259-264, (In Japanese).
8. Zuba, E.B., S. Koronowska, A. Osmola-Mankowska andD. Jenerowicz, 2016. Drug-induced photosensitivity. ActaDermatovenerol. Croat., 24: 55-64.
9. Tokura, Y., M. Ogai, H. Yagi and M. Takigawa, 1994.Afloqualone photosensitivity. Immunogenicity ofafloqualone-photomodified epidermal cells. Photochem.Photobiol., 60: 262-267.
10. Kaji, H. and T. Kume, 2005. Characterization of afloqualoneN-glucuronidation: Species differences and identification ofhuman UDP-glucuronosyltransferase isoform(s). Drug Metab.Dispos., 33: 60-67.
11. Minezo, O., S. Furuuchi, S. Usuki, S. Nitta and S. Harigaya,1983. Metabolism of afloqualone, a new centrally actingmuscle relaxant, in monkeys and dogs. J. Pharmacobiodyn.,6: 708-720.
283

Int. J. Pharmacol., 14 (2): 276-284, 2018
12. Minezo, O., T. Kurozumi, S. Furuuchi, S. Usuki, K. Kotera andS. Harigaya, 1983. Metabolism of afloqualone, a newcentrally acting muscle relaxant, in the rat. Chem. Pharm.Bull., 31: 2438-2450.
13. ICH Harmonised Tripartite Guideline, 1996. Guideline forgood clinical practice E6(R1). ICH Harmonised TripartiteGuideline, pp: 1-53. https://www.ich.org/fileadmin/ Public_Web_Site/ICH_Products/Guidelines/Efficacy/E6/E6_R1_Guideline.pdf
14. Spiegel, R., 2003. Psychopharmacology: An Introduction.4th Edn., John Wiley and Sons, New York,ISBN: 9780470869468, pp: 3-4.
15. Yun, H.Y., S.P. Lee, H.H. Jeong, Y.R. Yoon and S.J. Sohn et al.,2007. Determination of afloqualone in human plasmausing liquid chromatography/tandem mass spectrometry:Application to pharmacokinetic studies in humans. Talanta,73: 635-643.
16. Iglewicz, B. and H.C. David, 1993. How to Detect and HandleOutliers. ASQC Quality Press, USA., ISBN: 9780873892476,Pages: 87.
17. Chen, Y., S. Chen, X. Li, X. Wang and S. Zeng, 2006. Geneticvariants of human UGT1A3: Functional characterizationand frequency distribution in a Chinese Han population.Drug Metab. Dispos., 34: 1462-1467.
18. Saeki, M., Y. Saito, H. Jinno, K. Sai and A. Hachisuka et al., 2005.Genetic variations and haplotypes of UGT1A4 in a Japanese population. Drug Metab. Pharmacokinet., 20: 144-151.
284


![Pharmacokinetic modeling of [18F]fluorodeoxyglucose (FDG](https://img.dokumen.tips/doc/110x75/61886b54df681277ae16a602/pharmacokinetic-modeling-of-18ffluorodeoxyglucose-fdg-.jpg)