Embed Size (px)
Citation preview

Temperature dependences for air-broadenedLorentz half-width and pressure shift coefficientsin the 30013/00001 and 30012/00001 bands ofCO2 near 1600 nm 1
A. Predoi-Cross, A.R.W. McKellar, D. Chris Benner, V. Malathy Devi,R.R. Gamache, C.E. Miller, R.A. Toth, and L.R. Brown
Abstract: In this study, 39 high-resolution spectra of pure and air-broadened CO2 recorded at temperatures between 215 and294 K were analyzed using a multispectrum nonlinear least-squares technique to determine temperature dependences of air-broadened Lorentz half-width and air-induced pressure shift coefficients for over 100 individual 12C16O2 transitions in the30012/00001 (at 6348 cm–1) and 30013/00001 (at 6228 cm–1) bands. Data were recorded with two different Fourier trans-form spectrometers (Kitt Peak FTS at the National Solar Observatory in Arizona and the Bomem FTS at NRC, Ottawa), withabsorption path lengths ranging between 25 and 121 m. The sample pressures varied between 11 torr (pure CO2) and 924 torr(CO2-air) with volume mixing ratios of CO2 in air between *1.5% and 11% (1 torr = 133.322 4 Pa). To minimize systematicerrors and increase the accuracy of the retrieved parameters, a constrained multispectrum nonlinear least-squares fitting tech-nique was used to include theoretical quantum mechanical expressions for the rovibrational energies and intensity parametersrather than retrieving the individual positions and intensities line by line. The results suggest no detectable vibrational de-pendence for the temperature dependences for the air-broadened Lorentz half-width coefficients and the air-induced pressureshift coefficients. The half-width coefficients and temperature dependence exponents were modeled using semiclassical cal-culations based upon the Robert–Bonamy formalism. A good agreement is seen between the measurements and theoreticalcalculations. Beyond |m| = 26, a simple scaling factor (0.96) has been applied to the calculated half-width coefficients tomatch the experimental measurements.
PACS Nos: 32.70.Jz, 33.70.Jg, 33.20.Ea
Resume : Trente-neuf spectres de CO2 elargis par l’air ont ete enregistres a haute resolution et entre 215 et 294 K. Leuranalyse par une technique de moindres carres multi-spectres non-lineaires a permis de determiner la dependance en tem-perature des coefficients d’elargissement Lorentzien et des coefficients de deplacement induits par l’air pour plus de 100transitions individuelles de 12C16O2 dans les bandes 30012/00001 (a 6348 cm–1) et 30013/00001 (a 6228 cm–1). Lesspectres ont ete enregistres avec deux spectrometres a transformee de Fourier differents (le FTS du National Solar Observ-atory a Kitt Peak en Arizona, et le FTS Bomem du CNRC a Ottawa) et avec des chemins d’absorption variant de 25 a121 m. La pression des echantillons s’etendait de 11 torr (CO2 pur) a 924 torr (CO2-air) avec des rapports de melangecompris entre ~1.5% et 11% (1 torr = 133,3224 Pa). Pour diminuer les erreurs systematiques et accroıtre la precision desparametres determines, une technique de moindres carres multi-spectres, incluant une contrainte basee sur l’expressionquantique de la dependance rovibrationelle des energies et intensites des raies, a ete utilisee plutot que des determinationsindividuelles raie par raie. Les resultats suggerent l’absence de dependance vibrationnelle pour la dependance en tempera-ture des coefficients d’elargissement et de deplacement induits par l’air. Les coefficients d’elargissement et de dependanceen temperature ont ete modelises par une methode semi-classique basee sur le formalisme de Robert–Bonamy. Un bon ac-cord a ete trouve entre les resultats mesures et calcules. Pour |m| en dessus de 26, un simple facteur d’echelle (0,96) a eteutilise pour que le calcul des coefficients d’elargissement corresponde aux observations.
[Traduit par la Redaction]
Received 11 October 2008. Accepted 21 November 2008. Published on the NRC Research Press Web site at cjp.nrc.ca on 15 July 2009.
A. Predoi-Cross.2 Department of Physics and Astronomy, University of Lethbridge, Lethbridge, AB T1K 3M4, Canada.A.R.W. McKellar. Steacie Institute for Molecular Sciences, National Research Council of Canada, Ottawa, ON K1A 0R6, Canada.D.C. Benner and V.M. Devi. The College of William and Mary, Williamsburg, VA 23187-8795, USA.R.R. Gamache. Department of Environmental, Earth, and Atmospheric Sciences, University of Massachusetts Lowell, Lowell, MA01854, USA.C.E. Miller, R.A. Toth, and L.R. Brown. Jet Propulsion Laboratory, California Institute of Technology, Pasadena, CA 91109, USA.
1This article is part of a Special Issue on Spectroscopy at the University of New Brunswick in honour of Colan Linton and Ron Lees.2Corresponding author (e-mail: [email protected]).
517
Can. J. Phys. 87: 517–535 (2009) doi:10.1139/P08-137 Published by NRC Research Press

1. IntroductionThe Earth’s atmosphere bears the fingerprint of human in-
fluences. Our knowledge and understanding of spatial andtemporal patterns in the Earth’s carbon cycle, and ultimatelyof global warming and climate change, are directly linked toour ability to monitor the atmospheric CO2, a well-mixedgreenhouse gas with a very long lifetime. A crucial objec-tive in monitoring a greenhouse gas is to understand the spa-tial and temporal fluctuations in surface fluxes.
Satellite-based remote sensing of CO2 can provide a globaldistribution of its concentrations with a precision better than1%. Such a precision is difficult to achieve because thechanges in the surface pressure can affect the retrievals ofcolumn concentrations of CO2 more than the natural varia-tions due to its sources and sinks. Currently, there are severalsatellite remote sounding instruments designed to measurecolumn concentrations of CO2 (e.g., the Atmospheric InfraredSounder (AIRS) [1] and the Infrared Atmospheric SounderInterferometer (IASI) [2]) using mid-infrared wavelengths;next year, two more (the Orbiting Carbon Observatory(OCO) [3] and the Greenhouse Gases Observing Satellite(GOSAT) [4]) are scheduled for launch, which will targetnear-IR transitions of CO2, particularly those near 1.6 mm.For tropospheric remote sensing, reliable pressure broadeningspectroscopy is essential. For the new missions like OCO andGOSAT, accuracies better than 1% are needed for the CO2air-broadening coefficients. Unfortunately, the temperaturedependence coefficients for air-broadening of all CO2 bandsused by the atmospheric community come from unpublishedand unconfirmed predictions made 18 years ago [5].
To satisfy the new requirements, studies were undertakento obtain air-broadened Lorentz widths of CO2 at room tem-perature. The most extensive study was that by Toth et al.[6], who reported air-broadened half-width and air-inducedpressure shift coefficients for over 400 transitions belongingto 11 12CO2 bands between 4750 and 7000 cm–1. In contrast,no past infrared measurements were available for the tem-
perature dependence of air-broadened CO2 widths, as seenin Table 1. Instead, the older studies obtained self-, N2-,O2- and Ar-broadening at different temperatures, and mostreported values for relatively few transitions. Many of these[6–18] involved mid-infrared bands; only two studies [19,20] considered temperature dependence in 30012/00001 at6348 cm–1 and 30013/00001 at 6228 cm–1. Significantly,most of the temperature dependence analyses assumed Voigtline shapes.
Subsequently, independent studies at room temperature[21–24] found that Voigt profiles were insufficient to repro-duce observed line shapes in high-quality laboratory spectra.Devi et al. [21, 22] measured the 30012/00001 and30013/00001 bands using comprehensive multispectrumnonlinear least-squares and concluded that the best resultswere obtained using a speed-dependent Voigt (SDV) profile,with line mixing effects determined via the relaxation matrixformalism [27]. Following this, Predoi-Cross et al. [23, 24]published an independent room temperature study of air-and self-broadening and shifts and weak (Rosenkranz) linemixing coefficients for transitions of the same two bands,using spectra from a different spectrometer and a differentmultispectrum retrieval software. The absorption profileswere analyzed using both Voigt and speed-dependent Voigtprofiles, with an associated asymmetric component due toline mixing. The air-broadened half-width and line mixingcoefficients were then modeled using the energy power gap(EPG) and energy corrected sudden (ECS) scaling laws. Onedifference in the two sets of studies was that in Devi et al.[21, 22] the retrieval technique was modified to adjust therovibrational constants and intensity parameters (includingHerman–Wallis terms) of the entire band(s) in the fitted in-terval rather than to retrieve individual positions and inten-sities of the transitions, as was done by Predoi-Cross et al.[23, 24].
In one sense, the present study extends these multispec-trum analyses to obtain the temperature dependence of air-
Table 1. Summary of previous studies of temperature dependence of self- and foreign-broadening in carbon dioxide.
Ref.Vibrationalband
Temp. range(K) Technique
No. oflines Transitions studied Range of n Broadener
7 Laser 290–600 Laser 1 R14 0.54 Self8 n3 (emission) T>1000 Grating 6 R76 – R86 0.47- 0.53 Self8 Laser 1200–3000 Grating 4 P20-P26 n<0.51 Self9 n3 160, 298 Diode laser 5 P6-P60 Averaged 0.86 (9) N2
10 n3 295–815 Diode laser 3 R38 –R54 0.72 –0.73 N2
11 n3 296–803 Diode laser 2 R66, R68 0.66, 0.67 N2
12 n3 198, 296 Grating 42, 1 R0-R82 (smoothed) Ave = 0.72, R68 = 0.79 N2, O2, Self12 n1 + n2 198, 296 Grating 42 R0-R82 (smoothed) Ave = 0.72 N2, O2
13 n2 202.2–297.5 Diode laser 7 Q4-Q16 0.646–0.831 N2
14 n3 – n1 297, 387 Diode laser 1 P20 0.943, 0.827 N2
n3 – 2n2 1 R1815 n2 200–325 Diode laser 9 R20-R50 0.608–1.296 Self, N2
2n2 – n2 5 R19-R3616 n3 217–299 Diode laser 8 R36-R66 0.748–0.799 N2
n3 + n2 – n2 2 R46, R5517 n3 218–343 Grating 9 R66- R82 0.8 and 0.82 N2, O2
18 mi-IR 197–620 select lines 0.48–1.5 Self, N2,O2
19 2n1 + 2n2 + n3 197, 233, 294 FTS 22 P2-P44, R2-R40 No values tabulated Self, N2, Ar20 n1 + 4n2 + n3 197, 233, 294 FTS 22 P2-P54, R4-R50 No values tabulated Self, N2, Ar
518 Can. J. Phys. Vol. 87, 2009
Published by NRC Research Press

broadening coefficients (half-widths and pressure shifts) for30012/00001 and 30013/00001 bands of carbon dioxide.The broadening coefficients (widths, shifts, and temperaturedependences) were retrieved simultaneously using 39 spectraobtained with two different spectrometers. The positions, in-tensities, line mixing and speed-dependent Voigt coefficientswere constrained to the values obtained by Devi et al. [21,22]. The temperature dependence coefficients of the air-in-
duced pressure shifts were obtained for the first time. Themeasured air-broadened half-width coefficients and theirtemperature dependence exponents were found to be in sat-isfactory agreement with theoretical values.
2. Experimental detailsThe experiments described in this work were carried out
using two different Fourier transform spectrometers (FTS).The spectra with path lengths of 24.94, 49.00, and 121.2 mwere recorded at *0.011 cm–1 resolution with the Kitt PeakFTS and are part of the data set used in refs. 21 and 22. Thelong absorption paths were achieved using a 6 m base pathWhite cell. The atmospheric path between the White celland the entrance aperture of the FTS was purged with liquidnitrogen vapors through appropriate plexiglass tubing tominimize strong absorption features arising from CO2 andH2O. Other experimental details are given in Toth et al. [6,28].
All other spectra were recorded at the Steacie Institute forMolecular Sciences at the National Research Council in Ot-tawa using a Bomem DA3.002 Fourier Transform Spectrom-eter. The experimental details are very similar to those ofthe room temperature study in refs. 23 and 24. The spectrawere recorded at nominal spectral resolutions of 0.008 and0.009 cm–1. A large multiple-traversal gas cell described inrefs. 25 and 26 and listed in ref. 23 with a base length of5 m gave absorption paths of 40.15 to 80.15 m. A total of26 spectra recorded between 215.3 and 296.0 K, with sam-ple pressures varying from 59.8 to 798.0 torr (1 torr =133.322 4 Pa), as summarized in Table 2, were combinedwith the 13 Kitt Peak spectra. Each spectrum representedthe average of 24 to 32 interferograms, with a total data ac-quisition time of approximately 2 h.
The cell, which sits entirely inside a vacuum jacket, wascooled by means of methanol from a refrigerated coolingbath (Neslab Model ULT-80DD) that circulated throughcopper coils soldered to the outside of the cell. The gas tem-perature was monitored with readings from platinum resist-ance thermometers mounted on the cooling lines and insidethe cell, as well as from the temperature of the cooling bathitself. We estimated the accuracy of the temperature deter-mination to be ± 0.5 K, with a further uncertainty of ± 0.5K due to possible variations along the 5 m length of the cell.The uncertainties and possible inhomogeneties were greatestat the lowest temperature of 215 K. The temperatures werechecked spectroscopically using several line intensities re-trieved in ref. 23, with an estimated accuracy of ± 0.2 K.The readings of the temperature monitor were corrected ac-cordingly. As expected, the largest offset between the aver-age temperature determined in this manner and that given bythe temperature monitor was obtained at the lowest temper-ature.
The air and CO2 gas mixture were taken from a premixedcommercial cylinder (BOC Gases Canada) and had a quotedvolume mixing ratio of 0.096 CO2 with an uncertainty of2%. The volume mixing ratio (VMR) in each of the 26spectra was determined by fitting these spectra first individ-ually and finally simultaneously with the 13 Kitt Peak spec-tra such that the intensities of all transitions were identicalto those reported in refs. 21 and 22 by constraining the rovi-
Table 2. Summary of experimental conditions of the CO2
spectra analyzed in this work.
Temp (K) Pressure (torr) Patha (m) CO2 (VMR)Pure CO2
293.9 26.10b 24.94 1.0294.1 11.04b 24.94 1.0CO2 in air292.9 923.52 121.2 0.0593293.1 250.38 121.2 0.0595292.8 100.86 121.2 0.0605293.3 551.29 49.00 0.0152293.1 549.55 49.00 0.0499293.2 200.25 49.00 0.0155293.0 100.00 49.00 0.0160293.2 50.07 49.00 0.0749292.9 49.79 49.00 0.0160292.6 26.05 49.00 0.0679292.8 25.09 49.00 0.0170296.0 798.0 80.15 0.102296.0 501.0 80.15 0.102295.2 100.5 80.15 0.104291.0 492.0 80.15 0.102273.9 601.0 80.15 0.102273.9 401.0 80.15 0.102258.9 652.1 40.15 0.102258.9 500.8 40.15 0.103258.9 370.4 40.15 0.101258.9 249.5 40.15 0.101258.9 153.9 40.15 0.105258.9 77.8 40.15 0.106244.4 709.0 80.15 0.102234.4 600.2 60.15 0.102234.4 450.6 60.15 0.102234.4 299.9 60.15 0.102234.4 199.9 60.15 0.104234.4 100.3 60.15 0.104234.4 59.8 60.15 0.109219.0 749.0 80.15 0.102219.0 601.0 80.15 0.102219.0 450.5 80.15 0.102219.0 300.5 80.15 0.102215.3 601.7 40.15 0.102215.3 498.4 40.15 0.102215.3 301.3 40.15 0.102
Note: 1 atm = 101.3 kPa = 760 torr, VMR = volume mixingratio.
aSpectra with path lengths of 24.94, 121.2, and 49.00 m wererecorded at *0.011 cm–1 resolution with the Kitt Peak FTS; theremaining spectra were recorded at NRC with a Bomem FTS at*0.008 to 0.009 cm–1 resolution.
bPure natural CO2 samples (volume mixing ratio = 1 with0.9842 16O12C16O)
Predoi-Cross et al. 519
Published by NRC Research Press

Table 3. Temperature dependences of air-broadened half-width and pressure shift coefficients in the 30013/00001 band of carbon dioxide.
Line Positiona Intensityb bL0(air)c Unc. (%) nd %Unc. (%) rb-n d0(air)c Unc. d’(air)e Unc. rd0d0 SDd,f
P54e 6 175.528 178 3.4509�10–25 0.063 14 1.29 0.750 (F) –0.006 98 (81) 0.000 000 (F) 0.100P52e 6 177.856 086 4.9553�10–25 0.068 83 0.93 0.750 (F) –0.003 78 (63) 0.000 000 (F) 0.100P50e 6 180.152 596 7.0003�10–25 0.068 37 0.76 0.760 (F) –0.004 66 (51) 0.000 000 (F) 0.100P48e 6 182.417 925 9.7279�10–25 0.068 22 0.47 0.770 (F) –0.005 55 (32) 0.000 000 (F) 0.100P46e 6 184.652 290 1.3296�10–24 0.067 45 0.36 0.770 (F) –0.004 73 (24) 0.000 000 (F) 0.060P44e 6 186.855 909 1.7871�10–24 0.067 76 0.27 0.780 (F) –0.006 45 (17) 0.000 000 (F) 0.099P42e 6 189.028 995 2.3616�10–24 0.067 86 0.25 0.770 2.96 –0.496 –0.006 90 (16) –0.000 056 (7) +0.475 0.108P40e 6 191.171 758 3.0679�10–24 0.068 43 0.19 0.876 1.92 –0.523 –0.006 11 (12) –0.000 074 (5) +0.497 0.088P38e 6 193.284 405 3.9168�10–24 0.068 51 0.16 0.775 1.64 –0.544 –0.007 02 (10) –0.000 059 (4) +0.518 0.093P36e 6 195.367 137 4.9131�10–24 0.068 86 0.13 0.798 1.25 –0.565 –0.006 70 (08) –0.000 080 (3) +0.533 0.105P34e 6 197.420 146 6.0531�10–24 0.069 34 0.12 0.709 1.16 –0.586 –0.006 54 (07) –0.000 054 (2) +0.556 0.109P32e 6 199.443 622 7.3221�10–24 0.069 30 0.10 0.755 0.91 –0.605 –0.006 96 (06) –0.000 040 (2) +0.570 0.105P30e 6 201.437 743 8.6923�10–24 0.070 51 0.10 0.769 0.79 –0.623 –0.006 84 (06) –0.000 051 (2) +0.585 0.106P28e 6 203.402 679 1.0121�10–23 0.070 59 0.08 0.763 0.71 –0.635 –0.007 16 (05) –0.000 051 (1) +0.595 0.110P26e 6 205.338 591 1.1552�10–23 0.070 75 0.08 0.718 0.70 –0.645 –0.006 97 (05) –0.000 058 (1) +0.610 0.107P24e 6 207.245 631 1.2913�10–23 0.072 35 0.08 0.725 0.65 –0.657 –0.006 66 (05) –0.000 048 (1) +0.622 0.129P22e 6 209.123 937 1.4122�10–23 0.072 78 0.08 0.719 0.63 –0.660 –0.006 88 (05) –0.000 058 (1) +0.625 0.130P20e 6 210.973 638 1.5090�10–23 0.074 27 0.07 0.703 0.61 –0.664 –0.006 54 (04) –0.000 060 (1) +0.633 0.131P18e 6 212.794 851 1.5728�10–23 0.075 59 0.08 0.714 0.60 –0.675 –0.006 64 (05) –0.000 061 (1) +0.639 0.141P16e 6 214.587 680 1.5951�10–23 0.076 05 0.07 0.700 0.59 –0.672 –0.006 63 (04) –0.000 057 (1) +0.642 0.126P14e 6 216.352 216 1.5689�10–23 0.078 02 0.08 0.706 0.58 –0.678 –0.006 11 (04) –0.000 061 (1) +0.649 0.147P12e 6 218.088 537 1.4892�10–23 0.079 68 0.08 0.677 0.61 –0.681 –0.005 98 (05) –0.000 070 (1) +0.653 0.143P10e 6 219.796 708 1.3540�10–23 0.081 62 0.07 0.713 0.59 –0.690 –0.006 01 (05) –0.000 042 (1) +0.660 0.140P8e 6 221.476 778 1.1644�10–23 0.083 77 0.08 0.719 0.61 –0.697 –0.005 38 (06) –0.000 053 (1) +0.667 0.132P6e 6 223.128 784 9.2486�10–24 0.085 87 0.09 0.817 0.59 –0.711 –0.005 18 (07) –0.000 056 (2) +0.673 0.131P4e 6 224.752 748 6.4331�10–24 0.087 11 0.11 0.687 0.86 –0.723 –0.004 14 (09) –0.000 073 (2) +0.692 0.124P2e 6 226.348 677 3.3064�10–24 0.090 61 0.19 0.699 1.35 –0.744 –0.004 79 (16) –0.000 058 (3) +0.707 0.117R0e 6 228.689 986 1.6745�10–24 0.094 72 0.34 0.693 2.44 –0.757 –0.002 99 (31) –0.000 086 (6) +0.717 0.091R2e 6 230.215 765 4.9779�10–24 0.089 65 0.13 0.723 0.95 –0.736 –0.004 09 (11) –0.000 062 (2) +0.699 0.125R4e 6 231.713 419 8.0947�10–24 0.084 93 0.09 0.701 0.73 –0.719 –0.004 14 (07) –0.000 057 (2) +0.687 0.114R6e 6 233.182 890 1.0893�10–23 0.083 73 0.08 0.688 0.65 –0.705 –0.004 37 (06) –0.000 054 (1) +0.676 0.139R8e 6 234.624 105 1.3264�10–23 0.081 96 0.07 0.681 0.62 –0.696 –0.004 30 (05) –0.000 055 (1) +0.668 0.137R10e 6 236.036 977 1.5126�10–23 0.079 77 0.08 0.706 0.58 –0.690 –0.004 61 (05) –0.000 050 (1) +0.660 0.134R12e 6 237.421 403 1.6431�10–23 0.078 24 0.06 0.715 0.56 –0.685 –0.004 70 (04) –0.000 063 (1) +0.654 0.132R14e 6 238.777 268 1.7170�10–23 0.076 42 0.07 0.699 0.57 –0.681 –0.005 02 (04) –0.000 061 (1) +0.651 0.135R16e 6 240.104 444 1.7362�10–23 0.075 00 0.07 0.673 0.59 –0.678 –0.005 15 (04) –0.000 072 (1) +0.649 0.127R18e 6 241.402 787 1.7057�10–23 0.073 71 0.07 0.676 0.61 –0.676 –0.005 47 (04) –0.000 071 (1) +0.646 0.120R20e 6 242.672 143 1.6326�10–23 0.072 93 0.07 0.686 0.61 –0.675 –0.005 85 (04) –0.000 064 (1) +0.643 0.114R22e 6 243.912 344 1.5256�10–23 0.072 03 0.07 0.700 0.62 –0.674 –0.006 05 (04) –0.000 057 (1) +0.639 0.126R24e 6 245.123 209 1.3939�10–23 0.070 76 0.07 0.710 0.63 –0.671 –0.005 88 (04) –0.000 061 (1) +0.633 0.108R26e 6 246.304 549 1.2467�10–23 0.070 23 0.09 0.750 0.63 –0.668 –0.006 04 (05) –0.000 057 (1) +0.624 0.104R28e 6 247.456 161 1.0925�10–23 0.069 30 0.09 0.697 0.73 –0.660 –0.005 86 (05) –0.000 076 (1) +0.618 0.092R30e 6 248.577 833 9.3880�10–24 0.069 88 0.09 0.835 0.68 –0.650 –0.006 20 (05) –0.000 065 (2) +0.598 0.097
520C
an.J.
Phys.
Vol.
87,2009
Publishedby
NR
CR
esearchPress

brational and intensity parameters for all bands appearing ineach fitted interval. The revised values of the VMRs are re-ported in the table of experimental details (Table 2).
3. Spectroscopic analysisIn each fitted interval (6120–6280 cm–1 for 30013/
00001 and 6280–6395 cm–1 for 30012/00001), the line pa-rameters were retrieved using nonlinear multispectrum curvefitting technique [29], modified with constraints on positionsand on intensities, as was done in refs. 21 and 22. Briefly,the software adjusted the constants in (1) for positions,
ni ¼ G0 � G00 þ fB0J 0ðJ 0 þ 1Þ � D0½J 0ðJ 0 þ 1Þ�2
þH 0½J 0ðJ 0 þ 1Þ�3g � fB00J 00ðJ 00 þ 1Þ�D00½J 00ðJ 00 þ 1Þ�2 þ H 00½J 00ðJ 00 þ 1Þ�3g ð1Þ
and in (2) and (3) for intensities,
Si ¼SnniLiF
Qrn0
exp�C2E
00
T0
� �1� exp
�C2ni
T0
� �� �ð2Þ
where
F ¼ ½1þ a1mþ a2m2 þ a3m
3 þ a4J0ðJ 0 þ 1Þ�2 ð3Þ
In (1) to (3), ni denotes the wavenumber (cm–1) of the ithtransition, and prime and double prime denote the upperand lower vibrational levels, respectively. In (2), Li are theHonl–London factors and C2 represents the second radiationconstant; m is defined as –J@ in the P branch, J@ + 1 in theR branch, and zero in the Q branch. Other terms have theirusual meanings. The terms a1 and a2 in (3) were sufficientto describe the bands to the noise level of the spectra, oncethe speed dependence and line mixing were utilized. Thetemperature dependences of pressure-broadened half-widthand shift coefficients were determined using the expressionsgiven below,
bLðp; TÞ ¼ p"b0
LðairÞðp0; T0Þð1� cÞ T0
T
� �na
þb0LðselfÞðp0; T0Þc
T0
T
� �ns#ð4Þ
n ¼ n0 þ p½dðairÞð1� cÞ þ dðselfÞc� ð5Þ
dðTÞ ¼ d0ðT0Þ þ d0ðT � T0Þ ð6Þ
In (4) to (6), bL0 and d0 represent pressure-broadening and
pressure shift coefficients (in cm–1atm–1 at 296 K), respec-tively. bL (p, T) is the Lorentz half-width (in cm–1) of thespectral line at pressure p and temperature T, andbL
0(Gas)(p0, T0) is the Lorentz half-width coefficient of theline at the reference pressure p0 (1 atm) and temperature T0(296 K) of the broadening gas (either air or CO2), and c isthe ratio of the partial pressure of CO2 to the total samplepressure in the cell. The temperature dependence exponentsof air-broadened half-width coefficients are na and the tem-perature-dependent coefficients of air-induced shifts are d’.In the present study, the rovibrational constants (G’ – G@,B’, H’, D’, B@, D@, H@), intensity parameters (band strengthsT
able
3(c
oncl
uded
).
Lin
ePo
sitio
naIn
tens
ityb
b L0 (
air)
cU
nc.
(%)
nd%
Unc
.(%
)r
b-n
d0(a
ir)c
Unc
.d’
(air
)eU
nc.
rd0d0
SDd,
f
R32
e6
249.
669
344
7.91
45�
10–2
40.
069
150.
100.
812
0.79
–0.6
37–0
.006
32(0
6)–0
.000
054
(2)
+0.
586
0.08
6R
34e
625
0.73
046
36.
5495�
10–2
40.
068
460.
120.
831
0.90
–0.6
19–0
.007
13(0
7)–0
.000
038
(2)
+0.
569
0.07
1R
36e
625
1.76
095
35.
3223�
10–2
40.
068
570.
130.
754
1.21
–0.5
99–0
.007
12(0
8)–0
.000
030
(3)
+0.
557
0.09
6R
38e
625
2.76
056
74.
2488�
10–2
40.
067
340.
150.
742
1.54
–0.5
77–0
.006
11(0
9)–0
.000
072
(3)
+0.
540
0.07
4R
40e
625
3.72
905
43.
3328�
10–2
40.
068
020.
180.
826
1.79
–0.5
54–0
.007
14(1
1)–0
.000
074
(4)
+0.
519
0.07
6R
42e
625
4.66
615
72.
5696�
10–2
40.
066
680.
220.
711
2.77
–0.5
32–0
.006
65(1
4)–0
.000
064
(6)
+0.
508
0.08
2R
44e
625
5.57
161
51.
9476�
10–2
40.
066
710.
240.
770
(F)
–0.0
0694
(16)
0.00
000
0(F
)0.
096
R46
e6
256.
445
161
1.45
15�
10–2
40.
066
720.
310.
770
(F)
–0.0
0892
(21)
0.00
000
0(F
)0.
104
R48
e6
257.
286
530
1.06
39�
10–2
40.
068
010.
430.
760
(F)
–0.0
0652
(29)
0.00
000
0(F
)0.
100
R50
e6
258.
095
453
7.67
01�
10–2
50.
065
680.
590.
760
(F)
–0.0
0240
(38)
0.00
000
0(F
)0.
100
R52
e6
258.
871
660
5.43
96�
10–2
50.
067
270.
830.
750
(F)
–0.0
1216
(55)
0.00
000
0(F
)0.
100
a Zer
opr
essu
relin
epo
sitio
nsin
cm–1
,ca
lcul
ated
with
rovi
brat
iona
lco
nsta
nts
from
ref.
21.
b Lin
ein
tens
ities
are
incm
/mol
ecul
e-1at
296
Kfo
ra
natu
ral
CO
2sa
mpl
e(16
O12
C16
Ofr
actio
nof
0.98
42).
The
sear
eca
lcul
ated
usin
gth
evi
brat
iona
lba
ndin
tens
ityan
dH
erm
an-W
allis
fact
ors
[21]
.c M
easu
red
air-
broa
dene
dL
oren
tzha
lf-w
idth
and
pres
sure
-shi
ftco
effi
cien
tsar
ein
cm–1
atm
–1at
296
K.
d Tem
pera
ture
depe
nden
ceex
pone
nts
ofai
r-w
idth
coef
fici
ents
asw
ell
assp
eed
depe
nden
ce(S
D)p
aram
eter
sar
eun
itles
s.e T
hete
mpe
ratu
rede
pend
ent
coef
fici
ents
ofai
r-sh
ift
coef
fici
ents
are
incm
–1at
m–1
K–1
.f SD
para
met
ers
are
the
sam
eas
inre
f.21
,an
dw
ere
fixe
din
the
leas
t-sq
uare
sso
lutio
n.
Predoi-Cross et al. 521
Published by NRC Research Press

Table 4. Temperature dependences of air-broadened half-width and pressure shift coefficients in the 30012/00001 band of carbon dioxide.
Line Positiona Intensityb bL0(air)c Unc. (%) nd Unc. (%) rb-n d
0(air)c Unc. d’(air)e Unc. rd0d0 SDd,f
P54 6 295.319 760 2.9053�10–25 0.067 20 1.88 0.750 (F) –0.003 70 (124) (F) 0.100P52 6 297.618 696 4.2334�10–25 0.071 47 1.30 0.750 (F) –0.005 03 (92) 0.000 000 (F) 0.100P50 6 299.893 138 6.0610�10–25 0.067 76 0.90 0.760 (F) –0.006 32 (60) 0.000 000 (F) 0.100P48 6 302.142 651 8.5345�10–25 0.069 07 0.64 0.770 (F) –0.008 30 (44) 0.000 000 (F) 0.100P46 6 304.366 818 1.1813�10–24 0.068 12 0.47 0.770 (F) –0.006 67 (31) 0.000 000 (F) 0.100P44 6 306.565 245 1.6071�10–24 0.066 75 0.40 0.725 5.49 –0.504 –0.007 31 (26) –0.000 020 (12) +0.488 0.100P42 6 308.737 559 2.1484�10–24 0.068 22 0.31 0.821 3.45 –0.524 –0.006 10 (20) –0.000 047 (9) +0.498 0.100P40 6 310.883 404 2.8218�10–24 0.068 60 0.25 0.884 2.34 –0.546 –0.006 69 (16) –0.000 050 (6) +0.511 0.100P38 6 313.002 446 3.6404�10–24 0.068 46 0.20 0.804 1.93 –0.571 –0.007 16 (13) –0.000 070 (5) +0.533 0.097P36 6 315.094 369 4.6118�10–24 0.068 99 0.16 0.813 1.49 –0.593 –0.006 40 (11) –0.000 077 (4) +0.551 0.095P34 6 317.158 873 5.7353�10–24 0.068 95 0.15 0.755 1.30 –0.615 –0.006 33 (9) –0.000 077 (3) +0.572 0.102P32 6 319.195 679 6.9991�10–24 0.069 36 0.13 0.719 1.14 –0.634 –0.006 84 (8) –0.000 059 (2) +0.592 0.114P30 6 321.204 523 8.3778�10–24 0.070 08 0.11 0.743 0.96 –0.650 –0.007 16 (7) –0.000 057 (2) +0.606 0.094P28 6 323.185 158 9.8306�10–24 0.070 76 0.10 0.770 0.82 –0.662 –0.006 84 (6) –0.000 065 (2) +0.617 0.108P26 6 325.137 354 1.1301�10–23 0.071 23 0.10 0.786 0.73 –0.671 –0.007 05 (6) –0.000 062 (2) +0.627 0.112P24 6 327.060 897 1.2717�10–23 0.071 74 0.10 0.722 0.75 –0.676 –0.007 11 (5) –0.000 049 (1) +0.640 0.109P22 6 328.955 587 1.3993�10–23 0.072 63 0.08 0.733 0.70 –0.681 –0.006 69 (5) –0.000 057 (1) +0.646 0.122P20 6 330.821 242 1.5035�10–23 0.074 13 0.08 0.725 0.68 –0.684 –0.006 25 (5) –0.000 069 (1) +0.652 0.124P18 6 332.657 693 1.5750�10–23 0.075 13 0.08 0.741 0.65 –0.688 –0.006 33 (5) –0.000 066 (1) +0.657 0.127P16 6 334.464 787 1.6045�10–23 0.076 38 0.08 0.711 0.68 –0.693 –0.006 61 (5) –0.000 057 (1) +0.664 0.144P14 6 336.242 384 1.5843�10–23 0.077 96 0.09 0.704 0.67 –0.696 –0.005 88 (5) –0.000 071 (1) +0.669 0.144P12 6 337.990 359 1.5091�10–23 0.079 90 0.09 0.687 0.68 –0.701 –0.005 92 (5) –0.000 070 (1) +0.675 0.143P10 6 339.708 601 1.3760�10–23 0.081 58 0.09 0.698 0.69 –0.709 –0.006 09 (6) –0.000 050 (1) +0.683 0.132P8 6 341.397 014 1.1861�10–23 0.083 68 0.10 0.705 0.71 –0.721 –0.005 42 (7) –0.000 058 (2) +0.693 0.139P6 6 343.055 514 9.4379�10–24 0.086 08 0.10 0.782 0.72 –0.738 -0.004 37 (8) -0.000 072 (2) +0.701 0.127P4 6 344.684 032 6.5732�10–24 0.087 02 0.14 0.709 0.94 -0.751 -0.005 26 (10) -0.000 069 (2) +0.719 0.115P2 6 346.282 512 3.3809�10–24 0.090 36 0.22 0.673 1.59 -0.770 -0.004 81 (19) -0.000 071 (4) +0.736 0.129R0 6 348.623 821 1.7134�10–24 0.095 75 0.41 0.646 3.00 -0.782 -0.004 37 (38) -0.000 072 (8) +0.748 0.097R2 6 350.147 049 5.0877�10–24 0.089 42 0.16 0.725 1.09 -0.762 -0.003 18 (13) -0.000 068 (3) +0.727 0.122R4 6 351.640 149 8.2642�10–24 0.085 97 0.12 0.701 0.83 -0.745 -0.004 61 (9) -0.000 055 (2) +0.715 0.122R6 6 353.103 126 1.1103�10–23 0.083 87 0.10 0.670 0.76 -0.730 -0.004 73 (7) -0.000055 (2) +0.705 0.128R8 6 354.535 998 1.3490�10–23 0.082 02 0.09 0.701 0.68 -0.720 -0.004 55 (6) -0.000 051 (1) +0.693 0.131R10 6 355.938 798 1.5342�10–23 0.079 93 0.09 0.696 0.66 –0.713 –0.004 59 (6) –0.000 057 (1) +0.686 0.136R12 6 357.311 570 1.6613�10–23 0.077 81 0.08 0.695 0.66 –0.707 –0.004 30 (5) –0.000 070 (1) +0.680 0.132R14 6 358.654 375 1.7295�10–23 0.076 53 0.08 0.680 0.67 –0.704 –0.004 92 (5) –0.000 063 (1) +0.678 0.134R16 6 359.967 286 1.7414�10–23 0.074 85 0.08 0.672 0.68 –0.701 –0.004 98 (5) –0.000 083 (1) +0.676 0.117R18 6 361.250 392 1.7026�10–23 0.073 55 0.08 0.653 0.72 –0.699 –0.005 60 (5) –0.000 068 (1) +0.674 0.124R20 6 362.503 794 1.6211�10–23 0.072 82 0.08 0.693 0.69 –0.700 –0.006 45 (5) –0.000 065 (1) +0.670 0.116R22 6 363.727 610 1.5060�10–23 0.071 91 0.08 0.705 0.71 –0.701 –0.006 11 (5) –0.000 061 (1) +0.668 0.123R24 6 364.921 972 1.3673�10–22 0.071 31 0.10 0.712 0.73 –0.699 –0.005 92 (5) –0.000 062 (1) +0.663 0.111R26 6 366.087 028 1.2146�10–22 0.070 01 0.10 0.703 0.78 –0.696 –0.006 36 (6) –0.000 052 (1) +0.657 0.111R28 6 367.222 941 1.0566�10–23 0.070 73 0.10 0.790 0.76 –0.692 –0.005 74 (6) –0.000 086 (1) +0.645 0.112
522C
an.J.
Phys.
Vol.
87,2009
Publishedby
NR
CR
esearchPress

and Herman–Wallis coefficients), self- and air-line mixingcoefficients were fixed to the appropriate values reported inrefs. 21 and 22, respectively, for the two bands. However,the individual air-broadened half-width coefficients, air-in-duced pressure shift coefficients, and their temperature de-pendences were adjusted. The resulting line parameters arelisted in Tables 3 and 4 along with their uncertainties (de-scribed later). The line positions and intensities are thesame as in refs. 21 and 22 and are shown here for identifi-cation and convenience of the readers.
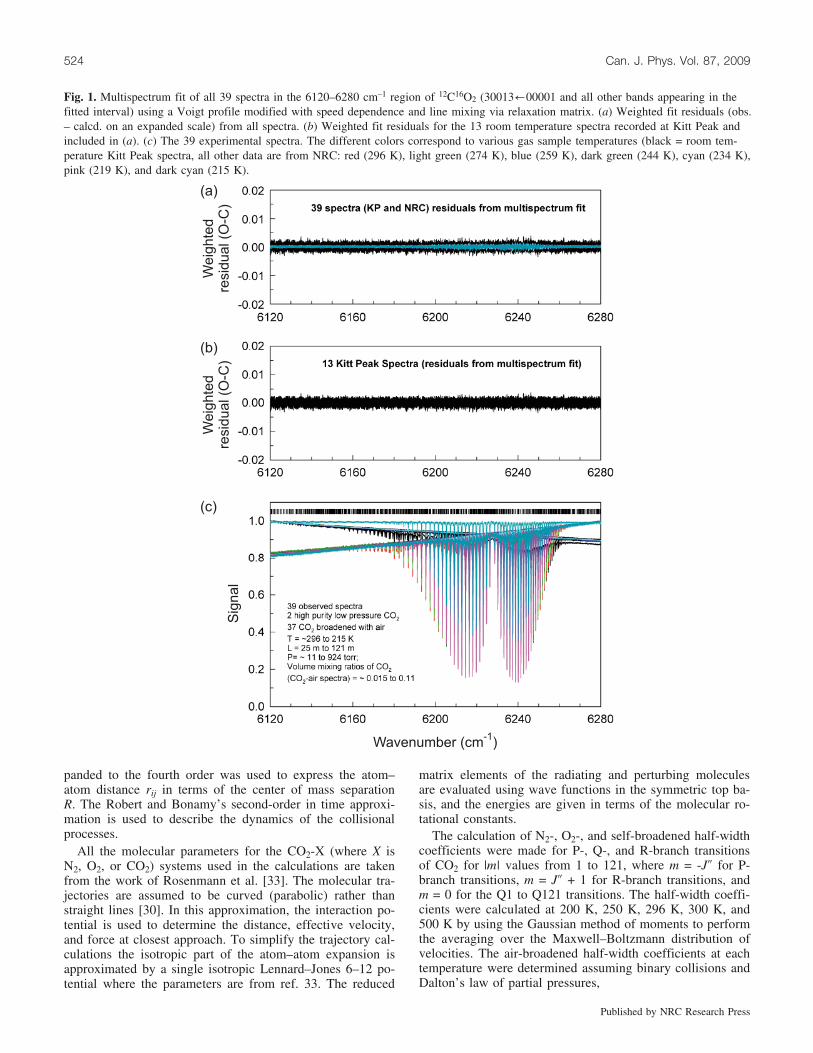
The final multispectrum fit for the region of the 30013/00001 band is shown in Fig. 1, where the observed lineshapes are modeled with speed-dependent Voigt profilesand asymmetric line mixing (off-diagonal relaxation matrix).The bottom panel (Fig. 1c) displays all 39 experimentalspectra. The other two panels demonstrate that properweighting schemes are employed by showing the weightedobs. – calcd. residuals for (Fig. 1b) the 13 Kitt Peak roomtemperature spectra and (Fig. 1a) all 39 (room and cold)spectra. In Fig. 2 is a short spectral interval from Fig. 1 re-plotted to show in detail the 3 transitions, R16 to R20.
4. Theoretical calculationsThe half-width coefficients of self-, O2- and N2-perturbed
carbon dioxide were modeled using semiclassical calcula-tions based on the real components of the Robert–Bonamytheory [30] (RRB). In this theoretical approach we can ex-press the half-width coefficient, g, (which corresponds tobL
0, used elsewhere in this article) of any given rovibrationaltransition f/i as the real part of the corresponding diagonalelement of the complex relaxation matrix. In this semiclassi-cal framework, the half-width coefficients can be computedusing the elements of the Liouville scattering matrix [31, 32],
g i f ¼n2
2pcv 1� e�RS2 f ;i;J2;v;b
� �� �� v;b;J
ð7Þ
where n2 is the number density of perturbers and hiv;b;J is anaverage over all possible molecular trajectories of impactparameter b, initial relative velocity v, and the initial rota-tional quantum number J2 of the collision partner. In (7),RS2 is the real part of the second-order term in the expansionof the scattering matrix. The size of the RS2 term depends on(i), the rovibrational states involved in the transition and as-sociated collision induced jumps from these energy level,(ii), the intermolecular potential, and (iii), the collision dy-namics. Not present in (7) are the vibrational dephasingterm, S1, which appears only for transitions where there is achange in the vibrational state, and the imaginary part of theS2 term. The potential leading to S1 is written in terms of theisotropic induction and London dispersion interactions thatdepend on the vibrational dependence of the dipole momentand the polarizability of the radiating molecule. Since theseparameters are not available for CO2, the S1 term has beenomitted from the theoretical calculation. The effect of theimaginary part of S2 will be investigated in a future study.
The intermolecular potential used in our calculations hasboth an electrostatic component (quadrupole moments ofCO2 with the quadrupole moment of N2, O2, or CO2) andan atom–atom component based on parameters published byRosenmann et al. [33]. The expression of Sack [34] ex-T
able
4(c
oncl
uded
).
Lin
ePo
sitio
naIn
tens
ityb
b L0 (
air)
cU
nc.
(%)
ndU
nc.
(%)
rb-
nd0 (
air)
cU
nc.
d’(a
ir)e
Unc
.rd0d0
SDd,
fa-1
b–1
2161216c
–1–1de–1–1–1f
R30
636
8.32
989
09.
0073�
10–2
40.
070
420.
110.
808
0.82
–0.6
81–0
.006
60(7
)–0
.000
063
(1)
+0.
630
0.10
1R
326
369.
408
071
7.53
00�
10–2
40.
069
450.
130.
834
0.90
–0.6
67–0
.006
68(7
)–0
.000
052
(2)
+0.
614
0.09
9R
346
370.
457
696
6.17
59�
10–2
40.
068
890.
150.
819
1.09
–0.6
50–0
.007
13(9
)–0
.000
027
(3)
+0.
600
0.09
2R
366
371.
478
994
4.97
16�
10–2
40.
068
500.
160.
659
1.68
–0.6
34–0
.007
15(1
0)–0
.000
035
(3)
+0.
596
0.12
1g
R38
637
2.47
221
33.
9295�
10–2
40.
067
980.
190.
733
1.88
–0.6
10–0
.006
46(1
2)–0
.000
080
(4)
+0.
571
0.08
8R
406
373.
437
618
3.05
03�
10–2
40.
068
980.
230.
821
2.21
–0.5
83–0
.007
21(1
5)–0
.000
051
(5)
+0.
545
0.11
2g
R42
637
4.37
549
32.
3261�
10–2
40.
067
360.
300.
771
3.17
–0.5
60–0
.006
12(1
9)–0
.000
031
(7)
+0.
529
0.10
0R
446
375.
286
142
1.74
30�
10–2
40.
068
430.
380.
782
4.40
–0.5
38–0
.006
67(2
5)–0
.000
085
(10)
+0.
513
0.10
0R
466
376.
169
887
1.28
35�
10–2
40.
066
920.
430.
770
(F)
–0.0
0669
(29)
0.00
000
0(F
)0.
100
R48
637
7.02
707
29.
2908�
10–2
50.
068
260.
590.
760
(F)
–0.0
0608
(40)
0.00
000
0(F
)0.
100
R50
637
7.85
806
26.
6115�
10–2
50.
067
330.
830.
760
(F)
–0.0
0062
(55)
0.00
000
0(F
)0.
100
a Zer
opr
essu
relin
epo
sitio
nsin
cm-1
are
calc
ulat
edus
ing
the
rovi
brat
iona
lco
nsta
nts
repo
rted
inre
f.22
.T
hey
are
liste
dfo
rco
nven
ienc
eto
the
read
er.
b Lin
ein
tens
ities
incm
/mol
ecul
e–1at
296
Kfo
ra
natu
ral
CO
2sa
mpl
e(16
O12
C16
Ofr
actio
nof
0.98
42)
are
calc
ulat
edus
ing
the
vibr
atio
nal
band
inte
nsity
and
Her
man
–Wal
lis
fact
ors
inre
f.22
.c M
easu
red
air-
broa
dene
dL
oren
tzw
idth
and
pres
sure
-shi
ftco
effi
cien
tsar
ein
cm–1
atm
–1at
296
K.
d Tem
pera
ture
depe
nden
ceex
pone
nts
ofai
r-br
oade
ned
half
-wid
thco
effi
cien
tsas
wel
las
spee
dde
pend
ence
(SD
)pa
ram
eter
sar
eun
itles
s.e T
hete
mpe
ratu
rede
pend
ent
coef
fici
ents
ofai
r-sh
ift
coef
fici
ents
are
incm
–1at
m–1
K–1
.f SD
para
met
ers
are
the
sam
eas
inre
f.22
and
wer
efi
xed
inth
epr
esen
tle
ast-
squa
res
solu
tion.
g Ret
aine
din
the
fit.
Predoi-Cross et al. 523
Published by NRC Research Press
panded to the fourth order was used to express the atom–atom distance rij in terms of the center of mass separationR. The Robert and Bonamy’s second-order in time approxi-mation is used to describe the dynamics of the collisionalprocesses.
All the molecular parameters for the CO2-X (where X isN2, O2, or CO2) systems used in the calculations are takenfrom the work of Rosenmann et al. [33]. The molecular tra-jectories are assumed to be curved (parabolic) rather thanstraight lines [30]. In this approximation, the interaction po-tential is used to determine the distance, effective velocity,and force at closest approach. To simplify the trajectory cal-culations the isotropic part of the atom–atom expansion isapproximated by a single isotropic Lennard–Jones 6–12 po-tential where the parameters are from ref. 33. The reduced
matrix elements of the radiating and perturbing moleculesare evaluated using wave functions in the symmetric top ba-sis, and the energies are given in terms of the molecular ro-tational constants.
The calculation of N2-, O2-, and self-broadened half-widthcoefficients were made for P-, Q-, and R-branch transitionsof CO2 for |m| values from 1 to 121, where m = -J@ for P-branch transitions, m = J@ + 1 for R-branch transitions, andm = 0 for the Q1 to Q121 transitions. The half-width coeffi-cients were calculated at 200 K, 250 K, 296 K, 300 K, and500 K by using the Gaussian method of moments to performthe averaging over the Maxwell–Boltzmann distribution ofvelocities. The air-broadened half-width coefficients at eachtemperature were determined assuming binary collisions andDalton’s law of partial pressures,
Fig. 1. Multispectrum fit of all 39 spectra in the 6120–6280 cm–1 region of 12C16O2 (30013/00001 and all other bands appearing in thefitted interval) using a Voigt profile modified with speed dependence and line mixing via relaxation matrix. (a) Weighted fit residuals (obs.– calcd. on an expanded scale) from all spectra. (b) Weighted fit residuals for the 13 room temperature spectra recorded at Kitt Peak andincluded in (a). (c) The 39 experimental spectra. The different colors correspond to various gas sample temperatures (black = room tem-perature Kitt Peak spectra, all other data are from NRC: red (296 K), light green (274 K), blue (259 K), dark green (244 K), cyan (234 K),pink (219 K), and dark cyan (215 K).
524 Can. J. Phys. Vol. 87, 2009
Published by NRC Research Press

gair ¼ 0:79� gN2þ 0:21� gO2
ð8Þ
For atmospheric applications, both the temperature and pres-sure dependence of half-width coefficients are required on aline by line basis. The temperature scaling law [35] can beused to determine the temperature dependence exponents nof the half-width coefficient,
gðTÞ ¼ gðT0ÞT0
T
�nð9Þ
In recent years it has been shown that for some gas-pertur-ber systems, such as foreign-broadened water, this scalinglaw does not apply [25–37]. However as seen later, thisdoes not seem to be the case for the present data.
The theoretical values of the temperature dependence ex-ponents n were determined for each transition by a least-squares fits of ln[g(T)/g(T0)] vs. ln[To/T] over the tempera-
ture range 200 to 500 K. We were also able to determinethe error in the temperature dependence exponents using thehalf-width values at any two of the five temperaturesstudied. This procedure provided ten 2-point temperature de-pendence exponents. The difference between each 2-pointtemperature dependence exponent and the 5-point fit valueis calculated. The errors quoted in this work are the largestof these differences and believed to be more reliable thanthe statistical values taken from the fit. Table 5 gives therange of theoretical values for g at 296 K and n.
5. Discussion of resultsWe performed a number of comparisons to assess the
quality of our retrieved broadening coefficients (air-broad-ened widths, pressure shifts, and their temperature depend-ences). First, we noted that corresponding measurements forthe two bands were in very close agreement for transitions
Fig. 2. An expanded portion from Fig. 1 illustrating the multispectrum fit for R16 to R20 transitions of the 30013/00001 band. (a)Weighted fit residual for all 39 spectra. (b) Weighted fit residual for the 13 Kitt Peak room temperature spectra. (c) The 39 experimentalspectra.
Predoi-Cross et al. 525
Published by NRC Research Press

Table 5. Calculated minimum and maximum values for the Lorentz half-width coefficients and temperature dependence exponents for CO2 broadenedby N2, O2, air, and CO2.
System gmin (cm–1 atm–1) gmax (cm–1 atm–1) nmin nmax
CO2-N2 0.0496 0.0965 0.398 0.771CO2-O2 0.0362 0.0728 0.185 0.787CO2-air 0.0468 0.0915 0.364 0.769CO2-CO2 0.0493 0.1239 0.488 0.748
Fig. 3. Experimental air-broadening coefficients for the 30013/00001 and 30012/00001 bands of 12C16O2 retrieved using constrainedmultispectrum fits. The horizontal axis is m, equal to -J@ for P-branch lines and J@+1 for R-branch lines. (a) Half-width coefficients.(b) Percentage differences of averaged half-width coefficients to corresponding values in the 30012/00001 band. (c) Pressure shift coeffi-cients. (d) Percentage differences of averaged air-induced shift coefficients to corresponding values in the 30012/00001 band. For simpli-city, the percentage differences in (b) and (d) are computed using coefficients from 30012/00001 band, because the values for the otherband give only mirror images.
526 Can. J. Phys. Vol. 87, 2009
Published by NRC Research Press

with the same rotational quantum assignment (DJ, J@). Thisis demonstrated in Figs. 3a and 3c and 4a and 4c, where theair-broadening measurements (widths, shifts, and theirtemperature dependences) for 30012/00001 and 30013/00001 are plotted together as a function of m (where m =–J@ for P-branch lines and J@+1 for R-branch lines). Also,for each m value, we averaged the coefficients for transi-tions in the 30012/00001 and 30013/00001 vibrationalbands. The percentage differences between the average andthe individual measurements are displayed in panels (b) and(d) of Figs. 3 and 4. For the air-broadened widths and pres-sure shifts in Figs. 3a and 3c, the mean percentage differen-ces are, respectively, +0.2(0.6) and +1(7), while for thetemperature dependence coefficients of air-broadened widthsand pressure shifts in Figs. 4a and 4c, the mean percentagedifferences are, respectively, +0.05(2.27) and +1(10). Thelarger scatter observed in panels (b) and (d) of Figs. 3 and4 for high values of |m| was attributed to the weakness of
the absorptions in the fitted data. As seen previously [e.g.,6, 21–24], the air-broadened half-width coefficients haveminimal vibrational dependence, whereas the air-inducedshift coefficients in the 30012/00001 band are slightlylarger than those for the 30013/00001 band.
Encouraged by the excellent agreement seen in Figs. 3and 4, we averaged the pairs of observed values with thesame rotational quantum assignment in the two bands. Thevalues for all four types of broadening coefficients (widths,shifts, and the temperature dependence of widths and shifts)are presented in Table 6, along with their respective percent-age differences.
In Fig. 5, we compare the mean observed values from Ta-ble 6 and the theoretically predicted air-broadened half-width coefficients and their temperature dependences as afunction of |m|. The error bars are plotted for the observedvalues, but these are usually smaller than the plot symbols.Note that P-branch values are of even |m|, while R-branch
Fig. 4. Similar to Fig. 3, the temperature dependence exponents for air-broadening coefficients for the 30013/00001 and 30012/00001bands of 12C16O2 retrieved using constrained multispectrum fits. (a) n for half-widths. (b) Percentage differences from averaged n minus30012/00001 values. (c) Temperature dependent coefficients (d’) of air-induced shift coefficients. (d) Percentage differences from averagedd’ minus 30012/00001 measurements.
Predoi-Cross et al. 527
Published by NRC Research Press

Table 6. Air-broadening coefficients for 12C16O2 averaged from measurements of 30013/00001 and 30012/00001 bands.
Line Width RMS (%) n RMS (%) Shift (unc.) d’ Error (%)P(54) 0.0652 3.1 –5.34(74)P(52) 0.0702 1.9 –4.40(56)P(50) 0.0681 –0.4 –5.49(39)P(48) 0.0686 0.6 –6.93(27)P(46) 0.0678 0.5 –5.70(20)P(44) 0.0673 –0.8 –6.88(16)P(42) 0.0680 0.3 0.796 3.2 –6.50(13) –5.13 –9.1P(40) 0.0685 0.1 0.880 0.5 –6.40(10) –6.20 –19.2P(38) 0.0685 0.0 0.790 1.8 –7.09(08) –6.39 8.2P(36) 0.0689 0.1 0.806 0.9 –6.55(07) –7.89 –1.9P(34) 0.0691 –0.3 0.732 3.2 –6.44(06) –6.53 17.5P(32) 0.0693 0.0 0.737 –2.4 –6.90(04) –4.99 19.0P(30) 0.0703 –0.3 0.756 –1.7 –7.00(04) –5.36 5.6P(28) 0.0707 0.1 0.766 0.5 –7.00(04) –5.79 11.9P(26) 0.0710 0.3 0.752 4.5 –7.01(03) –6.00 3.4P(24) 0.0720 –0.4 0.723 –0.2 –6.89(04) –4.85 1.2P(22) 0.0727 –0.1 0.726 0.9 –6.78(03) –5.75 –0.9P(20) 0.0742 –0.1 0.714 1.5 –6.40(03) –6.42 6.8P(18) 0.0754 –0.3 0.727 1.8 –6.48(04) –6.36 4.4P(16) 0.0762 0.2 0.706 0.8 –6.62(03) –5.68 0.3P(14) 0.0780 0.0 0.705 –0.1 –5.99(03) –6.58 7.9P(12) 0.0798 0.1 0.682 0.8 –5.95(04) –6.94 0.4P(10) 0.0816 0.0 0.706 –1.0 –6.05(04) –4.63 8.6P(8) 0.0837 –0.1 0.712 –1.0 –5.40(04) –5.59 4.4P(6) 0.0860 0.1 0.800 –2.2 –4.78(05) –6.38 12.6P(4) 0.0871 –0.1 0.698 1.6 –4.70(07) –7.09 –3.2P(2) 0.0905 –0.1 0.686 –1.9 –4.80(12) –6.47 10.1R(0) 0.0952 0.5 0.669 –3.6 –3.68(24) –7.87 –8.8R(2) 0.0895 –0.1 0.724 0.1 –3.63(09) –6.50 4.9R(4) 0.0855 0.6 0.701 0.0 –4.38(06) –5.61 –1.3R(6) 0.0838 0.1 0.679 –1.3 –4.55(05) –5.46 0.4R(8) 0.0820 0.0 0.692 1.4 –4.43(04) –5.32 –3.8R(10) 0.0799 0.1 0.701 –0.7 –4.60(04) –5.33 6.7R(12) 0.0780 –0.3 0.705 –1.4 –4.50(03) –6.64 5.8R(14) 0.0765 0.1 0.690 –1.4 –4.97(03) –6.24 1.5R(16) 0.0749 –0.1 0.672 –0.1 –5.06(03) –7.74 7.3R(18) 0.0736 –0.1 0.665 –1.8 –5.53(03) –6.97 –2.1R(20) 0.0729 –0.1 0.689 0.5 –6.15(03) –6.46 0.9R(22) 0.0720 –0.1 0.702 0.4 –6.08(03) –5.90 3.0R(24) 0.0710 0.4 0.711 0.2 –5.90(03) –6.12 1.0R(26) 0.0701 –0.2 0.726 –3.2 –6.20(04) –5.46 –4.1R(28) 0.0700 1.0 0.743 6.3 –5.80(04) –8.08 6.5R(30) 0.0702 0.4 0.822 –1.6 –6.40(04) –6.41 –1.2R(32) 0.0693 0.2 0.823 1.3 –6.50(05) –5.28 –2.0R(34) 0.0687 0.3 0.825 –0.7 –7.13(05) –3.21 –17.0R(36) 0.0685 –0.1 0.707 –6.7 –7.14(06) –3.23 8.7R(38) 0.0677 0.5 0.738 –0.6 –6.28(08) –7.62 5.7R(40) 0.0685 0.7 0.823 –0.4 –7.18(10) –6.25 –19.0R(42) 0.0670 0.5 0.741 4.1 –6.38(11) –4.77 –36.1R(44) 0.0676 1.3 –6.81(15)R(46) 0.0668 0.2 –7.80(18)R(48) 0.0681 0.2 –6.30(25)
Note: Width coefficients (HWHM) are in units of cm–1atm–1 at 296 K. The temperature dependencecoefficients of widths (n) are unitless. The pressure shift coefficients are in 10–3 cm–1 atm–1 at 296 K. Thetemperature dependence of shift coefficients (d’) are in units of 10–5 cm–1 atm–1 K–1.
528 Can. J. Phys. Vol. 87, 2009
Published by NRC Research Press

transitions are odd |m|, and we use open and solid plottingsymbols to reveal if the coefficients also vary as a functionof DJ. The corresponding theoretical air-broadening widthsand their temperature dependences are shown to |m| = 101by solid curves in Fig. 5a and for widths and temperaturedependence of widths in Fig. 5b. As shown in Fig. 5a, theobserved air-broadened half-width coefficients for the P-and R-branch transitions tend to lie on a smoothly changingcurve that is below the calculated values for |m| > 6 andabove them for |m| < 6.
In contrast in Fig. 5b, the temperature dependence of thewidths for P and R branches do not fall on the samesmoothly changing curve, and they are often different bymore than the percent agreement in the average n. Normally,such differences would be attributed to experimental error,since the observed widths do follow the trends predicted bytheory. However in the present study, two different bandsare analyzed using the same spectral data, and as seen inFig. 4, the observed differences in their temperature depend-ences are very similar at each m. In contrast, averaged tem-perature dependence in Fig. 5b is different from thecalculation by larger amounts; the P-and R-branch lines also
have slightly different observed values. One possibility isthat some systematic error in comparison with the calcula-tions was introduced in the retrievals, because the tempera-ture dependence of the line mixing could not be determinedwith the present dataset. Further investigation is needed toclarify this.
Nevertheless, both the measured widths and temperaturedependence coefficients do fall reasonably close to the cal-culated values up to |m| < 40. The agreement between theoryand empirical widths is best for 6 £ m £ 26. Between |m| =*26 and 55, the measured widths are lower than the calcu-lated values. There are two important exceptions, however.The ‘‘kink’’ predicted for the low |m| widths is not observedat all, while for the temperature dependence of widths, thelocal minimum at |m| = 14 is observed closer to |m| = 18.
Beyond the range of our empirical averages, the calcu-lated widths and temperature dependences steadily decreasewith increasing |m|, reaching widths of 0.055 cm–1 atm–1 at296 K and n of 0.5 at |m| = 101. To match the calculatedwidths to the averaged measurements, a scaling factor of0.96 was applied, and the resulting curve is shown by thedash-dot line in Fig. 5a. We feel that the best results for the
Fig. 5. Observed air-broadened half-width coefficients of P and R branches of 30013/00001 and 30012/00001 of 12CO2 compared withtheoretical predictions. The horizontal axis is |m|, equal to J@ for P-branch lines and J@+1 for R-branch lines. (a) Averaged measured half-widths from Table 6 (open and solid squares) with calculated values (solid line). The dash-dot-dash line shows the values recommended foratmospheric uses obtained by combining observed values (for |m| = 1–51) with calculated values (scaled by 0.96) for |m| = 52–101 (see textfor details). (b) Averaged temperature dependence exponents (n) of air-broadened half-width coefficients for the P and R branches with thetheoretical prediction (solid line). The horizontal dashed curve corresponds to the commonly used default value of n = 0.75.
Predoi-Cross et al. 529
Published by NRC Research Press

scientific community are the averaged measured air-broad-ened half-width coefficients for |m| up to 50 (Table 6) andthe scaled theoretical prediction above |m| = 50.
The recommendation for the temperature dependence ofair-broadened widths is less clear. For the entire range of|m| where measurements are available, the power law modelfits the calculated studies fairly well. Indeed, for most appli-cations, the power law gives a reasonable description of thetemperature dependence of the air-broadened half-width co-efficients over the range T = 200–500 K. Depending on therequirements of atmospheric applications, the theoreticalvalues might be sufficiently reliable. Measurements areneeded to validate the theoretical model at higher J.
The temperature dependence coefficients d’ for air-inducedshifts displayed in Fig. 4c vs. |m| represent the first measure-
ments in any CO2 band, but there is no obvious trend in theretrieved values of d’ with |m| or vibrational band. We ob-serve that within the scatter of the experimental data, mostof the d’ coefficients are about –6 � 10–5 cm–1 atm–1 K–1,and this is our recommended value for this coefficient.
The panels in Fig. 6 present the percentage differencesbetween the retrieved air-broadened half-width coefficientsand similar data sets available in the literature, plotted forboth the (Fig. 6a) 30013/00001 and (Fig. 6b) 30012/00001 bands as a function of m. The scatter in our percent-age differences occurs at very low or very high J values orin spectral regions where the lines overlap with hot bandtransitions. The present results agree best with the resultsfrom the room temperature study of Devi et al. [21] (also aconstrained multispectrum analysis) and those of Predoi-
Fig. 6. Percentage differences between present air-broadened widths and other reported measurements (PW – others)/PW � 100 for transi-tions in the (a) 30013/00001 band and (b) 30012/00001 bands. All values are plotted as a function of the m value. The mean and stan-dard deviation for each set of % differences are given in the legend.
530 Can. J. Phys. Vol. 87, 2009
Published by NRC Research Press

Cross et al. [24]. where the same type of line shape modelwas used. The differences between the present set of air-broadened half-width coefficients and those of Toth et al.[6] or HITRAN 2004 [38] are largely due to the differencein values between the half-width coefficients retrieved witha speed-dependent Voigt model with line mixing and thoseretrieved with the standard Voigt model.
The panels in Fig. 7 present the ratios between the re-trieved air-induced pressure shift parameters and data setsavailable in the literature, plotted as a function of m for boththe (Fig. 7a) 30013/00001 and (Fig. 7b) 30012/00001bands. For |m| > 40 and at very low m values, we can seethat the air-pressure shift coefficients are different than thosereported by Toth et al. [6] and Predoi-Cross et al. [24], but
these are still in good agreement with those from the roomtemperature constrained analysis studies [21, 22].
6. UncertaintiesUltimately, it is not the uncertainties in the half-width and
pressure shift parameters that are important, but the uncer-tainty in the half-width and pressure shift at the temperatureof the gas being simulated. When one uses a half-width at296 K and its temperature dependence exponent from a data-base such as the HITRAN, it is assumed that the half-widthsnear 296 K are the best determined and the uncertainty in nincreases the uncertainty in half-width as the temperaturegets farther from 296 K. In fact, for each line the experimen-tal values of the two half-width parameters and of the two
Fig. 7. Ratios of present air-broadened pressure shifts to other reported measurements for transitions in (a) the 30013/00001 band and(b) the 30012/00001 band. The data are plotted as a function of m. The mean and standard deviation for each set of ratios are given in thelegend.
Predoi-Cross et al. 531
Published by NRC Research Press

pressure shift parameters are highly correlated and the uncer-tainty as a function of temperature looks quite different.
32bL¼ T0
T
� �2n
32b0
Lþ bLðTÞln
T0
T
� �� �2
32n
þ 2rb0LnbLðTÞ
T0
T
� �nln
T0
T
� �3b0
L3n ð10Þ
32d ¼ 32
d0 þ ðT � T0Þ232d0 þ 2rd0d0 ðT � T0Þ3d03d0 ð11Þ
In these expressions, 3 is the uncertainty in the parameter inthe subscript, and r is the correlation between the two para-meters in the subscript. Tables 3 and 4 list these correlations(rb-n and rd0d0) for each spectral line.
Figure 8a displays the formal uncertainty in the air-broad-ened Lorentz half-width for each spectral line from P2 toP42 as a function of temperature for the 30013/00001
band measured in this study. The uncertainties in half-widthcoefficients for the low J lines are relatively constant overthe range of temperatures of the spectra in the fit, namely215 to 294 K. For higher J lines, the strengths of the linesbecome small enough at lower temperatures that the fitdoes not constrain the half-widths at those temperatures,and the temperature region in which the half-widths are bestdetermined narrows to only the higher temperatures. Figure8b displays the minimum half-width uncertainty as a func-tion of temperature for each of the spectral lines in Fig. 8a.The trend toward higher temperature at higher rotationalquantum numbers is clear as is the trend toward lower un-certainties in the strongest lines at the intermediate J values.Figure 9 shows the corresponding effects in the pressureshift parameters. The minimum uncertainties are generally abit smaller and occur at temperatures 2 to 5 K warmer thanthose of the half-widths. The small irregularity for P18 ob-served in Fig. 9b is due to a problem with a hot band line
Fig. 8. (a) The uncertainty of air-broadened widths as a function of temperature for 30013/00001 with (b) the corresponding minimumuncertainty where the plot symbol is equal to the lower state J. Traces for P10 through P32 overlap extensively and are not labeled indivi-dually.
532 Can. J. Phys. Vol. 87, 2009
Published by NRC Research Press

blended with P18 that was not modeled as well as possible.Most of the irregularities in Fig. 8a, on the other hand, aredue to a small round-off problem in the fitting software un-certainty analysis for Lorentz widths.
The uncertainties derived from the fits for both the Lor-entz width and pressure shift parameters are smaller thanthe real uncertainties. Because of the large quantity of datawithin the solution, the uncertainty due to the noise levelsof the spectra is very small. At this level there are variousother problems with the fits that dominate the actual uncer-tainties. These include uncertainties in the measurement ofthe physical conditions of the gas, uncertainties in the spec-tral line shapes, and some modeling of the spectral line pa-rameters used. In particular, there was no effort to modeleither line mixing or speed dependence as a function of tem-perature. Each has only a small effect upon the solution inthe first place. While the speed dependence model repre-
sents all temperatures, the model is unlikely to hold rigor-ously for all collisional speeds. In the comparisons betweenthe two bands, the half-widths and pressure shifts differ by afew times the formal uncertainties. For the half-widths thedifferences between the two bands seem to be random as afunction of rotational quantum number, so it is likely thatthese differences are due not to vibrational effects in carbondioxide but rather to some systematic problem in the fits.The general shape of the uncertainty with temperature is in-dependent of these systematic effects, and the relative uncer-tainty from temperature to temperature is close to thatshown in Figs. 8 and 9.
Combination of widths and shifts at 296 K with tempera-ture dependence parameters determined from an unrelatedstudy do not profit from the correlations displayed here. Thesmallest uncertainty becomes that at 296 K, and the uncer-tainty in n causes them to rise as the temperature moves far-
Fig. 9. (a) The uncertainty of air-broadened pressure-induced shifts as a function of temperature for 30013/00001 with (b) the corre-sponding minimum uncertainty where the plot symbol is equal to the lower state J. Traces for P10 through P26 overlap extensively and arenot labeled individually.
Predoi-Cross et al. 533
Published by NRC Research Press

ther from that temperature. To get high quality Lorentz half-widths and pressure shifts requires that they be determined inthe same study as their temperature dependences.
7. ConclusionsWe confirmed earlier measurements of air-broadened
Lorentz half-widths and air-induced pressure shifts [21–24]and determined extensive temperature dependence values upto J@ = 45 simultaneously for two near-IR bands of 12CO2(30012/00001 at 6348 cm–1 and 30013/00001 at6228 cm–1). The broadening parameters were retrieved usingconstrained multispectrum nonlinear least-squares curve fit-ting, employing speed-dependent Voigt profiles and relaxa-tion matrix line mixing. This procedure was applied to high-resolution spectra (37 air-broadened CO2 and two of pureCO2), recorded at temperatures between 215 and 294 K us-ing two different Fourier transform spectrometers. We per-formed semiclassical theoretical calculations using theRobert–Bonamy formalism [30] and found small differences(<4%) between the measured and calculated air-broadenedhalf-width coefficients and the corresponding temperaturedependence coefficients. We observed no obvious vibrationaldependence for the temperature dependence of air-broadenedwidths of CO2. The measured temperature dependences ofthe air-induced pressure shifts revealed no dependence onthe rotational quantum numbers; therefore an average valueof –6.0 � 10–5 cm–1 atm–1 K–1 was recommended for atmos-pheric calculations.
AcknowledgementsA. Predoi-Cross and A.R.W. Mckellar are grateful for fi-
nancial support from the National Sciences and EngineeringResearch Council of Canada (NSERC). The research at theJet Propulsion Laboratory (JPL), California Institute ofTechnology, was performed under contract with NationalAeronautics and Space Administration. The support receivedfrom the National Science Foundation under Grant No.ATM-0338475 to the College of William and Mary isgreatly appreciated. R.R. Gamache is pleased to acknowl-edge support of this research by the National Science Foun-dation through Grant No. ATM-0803135. The authors thankMike Dulick of the National Solar Observatory for his assis-tance in obtaining the data recorded at Kitt Peak.
References1. H.H. Aumann, D. Gregorich, and S. Gaiser. Geophys. Res.
Lett. 32, L05806 (2005). doi:10.1029/2004GL021784.2. D. Diebel, M. Langevin, D. Klaes, P. Courtier, T. Phuloin, F.
Cayla, and G. Chalon. Proceedings of the EUMETSAT UserConference, Septembre 1997. EUMETSAT.
3. D. Crisp, R.M. Atlas, F.M. Breon, L.R. Brown, J.P. Burrows,P. Ciais, B.J. Connor, S.D. Doney, I.Y. Fung, D.J. Jacob,C.E. Miller, D. O’Brien, S. Pawson, J.T. Randerson, P. Ray-ner, R.J. Salawitch, S.P. Sander, B. Sen, G.L. Stephens, P.P.Tans, G.C. Toon, P.O. Wennberg, S.C. Wofsy, Y.L. Yung,Z. Kuang, B. Chudasama, G. Sprague, B. Weiss, R. Pollock,D. Kenyon, and S. Schroll. Adv. Space Res. 34, 700 (2004).doi:10.1016/j.asr.2003.08.062.
4. T. Hamazaki, Y. Kaneko, A. Kuze, and K. Kondo. Proc.SPIE, 5659, 73 (2005).
5. L.S. Rothman, R.L. Hawkins, R.B. Wattson, and R.R. Gama-che. J. Quant. Spectrosc. Radiat. Transfer, 48, 537 (1992).doi:10.1016/0022-4073(92)90119-O.
6. R.A. Toth, C.E. Miller, V.M. Devi, D.C. Benner, and L.R.Brown. J. Mol. Spectrosc. 246, 133 (2007). doi:10.1016/j.jms.2007.09.005.
7. K.I. Arshinov and N.S. Leshenyuk. Quantum Electron. 27,503 (1997). doi:10.1070/QE1997v027n06ABEH000986.
8. A.F. Aushev, N.F. Borisova, E.S. Bykova, V.M. Osipov, andV.V. Tsukanov. Opt. Spectrosc. 68, 700 (1990).
9. R.A. Brownsword, J.S. Salh, and I.W.M. Smith. J. Chem.Soc., Faraday Trans. 91, 191 (1995). doi:10.1039/ft9959100191.
10. L. Rosenmann, M.Y. Perrin, and J. Taine. J. Chem. Phys. 88,2995 (1988). doi:10.1063/1.453940.
11. L. Rosenmann, M.Y. Perrin, J.M. Hartmann, and J. Taine. J.Quant. Spectrosc. Radiat. Transfer, 40, 569 (1988). doi:10.1016/0022-4073(88)90137-9.
12. M. Margottin-Maclou, P. Dahoo, A. Henry, A. Valentin, andL. Henry. J. Mol. Spectrosc. 131, 21 (1988). doi:10.1016/0022-2852(88)90102-6.
13. W.G. Planet, G.L. Tettemer, and J.S. Knoll. J. Quant. Spec-trosc. Radiat. Transfer, 20, 547 (1978). doi:10.1016/0022-4073(78)90025-0.
14. R.S. Eng and A.W. Mantz. J. Mol. Spectrosc. 74, 331(1979). doi:10.1016/0022-2852(79)90158-9.
15. G.L. Tettemer and W.G. Planet. J. Quant. Spectrosc. Radiat.Transfer, 24, 343 (1980). doi:10.1016/0022-4073(80)90098-9.
16. V.M. Devi, B. Fridovich, G.D. Jones, and D.G.S. Snyder. J.Mol. Spectrosc. 105, 61 (1984). doi:10.1016/0022-2852(84)90103-6.
17. C. Cousin, R.L. Doucen, J.P. Houdeau, C. Boulet, and A.Henry. Appl. Opt. 25, 2434 (1986). doi:10.1364/AO.25.002434.
18. P. Varanasi. J. Quant. Spectrosc. Radiat. Transfer, 39, 13(1988). doi:10.1016/0022-4073(88)90015-5.
19. F.P.J. Valero and C.B. Suarez. J. Quant. Spectrosc. Radiat.Transfer, 19, 579 (1978). doi:10.1016/0022-4073(78)90092-4.
20. C.B. Suarez and F.P.J. Valero. J. Mol. Spectrosc. 71, 46(1978). doi:10.1016/0022-2852(78)90074-7.
21. V.M. Devi, D.C. Benner, L.R. Brown, C.E. Miller, and R.A.Toth. J. Mol. Spectrosc. 242, 90 (2007). doi:10.1016/j.jms.2007.02.018.
22. V.M. Devi, D.C. Benner, L.R. Brown, C.E. Miller, and R.A.Toth. J. Mol. Spectrosc. 245, 52 (2007). doi:10.1016/j.jms.2007.05.015.
23. A. Predoi-Cross, A.V. Unni, W. Liu, I. Schofield, C. Holla-day, A.R.W. McKellar, and D. Hurtmans. J. Mol. Spectrosc.245, 34 (2007). doi:10.1016/j.jms.2007.07.004.
24. A. Predoi-Cross, W. Liu, C. Holladay, A.V. Unni, I. Scho-field, A.R.W. McKellar, and D. Hurtmans. J. Mol. Spectrosc.246, 98 (2007). doi:10.1016/j.jms.2007.08.008.
25. G. Wagner, M. Birk, R.R. Gamache, and J.-M. Hartmann. J.Quant. Spectrosc. Radiat. Transfer, 92, 211 (2005). doi:10.1016/j.jqsrt.2004.07.023.
26. R.A. Toth, L.R. Brown, M.A.H. Smith, V.M. Devi, D.C.Benner, and M. Dulick. J. Quant. Spectrosc. Radiat. Trans-fer, 101, 339 (2006). doi:10.1016/j.jqsrt.2005.11.022.
27. A. Levy, N. Lacome, and C. Chackerian, Jr. In Collisionalline mixing. Edited by K.N. Rao and A.Weber. Spectroscopyof the Earth’s Atmosphere and Interstellar medium. Aca-demic Press, Boston, USA. 1992. Chap. 2. pp. 261.
534 Can. J. Phys. Vol. 87, 2009
Published by NRC Research Press

28. R.A. Toth, L.R. Brown, C.E. Miller, V.M. Devi, and D.C.Benner. J. Mol. Spectrosc. 239, 221 (2006). doi:10.1016/j.jms.2006.08.001.
29. D.C. Benner, C.P. Rinsland, V.M. Devi, M.A.H. Smith, andD. Atkins. J. Quant. Spectrosc. Radiat. Transfer, 53, 705(1995). doi:10.1016/0022-4073(95)00015-D.
30. D. Robert and J. Bonamy. J. Phys. 20, 923 (1979).31. M. Baranger. Phys. Rev. 112, 855 (1958). doi:10.1103/
PhysRev.112.855.32. A. Ben-Reuven. In Advances in Chemical Physics. Edited by
I. Prigogine and S.A. Rice. Academic Press, New York,USA. 1975. pp. 235.
33. L. Rosenmann, J.-M. Hartmann, M.Y. Perrin, and J. Taine. J.Chem. Phys. 88, 2999 (1988). doi:10.1063/1.453941.
34. R.A. Sack. J. Math. Phys. 5, 260 (1964). doi:10.1063/1.1704116.
35. G. Birnbaum. Adv. Chem. Phys. 12, 487 (1967). doi:10.1002/9780470143582.ch9.
36. B.K. Antony, S. Neshyba, and R.R. Gamache. J. Quant.Spectrosc. Radiat. Transfer, 105, 148 (2007). doi:10.1016/j.jqsrt.2006.10.005.
37. J.-M. Hartmann, J. Taine, J. Bonamy, B. Labani, and D. Ro-bert. J. Chem. Phys. 86, 144 (1987). doi:10.1063/1.452605.
38. L.S. Rothman, D. Jacquemart, A. Barbe, D.C. Benner, M.Birk, L.R. Brown, M.R. Carleer, C. Chackerian, K. Chance,L.H. Coudert, V. Dana, V.M. Devi, J.M. Flaud, R.R. Gama-che, A. Goldman, J.M. Hartmann, K.W. Jucks, A.G. Maki,J.Y. Mandin, S.T. Massie, J. Orphal, A. Perrin, C.P. Rins-land, M.A.H. Smith, J. Tennyson, R.N. Tolchenov, R.A.Toth, J. Vander Auwera, P. Varanasi, and G. Wagner. J.Quant. Spectrosc. Radiat. Transf. 96, 139 (2005). doi:10.1016/j.jqsrt.2004.10.008.
Predoi-Cross et al. 535
Published by NRC Research Press