Embed Size (px)
Citation preview
M A T H A P P L I C A T I O N S S H A P I N G T O M O R R O W ( M A S T ) N O R T H E R N E S S E X C O M M U N I T Y C O L L E G E
MARGINAL ANALYSIS AND DATA MODELING
WITH MANAGEMENT APPLICATIONS
AUTHOR: MARVIN STICK, DEPT. OF MATHEMATICAL SCIENCES, UMASS LOWELL,
February 1, 2005
INDUSTRY:
WAL*MART
TABLE OF CONTENTS
Module Information .................................................................3
Overview of Industry................................................................3
Student Outcomes.....................................................................5
Student Profile ...........................................................................6
Time Frame ................................................................................6
Facilities, Equipment & Data ..................................................6
Standards.....................................................................................6
Module Design...........................................................................7
Assessment .................................................................................8
Teacher Notes & Methodology ..............................................9
Handouts & Materials...............................................................9
Assessment Results .................................................................11
Journals .....................................................................................12
Ideas for the Future ................................................................13
Final PowerPoint Presentation..............................................14
Resources ..................................................................................14
2
MARGINAL ANALYSIS AND DATA MODELING WITH MANAGEMENT APPLICATIONS
MODULE INFORMATION
AUTHOR: MARVIN STICK, DEPT. OF MATHEMATICAL SCIENCES, UMASS LOWELL [email protected]
Industry: (name with brief description) Wal*Mart, a conglomeration of over 1,250 discount
stores in the United States and 1,297 Wal*Mart international stores
Math Topics/skills: Calculus with applications to management
Math courses/grade level: Management Calculus at the undergraduate level
Number of in-class hours required: Three or more project assignments requiring at least one
class discussion for each.
Summary: The module accounts for approximately 15% of the final grade.
OVERVIEW OF INDUSTRY
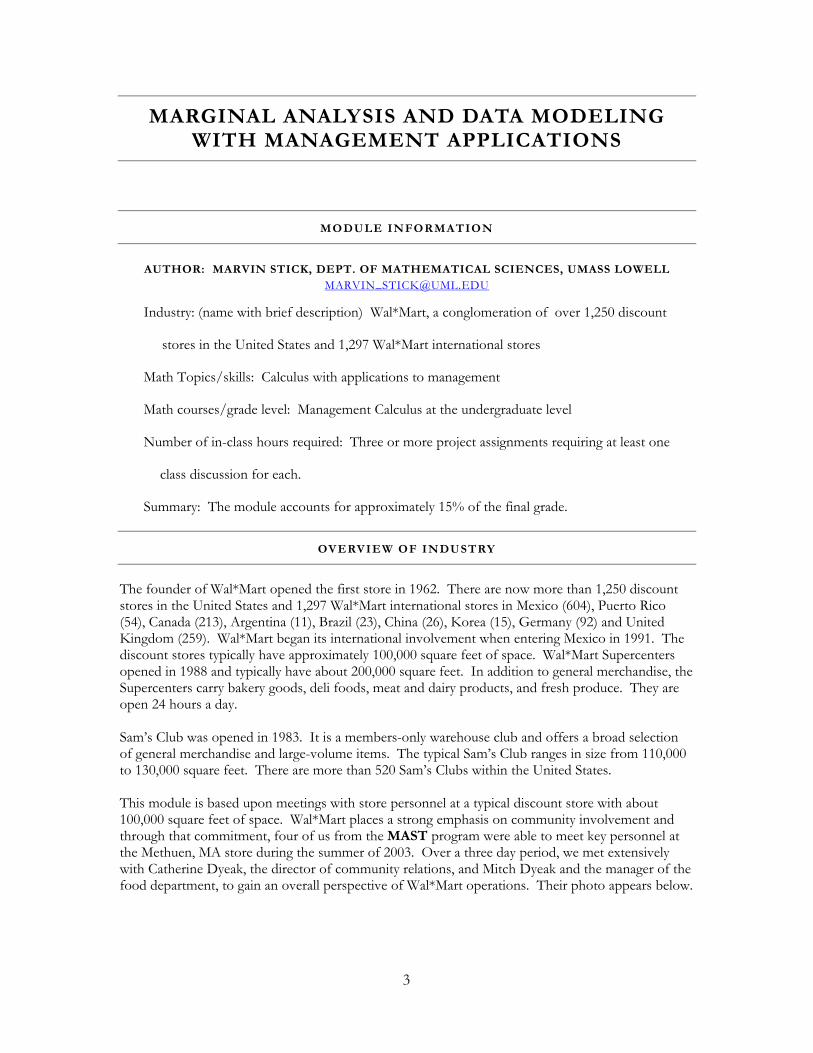
The founder of Wal*Mart opened the first store in 1962. There are now more than 1,250 discount stores in the United States and 1,297 Wal*Mart international stores in Mexico (604), Puerto Rico (54), Canada (213), Argentina (11), Brazil (23), China (26), Korea (15), Germany (92) and United Kingdom (259). Wal*Mart began its international involvement when entering Mexico in 1991. The discount stores typically have approximately 100,000 square feet of space. Wal*Mart Supercenters opened in 1988 and typically have about 200,000 square feet. In addition to general merchandise, the Supercenters carry bakery goods, deli foods, meat and dairy products, and fresh produce. They are open 24 hours a day. Sam’s Club was opened in 1983. It is a members-only warehouse club and offers a broad selection of general merchandise and large-volume items. The typical Sam’s Club ranges in size from 110,000 to 130,000 square feet. There are more than 520 Sam’s Clubs within the United States. This module is based upon meetings with store personnel at a typical discount store with about 100,000 square feet of space. Wal*Mart places a strong emphasis on community involvement and through that commitment, four of us from the MAST program were able to meet key personnel at the Methuen, MA store during the summer of 2003. Over a three day period, we met extensively with Catherine Dyeak, the director of community relations, and Mitch Dyeak and the manager of the food department, to gain an overall perspective of Wal*Mart operations. Their photo appears below.
3
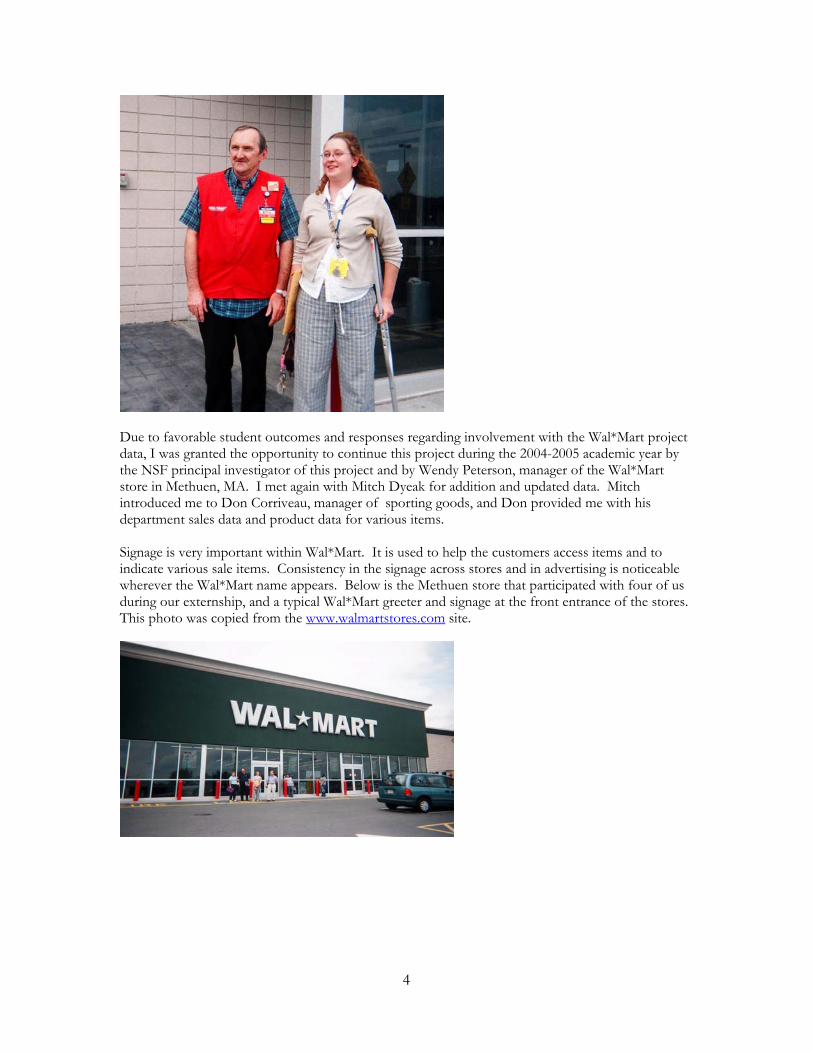
Due to favorable student outcomes and responses regarding involvement with the Wal*Mart project data, I was granted the opportunity to continue this project during the 2004-2005 academic year by the NSF principal investigator of this project and by Wendy Peterson, manager of the Wal*Mart store in Methuen, MA. I met again with Mitch Dyeak for addition and updated data. Mitch introduced me to Don Corriveau, manager of sporting goods, and Don provided me with his department sales data and product data for various items. Signage is very important within Wal*Mart. It is used to help the customers access items and to indicate various sale items. Consistency in the signage across stores and in advertising is noticeable wherever the Wal*Mart name appears. Below is the Methuen store that participated with four of us during our externship, and a typical Wal*Mart greeter and signage at the front entrance of the stores. This photo was copied from the www.walmartstores.com site.
4
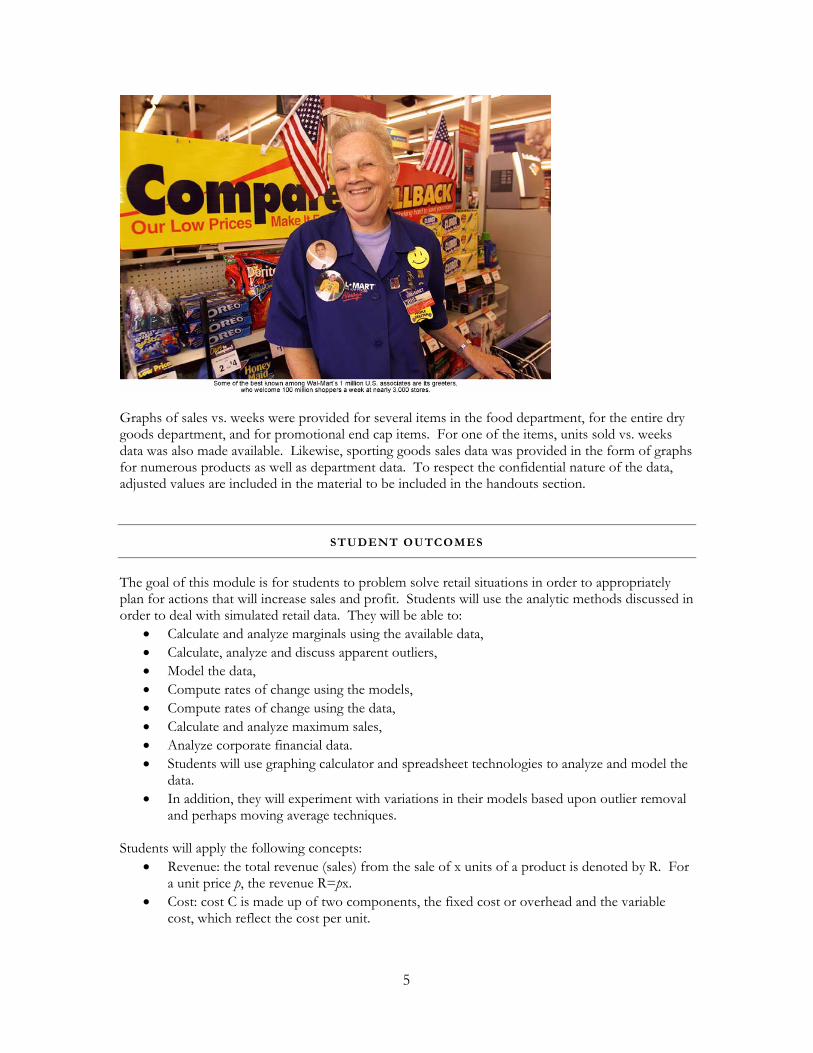
Graphs of sales vs. weeks were provided for several items in the food department, for the entire dry goods department, and for promotional end cap items. For one of the items, units sold vs. weeks data was also made available. Likewise, sporting goods sales data was provided in the form of graphs for numerous products as well as department data. To respect the confidential nature of the data, adjusted values are included in the material to be included in the handouts section.
STUDENT OUTCOMES
The goal of this module is for students to problem solve retail situations in order to appropriately plan for actions that will increase sales and profit. Students will use the analytic methods discussed in order to deal with simulated retail data. They will be able to:
• Calculate and analyze marginals using the available data, • Calculate, analyze and discuss apparent outliers, • Model the data, • Compute rates of change using the models, • Compute rates of change using the data, • Calculate and analyze maximum sales, • Analyze corporate financial data. • Students will use graphing calculator and spreadsheet technologies to analyze and model the
data. • In addition, they will experiment with variations in their models based upon outlier removal
and perhaps moving average techniques. Students will apply the following concepts:
• Revenue: the total revenue (sales) from the sale of x units of a product is denoted by R. For a unit price p, the revenue R=px.
• Cost: cost C is made up of two components, the fixed cost or overhead and the variable cost, which reflect the cost per unit.
5
• Profit: total profit P is the total revenue minus the total cost, i.e. P=R-C. • Marginal revenue: the derivative of the revenue function, i.e.
dxdR . This quantity gives the
rate of change of revenue. For small x∆ , the marginal revenue gives a good approximation of the actual change in revenue. Without modeling, we can approximate the marginal revenue with available data. The smaller the x∆ , the better the approximation.
• Marginal profit: the derivative of the profit function. Above remarks about the marginal revenue similarly apply to the marginal profit.
Re: Larson, Ron and Bruce H. Edwards. Brief Calculus, An Applied Approach, 6th edition. Boston: Houghton Mifflin, 2003.
STUDENT PROFILE
Students participating in this module will be taking a management calculus course at the undergraduate level. Typically, such students are in The College of Management and are either freshman of sophomores. All students in the selected sections will participate in the project assignments. The control group will be sections that have previously taken the same course.
TIME FRAME
This module is designed to be ongoing during the semester. When assigning three projects, at least the equivalent of three or more classes will be needed to cover the assigned material and prerequisites. Several revisits of topics discussed have been found to be helpful.
FACILITIES , EQUIPMENT & DATA
Classroom presentations by the instructor will require access to a PC and accompanying projector, Microsoft Office software, a view screen or white board, and/or a graphing calculator with an LCD and overhead. Corporate financial data for Wal*Mart at www.walmartstores.com is made available and separate studies are presented for 1993-2003 data and for 1994-2004 data. Also adjusted sales data from a local Wal*Mart store for dry goods weekly data is provided. This consists of a candy item, a promotional sales item, a boxed food item, a coffee item that is also used as a promotional end cap, and weekly department sales for successive two-year periods from 2002-2004. From the same store, adjusted weekly sporting goods department sales data is provided for a 2003-2004 time frame. Within the sporting goods department, weekly sales results are provided for exercise equipment and for indoor games
STANDARDS
Mathematics Management student requirements have been defined by the University of Massachusetts Lowell, College of Management and the Department of Mathematical Sciences. All students in this program are required to master the contents of Management Precalculus 92.121 and Management Calculus 92.122. The focus of this module deals with Management Calculus. A
6
reference site for the course topics is given in the Handouts & Materials section. In addition, the following process and content standards are addressed in the module:
• Emphasize modeling the real world and develop problem-solving skills, • Make use of graphing calculators or spreadsheets to model data sets, • Promote experimentation and conjecturing, • Develop and evaluate inferences and predictions that are based on data, • Formulate questions that can be addressed with data, • Use the language of mathematics to express mathematical ideas precisely, • Defend a choice of a least squares model, • Assess how outliers (points that are significantly distant from the other data points) affect
the selection and evaluation of a model.
Links for the standards and underlying principles can be found at the NCTM and AMATYC sites: http://standards.nctm.org/document/chapter7 and http://www.imacc.org/standards/introduction.html The goal is that students will acquire mathematics through a carefully balanced educational program that emphasizes the content and instructional strategies recommended in the standards along with the viable components of traditional instruction. It is important to stress the importance of mastering the traditional analytic components.
MODULE DESIGN
The students will apply the concepts of marginal revenue and marginal profit to available and perhaps researched data in order to investigate opportunities for increased sales and profit. In addition to the marginals, some of the analyses may include points of diminishing return on sales, maximization of revenue and profit, minimization of cost, and revenue as a function of units sold. All analytic material will be presented in the traditional manner as previously done. This method has consisted of:
• Classroom presentation of the analytic material by the instructor, • Integration of technology using graphing calculator capabilities and Excel to supplement
class discussions. Prior to development of this module, quizzes based on homework assignments were given periodically, usually on a weekly basis. A major exam is given every 3-4 weeks. Some of the quizzes were assigned as take-home projects that involved more probing analytic problems that required the use of technology to solve. With these take-home projects, the data was well defined for the students. This module will focus on a more open-ended discussion opportunity for students. They will be required to address previously mentioned student outcomes in order to analyze business performance data. In class, there will be PC presentations by the instructor dealing with the use of Excel to analyze and graph data. Material discussed will be available on-line. Graphing calculator use
7

will be ongoing throughout the semester. Students are expected to use these tools in the development of their individual projects.
ASSESSMENT
There are various options for assessment that could be considered. When initially teaching two sections of the Management Calculus course using this module, I counted the pretest as a maximum of two points added to the grade on the first examination. The posttest counted as a maximum of three points added to the final examination. Projects 1 – 4 used 2002 – 2003 data. Project 5 used 1993 – 2003 data.
• Project 1 – Candy Sales • Project 2 – End Cap Sales • Project 3 – Dry Goods Department Sales • Project 4 – Boxed Foods Sales • Project 5 – Corporate Financial Data
Projects 1 and 2 counted as a 15-point take home quiz. Projects 3 and 4 counted as a 20-point take home quiz. The quiz component is perhaps the most important single aspect of the course since it is ongoing throughout the term. Student success in this component usually translates into success in the examinations. Project 5 was worth 35 points (35% of exam 3) and it was a take home portion of the third examination. In my courses, the quizzes totaled 100 points, each of three examinations totaled 100 points, and the common final examination totaled 100 points. Each component was equally weighted so the module accounted for a total of 75 points or 15% (75 out of 500 points) of the final grade. Faculty interested in a capstone project might also consider this as an option. The capstone project might combine projects 1, 3, 5. However, through experience having used this module, we have found that the quality of student performance on their projects dramatically increases with repetition. Comparisons made between overall averages in my Management Calculus classes over the last few years indicate that average and perhaps slightly lower than average students faired best with the opportunity to problem solve with the management data in the MAST module. It was definitely a reinforcement of the fact that people do learn differently. During the spring 2004 term, I along with two field testers each taught two sections of the Management Calculus course. Each instructor worked with the assessment techniques described above, i.e. the five projects, and the pretest and posttest which address familiarity gained with marginal cost, marginal revenue, and data modeling with management applications. An additional form of assessment could be qualitative surveys administered to the test groups to assess their reactions to the alternative methods used and its impact on their appreciation and understanding of the material. These surveys should include the following open-ended items:
• Comment on the use of Excel and the TI as tools to analyze the project data. • Comment on the use of the Wal*Mart data as an aid to understand calculus concepts.
Specifically address marginal analysis and least squares modeling. • Make recommendations on any changes you deem appropriate for future implementation of
this module within the Management Calculus course. At UMass Lowell, all six sections were exposed to this module in the Spring of 2004, all but one of five sections were exposed to this module in the Fall of 2004, and all six sections will be exposed to the revised module in the Spring of 2005. The degree of implementation and grading depended upon the instructor.
8
With this revised module, additional data sets have been included and a more challenging problems introduced. The added data sets used for projects 6 – 10 consist of: Methuen, MA Wal*Mart data from Dry Goods and the Sporting Goods departments during 2003 – 2004. Project 11 used corporate data for 1994 – 2004 and addressed profit changes as a result of the sale of McLane Company, Inc.
• Project 6 – Coffee Sales and combination with use as an end cap • Project 7 – Dry Goods Sales • Project 8 – Exercise Equipment Sales • Project 9 – Indoor Game (Sporting Goods) Sales • Project 10 – Sporting Goods Department Sales • Project 11 – Corporate Financial Data (after sale of McLane Companvy, Inc.)
The premise is that the module will account for 15% of the grade, but more options are now available with the added data sets. Some students have requested more project assignments, so under consideration will be four projects worth up to 20% of the grade. Details on which of projects 6 – 11 to include will be a work in progress.
TEACHER NOTES & METHODOLOGY
The pre-test should be given early in the term prior to the first examination. The post-test should be administered near the end of the term but with enough lead-time to provide feedback on results. In both cases, the tests were given as a take-home. It is important to get individual student feedback on the value they place on the introduction of the Wal*Mart data to the overall learning of the management calculus material. I had individual conversations with students having varying analytic skills. The projects formed the basis for assessment of student mastery of the Wal*Mart material. It also turned out to be a motivation tool for many in the class.
HANDOUTS & MATERIALS
The open-ended discussion opportunity will be based on the following assignments. They reflect adjusted data and graphs from Wal*Mart for weekly sales in the dry goods and sporting goods departments. Other handouts include corporate financials from www.walmartstores.com , a student survey for assessment of the module’s impact, and teaching notes. Items 1–5 reflect 2002-2003 weekly data from Dry Goods and 1993-2003 corporate financial data. Items 6-11 include 2003-2004 weekly data from Dry Goods and the Sporting Goods departments and updated corporate data for 1994-2004 to reflect the sale of the McLane Company, Inc. 2002-2003 data
1. Weekly sales of a candy item, Spreadsheet and chart, analysis questions http://faculty.uml.edu/mstick/92.122/material/Walmart candy item.htm http://faculty.uml.edu/mstick/92.122/material/candy_item.pdf
2. Weekly sales of a promotional item, Promotional item spreadsheet and chart, analysis questions http://faculty.uml.edu/mstick/92.122/material/end cap item.htm http://faculty.uml.edu/mstick/92.122/material/end_cap_cookies.pdf
9
3. Weekly sales within the dry goods department, Dry goods spreadsheet and chart, analysis questions http://faculty.uml.edu/mstick/92.122/material/Walmart dry goods weekly sales.htm http://faculty.uml.edu/mstick/92.122/material/Walmart_dry_goods.pdf
4. Weekly sales of a boxed food item. Spreadsheet and chart. analysis questions http://faculty.uml.edu/mstick/92.122/material/Walmart boxed foods weekly sales.htm http://faculty.uml.edu/mstick/92.122/material/Walmart_boxed_foods.pdf
5. A spreadsheet containing actual Wal*Mart corporate cost and sales financial data for 1993-2003 is included for examination and analysis by students, Financial summary spreadsheet, analysis questions http://faculty.uml.edu/mstick/92.122/material/financial summary data.htm http://faculty.uml.edu/mstick/92.122/material/financial_summary.pdf
2003-2004 data 6. Weekly sales of a coffee item and combination with use as an end cap, Spreadsheet and chart, analysis questions
http://faculty.uml.edu/mstick/92.122/material/end cap coffee item 2003-2004.htm http://faculty.uml.edu/mstick/92.122/material/coffee_item.pdf
7. Dry Goods sales, Spreadsheet and chart, analysis questions
http://faculty.uml.edu/mstick/92.122/material/dry goods sales 2003-2004.htm http://faculty.uml.edu/mstick/92.122/material/dry_goods.pdf 8. Weekly sales of exercise equipment, Spreadsheet and chart, analysis questions
http://faculty.uml.edu/mstick/92.122/material/exercise equipment 2003-2004.htm http://faculty.uml.edu/mstick/92.122/material/exercise_equipment.pdf 9. Weekly sales of indoor games (Sporting Goods), Spreadsheet and chart, analysis questions
http://faculty.uml.edu/mstick/92.122/material/indoor games 2003-2004.htm http://faculty.uml.edu/mstick/92.122/material/indoor_games.pdf 10. Sporting Goods department sales, Spreadsheet and chart, analysis questions
http://faculty.uml.edu/mstick/92.122/material/sporting goods sales 2003-2004.htm http://faculty.uml.edu/mstick/92.122/material/sporting_goods.pdf 11. Actual Wal*Mart corporate cost and sales financial data for 1994-2004 after the sale of
McLane Company, Inc. Financial summary spreadsheet, analysis questions http://faculty.uml.edu/mstick/92.122/material/new financial summary data 1994-2004.htm
http://faculty.uml.edu/mstick/92.122/material/new_financial_summary.pdf
12. Student survey, A pretest and posttest survey to compare student achievement
http://faculty.uml.edu/mstick/92.122/material/pretest_posttest_survey.pdf 13. Teaching notes, Excel modeling techniques, issues to be considered in the analysis questions for items 1 through 11, a conversation about the use of calculus at Wal*Mart
http://faculty.uml.edu/mstick/92.122/material/teaching_notes.pdf http://faculty.uml.edu/mstick/92.122/material/teaching notes models.htm
10
Also included are links to sample spreadsheet worksheets and graphs with detailed process instructions to develop an Excel generated graphical analysis. This material has been previously used for some of the specific topics addressed in the Management Calculus course. The links are: http://faculty.uml.edu/mstick/92.122/material/marginal_profit.htm http://faculty.uml.edu/mstick/92.122/material/marginal_profit_document.pdf http://faculty.uml.edu/mstick/92.122/material/least_squares_regression.htm http://faculty.uml.edu/mstick/92.122/material/least_squares_regression_document.pdf The above described worksheet and graphs dealing with the least squares regression has been adapted from material in Larson’s text, Brief Calculus, An Applied Approach, 6th edition. Listings for TI-83, TI-86 and TI-89 regression procedures are available at http://faculty.uml.edu/mstick/links/ti_systems_of_eqs_and_least_squares_pdf.pdf To enable teachers to more easily replicate the intended outcomes of this module, a listing of the Management Calculus topics appears at http://faculty.uml.edu/mstick/92.122/material/Mgt_Calculus_and_module_topics.pdf A listing of algebra prerequisites appears at http://faculty.uml.edu/mstick/92.122/material/requirements.pdf The Management Calculus syllabus can be found at http://faculty.uml.edu/mstick/92.122/syllabus.pdf. This module has been and will be used as an ongoing type of project during the semester. However, a capstone project is also a possibility assuming adequate familiarity with the technology components that are required for data analysis. Pre-assessment will be in the form of the previously mentioned (Module Design) ongoing evaluations which include the traditional exams and quizzes. The student survey pretest and posttest address topics more closely aligned with this module.
ASSESSMENT RESULTS
At UMass Lowell, most sections have been exposed to this module since the spring 2004 term, but the degree of implementation and grading depended upon the instructor. Some comments from initial field testers were:
• Many of the less mathematically inclined students presented wonderfully detailed assignments and analyses.
• This (MAST module) assignment (its implementation and evaluating deliverables) was a lot of work, but a lot of fun for me. I look forward to doing it again!
• There should be consistency among the sections using this module during a term. It is invaluable for students to know exactly what the deliverable needed to consist of (i.e. typed, Excel charts, models). Deliverables should be individual and specific due dates adhered to.
• Several students commented that because I had made copies each time of the “best” reports and allowed other students to view them, it helped tremendously (for future project assignments).
• Several students felt the module assignments would help them in both other courses and in their careers.
The initial implementation of this MAST module at UMass Lowell was a learning process for the instructors. It was a considerable amount of work but definitely worth the effort and will be
11
repeated. It is expected that those of you at other schools may develop some of your own criteria to test the concepts developed in this module. Please share them. The module was next used during the fall 2004 term. Data sets for 2003-2004 had not been included. The general feeling among instructors (4 out of 5 sections) using the module was that all went more smoothly and both instructors and students were better prepared for what was expected. All sections will be using the revised module this spring 2005 term. As previously mentioned, comparisons made between overall averages in my Management Calculus classes over the last few years indicate that average and perhaps slightly lower than average students faired best with the opportunity to problem solve with the management data in the MAST module. It was definitely a reinforcement of the fact that people do learn differently. The field testers and their results in other sections using the module confirmed this assessment.
Some student quotes from personal interviews with my students at the end of the fall 2004 term follow. The following were selected to represent differing viewpoints.
• Wal*Mart added to the course and was good. A lot of the kids wanted to know when and how the Math discussed would be used and the Wak*Mart data showed us how the Math is used.
• Two projects were enough. It became repetitive.
• Add another project. It (the module) brought things together and the relevance of the Math.
• I had never seen Calculus (before) and the Wal*Mart data and projects helped me see the relevance to real world data. I would have liked more projects.
JOURNALS
My reflections on the process of making a module: • What have I learned when interacting with Wal*Mart?
Due to unforeseen illness and lack of availability of some management at Wal*Mart, I learned that one has to be extremely flexible, but yet somewhat persistent to gain the information needed to complete a module. In my case, very limited sales data was originally made available for the first year’s acquisition, 2002-2003. In order to perform adequate item analyses, more data was required from a variety of items within the dry goods department. Eventually, after carefully explaining the intended educational use for the data and agreeing to modify actual item sales so that only trends would be apparent, we were able to gain the trust and confidence of management. Then, additional graphs of sales data were provided. For the second year’s data acquisition, 2003-2004, the problem was to gain the trust of the newly appointed store manger. Sharing past success stories and intended use with the module both verbally and with hard copy and web site information worked well to gain the trust of management. During meetings with the department mangers of the dry goods and sporting goods departments, more than required data was provided for the additional and more involved studies.
12
• What in the process works and what does not work? During the preparation of my June 2004 module that only included the 2002-2003 data, the PowerPoint design tips were very helpful, but I think that it may have helped to require all participants to create draft presentations based on earlier versions of their draft modules. Then as time evolved, we would feel more comfortable with PowerPoint intricacies.
The templates and provided teacher notes served as a great guide for my efforts. The template for the development of the 2004-2005 module was especially helpful, although initially a bit difficult to work with. Independent work sessions and available help from faculty, staff and fellow participants worked well for me during the development phase. I appreciate the ‘expert’ feedback as well in refining initial drafts of my first MAST module.
• How did my ideas change, evolve? Based upon available data, I had to change analyses that were planned. Initially, the plan was to deal with specific item cost and sales data from the Methuen discount store. Since only sales data was available, another approach was required to perform profit analyses that are based on both sales and cost data. With the help of Cathie Pirri, we changed the focus and used corporate financial data at the Wal*Mart web site to discuss the profit analyses.
• How to use the module? As stated previously, 15% of the grade has been devoted to three projects assigned using data from projects 1-5. This worked well, especially the second time around. Now with the inclusion of many more data sets in projects 6-11, more flexibility is available for comparison of dry goods and sporting goods departments, comparison of departments and corporate data over successive years, and examination of additional product data. Also, some of the analyses in the projects 6-11 have been designed to be more challenging. This may reflect in adding another project to the assignments and increasing the weight given the module to a max of 20% of the grade.
• What is the impact of field testing? Getting input from other users of the module is very helpful. With data from many sections we were able to better understand the need for clarity when making project assignments, and the need to better refine the expectations for initial project assignments.
• Using the module
Setting up the module on the web for student access has worked well for us at UMass Lowell. The site for both last year’s module and the module for this year is at http://faculty.uml.edu/mstick/92.122/material.htm. While separate handouts are provided, students are expected to access and download appropriate information based on assignments.
IDEAS FOR THE FUTURE
As done this year, periodic refinements to the data sets would be an appropriate way to gain and stimulate student interest. This year, another department was added. Each year, corporate data could be updated readily by accessing the corporate site at www.walmartsores.com. Eventually, product data should be updated in order to be current.
13
FINAL POWERPOINT PRESENTATION
The PowerPoint presentations for the module covering projects 1-5 and for the updated module covering projects 1-11 are links at http://faculty.uml.edu/mstick/92.122/material.htm.
RESOURCES
2002-2003 data 1. Weekly sales of a candy item,
Spreadsheet and chart, analysis questions http://faculty.uml.edu/mstick/92.122/material/Walmart candy item.htm http://faculty.uml.edu/mstick/92.122/material/candy_item.pdf
2. Weekly sales of a promotional item, Promotional item spreadsheet and chart, analysis questions http://faculty.uml.edu/mstick/92.122/material/end cap item.htm http://faculty.uml.edu/mstick/92.122/material/end_cap_cookies.pdf
3. Weekly sales within the dry goods department, Dry goods spreadsheet and chart, analysis questions http://faculty.uml.edu/mstick/92.122/material/Walmart dry goods weekly sales.htm http://faculty.uml.edu/mstick/92.122/material/Walmart_dry_goods.pdf
4. Weekly sales of a boxed food item. Spreadsheet and chart. analysis questions http://faculty.uml.edu/mstick/92.122/material/Walmart boxed foods weekly sales.htm http://faculty.uml.edu/mstick/92.122/material/Walmart_boxed_foods.pdf
5. A spreadsheet containing actual Wal*Mart corporate cost and sales financial data for 1993-2003 is included for examination and analysis by students, Financial summary spreadsheet, analysis questions http://faculty.uml.edu/mstick/92.122/material/financial summary data.htm http://faculty.uml.edu/mstick/92.122/material/financial_summary.pdf
2003-2004 data 6. Weekly sales of a coffee item and combination with use as an end cap, Spreadsheet and chart, analysis questions
http://faculty.uml.edu/mstick/92.122/material/end cap coffee item 2003-2004.htm http://faculty.uml.edu/mstick/92.122/material/coffee_item.pdf
7. Dry Goods sales, Spreadsheet and chart, analysis questions
http://faculty.uml.edu/mstick/92.122/material/dry goods sales 2003-2004.htm http://faculty.uml.edu/mstick/92.122/material/dry_goods.pdf 8. Weekly sales of exercise equipment, Spreadsheet and chart, analysis questions
http://faculty.uml.edu/mstick/92.122/material/exercise equipment 2003-2004.htm http://faculty.uml.edu/mstick/92.122/material/exercise_equipment.pdf 9. Weekly sales of indoor games (Sporting Goods), Spreadsheet and chart, analysis questions
http://faculty.uml.edu/mstick/92.122/material/indoor games 2003-2004.htm http://faculty.uml.edu/mstick/92.122/material/indoor_games.pdf
14
15
10. Sporting Goods department sales, Spreadsheet and chart, analysis questions
http://faculty.uml.edu/mstick/92.122/material/sporting goods sales 2003-2004.htm http://faculty.uml.edu/mstick/92.122/material/sporting_goods.pdf 11. Actual Wal*Mart corporate cost and sales financial data for 1994-2004 after the sale of
McLane Company, Inc. Financial summary spreadsheet, analysis questions http://faculty.uml.edu/mstick/92.122/material/new financial summary data 1994-2004.htm
http://faculty.uml.edu/mstick/92.122/material/new_financial_summary.pdf
12. Student survey, A pretest and posttest survey to compare student achievement
http://faculty.uml.edu/mstick/92.122/material/pretest_posttest_survey.pdf 13. Teaching notes, Excel modeling techniques, issues to be considered in the analysis questions for items 1 through 11, a conversation about the use of calculus at Wal*Mart
http://faculty.uml.edu/mstick/92.122/material/teaching_notes.pdf http://faculty.uml.edu/mstick/92.122/material/teaching notes models.htm
Sample spreadsheet worksheets and graphs with detailed process instructions to develop an Excel generated graphical analysis are at: http://faculty.uml.edu/mstick/92.122/material/marginal_profit.htm http://faculty.uml.edu/mstick/92.122/material/marginal_profit_document.pdf http://faculty.uml.edu/mstick/92.122/material/least_squares_regression.htm http://faculty.uml.edu/mstick/92.122/material/least_squares_regression_document.pdf TI-83, TI-86 and TI-89 least squares regression procedures are at: http://faculty.uml.edu/mstick/links/ti_systems_of_eqs_and_least_squares_pdf.pdf
Reference material to enable teachers to more easily replicate the intended outcomes of this module follows. The Management Calculus topics appears at http://faculty.uml.edu/mstick/92.122/material/Mgt_Calculus_and_module_topics.pdf A listing of algebra prerequisites appears at http://faculty.uml.edu/mstick/92.122/material/requirements.pdf The Management Calculus syllabus can be found at http://faculty.uml.edu/mstick/92.122/syllabus.pdf. Acknowledgements: Catherine Pirri at Northern Essex Community College and the faculty and staff who worked with her to make this MAST NSF funded project possible were incredibly helpful in the preparation of this module. Hopefully without overlooking the many people involved, I want to thank Maureen Kelley, Danielle Tarnow, Richard Lizotte and Melba Acevedo from Northern Essex, Catherine Dyeak, Mitch Dyeak and Don Corriveau from the Methuen Wal*Mart discount store, and fellow college and high school participants in the project for their insights in problem solving issues as they arose. Acquisition of the 2003-2004 data would not have been possible without the generous consent of Wendy Peterson, manager of the Wal*Mart store in Methuen, MA.