Embed Size (px)
Citation preview

Completion Report
Project Number: 31287 Loan Number: 1716 December 2010
Sri Lanka: Coastal Resource Management Project

CURRENCY EQUIVALENTS
Currency Unit – Sri Lanka Rupee/s (SLRe/SLRs)
At Appraisal At Project Completion 2 July 1999 November 2009
SLRe1.00 = $0.0140 $0.008673 $1.00 = SLRs71.550 SLRs115.3
ABBREVIATIONS
ADB – Asian Development Bank BME – benefit monitoring and evaluation CBO – community-based organization CCA – Coast Conservation Act CCAC – Coast Conservation Advisory Council CCC – community coordination committee CCD – Coast Conservation Department CERM – coastal environment and resource management CFHC – Ceylon Fishery Harbors Corporation CRM – coastal resources management CZMP – Coastal Zone Management Plan DFAR – Department of Fisheries and Aquatic Resources EA – executing agency EIA – environmental impact assessment EIRR – economic internal rate of return FPIU
FRM – field project implementation unit
fisheries resource management and quality improvement GIS – geographic information system ha – hectare IA – implementing agency ICB – international competitive bidding IEC – information, education, and communication IEE – initial environmental examination IS – institutional strengthening kg – kilogram km – kilometer LCB – local competitive bidding m3 – cubic meter MFARD – Ministry of Fisheries and Aquatic Resources Development NARA – National Aquatic Resources Research and Development Agency NGO – nongovernment organization PIU – project implementation unit PMD – Planning and Monitoring Division PMO – project management office RRP – report and recommendation of the President SAM – special area management TA – technical assistance

NOTE
In this report, "$" refers to US dollars.
Vice President X. Zhao, Operations Group 1 Director General S. H. Rahman, South Asia Department (SARD) Director R. W. Vokes, Sri Lanka Resident Mission, SARD Team leader M. Thiruchelvam, Project Implementation Officer, Sri Lanka Resident
Mission, SARD Team members N. C. Amarasekera, Senior Project Assistant, Sri Lanka Resident Mission,
SARD A. Salgado, Associate Portfolio Management Analyst, Sri Lanka Resident Mission, SARD
In preparing any country program or strategy, financing any project, or by making any designation of or reference to a particular territory or geographic area in this document, the Asian Development Bank does not intend to make any judgments as to the legal or other status of any territory or area.


CONTENTS
Page
BASIC DATA i
I. PROJECT DESCRIPTION 1 II. EVALUATION OF DESIGN AND IMPLEMENTATION 2
A. Relevance of Design and Formulation 2 B. Project Outputs 2 C. Project Costs 5 D. Disbursements 5 E. Project Schedule 6 F. Implementation Arrangements 6 G. Conditions and Covenants 6 H. Related Technical Assistance 7 I. Consultant Recruitment and Procurement 7 J. Performance of Consultants, Contractors, and Suppliers 7 K. Performance of the Borrower and the Executing Agency 8 L. Performance of the Asian Development Bank 8
III. EVALUATION OF PERFORMANCE 8 A. Relevance 8 B. Effectiveness in Achieving Outcome 9 C. Efficiency in Achieving Outcome and Outputs 10 D. Preliminary Assessment of Sustainability 10 E. Envioromental, Sociocultural, and Other Impacts 10
IV. OVERALL ASSESSMENT AND RECOMMENDATIONS 11 A. Overall Assessment 11 B. Lessons 11 C. Recommendations 12
APPENDIXES 1. Overall Assessment 14 2. Project Framework 15 3. Project Outputs 22 4. Project Costs and Expenditures 32 5. Economic Analysis 35 6. Project Schedule 45 7. Project Implementation Arrangements 46 8. Status of Compliance with Loan Covenants 47


BASIC DATA A. Loan Identification 1. Country 2. Loan Number 3. Project Title 4. Borrower 5. Executing Agency 6. Amount of Loan 7. Project Completion Report Number
Sri Lanka 1716–SRI(SF) Coastal Resource Management Project Sri Lanka Ministry of Fisheries and Aquatic Resources Development SDR28,806,000 PCR: SRI 1212
B. Loan Data 1. Appraisal – Date Started – Date Completed 2. Loan Negotiations – Date Started – Date Completed 3. Date of Board Approval 4. Date of Loan Agreement 5. Date of Loan Effectiveness – In Loan Agreement – Actual – Number of Extensions 6. Closing Date – In Loan Agreement – Actual – Number of Extensions 7. Terms of Loan – Interest Rate – Maturity (number of years) – Grace Period (number of years) 8. Terms of Relending (if any) – Interest Rate – Maturity (number of years) – Grace Period (number of years) – Second-Step Borrower
14 June 1999 2 July 1999 29 September 1999 29 September 1999 7 December 1999 14 December 1999 13 March 2000 14 June 2000 1 30 December 2005 2 September 2010 4 1% per annum during grace period and 1.5% per annum thereafter 32 years 8 years None

ii
9. Disbursements a. Dates Initial Disbursement
17 August 2000
Final Disbursement
22 September 2009
Time Interval
109.2 months
Effective Date
14 June 2000
Original Closing Date
30 December 2005
Time Interval
66.5 months
b. Amount (SDR)
Category Original
Allocation
Last Revised
Allocation Partial
CancellationsaAmount
Disbursed Undisbursed
Balance 1. Civil works 19,322,000 23,514,913 23,310,599 204,314 2. Survey, design, &
mapping 1,282,000 888,762 417,283 471,479 3. Equipment, vehicles, &
furniture 281,000 94,393 13,017 81,376 4. Consulting services 2,852,000 3,523,707 3,326,739 196,968 5. Training, workshops, &
fellowships 151,000 66,225 1,225 65,000 6. Interest charge 598,000 598,000 598,000 0 7. Unallocated 4,320,000 120,000 0 120,000 Total 28,806,000 28,806,000 1,139,137.41 27,666,863 1,139,137 Total ($) 40,000,000 41,905,778 1,719,106.44 40,164,799 1,719,106
10. Local Costs (Financed) - Amount ($) 11,318,685 - Percent of Local Costs 36 - Percent of Total Cost 16a SDR1,139,137 was cancelled on 2 September 2010, and the loan account was closed on the same day. C. Project Data
1. Project Cost ($ million) Cost Appraisal Estimate Actual
Foreign Exchange Cost 44.00 40.86 Local Currency Cost 36.00 31.39 Total 80.00 72.25 2. Financing Plan ($ million) Cost Appraisal Estimate Actual Implementation Costs Borrower Financed 27.15 20.06 ADB Financed 39.17 39.29 Other External Financing Netherlands Beneficiaries
12.76
0.09
12.02
0.00

iii
Total 79.17 IDC Costs Borrower Financed ADB Financed 0.83 0.88 Other External Financing Total 80.00 72.25 ADB = Asian Development Bank, IDC = interest during construction.
3. Cost Breakdown by Project Component ($ million)
Component Appraisal Estimate Actual Coastline stabilization 35.88 35.51 Coastal environment and resource management 8.09 5.22 Fisheries resource management and quality improvement
14.74 22.43
Institutional strengthening 4.27 8.21 Interest during construction 0.83 0.88 Total 80.00 72.25 4. Project Schedule Item Appraisal Estimate Actual Date of Contract with Consultants
Coastal stabilization component Q1 2000 Q2 2001 Fisheries harbor component Q4 2000 Q1 2004 Institutional strengthening Q3 2000 Q3 2000
Completion of Engineering Designs Coastal stabilization component Q4 2000 Q1 2003 Fishery harbor component Q4 2000 Q1 2004
Civil Works Contract Coastal stabilization component
Date of award Q1 2001 Q1 2002 Completion of work Q2 2006 Q3 2006 Equipment and Supplies Dates First Procurement Q2 2000 Q2 2005 Last Procurement Q4 2004 Q1 2008
Fishery harbor component Date of Award Q1 2001 Q1 2006 Completion of Work Q2 2006 Q1 2008 Equipment and Supplies Dates First Procurement Q2 2000 Q2 2005 Last Procurement Q4 2004 Q1 2008 Completion of Equipment Installation Q = quarter. 5. Project Performance Report Ratings Implementation Period
Ratings
Development Objectives
Implementation Progress

iv
From 28 February 2000 to 29 November 2000 Satisfactory Satisfactory From 1 December 2000 to 30 December 2000 Satisfactory Highly satisfactory From 1 January 2001 to 17 June 2001 Satisfactory Highly satisfactory From 17 June 2001 to 30 March 2009 Satisfactory Satisfactory D. Data on Asian Development Bank Missions
Name of Mission
Date
No. of Persons
No. of Person-Days
Specialization of Membersa
Fact finding Appraisal Inception Review Review Review Review Midterm review, Phase 1
19 April–7 May 1999 14 June–02 July 1999 7–12 December 2000 28 May–2 June 2001 17–22 February 2002
19–25 November 2002 10–18 August 2003
26 April–10 May 2004
3 2 2 4 1 1 2 8
54 36 14 6 6 7 9
120
a,b, a,b b,c
a,b,b,c b b
b,c b,c,d,e,f,g,g,h
Midterm review, Phase 2 20 October–1 November 2004
7 84 b,c,d,g,g,h,i
Review 7–11 November 2005 1 5 b Review 21 November–3 December
2005 3 30 b,i,j
Review 6–11 November 2006 3 15 b,k,l Review 12–15 March 2007 1 3 b Review 10–13 December 2007 3 9 b,l,m a = environmental specialist, b = project specialist, c = associate operations analyst, d = project economist, e = gender specialist, f = consultant, natural resources economists, g = representatives of the Royal Netherlands Embassy, h = senior program officer, i = natural resources management specialist, j = financial management officer, k = senior infrastructure specialist, l = project analyst, m = staff consultant.

I. PROJECT DESCRIPTION
1. The Coastal Resources Management Project was developed in response to a request in 1997 from the Government of Sri Lanka.1 The project was to address the problem of severe coastal erosion, especially on the west coast of Sri Lanka, and the environmental degradation of the wetlands and lagoons that supported the regeneration of coastal resources. In June 1998, the Asian Development Bank (ADB) approved project preparatory technical assistance (TA)2 to assist the government in preparing an investment project. The government reconfirmed the high priority attached to this project during ADB’s 1999 country programming mission. A loan was approved on 7 December 1999 and became effective on 5 May 2000. The project cost was estimated at $80.00 million and consisted of a loan for $40.00 million from ADB’s Special Fund resources, TA financed by the Government of the Netherlands for $12.76 million, a government contribution of $27.15 million equivalent, and beneficiary contributions of $0.09 million. The original closing date of the loan was 30 December 2005 but, following a delay in start-up, was revised to 30 June 2008. The closing date of the TA was 31 December 2007. Performance versus the design framework is summarized in Appendix 2. 2. Sri Lanka is an island nation whose coastal zone is 24% of the land area and home to 32% of the population. The key issues regarding coastal resources are (i) serious erosion of the coastline, especially in areas with concentrated economic activity and infrastructure; (ii) unmanaged fishing in coastal and offshore areas; (iii) pollution and the uncontrolled exploitation of lagoons and estuaries, coral reefs, mangrove swamps, sea grass beds, other wetlands, and dune systems; and (iv) widespread poverty in coastal communities. Failure to address and prioritize these issues would undermine the potential contribution of the coastal belt to the overall economy of Sri Lanka. A significant percentage of these coastal communities live below the poverty line and live by fishing or exploiting other marine resources. Unless measures were taken to improve incomes and ensure coastal communities’ access to alternative livelihoods, pressure on the natural resources of coastal regions would continue. To address these issues, institutional reforms and capacity building were required to support more efficient management of coastal natural resources and provide the government with enhanced administrative capacity to implement an integrated approach to conserving and managing coastal resources. 3. The main objective of the project was to establish the integrated management of coastal resources to strengthen their sustainability. The project had four components: (i) coastline stabilization, which addressed the problem of coastal erosion and aimed to develop proactively preventive management schemes; (ii) coastal environment and resource management (CERM), which addressed problems of coastal resource degradation and included activities to reduce pollution in lagoons and relieve pressure on coastal resources; (iii) fisheries resource management and quality improvement, which aimed for sustainable coastal fisheries management supported by the construction of harbors, anchorages, and ancillary facilities to allow the improvement of fish quality and reduced handling losses; and (iv) institutional strengthening to enhance the institutional capability of the executing agency (EA), the Ministry of Fisheries and Aquatic Resources Development (MFARD), other agencies, and community organizations in coastal and fisheries resource management. 1 ADB. 1999. Report and Recommendation of the President to the Board of Directors: Proposed Loan to the
Democratic Socialist Republic of Sri Lanka for the Coastal Resources Management Project. Manila (Loan 1716-SRI[SF] and TA-3477-SRI).
2 ADB. 1998. Technical Assistance to Democratic Socialist Republic of Sri Lanka for the Coastal Resource Management. Manila (TA 3034-SRI, approved on 25 June 1998 for $850,000).

2
II. EVALUATION OF DESIGN AND IMPLEMENTATION
A. Relevance of Design and Formulation
4. The design and formulation of the project and the related TA aimed to support the requirements of the natural resources sector at the time of project appraisal. As outlined in the report and recommendation of the President, the loan was to finance larger infrastructure development while the TA would strengthen community participation in resource management and institutional development. The project scope was determined by project preparatory technical assistance3 and was consistent with the government's policy and plans for the sector. Each of these policy documents emphasized strategies for poverty reduction, coastal conservation, and environmental protection. Further, ADB's country operational strategy for Sri Lanka4 identified natural resource management as core to ADB’s strategy for Sri Lanka and proposed initiatives toward (i) national policy and institutional reform, (ii) human resource development, (iii) infrastructure expansion, and (iv) social sector reform. ADB’s operations in natural resources in Sri Lanka focused on three key areas: (i) forestry and biodiversity conservation and management, (ii) comprehensive water resource management, and (iii) coastal resource management. The project was in keeping with the ADB’s policy on fisheries,5 which promotes integrated coastal fishery management. The loan component for project was to support infrastructure development and the TA. B. Project Outputs
5. Outputs of the project, except for minor design changes to address the impact of the 2004 tsunami, are consistent with project appraisal. A detailed description of each component and its outputs and impact is in Appendix 3.
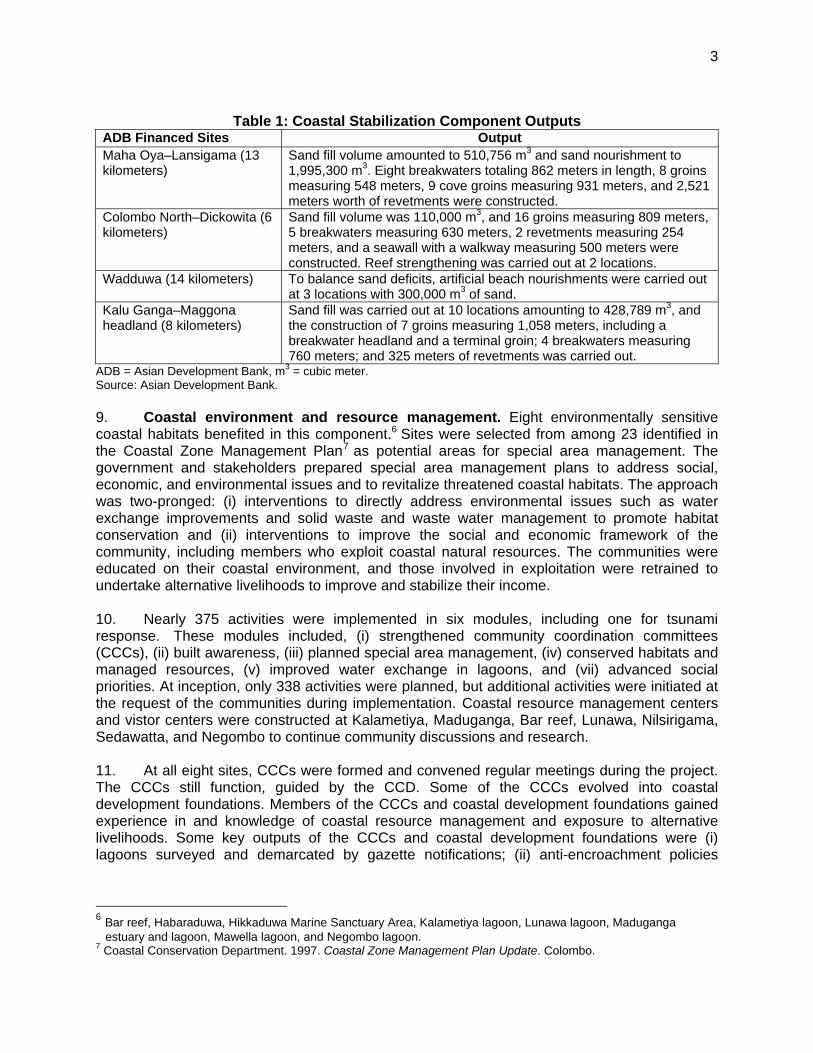
6. Coastal stabilization. The coastal stabilization component had one part financed by ADB and another financed by the government. Coastal protection works financed by ADB were completed for 37 kilometers (km) of the 38 km identified in four coastal segments. These segments are Maha Oya–Lansigama (13 km), Colombo North–Dickowita (6 km), Wadduwa (14 km), and the Kaluganga–Maggona headland (8 km). Details of the outputs are in Table 1. The Coast Conservation Department (CCD) took over the interventions at Moratuwa–Koralawella (2 km) planned by the project under their annual works. Expenditure for the component was within the original cost estimates and completed in 2006. 7. The part financed by the government involved coastal stabilization at Beruwala–Bentota and Hikkaduwa. Since the 2004 tsunami, some of the physical features of these sites changed, requiring changes to the original design. Using government funds and new designs, the CCD completed rehabilitation works in Hikkaduwa. At the Beruwala–Bentota sites, the stakeholders did not accept the new design and rehabilitation works will be carried out by CCD in the future. 8. The impact of the intervention is visible at the project sites. The beach area has expanded from 30 meters to 100 meters, stabilizing coastline regression. At design, erosion was estimated at 3 meters per year. Since project completion, no complaints of erosion have been reported from these areas, landing boats has become easier, and local and foreign tourist arrivals to these beaches have increased. 3 ADB. 1998. Technical Assistance to Democratic Socialist Republic of Sri Lanka for the Coastal Resource
Management. Manila (TA 3034-SRI, approved on 25 June 1998 for $850,000) 4 ADB. 1999. Country Operational Strategy for Sri Lanka: Promoting the Environment for Growth. Manila. 5 ADB. 1997. Policies and Strategies, Fisheries. Manila.
3
Table 1: Coastal Stabilization Component Outputs
ADB Financed Sites Output Maha Oya–Lansigama (13 kilometers)
Sand fill volume amounted to 510,756 m3 and sand nourishment to 1,995,300 m3. Eight breakwaters totaling 862 meters in length, 8 groins measuring 548 meters, 9 cove groins measuring 931 meters, and 2,521 meters worth of revetments were constructed.
Colombo North–Dickowita (6 kilometers)
Sand fill volume was 110,000 m3, and 16 groins measuring 809 meters, 5 breakwaters measuring 630 meters, 2 revetments measuring 254 meters, and a seawall with a walkway measuring 500 meters were constructed. Reef strengthening was carried out at 2 locations.
Wadduwa (14 kilometers) To balance sand deficits, artificial beach nourishments were carried out at 3 locations with 300,000 m3 of sand.
Kalu Ganga–Maggona headland (8 kilometers)
Sand fill was carried out at 10 locations amounting to 428,789 m3, and the construction of 7 groins measuring 1,058 meters, including a breakwater headland and a terminal groin; 4 breakwaters measuring 760 meters; and 325 meters of revetments was carried out.
ADB = Asian Development Bank, m3 = cubic meter. Source: Asian Development Bank. 9. Coastal environment and resource management. Eight environmentally sensitive coastal habitats benefited in this component.6 Sites were selected from among 23 identified in the Coastal Zone Management Plan7 as potential areas for special area management. The government and stakeholders prepared special area management plans to address social, economic, and environmental issues and to revitalize threatened coastal habitats. The approach was two-pronged: (i) interventions to directly address environmental issues such as water exchange improvements and solid waste and waste water management to promote habitat conservation and (ii) interventions to improve the social and economic framework of the community, including members who exploit coastal natural resources. The communities were educated on their coastal environment, and those involved in exploitation were retrained to undertake alternative livelihoods to improve and stabilize their income. 10. Nearly 375 activities were implemented in six modules, including one for tsunami response. These modules included, (i) strengthened community coordination committees (CCCs), (ii) built awareness, (iii) planned special area management, (iv) conserved habitats and managed resources, (v) improved water exchange in lagoons, and (vii) advanced social priorities. At inception, only 338 activities were planned, but additional activities were initiated at the request of the communities during implementation. Coastal resource management centers and vistor centers were constructed at Kalametiya, Maduganga, Bar reef, Lunawa, Nilsirigama, Sedawatta, and Negombo to continue community discussions and research. 11. At all eight sites, CCCs were formed and convened regular meetings during the project. The CCCs still function, guided by the CCD. Some of the CCCs evolved into coastal development foundations. Members of the CCCs and coastal development foundations gained experience in and knowledge of coastal resource management and exposure to alternative livelihoods. Some key outputs of the CCCs and coastal development foundations were (i) lagoons surveyed and demarcated by gazette notifications; (ii) anti-encroachment policies
6 Bar reef, Habaraduwa, Hikkaduwa Marine Sanctuary Area, Kalametiya lagoon, Lunawa lagoon, Maduganga
estuary and lagoon, Mawella lagoon, and Negombo lagoon. 7 Coastal Conservation Department. 1997. Coastal Zone Management Plan Update. Colombo.

4
introduced; (iii) signage installed; (iv) management guidelines including zonal plans prepared for coastal habitats; and (v) landing sites, access routes, and canals rehabilitated. 12. To facilitate solid waste management, the project purchased trucks, compactor vehicles, and four-wheel-drive tractors for eight local authorities. A total of 5,000 compost bins were distributed to households. Two waste collection shops were established in Negombo to collect non-biodegradable waste. Programs to clear invasive plants from lagoons were implemented to improve water quality. Tree planting campaigns were implemented to promote a greener environment. The project also enabled mangrove rehabilitation, sea grass bed improvement, turtle management, and research on the management of cetaceans. 13. Physical interventions to improve water exchange were carried out in Habaraduwa lagoon, Lunawa lagoon, Mawella lagoon, Maduganga estuary and lagoon, and Mawella lagoon. For Negombo lagoon, although investigations were conducted and detailed technical proposals prepared, the dredging contract was not awarded as bidding was unresponsive. As an alternative, a small amphibious dredger was purchased for the CCD, to allow it to maintain the canal system in Negombo and ensure good water exchange. 14. More than 1,000 people, including 226 males and 776 females, were trained in livelihood programs, and most participants remained engaged in their trade. This program was implemented with local nongovernment organizations. The training included entrepreneur development, manufacturing palmyrah products, dressmaking, food processing, horticulture, ecotourism, boat engine repair, fiberglass boat construction and repair, coir processing, and leather products. Participants were provided with tools and equipment to pursue these livelihoods. 15. Fishery resource management and quality improvement. Fishery harbors with shore facilities such as harbor offices and quarters, community halls, canteens, fish auction halls, fishnet-mending halls, toilets, and security huts were completed. In addition, paved access roads and parking areas were constructed to accepted standards for the fishery harbors at Ambalangoda, Hambantota, and Chilaw. The Ceylon Fishery Harbors Corporation (CHFC) was provided with a 370-horsepower dredger and a fiberglass boat to maintain the harbor and the entrance at Chilaw. In addition, renovations and improvements were carried out to the fishery harbors at Kudawella, Mirissa, Galle, Hikkaduwa, Beruwala, Kalpitiya, Puranawella, and Moratuwa–Panadura. In Ambalangoda harbor, contractor’s delays and abandonment of the site meant the administrative building could not be completed before loan closure. In Chilaw, the auction hall was not constructed because the local authority delayed handing over the site. The administrative building is completed using government funds. There was sand build-up in the Hambantota fishery harbor, partly due to changes to the coast near of the construction works of the main commercial Hambantota harbor. However, with the two dredgers provided under the project, maintenance dredging will be carried out annually. 16. Institutional strengthening. Institutional strengthening addressed (i) national policy, (ii) infrastructure improvements, (iii) training, and (iv) research. The four institutions under the MFARD, namely the Department of Fisheries, CCD, CFHC, and National Aquatic Resources Research and Development Agency, benefited through the reform of national policy brought about by the project, which included (i) a revised Coastal Zone Management Plan, (ii) a new fisheries act, (iii) amendments to the Coast Conservation Act and the fishery management plan, and (iv) improved systems for licensing fishing operations and registering boats.

5
17. Further outputs included (i) a computer network linking the MFARD with the Department of Fisheries and Aquatic Resources and the CCD; (ii) an improved geographic information system in the CCD to strengthen information gathering; (iii) the establishment of a central extension unit in the Department of Fisheries and Aquatic Resources; (iv) the preparation of a corporate plan and management information system for the Ceylon Fishery Harbors Corporation; and (v) a new statistical system to generate catch data and other information necessary for efficient resource management. Sixty-three government officers received international training on fishery resource management, while 512 received training locally. Apart from the background research studies leading to the update of the Coastal Zone Management Plan, research on river sand alternatives, water quality, and pathogens in shrimp for export was done under the project. C. Project Costs
18. At appraisal, the total project cost was estimated at $80.00 million, comprising a $40.00 million ADB loan, a $12.76 million grant from the Government of the Netherlands, $27.15 million in borrower financing, and $0.09 million in beneficiary contributions in kind. The foreign exchange cost was estimated at $44 million, or 55% of the total, and the local currency cost at $36 million equivalent, or 45% of the total. 19. Actual total expenditure at completion was $72.25 million, comprising a $40.17 million ADB loan, a $12.02 million grant from the Government of the Netherlands, $20.06 million in borrower financing, and $0.09 million in beneficiary contributions in kind. The foreign exchange cost was $40.86 million, or 57% of the total, and the local currency cost was $31.39 million equivalent, or 43% of the total. At the request of the government, $1.811 million of project loan savings were cancelled and reallocated to the North East Community Restoration and Development Project II.8 The detailed cost breakdown and actual annual and total expenditures are in Appendix 4. 20. At project completion, the estimated economic internal rate of return (EIRR) is 18.6%, higher than the 15.3% estimate at appraisal. During the midterm review9, the EIRR was re-estimated to be 15.9%. The increase in EIRR is mainly from the reduced cost of civil works for some components and improvements in design. The sensitivity analysis found a 10% reduction in expected benefits reducing the EIRR to 16.9% and a 20% reduction in benefits reducing it to 15.1%. A 10% increase in benefits improved the EIRR to 22.5%, and a 20% increase in benefits improved it to 24.3%. The detailed economic analysis is in Appendix 5. D. Disbursements
21. At midterm review in November 2004, only 37% of the loan and 39% of the grant had been disbursed. However, with close coordination with the government, the project was accelerated. 22. Large civil works and equipment were procured using international and national competitive bidding. Large civil works contracts were paid through direct payment, which proved to be more efficient and less time consuming than reimbursement method. Items estimated to cost less than $50,000 were reimbursed using the statement of expenditures procedure, 8 ADB. 2005. Report and Recommendation of the President to the Board of Directors: Proposed Loan to the
Democratic Socialist Republic of Sri Lanka for the North East Community Restoration and Development Project II. Manila (Loan 2168-SRI[SF], Grant 0007, and G0013).
9 Midterm review was carried out in two phases to enable to the government to meet key actions agreed in phase 1.

6
especially under the grant. The project management office retained statements and supporting documents for examination by ADB review missions. 23. Project accounts were maintained according to the government system and subjected to audit by the Auditor General’s Department. ADB and the government financial records were maintained as in Schedule 3 of the loan agreement. The project complied with ADB’s disbursement procedures. E. Project Schedule
24. The contracts for works in the coastal stabilization component financed by ADB, which constituted a major portion of the intervention, were signed in March 2003, some 9 months after the July 2002 target. Considering the magnitude of the works that were to be carried out, including the necessary background research, stakeholder interactions, and approval procedures, the delay of 8 months is not significant. The scheduled date of completion was 16 May 2005, and the actual date was 5 June 2005. 25. However, contracts under other components were significantly delayed, mainly by the 2004 tsunami. In addition, internal problems in the MFARD meant that a full-time project director was appointed only on 30 November 2004. The project was delegated to the Sri Lanka Resident Mission following the midterm review. The loan and grant were extended three times for a total of 30 months. Appendix 6 compares the actual schedule with the original. F. Implementation Arrangements
26. The project director appointed by the MFARD was responsible for overseeing project implementation. An interagency project steering committee chaired by the secretary of the MFARD met periodically to review progress. The project management office (PMO) responsible for coastal stabilization, CERM, and institutional strengthening was in the MFARD, which was also the implementing agency for the institutional strengthening. The CCD was the implementing agency for coastal stabilization and CERM, and the CFHC was the implementing agency for fishery resource management. The implementation arrangements are in Appendix 7. 27. Led by the project director, the PMO supported the four project components. The PMO consisted of administrative and accounts divisions, and a monitoring-and-evaluation division was added in 2004. A project implementation unit (PIU) headed by a PIU manager was established for each component. Under the CERM component, five field PIUs established in the five districts to coordinate activities came under the direct supervision of the project director and the PIU managers and were staffed by field PIU managers, social mobilizers, and other administrative staff. G. Conditions and Covenants
28. The loan covenants were partly complied with, as detailed in Appendix 8. Some of the covenants not complied with by project closure were (i) the enactment of legislative reforms under the proposed coast conservation act and fisheries and aquatic resources act; (ii) the progressive phasing out of subsidies for fishing boats by 15% annually; (iii) the institution of cost recovery through levies on berthing.

7
H. Related Technical Assistance
29. Advisory TA10 implemented from September 2005 to June 2006 required 1.25 person-months of international consultancy and 17.50 person-months of national. The consultants’ key tasks were to (i) prepare draft shoreline management plans for selected pilot sites; (ii) introduce public–private partnership for implementing and managing these plans, including options for financing the proposed Coastal Protection Fund; and (iii) introduce economic criteria for coastal protection investments, operation and management, and coastal buffer zone options. During the inception phase, the scope of the TA was reviewed by the Department of Wildlife Conservation (which was designated the EA for the TA at the time of appraisal), the Ministry of Tourism, and ADB to address current requirements for shoreline management. The consultants performed satisfactorily and produced the required outputs, including pilot plans for shoreline management at selected sites and a framework for private sector participation. However, the unavailability of funds meant follow-up interventions under the pilots studies were not implemented, so the TA is considered only partly successful. I. Consultant Recruitment and Procurement
30. The project required 227.95 person-months of international consulting inputs and 510.00 person-months of national, as detailed in Table 2. Consulting services were to be provided under each of the four components. The consultants were engaged in line with ADB Guidelines on the Use of Consultants (2010, as amended from time to time).
Table 2: Distribution of consultant man months
Component International Consultancy
(person-months) National Consultancy
(person-months) Coastal stabilization 76.20 135.00 Coastal environment and resource management 18.00 87.00 Institutional strengthening 78.00 218.00 Fishery resource management and harbor quality improvement 55.75 70.00 Total 227.95 510.00 Source: Project management office. 31. There were 6 international competitive bidding contract packages in the project and nearly 20 national competitive bidding packages. Civil works and goods were procured in line with ADB Procurement Guidelines (2010, as amended from time to time), as prescribed in the report and recommendation of the President and Schedule 4 of the loan agreement. J. Performance of Consultants, Contractors, and Suppliers
32. Consultants. The performance of the consultants was satisfactory, The inputs were provided on time and well received by the MFARD. The consultants supervised engineering works and provided inputs for institutional and capacity development in the MFARD and the implementing agencies. However, team leader turnover in the consulting teams for institutional strengthening and CERM adversely impacted the implementation of these components.
10 ADB. 1999. Technical Assistance to Democratic Socialist Republic of Sri Lanka for the Cost Recovery Mechanism
Analysis for Coastal Zone Protection, Manila (TA 3274-SRI, approved on 13 October 1999 for $150,000).

8
33. Contractors and suppliers. The performance of the contractors for the coastal stabilization component was satisfactory, and the works were completed almost on schedule. The performance of other international contractors for the fishery resource management (FRM) component was less than satisfactory, as the inputs were delayed mainly by poor machinery and the lack of skilled labor. The performance of local contractors engaged under various small contracts for the shore facilities in Hambantota and Chilaw was generally satisfactory. The performance of the local contractors engaged for works for the Ambalangoda shore facilities was poor, as the contractor abandoned the project in the final stages of implementation due to insolvency. All of the marine works under the coastal stabilization and FRM components were of good quality, as confirmed by project management office reports and review missions. K. Performance of the Borrower and the Executing Agency
34. The performance of the borrower, MFARD, and implementing agencies was satisfactory. ADB had immediate access to the MFARD, project management office, and PIUs. The successive secretaries of the MFARD provided valuable leadership and ensured that policy and on-the-spot issues were solved immediately for smooth and timely implementation. The Ministry of Finance, Department of External Resources, and Department of National Budget also provided consultant support for smooth implementation. However, there were issues regarding the administration of the FRM component by the Ceylon Fishery Harbors Corporation (CFHC). As the CFHC did not directly implement the component, its ownership of the outcomes of the component was not secured. Also, efforts to institutionalize the outputs of the TA demonstrated insufficient ownership by the MFARD, particularly in regard to strengthening community participation in resource management and institutional development. The performance of the borrower and the MFARD are rated satisfactory. L. Performance of the Asian Development Bank
35. The project was delegated to the resident mission following the midterm review in 2004. The resident mission provided inputs as required at national steering committee meetings and conducted numerous missions to project areas, some of which were also covered under the tsunami emergency assistance project. Having the same project officer throughout after the delegation of the project to the resident mission ensured continuity, training, and close project monitoring. The performance of the ADB was satisfactory.
III. EVALUATION OF PERFORMANCE
A. Relevance
36. The project is rated relevant at both approval and completion. It was designed to enhance environmental protection in coastal areas and reduce poverty in fishing communities along the west coast of Sri Lanka. Its objective was to establish the integrated management of coastal resources to improve sustainability, which was lacking. 37. The project addressed these issues using an integrated and participatory approach involving stakeholders at all levels, as was appropriate. The project effectively implemented (i) coastline stabilization, (ii) coastal environmental and resource management, (iii) FRM and harbor quality improvement, and (iv) institutional strengthening. Project activities were expected to deal with the priority issues of erosion in areas of concentrated economic activity, unmanaged fishing in coastal and offshore areas, pollution and the unchecked exploitation of coastal

9
ecosystems, and widespread poverty in coastal populations. The project also contributed to the institutional reform and capacity building required to make management more effective. B. Effectiveness in Achieving Outcome
38. The project was effective in achieving its objectives and most of its targets. It achieved all of the coastal stabilization targets funded by ADB, with most of the work completed by the midterm review and finalized in June 2005. However, the component for which the government was responsible was not completed. At the midterm review, the government requested ADB to fund this component, but ADB refused and the component remains incomplete. Part A of Appendix 3 provides details of the achievements, impacts, and issues on coastal stabilization works carried out over a 41-km stretch along the west coast that included the in kind contributions of beneficiaries. The right-hand column of the project framework in Appendix 2 also summarizes achievements. 39. The targets of the CERM component were achieved after a delayed start. Changes recommended at the midterm review included replacing the team leader. The changes were successfully adopted by phase 2 of the midterm review and were carried out. An extension of 2 years was granted to enable the completion of seven subcomponents that required a careful interdisciplinary approach and stepwise implementation. Progress was slower than anticipated, and some activities were completed only at the end of 2007. The engineering works to construct coastal resource management and visitor centers were successfully completed. All other activities, including strengthening communities, building awareness, planning special area management, conserving habitats, managing resources, and improving water exchange and social programs, have been completed. Details of achievements, impact, and outcomes are in Appendix 2 and Appendix 3. A main outcome of the project, improving livelihoods through alternative employment, was carried out as a livelihood development program under the CERM component. 40. The FRM and harbors component experienced significant delays, and the achievement of the project outcomes is unsatisfactory. Of the two subcomponents, improving existing fishery harbors was executed without much delay and is 85% complete. The subcomponent to build new fishery harbors and anchorages was significantly delayed. During the midterm review, it was decided to drop one anchorage, mainly because its construction was not economically viable. However, Hambantota fisheries harbor, Chilaw harbor, and Ambalangoda anchorage are completed and are in full use. The new fish market in Chilaw was not built. Details are in Appendix 2 and Appendix 3, part C. 41. The institutional strengthening targets have been mostly met in a timely and satisfactory manner, including (i) strengthening the government’s national policy, (ii) improving infrastructure, and (iii) training and research. Though the planned outputs, including updating current polices and proposals for amending acts, were delivered in time, legislative approval and the actual implementation of the changes could not be achieved within the project period for many reasons. Details are in Appendix 2 and Appendix 3, part D. C. Efficiency in Achieving Outcome and Outputs
42. The project was efficient in achieving most of its outcomes even after initial delays in 3 CERM and fisheries harbors component. That planning, design, and implementation followed the government’s existing requirements and procedures assisted the implementation and sustainability of the physical works and livelihood components. The first tender for works was

10
issued within 6 months of the loan becoming effective. The coastal stabilization component was completed almost on schedule. However, the delay in developing fishing harbors meant that beneficiaries could not fully use facilities under the FRM component in a timely way. D. Preliminary Assessment of Sustainability
43. The project is rated less likely sustainable. The government must contribute to and support the outputs of the project as agreed to ensure sustainability. This is especially true for the fisheries harbors and CERM components. Comparatively, designs for coastal stabilization component ensured longer life cycles of the costal structures and beach nourishments. However, to ensure sustainability close monitoring, and preventive maintenance requires continuous funding and technical backing. 44. Although new CCCs were established in the CERM component, in some instances it was possible to use existing groups. The project had to support CCCs’ empowerment and ownership of the visitors centers. Local governments and institutions require funds to support maintenance and improvements to visitors centers. For the sustainability of the visitor centers and other infrastructure development, funds should be generated locally by introducing boat charges and visitor charges, etc. Currently these charges are not in place because the facilities have not developed to the capacity to generate this income. 45. By improving shore facilities at existing harbors and commissioning new harbors and anchorages, the project provided fishing communities with the resources needed for sustainable and improved livelihoods. For the resources to remain sustainable, however, there needs to be funding to maintain and improve the facilities over time. The CFHC is yet to implement proposed charging users of the facilities, using the databases developed under the institutional strengthening component to register new users and maintain the records of old users. 46. Community awareness has played a significant role in reducing illegal practices in coastal communities. This has contributed to improving the environment and instilling appreciation for available resources. However, community awareness needs to be reinforced and extended to ensure long-term benefits. Additional local government funding is required, and institutions need to work effectively with local governments. For alternative livelihoods to be sustainable, markets must be found for the products generated by them. It is also important to identify economically viable alternative livelihoods. In addition, to ensure the long-term sustainability of all facilities, it is essential that user groups and coast communities have a sense of ownership and the willingness to maintain them. E. Environmental, Sociocultural, and Other Impacts
47. The impact of the project was positive as a result of improved resource management, the rehabilitation of existing systems, institutional and legal reform, enforcement, and awareness building. The initial assessments of benefits of the different components are in Appendix 3 and include (i) decreased losses to severe erosion in stabilized areas; (ii) an increase in tourism in stabilized areas; (iii) fewer reports of illegal practices including illegal fishing, shell mining, poaching, and tree cutting, especially in mangrove forests; (iv) improved coastal ecosystems; (v) increased fish production and post harvest quality; and (vi) improved sanitation, cleanliness, and health. 48. Coastal stabilization has benefited more than 60,000 households, or 300,000 individuals, by protecting their houses and providing stable beaches for landing boats. The protection of

11
valuable infrastructure along the coast is very significant. Over two million cubic meters of sand was borrowed from offshore sites for beach nourishment works. Environmental impact assessments were carried for the component following ADBs and the government’s guidelines. The environmental management plan developed for the project was closely monitored by both Central Environmental Authority and Geological Survey and Mines Bureau in close coordination of the community. 49. Under the CERM component, nearly 1 million people in the special area management sites benefited through nearly 370 interventions for habitat conservation, resource management, and reengineering lagoons, as well as through the awareness and social program modules of this component. Over 1,000 villagers benefited from the livelihood development programs of the CERM component. 50. The project has increased the capability and intention of coastal communities to protect their own resources through coastal management, monitoring, and surveillance. In some instances, interest and ownership has been so strong that communities have been motivated to carry out local surveys and write books on their own. The project strengthened the ability of beneficiaries to pursue alternative livelihoods and provided resources such as boats and nets to further improve their livelihoods where appropriate. The project has affected the role of women in villages, making them stronger and more involved in generating income and changing attitudes in both men and women. 51. The project had significant impact on local technical capacity through its training programs. However, long-term impact was weakened by the failure of the CCD, for lack of funds, to absorb project staff as earlier agreed by the government.
IV. OVERALL ASSESSMENT AND RECOMMENDATIONS
A. Overall Assessment
52. The project was successful and relevant to the development strategies of the government and ADB. Initial implemental delays in two of the four components reflected procurement delays, changes in the project director, and initially poor consultant performance. Yet, by completion, the project achieved most of its physical targets. The major outputs of the coastal stabilization component were delivered well within time. Only the smaller part between Beruwala and Bentota, financed by the government, was not completed due to stakeholders not accepting the revised design done after the 2004 tsunami. It had a positive environmental impact by protecting coasts from erosion, improving water exchange in selected lagoons, reducing encroachments into lagoon ecosystems, and significantly raised awareness in coastal communities about natural resources. It has provided communities with more avenues toward improved income. The project’s EIRR of 18.6% at completion is acceptable. 53. One of the first coastal resource management projects in Sri Lanka, the project recognized community participation as key to successful implementation. The CCD has subsequently adopted the community-based approach as its regular work practice. Sustaining project outcomes requires reinforcing awareness and allocating funds to maintain the outputs and further develop them.

12
B. Lessons
54. One key lesson is the need to involve communities in project activities from inception to completion. Law enforcement alone cannot safeguard the environment. To ensure communities benefit, their involvement is important even in large infrastructure development and rehabilitation projects. Social awareness programs are important throughout project implementation and beyond to encourage community ownership of their resources. Even at the institutional level, a sense of ownership has to be developed early in the project. This can prevent delays during implementation and ensure continued operation and maintenance. Communication among stakeholders should be strengthened to convey correct messages and prevent misunderstandings. 55. The project trained coastal communities in alternative livelihoods to prevent their over- exploitation of coastal resources. To ensure the sustainability of the alternative livelihoods, they should link to markets to generate income. If not, communities may return to their traditional activities. 56. Delays in implementation ensue when components are clustered in a project. Further, clustering discourages ownership of project outputs. Combining harbor development with coastal conservation delayed project implementation considerably because the activities are not complementary. C. Recommendations
57. Future monitoring. Since a major part of funding went to coastal stabilization, additional funds should be raised for regular maintenance and coastal monitoring. Proposals and baseline data were established by the project. This can be replicated at other sites suffering high rates of erosion. Monitoring can be simple with the participation of local communities. This will ensure sustainability and increase awareness of the fragile ecosystem. There should be continuous monitoring of sand build-up in harbors developed under the project. 58. Covenants. Future loans should include only covenants that can be complied with during the period of the loan. Any covenant that involves approval from Parliament should be only an output not a loan covenant. 59. Further action or follow-up. ADB will follow up on (i) the operation and maintenance of the assets created under project, (ii) institutionalizing some of the outputs of the institutional strengthening component, and (iii) completing shore facilities in Ambalangoda and Chilaw. The harbor component should be handed over to the CFHC as soon as possible so that impacts and benefits can be measured without further delay. This should also encourage the CFHC’s ownership of the new harbors and anchorages. 60. Sand build-up in the Hambantota fishery harbor has occurred, caused by changes to the coast nearby with the construction of the main Hambantota harbor. Continuous monitoring of sand build-up is proposed, as is using the two dredgers provided under the project to dredge annually. 61. Timing of the project performance evaluation report. The report should be prepared after the facilities have been in operation for 3 years.

13
62. General. Natural resources management projects should include community participation to ensure sustainability. Also, projects should avoid clustering of different institutions to achieve the objectives in time.


Appendix 1 14
OVERALL ASSESSMENT
Table A1.1: Rating at Completion of Coastal Resources Management Project
Criterion Weight
(%) Definition Rating Range Project Rating
Weighted Rating
Relevance 20 Relevance is the consistency of a project’s impact and outcome with the government’s development strategy, ADB’s lending strategy for the country, and ADB’s strategic objectives at the time of approval and evaluation and the adequacy of the design.
Highly relevant (3) Relevant (2) Partly relevant (1) Irrelevant (0)
Relevant 0.4
Effectiveness
30 Effectiveness describes the extent to which the outcome, as specified in the design and monitoring framework, either as agreed at approval or as subsequently modified, has been achieved.
Highly effective (3) Effective (2) Less effective (1) Ineffective (0)
Effective 0.6
Efficiency 30 Efficiency describes, ex-post, how economically resources have been converted to results, using the economic internal rate of return, or cost effectiveness, of the investment or other indicators as a measure and the resilience to risk of the net benefit flows over time.
Highly efficient (3) Efficient (2) Less efficient (1) Inefficient (0)
Efficient
0.6
Sustainability 20 Sustainability considers the likelihood that human, institutional, financial and other resources are sufficient to maintain the outcome over its economic life.
Most Likely (3) Likely (2) Less likely (1) Unlikely (0)
Less Likely
0.2
Overall Assessment
100 (Score of 1.6–2.7 = Successful)
Successful 1.8
Source: Project Completion Review Mission


15 Appendix 2
PROJECT FRAMEWORK
Design Summary Performance Indicators/Targets
Monitoring Mechanisms
Assumptions and Risks
Revised Performance
Indicators/Targets
PCR Evaluation of Accomplishments
1. Goal Enhance environmental protection of coastal areas and contribute to poverty reduction among fisher folk communities
Coastal erosion along seven specific coastal segments, with a total length of 52 km, reduced from current rate of 10 ha/yr by 2005 SAM plans effectively implemented in 6 critical coastal sites by 2005 Spoilage in catch of Multi-day boats reduced by 20% by 2005
Project monitoring reports Review of national strategies/policies during Country Programming Mission Aid agency coordination meetings on strategies/policies concerning the sector and related sectors Benefit monitoring and evaluation (BME) reports
Effective operation of institutions for coastal resource management is sustained beyond the project. Funds are available for planning and maintenance for coastal resource management after the project.
Coastal erosion along six specific coastal segments with a total length of 56 km, reduced from current rate of 10 ha/yr by 2005
Coastal erosion has been successfully controlled in 41km SAM Plans in 6 sites prepared and critical interventions implemented. Shore facilities in 3 new and 4 existing facilities were improved. New facilities has improved hygiene and fish handing reducing losses.
2. Purpose/Objective Establish integrated management of coastal resources to improve its sustainability
CCD implements coastline protection and stabilization measures in seven specific coastal stretches by 2005. Six SAM plans implemented by CCD by 2004 in collaboration with coastal communities and NGOs
Minutes of CCAC meetings Meetings with MFARD secretary NGO reports Post-construction monitoring reports Project monitoring reports Erosion reports
Participating government agencies appoint as members of CCAC Competent representatives who are knowledgeable in coastal resource management concerns and issues and are directly involved in policy-making process for the sector.
CCD implements coastline protection and stabilization measures in six specific coastal stretches by 2005 CFHC manages two safe, efficient and hygienic harbors and one anchorage whilst improving facilities at eight existing harbors.
CCD has successfully provided coastal protection and stabilization in four specific coastal stretches. In two stretches were undertaken by the GoSL. Six SAM Plans developed by 2006 and critical interventions implemented by 2009.

16 Appendix 2
Design Summary Performance Indicators/Targets
Monitoring Mechanisms
Assumptions and Risks
Revised Performance
Indicators/Targets
PCR Evaluation of Accomplishments
CFHC manages two safe, efficient, and hygienic harbors and two anchorages by 2005.
CCC reports MCS reports Fisheries statistics Project resource inventory reports Annual reports of DFAR Fish quality control reports CFHC harbor reports Reports of fisheries cooperatives
Field-level monitoring of coastline condition carried out effectively beyond project. CCD is able to hire adequate and competent incremental staff and is able to effectively encourage community participation. Effective enforcement of regulations on coastal fishing and fish handling as well as implementation of licensing and MCS measures Trained CFHC staff apply acquired harbor management skills effectively beyond project. No political interference in community-based coastal resource management
Two harbors (Hambantota and Chilaw) and one anchorage (Ambalangoda) are completed 2008.
3. Outputs
3.1 Coastline Stabilization Component
17 Appendix 2
Design Summary Performance Indicators/Targets
Monitoring Mechanisms
Assumptions and Risks
Revised Performance
Indicators/Targets
PCR Evaluation of Accomplishments
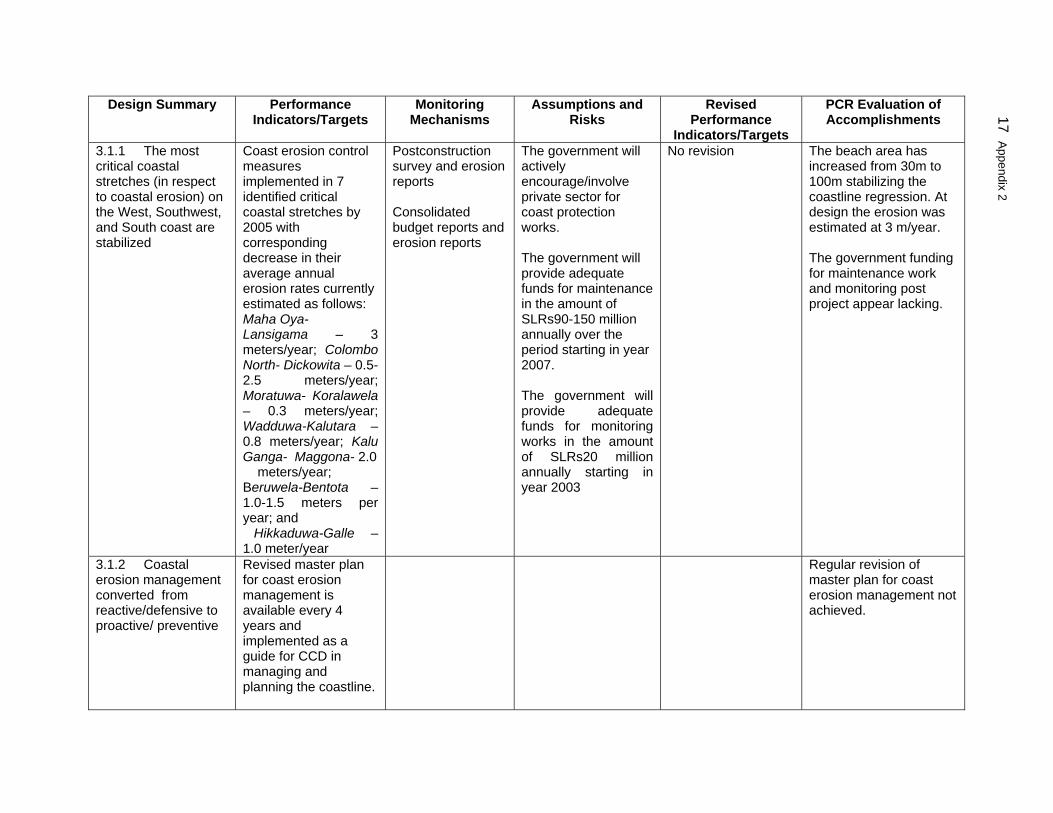
3.1.1 The most critical coastal stretches (in respect to coastal erosion) on the West, Southwest, and South coast are stabilized
Coast erosion control measures implemented in 7 identified critical coastal stretches by 2005 with corresponding decrease in their average annual erosion rates currently estimated as follows: Maha Oya- Lansigama – 3 meters/year; Colombo North- Dickowita – 0.5-2.5 meters/year; Moratuwa- Koralawela – 0.3 meters/year; Wadduwa-Kalutara – 0.8 meters/year; Kalu Ganga- Maggona- 2.0 meters/year; Beruwela-Bentota –1.0-1.5 meters per year; and Hikkaduwa-Galle – 1.0 meter/year
Postconstruction survey and erosion reports Consolidated budget reports and erosion reports
The government will actively encourage/involve private sector for coast protection works. The government will provide adequate funds for maintenance in the amount of SLRs90-150 million annually over the period starting in year 2007. The government will provide adequate funds for monitoring works in the amount of SLRs20 million annually starting in year 2003
No revision The beach area has increased from 30m to 100m stabilizing the coastline regression. At design the erosion was estimated at 3 m/year. The government funding for maintenance work and monitoring post project appear lacking.
3.1.2 Coastal erosion management converted from reactive/defensive to proactive/ preventive
Revised master plan for coast erosion management is available every 4 years and implemented as a guide for CCD in managing and planning the coastline.
Regular revision of master plan for coast erosion management not achieved.

18 Appendix 2
Design Summary Performance Indicators/Targets
Monitoring Mechanisms
Assumptions and Risks
Revised Performance
Indicators/Targets
PCR Evaluation of Accomplishments
3.2 Coastal Environment and Resources Management Component
3.2.1 National CZMP revised and updated
National CZMP revised by 2002
Adequate technical capability exists
CZMP revised in 2004
3.2.2 Appropriate CERM interventions are effectively implemented in the nine identified CRM sites.
SAM plans produced for Bar Reef and Lunawa Lagoon Existing management plans reviewed/ updated for Negombo Lagoon, Madu Ganga Estuary, Unawatuna, and Kalametiya Lagoon Coral reef areas improved at Bar Reef and Unawatuna Mangrove areas improved at Negombo, Lunawa, Madu Ganga, and Kalametiya; wildlife habitat Wildlife habitat at Negombo, Madu Ganga, and Kalametiya Lagoon water quality
SAM plan reports Habitat monitoring reports and statistics of CCD and NGOs Environmental quality monitoring reports of CCD and NGOs Community surveys and other feedback from NGOs BME report Socioeconomic survey Review missions
CCCs reconstituted to address key policy issues Institutional capability adequate The government will provide budget provisions of SLRs100-140 million annually.
Interventions at Unawatuna were extended to Koggala and Habaraduwa
SAM plans produced for 6 sites. Coral reef habitat improved at Bar Reef and Hikkaduwa through boundary demarcations and monitoring carried out by NARA. To improve the environment mangrove/ tree planting has been carried out Overall 76 habitat conservation resource management activities and 23 improvement of water exchange activities were carried out at the 8 sites. Overall 22 CCC strengthening activities, 120 awareness building activities, 105 social programs and 24 SAM Planning programs

19 Appendix 2
Design Summary Performance Indicators/Targets
Monitoring Mechanisms
Assumptions and Risks
Revised Performance
Indicators/Targets
PCR Evaluation of Accomplishments
improved in Negombo, Lunawa, Madu Ganga, Kalametiya, and Mawella Lagoons Solid waste reduced at Lunawa, Negombo, and Tangalle/ Hambantota Social infrastructure installed in Negombo and Lunawa by 2005 1,800 household beneficiaries in coastal communities of the 6 project sites trained as part of livelihood development programs
(which involved the CCCs) were carried out over the 8 sites. Community survey reports have been prepared; however, BME reports have been only partially fulfilled. Livelihood development program conducted at 6 sites – trained 1002 (226 males and 776 females) in range of activities. The impact level varies with some sites showing adoption of the training at a higher level than others. End of project socio-economic survey results are lacking to confirm current status.
3.3. Fisheries Resources Management and Quality Improvement Component
3.3.1 Fisheries management systems established
MCS system for conservation and management of fishery resources established by 2002
BME reports Post project appraisal Post project evaluation
Communities, government, and grassroot level community organizations are willing and able to cooperate and
MSC system formulated under MFAR and member of CFHC were trained including 15 members representing fish processing sector. Unable to determine

20 Appendix 2
Design Summary Performance Indicators/Targets
Monitoring Mechanisms
Assumptions and Risks
Revised Performance
Indicators/Targets
PCR Evaluation of Accomplishments
NGO and CBO reports
support the project
success of system due to lack of data – lacking/partially fulfilled monitoring mechanisms. Also a lack of ownership and responsibility by CFHC appears to have hindered progress.
3.3.2 Effective quality enhancement and resource Conservation measures introduced in Bar Reef, Chilaw, Morawela, Mawella Lagoon, Kalametiya, and Hambantota
Spoilage in catch of multiday boats reduced by 20% by 2005 Village-based fish processing technologies introduced in Bar Reef, Mawella Lagoon, and Kalametiya by 2005
Survey and appraisal of projects introduced Statistical reports Post harvest and marketing consultants reports BME reports Review missions
Foreign sources into local market Consumer response to education and awareness campaigns on quality identification and hygiene Release of adequate funds by government from annual subsidy allocation toward improvements and refrigeration of fish holds Operators continue to follow improved post harvest practices and maintain the confidence of export processors by supplying high quality fish
Though village based fish processing techniques have been introduced quantitative data is lacking to determine the success of the program. Monitoring mechanisms have only been partially fulfilled.
3.3.3 Fisheries infrastructure
Construction of 2 fishery harbors (in
Survey of harbors and anchorages
Acceptance and support of resource
Kalametiya dropped from current
Construction of the 3 new harbors completed.

21 Appendix 2
Design Summary Performance Indicators/Targets
Monitoring Mechanisms
Assumptions and Risks
Revised Performance
Indicators/Targets
PCR Evaluation of Accomplishments
developed
Chilaw and Hambantota) and 2 anchorages (in Ambalangoda and Kalametiya) as a means to reduce pollution in lagoons
Progress reports of site engineers Review missions
users Selection of competent engineers for timely completion of activities
component. It is expected that production will drastically increase with the shift form day boats to multi day boats.
4. Inputs $72.25 million, comprising a $40.17 million ADB loan, $12.02 million grant from the Government of Netherlands, $20.06 million in borrower financing, and $0.09 million in beneficiary contributions in kind
BME = benefit monitoring and evaluation; CBO = community-based organization; CCAC = Coast Conservation Advisory Council; CCC = Community Coordinating Committee; CCD = Coast Conservation Department; CFHC = Ceylon Fishery Harbors Corporation; CRM = coastal resources management; CZMP = Coastal Zone Management Plan; DFAR = Department of Fisheries and Aquatic Resources; GIS = geographic information system; MCS = monitoring, control, and surveillance; MFARD = Ministry of Fisheries and Aquatic Resources Development; NARA = National Aquatic Resources Research and Development Agency; NGO = nongovernment organization; SAM = special area management.

Appendix 3
22
PROJECT OUTPUTS A. Coastal Stabilization Component
1. Overview 1. Physical interventions were carried out to proactively address coastal erosion at specific coastal segments from Galle to Chilaw. This is a change from the traditional reactive or defensive approach that countries like Sri Lanka have been adopting. 2. Seven sites were selected from the master plan for coast erosion management for the project. The selection criteria include (i) magnitude of erosion; (ii) utilities affected (e.g. roads, railways, religious places); (iii) resources degraded and threatened; (v) impact of human interference contributing to the problem (e.g. with poorly designed and unplanned protection structures) and (v) the public/political demand or will for a solution and the feasibility to define an effective and efficient coast conservation concept. 3. These seven sites were clustered into two parts. Part A includes: Maha Oya-Lansigama (13 km), Colombo North-Dickowita (6 km), Moratuwa-Koralawella (2 km), Wadduwa-Kalutara (14 km), Kalu Ganga-Maggona Headland (8 km), and Part B includes: Beruwela-Bentota (7 km), and Hikkaduwa-Galle (8 km). 4. ADB funded the stabilization works of all sites in Part A and the government funded one site in Part B. The other site under Part B is to be completed with the government funds as per the revised design. Key milestones of the component is in Table A3.1 5. The engineering measures included pure beach nourishments, combinations of sand-filling and hard structures (groins, revetments, and offshore breakwaters) to obtain the optimum stabilization scheme in terms of construction and establishment cost, maintenance cost, and functionality. The design concepts were planned taking full account of the need to ensure that they are consistent with the concepts embodied in the Coastal Zone Management Plan (CZMP)1.
2. Achievements
6. Table A3.1 summarizes the achievements of this component.
Table A3.1: Summary of Achievements Activity Achievements
Maha Oya-Lansigama Coastal Stabilization Works (13km)
Under this stretch sand fill volume amounted to 510,756m3 and sand nourishment – 1,995,300 m3 (with 1,027,222 done at the inception). Eight breakwaters (862m in total length), 8 groynes (548m), 9 cove groynes (931m) and 2521 m worth of revetments were constructed. The erosion rate of 3m/year has been drastically reduced and the beach area has increased to 30 to 100m facilitating boat landing and recreation ground for local and foreign tourists. There are however, isolated pockets where sand fill has been washed away. Nearly 400 houses and 5 churches which have been under threat have been protected/saved. One power line has been saved as well as the coastal road
1 Coastal Conservation Department. 1997. Coastal Zone Management Plan Update. Colombo.

Appendix 3
23
Activity Achievements from Thoduwawa to Wellamankada. Around 10 acres of coconut land has been protected with a reported increase in yield. Three holiday resorts have been protected and the beach front improved reporting increase in occupancy rates. Considerable number of direct and indirect employment opportunities has been created as a result of increased business of these hotels. Twelve boat landing sites have been protected and improved.
Colombo North-Dickowita Coastal Stabilization works (6km)
Under this stretch sand fill volume was 110,000m3 and 16 groynes (809m – total length), 5 breakwater (630m), 2 revetments (254m) and a seawall with a walkway (500m) were constructed. Reef strengthening was also carried out in two locations. Coastal erosion is completely under control and sand fill has stabilized. Dickowita beach road has been protected along with the power, telephone and water lines – a total of about S LRs. 9.5 million was saved in terms of infrastructure. About 20 acres land area protected along with about 20 fishery houses (worth about SLRs. 128 million). The 500m sea wall established in the beach front sheltering 80 shanties that house an estimated population of 500, the Kovil ground which is also being used as the community meeting place, the market place, and the recreation ground used by around 3000 people of the area.
Wadduwa Coastal Stabilization Works (14km)
To balance sand deficits, artificial beach nourishments were carried out at 3 locations with a total sand volume of 300,000m3. In the coastal stretch in between Hotel Siddhalepa and Hotel Sun View, it was reported that a land area of 10m wide and 325m long stretch was eroded before sand nourishment. About 35 coconut trees had been destroyed due to erosion prior to project interventions.. Beach area has widened by about 10m and fishermen can land their boats even during the Southwest monsoon period.
Kalu Ganga- Maggona Headland Stabilization Works (8km)
Sand fill was carried out at 10 locations amounting to 428,789m3, and construction of 7 groynes (inclusive of a breakwater headland and a terminal groyne (1,058m in total length), 4 breakwater (760m), and 325m worth of revetments were carried out. The erosion rate had been 2m/y in the Kaluganga- Maggona area. At one location, in front of Aprima Hotel, the filled sand (around 40-50 meters i.e. two rows of coconut plants) from the nourished beach has been lost. According to the Manager, the estimated direct loss to the hotel due to canceling of bookings and compensation payments to the tourists, with the loss of beach front is one million rupees per year. There are 250 fisher families living in the villages in this area and they have been able to increase their fishing months from 3 to 9 with the sand fill. On average their income has increased by around Rsm 30,000 per family per year (pers com, Collin Silva, ex- MC). They are of the opinion that the space between the two groynes could be reduced to avoid current hitting the beach. This will have adverse effects only on about 10% of the fishing families operating Ma-del and they too could revert to boats. The occupancy rate of the hotels, both local and foreign has doubled as they now advertise their hotel as a beach hotel. In addition, with the increased beach front, Kani Lanka reports that a US $ 15 million Seven Star Hotel Complex with 100 hotel rooms has been ear marked.
Source: Project management office

Appendix 3
24
B. Coastal Environment and Resource Management Component
1. Overview
7. The Coastal Environment and Resource Management (CERM) component, financed by the grant from the Government of the Netherlands, addressed the problems of coastal resource degradation at eight different sites2. Coastal communities were trained in alternative livelihoods with the objective of relieving the pressures on coastal resources and raising the income of beneficiaries. Of these eight coastal sites, Hikkaduwa Marine Sanctuary area and Mawella Lagoon area were benefited by other programs of the CCD therefore only limited interventions were needed. 8. Eight sites were selected from among the 23 sites identified in the CZMP of 1997 as potential areas for application of the Special Area Management (SAM) process. These sites include Bar Reef, Habaraduwa, Negombo lagoon, Hikkaduwa Marine Sanctuary Area, Lunawa lagoon, Mawella lagoon, Maduganga estuary, and lagoon and Kalametiya lagoon. SAM planning is a collaborative effort of government entities and stakeholders to address social, economic and environmental issues to revitalize an environmentally threatened coastal habitat.
2. Achievements
9. Table A3.2 summarizes the achievements of this component.
Table A3.2 Summary of Achievements Activity Achievements Community strengthening Identification, organization and mobilization of local stakeholders for guidance and supervision of data collection, problem identification, and planning and implementation Setting up of Visitor Centers and Community Centers at identified locations.
Community Coordinating Committees (CCCs) formed at all 8 sites and regular meetings conducted. Some of these developed into community based Development Foundations such as in Maduganga, Bar Reef, Habaraduwa, Mawella and Kalametiya Community was empowered through the establishment of CCCs and Development Foundations. Women were major stakeholders in these groups. However, at final review, some of the CCCs were not functioning due to lack of activity post project. Visitor Centers set up in Kalametiya, Maduganga and Bar Reef. Community Centers were built in Kalametiya and Lunawa. The visitor centers provide education and livelihood opportunities to the community.
Awareness building: Since most resource degradation and abuses were due to the community being unaware and insensitive to environmental degradation and advantageous of proper resource management, awareness activities ere
Nearly 120 awareness building exercises were implemented (Bar Reef 11, Negombo 22, Luawa 16, Maduganga 21, Hikkaduwa 6, Habaraduwa 19, Mawella 10 and Kalametiya 16). The knowledge of rules and regulations resource management, resource benefits, and sanitation and hygiene were raised in pre-school and schoolchildren, teachers, resource users and abusers, elected government and other officials, NGOs and media personnel. The community at all levels is more educated and sensitive to
2 Bar reef, Habaraduwa, Hikkaduwa Marine Sanctuary Area, Kalametiya lagoon, Lunawa lagoon, Maduganga estuary
and lagoon, Mawella lagoon, and Negombo lagoon.

Appendix 3
25
Activity Achievements conducted for the different layers of society. Awareness programs on rules and regulations, benefits of coastal resource management and health and sanitation, were carried out through formal training programs, workshops, exhibitions, field visits, etc.
environmental matters. The educational infrastructure of future coastal communities improved. There is a significant reduction in resource destruction and exploitation in unsustainable ways at all sites at least in protected areas – this is especially true for Maduganga and Kalametiya sites Standards of many preschools and libraries were improved. Educational material on environmental awareness was produced and circulated. Video documentaries were produced for Bar Reef, Negombo, Lunawa, Maduganga, Habaraduwa, Mawella and Kalametiya sites. Sign boards were put up to increase awareness.
Special Area Management (SAM) Planning: Production of the Environmental Profiles, SAM Plans, GIS Maps involved the collection of primary and secondary information, drafting, editing. The project required preparation and regular update of a quarterly Acton Plan.
Total activities were 24 (Bar Reef 4, Negombo 2, Luawa 4, Maduganga 4, Hikkaduwa 2, Habaraduwa 4, Mawella 1 and Kalametiya 3). SAM Plans were prepared for all sites except for Hikkaduwa and Mawella for which SAM Plans already existed. Environmental profiles were produced for all sites except for Negombo for which one already existed. Site specific GIS Maps were produced. The Environmental Profile stresses the absence of law enforcement in the reef area, lack of awareness about the Sanctuary’s boundaries, declining biodiversity; unsustainable use of the marine resources, increased fishing effort, while on the mainland there is widespread poverty, insufficient drinking water, heavy fertilizer use, groundwater pollution, unauthorized constructions, and improper fish storage facilities, to mention part of the problems. Therefore the SAM Plan has been designed to improving the management of the Bar Reef Sanctuary (e.g. rules/regulations, law enforcement, zoning, use of fishing gear) and on the mainland with environmental enhancement (e.g. erosion, pollution, settlement control, poverty alleviation and intuitional strengthening. Destructive and exploitative fishing activities have stopped in the sanctuary area however, continue outside in some localities such as Kalpitiya. There is increased sense of ownership and responsibility by the local community towards the natural resources.
Habitat conservation and resources management: Physical demarcation of sites demarcated under the SAM Plans and the implementation of the management and rehabilitation activities denoted in the plans. Prepare and implement management plan Facilitate enforcement of environmental laws and regulation Purchasing of research equipment
A total of 78 of the planned 90 activities were completed over the 8 sites (Bar Reef 10, Negombo 12, Luawa 8, Maduganga 18, Hikkaduwa 3, Habaraduwa 10, Mawella 6 and Kalametiya 9). The main outcomes were the surveying ad demarcations of site lagoons by gazette notification, rules and regulations enforced against illegal activities, management guidelines for zonal plans prepared for sites such as Bar Reef and Hikkaduwa. Landing sites, access routes and canals were rehabilitated. Equipment purchased to facilitate solid waste management, over 5000 compost bins installed, 2 waste collection shops (in Negombo) have been set up to reduce household waste and non-biodegradable waste. Concepts of greener environment promoted through tree planting programs and mangrove rehabilitation, sea grass bed improvement programs, turtle management programs and other research activities.
Measures to improve water exchange: Measures to
In total 23 activities were carried out (Negombo 10, Lunawa 3, Maduganga 3, Habaraduwa 3, Mawella 4). At Negombo lagoon

Appendix 3
26
Activity Achievements improve water exchange in selected lagoons were carried out by improving and restoring access channels and improving water quality. This was to promote hygienic conditions and reduce pollution and enhance lagoon habitats and increase productivity. Major interventions were carried out at Negombo and Lunawa whereas Maduganga, Habaraduwa and Mawella also benefited.
selected canals were cleaned and dredged (main tender for dredging was not awarded) and invading plants removed. An Amphibious Dredger was purchased. At Lunawa lagoon, dredging of lagoon and lagoon mouth stabilization were completed. Flood warning equipment was installed to activate relevant authorities to remove sand bar to prevent flooding. Peripheral ring road was completed with dredged material and further environmental improvements are being carried out. At Habaraduwa, salt water intrusion and sand bar formation preventive measures have been carried out. The economic, aesthetic and recreational value of the Coastal habitats at the CERM sites have improved. (applies to all the sites and especially to Lunawa where it is very visible). Illegal practices and over-exploitation of habitat have significantly reduced. Solid waste and sewerage waste management improved significantly at the CERM sites. With the improved facilities conflicts among user groups have minimized and a more harmonious existence prevails among the fisher communities. Improved water exchange has led to improved water quality in the selected lagoons. Increased productivity has been reported from Mawella were water exchange has restored the natural aquaculture cycles. However heavy fishing in the canal is a prevailing threat to this natural cycle. Natural weed control has taken place as well. Aesthetic value and environmental improvement is very visible especially at Lunawa with the return of wildlife (birds).
Social programs: This module went along with all other modules discussed above and it carried out an assessment of potential for micro-enterprises and initiating of activities, livelihoods development program including aquaculture promotion through the restocking of natural habitats, looking at sustainable use f fish post harvest, establishment of community centers and facilitation of setting up new community groups. Looking into sanitation and hygiene issues.
In total 105 activities were carried out as against the planned 77 (Bar Reef 32, Negombo 29, Luawa 13, Maduganga 10, Hikkaduwa 3, Habaraduwa 7, Mawella 6 and Kalametiya 5). A total of 1002 people were trained in alternate livelihoods at 6 SAM sites (Kalpitiya, Negombo, Maduganga, Habaraduwa, Kalametiya ad Lunawa) of which 226 were male and 776 were females. Toilets were constructed at al SAM sites. Septic tank systems were set up to minimize hospital wastes, community operated water systems established and recreational facilities created. Though the livelihood development program, people have been given alternatives and encouraged to take on new activities. Women have benefited from this program and have improved their capacity. Yet there is an issue as to the appropriate selection of activities and a lack of a ready market. Selected schools were improved, community centers established, establishment of a sense of conservation of heritage and also looked in to other issues such as obtaining birth certificates for communities in remote areas. Overall the general welfare of the community has improved through increased awareness, education and motivation.
CCC: community coordinating committees: CERM: coastal environmental management, SAM: special areas management Source: Project management office

Appendix 3
27
C. Fishery Harbors Component
1. Overview
10. Under this component improved shore facilities for existing fishery harbors four new fishery harbors and anchorages were constructed. 11. The objectives of this component included (i): increased year-round access and exit to harbors; (ii) minimized damages to boats and operational downtimes during the monsoon seasons;(iii) improved environmental conditions within the harbor sites and adjacent areas; (iv) hygienic fish handling conditions; fresh water for cleaning, ice for preservation of catch and insulated boxes to maintain quality of fish during transport to decrease spoilage; creation of anchoring space and landing facilities suitable for multi-day boats provided; and (v) fueling facilities provided.
2. Achievements
12. Table A3.3 summarizes the achievements of this component.
Table A3.3 Summary of Achievements Activity Achievements Existing Harbors Kudawella Water pump. Overhead tank and distribution lines, Auction building, Net
mending building, 4 Toilets and 5 Bath rooms, Canteen building, Paving internal roads, Fencing, Harbor Managers quarters 1000 sq. ft, Quarters for other staff 850 sq.ft. Landscaping.
Mirissa Auction building floor, Harbor Manager’s quarters, Quarters for other staff
Galle Rehabilitation of auction area
Hikkaduwa Improvements to access road, Harbor Managers quarters 1000 sq.ft, Other quarters 850 sq.ft., Landscaping
Beruwala Canteen and Net mending, Harbor Manager’s quarters 1000 sq.ft, Improvements to quarters of other staff, Auction shed doors and floor.
Kalpitiya Office auction, net mending, canteen, water supply 5000 gallon/day, Public toilets including treatment of effluent from toilets, internal road paving.
Puranawella Auction shed 6x65, Net mending building 6x75.
Moratuwa-Panadura Canteen and boundary walls were constructed.
New Harbors Fisheries Harbor at Ambalangoda
This facility provides berthing facilities for conventional boats, outboard engine conventional boats, outboard engine fiberglass plastic boats, inboard engine day vessels and multi day vessels. Shore facilities constructed are Office and quarters, community hall and canteen, auction hall, net mending hall, toilet block and security hut and complex. About 225 multi day boats use the harbor.
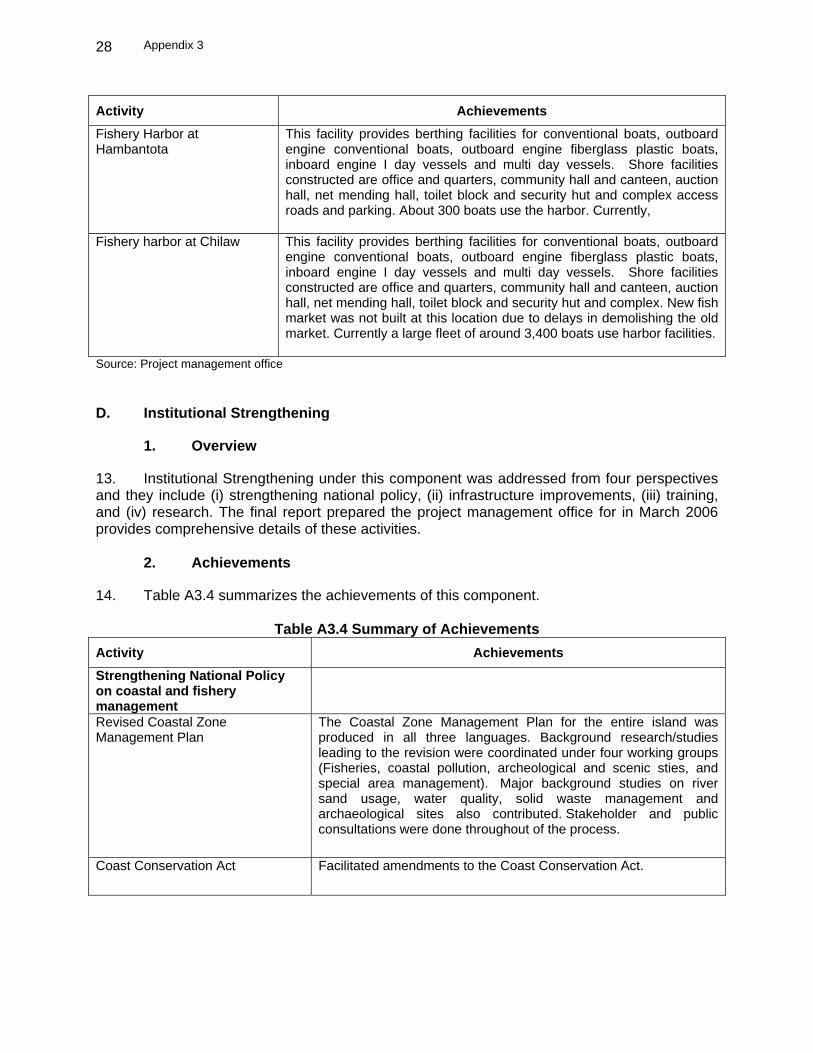
Appendix 3
28
Activity Achievements Fishery Harbor at Hambantota
This facility provides berthing facilities for conventional boats, outboard engine conventional boats, outboard engine fiberglass plastic boats, inboard engine I day vessels and multi day vessels. Shore facilities constructed are office and quarters, community hall and canteen, auction hall, net mending hall, toilet block and security hut and complex access roads and parking. About 300 boats use the harbor. Currently,
Fishery harbor at Chilaw This facility provides berthing facilities for conventional boats, outboard engine conventional boats, outboard engine fiberglass plastic boats, inboard engine I day vessels and multi day vessels. Shore facilities constructed are office and quarters, community hall and canteen, auction hall, net mending hall, toilet block and security hut and complex. New fish market was not built at this location due to delays in demolishing the old market. Currently a large fleet of around 3,400 boats use harbor facilities.
Source: Project management office D. Institutional Strengthening
1. Overview
13. Institutional Strengthening under this component was addressed from four perspectives and they include (i) strengthening national policy, (ii) infrastructure improvements, (iii) training, and (iv) research. The final report prepared the project management office for in March 2006 provides comprehensive details of these activities.
2. Achievements
14. Table A3.4 summarizes the achievements of this component.
Table A3.4 Summary of Achievements Activity Achievements Strengthening National Policy on coastal and fishery management
Revised Coastal Zone Management Plan
The Coastal Zone Management Plan for the entire island was produced in all three languages. Background research/studies leading to the revision were coordinated under four working groups (Fisheries, coastal pollution, archeological and scenic sties, and special area management). Major background studies on river sand usage, water quality, solid waste management and archaeological sites also contributed. Stakeholder and public consultations were done throughout of the process.
Coast Conservation Act Facilitated amendments to the Coast Conservation Act.

Appendix 3
29
Activity Achievements New Fisheries Act The Project facilitated the drafting of the New Fisheries Act to
incorporate provisions for facilitating fisheries management and to comply with international conventions, agreements and protocols. Improved regulations for fishing operational licensing and boat registration were gazetted. |A database of licensed and registered boats was developed and handed over to the Fisheries Department. The recommended new systems would help the department streamline fisheries management.
Fisheries management Plan A Fisheries management plan was developed and introduced to stakeholders through awareness workshops. Draft management plans were also prepared for the spiny lobster fishery in the south coast and the offshore large pelagic fishery in consultation with a cross section of stakeholders including fishing community members.
Infrastructural improvements IT Network Information Technology (IT) Network installed linking the MFARD,
DFAR and the Coast Conservation Department. Capacity to use Geographic Information System (GIS) at CCD strengthened with new hardware, software and trained personnel. GIS database was also established.
Information, education and communication
Strengthened information, Education and Communication (IEC) capabilities including the establishment of a Central Extension Unit (CEU) within the DFAR. New Statistical System.
Introduced to generate catch data and other information necessary for efficient resource management. Corporate Plan and Management Information System (MIS) for the Ceylon Fishery Harbors Corporation. Equipment provided and staff trained.
Training

Appendix 3
30
Activity Achievements International Training Training carried out under 6 main groups – Fisheries Management
and Quality Control, Coastal Zone Management and GIS, Legal Framework and Arrangements, Finance and Accounting, technical and project monitoring and evaluation and management ( for detailed breakdown on training see final report on IS Component) Sixty three individuals from Department of Fisheries and Aquatic Resources, Project Management Office, Field Project Implementation Unit, Coastal Conservation Department, National Aquatic Research Agency, Ministry of Fisheries and Aquatic Resources, and Ceylon Fisheries and Harbor Corporation have received training. Results of an evaluation workshop show that the beneficiaries have gained knowledge, skill development and also attitudinal changes to some extent. The District Secretaries are motivated and have extended their support towards building up good relationships with the divisional level development work through the Community Coordinating Committees. In general, there are no arrangements made to make use of the trainees as resource persons. The resource deficiency and individual/group attitudes limit the benefits either to the individuals or to the institute. The Quality Control training program has been highly beneficial; the trainees have shared their knowledge with other colleagues and formed a team of 25 professionals to help exports.
National Training
512 personnel from these institutions were sponsored under this component to receive training on various aspects of coastal and fisheries management. Some were provided opportunities to gain knowledge on computer skills, languages skills and other training pertaining to their duties and responsibilities. The project designed a training program on monitoring, control and surveillance with training manuals. Participants from Department of Fisheries and Aquatic Resources, Sri Lanka Standards Institute and the Ceylon Fisheries and Harbor Corporation together with 15 representatives from the fish processing industry were trained.
Research River sands alternative study The research concluded positively on commercial use of offshore
sand as an alternative to river sands in terms of engineering as well as on economic factors. On these findings a Cabinet approval was obtained to implement a program for mining and marketing of offshore sand.
Water quality study Coastal Conservation Department (CCD) required a benchmark from which to measure performance and compliance standards. The study was designed to establish the way forward for monitoring water quality standards in the coastal zone as well as to provide practical support for work that CCD was involved. The three sites chose —Marawila, Beruwala and Unawatuna. The study tested samples for E.coli bacteria, heavy metals, organochlorides and other organic matter over a period of two years. Findings indicated inter alia a high organic and faecal pollution throughout the years but more so during the northeast monsoons probably due

Appendix 3
31
Activity Achievements to enhanced tourism during that period. Oil and grease levels were high in many areas.
Other studies Pathogens in Export Shrimp Study - an internationally acceptable baseline study on the prevalence and risk associated with the presence of the Vibrio spp and Salmonella spp pathogens in Sri Lanka’s export shrimp. Review of SAM Sites - reviewed coastal areas of special environmental, historic, archaeological and cultural significance to update the Special Management Areas identified in the 1997 coastal zone management plan.
Source: Project management office

32 Appendix 4
PROJECT COSTS AND EXPENDITURES
Table A4.1: Project Cost by Funding Agency
($ million)
FC=foreign cost; LC=local cost Source: Asian Development Bank estimates
Source
Appraisal Actual
FC LC Total Cost Percent FC LC Total Cost Percent
ADB 29.32 10.68 40.00 50% 28.84 11.33 40.17 56%Netherlands 7.31 5.45 12.76 16% 12.02 0.00 12.02 17%
Government 7.37 19.78 27.15 34% - 20.06 20.06 28%
Beneficiaries - 0.09 0.09 0%
-
- 0.00 0%
Total 44.00 36.00 80.00 100% 40.86 31.39 72.25 100%

Appendix 4 33
Table A4.2: Project Costs by Component and Sources of Funding ($ million)
Amount % Amount % Amount % Amount % Amount % Amount % Amount % Amount %1 Coastline Stabilization
a. Coastline Stabilization: Part A 26.31 72.9 9.77 27.1 24.58 69.2 - - 10.93 30.8 - - 35.51 49.1b. Coastline Stabilization: Part B 9.49 100.0 - - - - - -
2Coastal Environment and Resources Management 8.57 90.4 0.82 8.7 0.09 1.0 - - 4.27 81.8 0.95 18.2 - - 5.22 7.2
3Fisheries Resource Management and Quality 12.67 67.5 6.10 32.5 14.32 63.8 - - 8.11 36.2 - - 22.43 31.0Improvement
4 Institutional Strengthening 0.19 3.6 4.19 78.6 0.95 17.8 0.39 4.8 7.75 94.4 0.07 0.9 - - 8.21 11.4
Interest during construction 0.83 100.0 0.88 100.0 - - - - 0.88 1.2
40 50 12.76 16 27.13 33.9 0.09 0.1 40.17 55.6 12.02 16.6 20.06 27.8 0 0% 72.25 100.0
Component
Total
ADB ADBNetherlands GOSL BenefecieriesAppraisal Estimates Actual
NetherlandsTotal %
GOSL Benefecieries
Source: Asian Development Bank estimates

34 Appendix 4
Table A4.3: Annual Contract Awards and Disbursements
($ million) Year Contract Awards Disbursements 2000 0.00 0.20 2001 5.81 0.99 2002 0.81 2.60 2003 22.86 9.70 2004 0.05 2.42 2005 6.34 12.81 2006 1.09 2.75 2007 1.73 4.49 2008 0.22 3.91 2009 0.39 0.29 Total 39.29 40.16
Source: Asian Development Bank estimates
FigureA4.1: Cumulative Contract Awards and Disbursements
0
5
10
15
20
25
30
35
40
45
2000
2001
2002
2003
2004
2005
2006
2007
2008
2009
Year
$ m
illio
n Contract AwardsDisbursements
Source: Asian Development Bank estimates

Appendix 5 35
ECONOMIC ANALYSIS A. Introduction 1. The economic analysis follows ADB’s Guidelines for the Economic Analysis of Projects. The analysis is presented first by component with a short description of the benefits, costs and assumptions, and then the project as a whole. 2. The goal of the project is to enhance environmental protection of coastal areas and contribute to poverty reduction among fishing communities. The objective is to establish an integrated management of coastal resources to improve sustainability. The project has four components: (i) coastline stabilization (CSC), (ii) coastal environment and resource management (CERM), (iii) fisheries harbors construction and quality improvement, and (iv) institutional strengthening (IS). 3. At appraisal, the total cost of the project was estimated at $80 million and the project was expected to be completed within three years starting from the year 2000. Implementation of the project was delayed due to many reasons and some components of the project were completed in 2008. The total cost of the project at completion was estimated at $76 million.
Table A5.1 : Actual Cost of the Project ($ million)
2001 2002 2003 2004 2005 2006 2007 2008 Total Coastal Stabilization
0.95 3.17 10.36 7.33 17.94 2.41 -0.03 0.54 42.67
Fisheries harbors 0.00 1.56 0.60 0.24 0.55 4.26 6.67 5.62 19.51 CERM 0.13 0.06 0.04 0.38 0.45 0.96 4.39 3.26 9.67 Institutional Strengthening
0.00 0.06 0.38 3.18 0.00 0.39 -0.02 0.00 3.98
Total 1.07 4.85 11.38 11.13 18.95 8.01 11.01 9.42 75.83 CERM=coastal environmental resources management. Source: Project Management Unit 4. Considering the delay in implementation, the life time of the different project components has been re-considered in this analysis. Initially, all project interventions were to be completed within 5 years from the year 2000 and the life of the project was considered as 20 years from 2000 or up to 2020. B. Approach 5. The analysis is carried out with the economic models and valuation methods used at appraisal and midterm review. During the appraisal, four economic models were developed to evaluate the (i) coastal stabilization component (CSC) (ii) coastal environmental resources management (CERM) (iii) fisheries resources management and quality improvement components and (iv) the overall project. These models were updated at the midterm review to include work completed and modified planned interventions.

36 Appendix 5
6. Economic costs were based on the estimated project investments, as derived from the project accounts. The incremental economic benefit streams were calculated by comparing current and future streams of the economic benefits and costs under “with project” and “without project” scenarios. 7. All benefits are not easily quantifiable. Selected quantifiable benefits used at appraisal were used in the analysis. Costs and benefits were adjusted to 2009 prices by using Colombo consumer price index. 8. Data required for the analysis was obtained from project reports and databases at the project office and the Ministry, discussions with key contacts, and field visits. The basic framework for the economic analysis used include: (a) a world price numeraire is employed; (b) Sri Lanka Rupee is the unit of account and constant prices are used; (c) The standard, specific, and labor conversion factors formulated during the appraisal and mid-term have been consistently applied; and (d) transfer payments such as taxes, duties, and interest are excluded from the economic analysis. C. Component Analysis
1. Coastal Stabilization 10. Physical interventions were carried out to address the problem of erosion at four coastal segments from Chilaw to Payagala. These segments are Maha Oya-Lansigama, Colombo North-Dickowita, Wadduwa and Kaluganga-Maggona headland. Although the interventions at Moratuwa-Koralawella were planned under the project, they were not implemented as the Coast Conservation Department implemented this using other sources of funds. 11. The expenditure for works undertaken by the project was within the estimates.
Table A5.2: Cost of Coastal Stabilization Component ($ million)
Project Site
Bea
ch
Nou
rishm
ent
and
Dre
dgin
g
Phys
ical
St
ruct
ures
Ove
rhea
d
Con
tinge
ncie
s
Inve
stig
atio
ns
Tota
l
Initial Estimates Maha Oya-Lansigama 9.83 2.49 0.88 0.00 0.00 13.20Colombo North-Dickowita 0.41 2.73 0.43 0.00 0.00 3.57Wadduwa 0.77 0.07 0.00 0.00 0.84Kaluganga-Maggona Headland (Payagala) 2.27 2.88 0.59 0.00 0.00 5.74
Total 23.35Bid Estimates Maha Oya-Lansigama 7.10 2.63 2.17 1.79 0.05 13.74Colombo North-Dickowita 0.90 1.93 0.63 0.52 0.00 3.98Wadduwa 1.16 0.30 0.20 0.00 1.66Kaluganga-Maggona Headland 1.49 1.72 0.71 0.59 0.18 4.69

Appendix 5 37
Project Site
Bea
ch
Nou
rishm
ent
and
Dre
dgin
g
Phys
ical
St
ruct
ures
Ove
rhea
d
Con
tinge
ncie
s
Inve
stig
atio
ns
Tota
l
(Payagala) Total 24.07
Actual expenditure Maha Oya-Lansigama 7.62 3.17 2.33 2.00 0.05 15.17Colombo North-Dickowita 0.00 1.85 0.40 0.35 0.01 2.61Wadduwa 1.01 0.21 0.19 0.00 1.41Kaluganga-Maggona Headland (Payagala) 1.49 1.74 0.70 0.62 0.02 4.57
Total 23.76Source: Project management office 12. The benefits of coastline stabilization are: (i) avoidance of higher costs that have to be incurred during an emergency, (ii) minimizing coastline erosion and loss of related assets (infrastructure, agriculture and income), and (iii) minimizing losses from tourism due to reduction in tourists due to deteriorating coast and beaches. Value of these benefits was estimated using the same model used at appraisal and midterm. 13. The coastal stabilization component was designed to be completed within first two years of the project. And at appraisal, the life cycle was considered up to 2020. Since the this component was completed in 2005, the life cycle is considered up to 2023, allowing 18 years after completion of the civil works. 14. Without the tourism benefits, EIRR of the whole coastal stabilization component was estimated to be 7.2 %. When the potential benefit from the tourism is also taken into account, the EIRR of the component is 18.5%. In the appraisal and midterm review, EIRR for this component with tourism benefits was estimated as 17.2 % and 18.8% respectively.
2. Coastal Environmental Resources Management Component 15. Eight environmentally sensitive coastal habitats were benefited by this component: These habitats are Bar Reef, Negombo Lagoon, Lunawa Lagoon, Maduganga estuary, Habaraduwa, Hikkaduwa marine sanctuary, Mawella Lagoon and Kalametiya Lagoon; the sites identified for Special Area Management (SAM) under the Coastal Zone Management Plan of 1997. SAM is a collaborative effort of government entities and community to promote revitalization of an environmentally threatened coastal habitat. 370 different interventions were implemented at these sites. These interventions were to strengthen the community organization, build community awareness, develop a special area management plan, improve habitat conservation and resource management, improve water exchange in lagoons and implement social programs. 16. This component was funded by the Government of Netherlands. Even though the cost of some sub-components deviated from the estimate, the component was completed within the total estimated value.

38 Appendix 5
Table A5.3: Cost of CERM Component (US $ Million) Site Site wise
Allocation Actual Expenditure
Bar-Reff 0.19 0.65 Negombo 1.81 4.00 Lunawa 1.63 1.40 Maduganga 0.31 0.56 Hikkaduwa 0.14 0.00 Habaraduwa 0.16 0.27 Mawella 0.46 0.77 Kalametiya 0.93 0.32 Total 5.63 7.97
Source: Project management office 17. Benefits of CERM investments are derived from the difference between the values of resource use with the project and the non-sustainable resource use without the project. It is assumed that the non-sustainable use without the project will lead to an annual loss of the habitat/resource value. Depending on the site, benefits include sustainable utilization of coastal vegetative products and fisheries, sustainable recreation use, and ecotourism benefits associated with the preservation of mangrove, wetland and reef biodiversity. Additional non-quantified benefits include such things as protection of scarce turtle nesting habitats, health cost savings due to improved environment, and increased amenity and property values. 18. At the appraisal all the interventions under CERM component were planned to be completed within the first two years of the project. However, the life cycle of the outputs were considered up to 2020. Since the implementation of planned interventions under the component was delayed up to 2005, the life cycle of the project is considered up to increased 2025 in keeping with original assumption. 19. EIRR of whole CERM Component is estimated to 21.5%. At appraisal, this was estimated as 20.6% and at midterm review it was re-estimated to 16%. Lower cost of civil works (than estimated) and reconsidered life of the project are the main reasons for improvement in EIRR.
3. Fisheries Harbor Component 20. Three fisheries harbors were constructed at Hambantota, Chilaw and Ambalangoda. Fishery harbors included harbor offices and quarters, community halls and canteens, fish auction halls, fish-net mending halls, toilets, security huts, paved access roads and parking facilities. The provision of such facilities will result in improved fish quality, and improved environment. Since operations at the Chilaw harbor are often disrupted due to formation of the sand bar at the Chilaw lagoon mouth, a 370 HP dredger and a fiber glass boat were purchased for the Ceylon Fishery Harbors Corporation. Under this component, some renovations and improvements in Kudawella, Mirissa, Galle, Hikkaduwa, Beruwala, Kalpitiya, Puranawella and Moratuwa-Panadura fishery harbors were also carried out. 21. Total cost of this component at completion is $11 million and detailed in Table A5.4.

Appendix 5 39
Table A5.4: Cost of Fisheries Harbors (US$ Million)
Civil Works Show Facilities Dredger Total Chilaw 1.24 0.67 1.48 3.39Hambantota 3.15 0.53 3.68Ambalangoda 4.08 0.29 4.37 8.47 1.49 1.48 11.44Source: Project management office 22. The benefits from harbors are derived from the incremental fish catch resulting from increased number of trips per boat. Fishermen could also use multi-day boats. The analysis considered incremental fish catch resulting from increased trips. 23. At appraisal, all the civil works of fisheries harbor component were planned to be completed within the first three years of the project; 2000 to 2002. The life cycle was considered up to 2020. Since the completion of civil works of the component was delayed up to 2005, the life cycle of the project is considered up to 2027. 24. EIRR of entire fisheries harbor component was estimated as 18.3%. At the appraisal, EIRR of the proposed project component to construct two fisheries harbors at Hambantota and Chillaw together with two anchorages in Kalamatiya and Ambalangoda was estimated as 12.1%. In the midterm review, the EIRR for the construction of three harbors was estimated as 14.9% and it was suggested the design of Ambalangoda fisheries habour be re-designed, so that the cost of construction can be met with the available capital for the component. The revised cost effective design is one of the main factors for the increased EIRR of the whole component.
4. Overall Project 25. Analysis for overall project was carried out by combining cost and benefit streams of above three components. Cost of the whole project include costs of above three components, cost of institutional strengthening and cost of the project management office. 27. Quantifiable benefits derived from above three components were considered as the total benefit of the project. With the inclusion of the non quantified benefits from institutional strengthening and other components, the actual benefit will be higher. 28. At appraisal, the overall EIRR was estimated at 15.3% and at midterm it was re-estimated as 15.9%. At completion, the EIRR is estimated as 18.6% resulting from reduced cost of civil work of some components. 29. A sensitivity analysis was carried out to analyze the possible impact on EIRR with two adverse scenarios of 10% and 20% reductions in benefits and also to understand possible increase in EIRR with 10% and 20% increase in benefits. According to the sensitivity analysis, 10% reduction in expected benefits will reduce the EIRR to 16.9%, while a 20% reduction of benefits reducing it to 15.1%. On the other hand, 10% increase in benefits can improve EIRR up to 22.5 % while 20% increase in benefits being able to improve it up to 24.3%.

40 Appendix 5
Table A5.5: Economic Costs and Benefits of Coastal Stabilization Component (SLRs million)
Year
Maha Oya - Lansigama
Kalu Ganga - Maggona Colombo North
Wadduwa - Kalutara
Total Project Without Tourism
Benefits With Tourism
Benefits
Total Cost
Net Incremental
Benefit Total Cost
Net Incremental
Benefit Total Cost
Net Incremental
Benefit Total Cost
Net Incremental
Benefit Total Cost
Net Incremental
Benefit Total Cost
Net Incremental
benefit
With
Project Without Project
With Project
Without Project
With Project
Without Project
With Project
Without Project
With Project
Without Project Benefits
2001 61.81 55.32 26.88 33.19 16.72 16.60 3.93 5.53 109.34 (4.22) 109.34 (4.22) 2002 206.76 110.64 89.91 49.79 55.92 24.90 13.16 8.30 365.75 (172.12) 365.75 (172.12) 2003 676.82 127.24 294.31 66.39 183.05 33.19 43.07 11.06 1197.25 (950.94) 1197.25 (950.94) 2004 478.98 146.33 208.28 73.03 129.54 36.51 30.48 12.17 847.28 (564.29) 847.28 (564.29) 2005 1171.79 168.28 509.55 80.33 316.92 40.16 74.57 13.39 2072.83 (1751.86) 2072.83 (1751.86) 2006 0.00 193.52 0.00 88.36 0.00 44.18 0.00 14.73 0.00 360.64 0.00 790.53 2007 0.00 222.55 0.00 97.20 0.00 48.60 0.00 16.20 0.00 405.44 0.00 835.32 2008 0.00 255.93 0.00 106.92 0.00 53.46 0.00 17.82 0.00 456.06 0.00 885.94 2009 155.54 294.32 60.49 117.61 34.57 58.80 10.16 19.60 260.77 252.54 260.77 682.42 2010 155.54 338.46 60.49 129.37 34.57 64.68 10.16 21.56 260.77 317.32 260.77 747.21 2011 155.54 338.46 60.49 129.37 34.57 64.68 10.16 21.56 260.77 318.36 260.77 748.25 2012 155.54 338.46 60.49 129.37 34.57 64.68 10.16 21.56 260.77 319.40 260.77 749.29 2013 155.54 338.46 60.49 129.37 34.57 64.68 10.16 21.56 260.77 320.44 260.77 750.32 2014 155.54 338.46 60.49 129.37 34.57 64.68 10.16 21.56 260.77 321.48 260.77 751.36 2015 155.54 338.46 60.49 129.37 34.57 64.68 10.16 21.56 260.77 322.52 260.77 752.40 2016 155.54 338.46 60.49 129.37 34.57 64.68 10.16 21.56 260.77 323.56 260.77 753.44 2017 155.54 338.46 60.49 129.37 34.57 64.68 10.16 21.56 260.77 324.59 260.77 754.48 2018 155.54 338.46 60.49 129.37 34.57 64.68 10.16 21.56 260.77 325.63 260.77 755.52 2019 155.54 338.46 60.49 129.37 34.57 64.68 10.16 21.56 260.77 326.67 260.77 756.55 2020 155.54 338.46 60.49 129.37 34.57 64.68 10.16 21.56 260.77 327.71 260.77 757.59 2021 155.54 338.46 60.49 129.37 34.57 64.68 10.16 21.56 260.77 328.75 260.77 758.63 2022 155.54 338.46 60.49 129.37 34.57 64.68 10.16 21.56 260.77 329.79 260.77 759.67 2023 (187.27) 338.46 (290.38) 129.37 (282.13) 64.68 10.16 21.56 (749.62) 1341.21 (749.62) 1771.09
EIRR 7.5% 7.6% 4.9% 9.5% 7.2% 18.5%

Appendix 5 41
Table A5.6: Economic Costs and Benefits of Coastal Resources Management (CERM) Component (SLRs million)
Year
Bar_Reef Negombo lagoon Lunawa lagoon Maduganga Unawatuna Kalametiya Mawella Total CERM
Total Economic
Costs
Net Economic Benefits
Total Economic
Costs
Net Economic Benefits
Total Economic
Costs
Net Economic Benefits
Total Economic
Costs
Net Economic Benefits
Total Economic
Costs
Net Economic Benefits
Total Economic
Costs
Net Economic Benefits
Total Economic
Costs
Net Economic Benefits
Total Economic
Costs
Net Economi
c Benefits
2001 0.53 (0.53) 3.25 (3.25) 1.14 (1.14) 0.45 (0.45) 0.22 (0.22) 0.26 (0.26) 0.62 (0.62) 6.47 (6.47) 2002 0.26 (0.26) 1.62 (1.62) 0.57 (0.57) 0.23 (0.23) 0.34 (0.34) 0.13 (0.12) 0.31 (0.31) 4.52 (4.51) 2003 0.16 (0.08) 0.99 (0.99) 0.35 (0.35) 0.14 0.00 0.07 0.27 0.08 (0.02) 0.19 0.08 3.03 (1.47) 2004 1.56 (1.40) 9.57 (6.09) 3.35 (3.35) 1.34 0.30 0.65 0.03 0.77 (0.66) 1.84 (1.30) 20.12 (13.53) 2005 1.87 (1.63) 11.53 (4.57) 4.03 (0.97) 1.61 0.84 0.78 0.23 0.92 (0.77) 2.22 (1.40) 24.03 (9.33) 2006 3.95 (3.64) 24.34 (13.91) 8.52 (2.38) 3.41 (0.13) 1.64 (0.29) 1.95 (1.75) 4.68 (3.59) 49.55 (26.75)
2007 18.11 (17.72) 111.47 (97.56) 39.01 (29.81) 15.61 (11.52) 7.52 (5.84) 8.92 (8.67) 21.46 (20.09) 223.16 (192.27
)
2008 13.47 (13.00) 82.92 (65.54) 29.02 (16.75) 11.61 (6.70) 5.60 (3.57) 6.63 (6.34) 15.96 (14.32) 166.28 (127.28
) 2009 0.00 1.12 0.00 20.86 0.00 30.68 0.00 5.73 0.00 2.36 0.00 0.34 0.00 1.91 0.00 62.99 2010 0.00 1.28 0.00 24.34 0.00 36.81 0.00 6.54 0.00 2.70 0.00 0.39 0.00 2.18 0.00 74.24 2011 0.00 1.44 0.00 27.81 0.00 42.95 0.00 7.36 0.00 3.04 0.00 1.98 0.00 2.46 0.00 87.04 2012 0.00 1.60 0.00 31.29 0.00 49.08 0.00 8.18 0.00 3.37 0.00 2.20 0.00 2.73 0.00 98.46 2013 0.00 1.75 0.00 34.77 0.00 55.22 0.00 9.00 0.00 3.71 0.00 2.42 0.00 3.00 0.00 109.88 2014 0.00 1.91 0.00 38.24 0.00 61.35 0.00 9.82 0.00 4.05 0.00 2.64 0.00 3.28 0.00 121.30 2015 0.00 2.07 0.00 41.72 0.00 67.49 0.00 10.63 0.00 4.39 0.00 2.86 0.00 3.55 0.00 132.72 2016 0.00 2.23 0.00 45.20 0.00 73.62 0.00 11.45 0.00 4.72 0.00 3.08 0.00 3.82 0.00 144.14 2017 0.00 2.39 0.00 48.67 0.00 79.76 0.00 12.27 0.00 5.06 0.00 3.30 0.00 4.10 0.00 155.55 2018 0.00 2.55 0.00 52.15 0.00 85.89 0.00 13.09 0.00 5.40 0.00 3.52 0.00 4.37 0.00 166.97 2019 0.00 2.71 0.00 55.63 0.00 92.03 0.00 13.91 0.00 5.74 0.00 3.74 0.00 4.64 0.00 178.39 2020 0.00 2.87 0.00 59.10 0.00 98.16 0.00 14.72 0.00 6.07 0.00 3.96 0.00 4.92 0.00 189.81 2021 0.00 3.03 0.00 62.58 0.00 104.30 0.00 15.54 0.00 6.41 0.00 4.18 0.00 5.19 0.00 201.23 2022 0.00 3.19 0.00 66.06 0.00 110.44 0.00 16.36 0.00 6.75 0.00 4.40 0.00 5.46 0.00 212.65 2023 0.00 3.35 0.00 69.53 0.00 116.57 0.00 17.18 0.00 7.09 0.00 4.62 0.00 5.74 0.00 224.07 2024 0.00 3.51 0.00 73.01 0.00 122.71 0.00 18.00 0.00 7.42 0.00 4.84 0.00 6.01 0.00 235.49 2025 0.00 3.67 0.00 76.49 0.00 128.84 0.00 18.81 0.00 7.76 0.00 5.06 0.00 6.28 0.00 246.91 0.5% 15.1% 43.4% 33.3% 27.2% 9.8% 4.7% 21.5%

42 Appendix 5
Source: Asian Development Bank estimates
Table A5.7: Economic Costs and Benefits of Fisheries Harbors Component (SLRs Million)
Hambantota Chilaw Ambalangoda Total Fisheries harbor component
Total Economic
Cost
Net Economic
Benefit
Total Economic
Cost
Net Economic
Benefit
Total Economic
Cost
Net Economic
Benefit Other costs
Total Economic
Cost Net Economic
Benefit 2005 45.99 (45.99) 44.74 (44.74) 57.56 (57.56) 59.76 208.04 (208.04)2006 60.63 (60.63) 55.21 (55.21) 75.57 (75.57) 153.58 345.00 (345.00)2007 250.40 (250.40) 229.94 (229.94) 313.25 (313.25) 153.58 947.18 (947.18)2008 154.74 (154.74) 141.95 (141.95) 193.22 (193.22) 153.58 489.91 (489.91)2009 3.41 9.43 2.72 90.60 3.41 39.94 9.54 139.98 2010 3.41 67.59 2.72 124.42 3.41 101.72 9.54 293.73 2011 5.04 126.09 4.83 191.77 5.04 196.76 14.91 514.62 2012 3.41 152.18 2.72 201.13 3.41 222.85 9.54 576.16 2013 3.41 152.18 2.72 201.13 3.41 222.85 9.54 576.16 2014 3.41 152.18 2.72 201.13 3.41 222.85 9.54 576.16 2015 5.04 150.55 4.83 199.02 5.04 221.22 14.91 570.79 2016 3.41 152.18 2.72 201.13 3.41 222.85 9.54 576.16 2017 3.41 152.18 2.72 201.13 3.41 222.85 9.54 576.16 2018 3.41 152.18 2.72 201.13 3.41 222.85 9.54 576.16 2019 5.04 150.55 4.83 199.02 5.04 221.22 14.91 570.79 2020 3.41 152.18 2.72 201.13 3.41 222.85 9.54 576.16 2021 3.41 152.18 2.72 201.13 3.41 222.85 9.54 576.16 2022 3.41 152.18 2.72 201.13 3.41 222.85 9.54 576.16 2023 5.04 150.55 4.83 199.02 5.04 221.22 14.91 570.79 2024 3.41 152.18 2.72 201.13 3.41 222.85 9.54 576.16 2025 3.32 152.27 2.72 201.13 3.32 222.94 9.36 576.34 2026 3.32 152.27 0.90 465.10 3.32 222.94 7.54 840.30 2027 3.32 152.27 0.90 465.10 3.32 222.94 7.54 840.30
EIRR 18.0% 26.7% 21.0% 18.3%Source: Asian Development Bank estimates

Appendix 5 43
Table A5.8: Economic Costs and Benefits of whole Coastal Resources Management Project (SLRs million)
Year
Coastal Stabilization Coastal Environmental
Resources Management Fisheries Harbor
Total Without Tourism
Benefits With Tourism Benefits Without Tourism
Benefits With Tourism
Benefits Total
Economic Cost
Net Economic
Benefit
Total Economic
Cost
Net Economic
Benefit
Total Economic
Cost
Net Economic
Benefit
Total Economi
c Cost
Net Economic
Benefit
Total Economic
Cost
Net Economic
Benefit
Total Economi
c Cost
Net Economic
Benefit 2001 109.34 (4.22) 109.34 (4.22) 6.47 (6.47) 115.80 (10.69) 115.80 (10.69) 2002 365.75 (172.12) 365.75 (172.12) 4.52 (4.51) 370.27 (176.64) 370.27 (176.64) 2003 1197.25 (950.94) 1197.25 (950.94) 3.03 (1.47) 1200.28 (952.41) 1200.28 (952.41) 2004 847.28 (564.29) 847.28 (564.29) 20.12 (13.53) 867.41 (577.82) 867.41 (577.82)
2005 2072.83 (1751.86) 2072.83 (1751.86) 24.03 (9.33) 208.04 (208.04) 2304.90 (1969.23) 2304.90 (1969.23) 2006 0.00 360.64 0.00 790.53 49.55 (26.75) 345.00 (345.00) 394.55 (11.11) 394.55 418.78 2007 0.00 405.44 0.00 835.32 223.16 (192.27) 947.18 (947.18) 1170.34 (734.01) 1170.34 (304.13) 2008 0.00 456.06 0.00 885.94 166.28 (127.28) 489.91 (489.91) 656.18 (161.13) 656.18 268.75 2009 260.77 252.54 260.77 682.42 0.00 62.99 9.54 139.98 270.30 455.51 270.30 885.39 2010 260.77 317.32 260.77 747.21 0.00 74.24 9.54 293.73 270.30 685.30 270.30 1115.18 2011 260.77 318.36 260.77 748.25 0.00 87.04 14.91 514.62 275.68 920.02 275.68 1349.90 2012 260.77 319.40 260.77 749.29 0.00 98.46 9.54 576.16 270.30 994.02 270.30 1423.90 2013 260.77 320.44 260.77 750.32 0.00 109.88 9.54 576.16 270.30 1006.48 270.30 1436.36 2014 260.77 321.48 260.77 751.36 0.00 121.30 9.54 576.16 270.30 1018.94 270.30 1448.82 2015 260.77 322.52 260.77 752.40 0.00 132.72 14.91 570.79 275.68 1026.02 275.68 1455.90 2016 260.77 323.56 260.77 753.44 0.00 144.14 9.54 576.16 270.30 1043.85 270.30 1473.74 2017 260.77 324.59 260.77 754.48 0.00 155.55 9.54 576.16 270.30 1056.31 270.30 1486.19 2018 260.77 325.63 260.77 755.52 0.00 166.97 9.54 576.16 270.30 1068.77 270.30 1498.65 2019 260.77 326.67 260.77 756.55 0.00 178.39 14.91 570.79 275.68 1075.85 275.68 1505.74 2020 260.77 327.71 260.77 757.59 0.00 189.81 9.54 576.16 270.30 1093.69 270.30 1523.57 2021 260.77 328.75 260.77 758.63 0.00 201.23 9.54 576.16 270.30 1106.14 270.30 1536.03 2022 260.77 329.79 260.77 759.67 0.00 212.65 9.54 576.16 270.30 1118.60 270.30 1548.49 2023 (749.62) 1341.21 (749.62) 1771.09 0.00 224.07 14.91 570.79 (734.70) 2136.07 (734.70) 2565.95 2024 0.07 0.00 0.00 0.00 0.00 235.49 9.54 576.16 9.61 811.65 9.54 811.65 2025 0.00 0.00 0.00 0.00 0.00 246.91 9.36 576.34 9.36 823.25 9.36 823.25 2026 0.00 0.00 0.00 0.00 0.00 0.00 7.54 840.30 7.54 840.30 7.54 840.30 2027 0.00 0.00 0.00 0.00 0.00 7.54 840.30 7.54 840.30 7.54 840.30
EIRR 7.2% 18.5% 21.5% 18.3% 12.2% 18.6% Source: Asian Development Bank estimates

44 Appendix 5
Table A5.9: Sensitivity Analysis
Sensitivity Analysis Component EIRR at
Completion Benefit
Decrease by 10%
Benefit Decrease by
20%
Benefit Increase by
10%
Benefit Increase by
20%
Coastal Stabilization - without tourism benefit 7.2% 6.0% 4.7% 8.3% 9.3%
Coastal Stabilization - with tourism benefit 18.5% 16.7% 14.7% 23.6% 25.5%Coastal Environmental Resources Management 21.5% 20.0% 18.3% 24.3% 24.3%Fisheries harbors 18.3% 16.8% 15.2% 19.7% 21.0%
Total project - without tourism benefit 12.2% 10.9% 9.6% 13.4% 14.5%
Total project - with tourism benefit 18.6% 16.9% 15.1% 22.5% 24.3% Source: Asian Development Bank estimates

45 Appendix 6
PROJECT SCHEDULE
Components and Activities
Coastal Stabilization Component Mahaoya Lansigama Colombo North Dickowita Wadduwa Kalutara ganga_Maggona (Payagala)
Planning Interventions
Chilaw Harbor Hambantota
Ambalangoda
Source: Project Management Unit
ProjectedActual
Coastal Environmental and Resources Management
Fisheries Management and Quality Improvement
Institutional DevelopmentConsultants Inputs
2001 2002 2003 20042000
Proposed and Actual Implementation Schedule
Year 2 'Year' 1 Year 6 Year 7 Year 82008 2009
Year 3 Year 42005
Project Extension
Year 520072006

46 Appendix 7
PROJECT IMPLEMENTATION ARRANGEMENT
Coastal Environment and
Resource Management Component
Consultant Team (lead by a Team Leader) Field Project Implementation Staff
Coastal Stabilization Component
Consultant Team (lead by a Team Leader) Staff from Coast Conservation Department Field Staff
Fisheries Resource
Management and Quality
Improvement Component
Consultant Team (lead by a Team Leader)
Institutional Strengthening Component
Consultant Team (lead by a Team Leader)
Project Management Office Finance Division Monitoring and Evaluation
Ministry of Fisheries and Aquatic Resources
Development
Steering Committee
Coast Conservation Department Fishery Harbors Corporation
Project Director
Project Implementation Unit Manager
Project Implementation Unit Manager
Project Implementation Unit
Manager
Project Implementation Unit Manager

Appendix 8 47
STATUS OF COMPLIANCE WITH LOAN COVENANTS
Covenant Status 1. Institutional Reforms: (a) reconstitution of the Coast Conservation Advisory Council under the Ministry of Fisheries and Aquatic Resources and Development (MFARD) within 12 months of Loan Effective Date; (Schedule 6, para 17)
Partly complied. Recommending body in existence but not functioning as a policy body.
2. Phasing out of Coast Conservation Department's (CCD) physical construction work using private contractors by the end of project implementation in 2005; (Schedule 6, para 17)
Private sector contracts were used in many of its regular works.
3. Establishment of a Planning and Monitoring Division (PMD) at MFARD by December 2000 and made operational by December 2002; (Schedule 6, para 17)
Staff resources assigned to improve the effectiveness of the PMD.
4. Establishment of a Data Collection and Management System in MFARD by 2001 to become fully operational by December 2002; (Schedule 6, para 17)
IT network is completed and operational.
5. Establishment of a new Central Extension Unit (CEU) within MFOR by December 2001.(Schedule 6, para 18)
CEU established but all staff are not in place.
6. Legislative Reforms under the proposed Coast Conservation Act and proposed Fisheries and Aquatic Resources Act shall be completed as soon as possible, within not more than one year of Loan Effective Date. (Schedule 6, para 18)
Coast Conservation Act amended. New Fishery Act awaiting cabinet approval.
7. Borrower shall actively explore alternatives to abolish river sand mining and maintain (i) its ban on the use of coral reef-based lime in Government construction, (ii) regulation of river sand mining in the coastal zone. (Schedule 6, para 21)
River and sand mining restricted and sea sand mining is being commercialized. Follow-up is required to assess the effectiveness of these agreed measures.
8. All fishing harbors and anchorages are provided with solid waste management system, oil waste collection system, and adequate sanitation facilities; and ensure that the effluent from fishery activities meet the Borrower's environmental laws and regulations and ADB's Guidelines. (Schedule 6, para 28 (a))
New harbors incorporate facilities for waste management.
9. Sand extraction are carried out in deep sea areas, at least beyond 8 km offshore, the dredging limited to 2 meters below the existing level at depth equal to or greater than 15 meters below the mean sea level, to avoid hydraulic and geotechnical problems. (Schedule 6, para 28 (b))
Complied with.
10. Environmental investigation for the Coastal Stabilization component, harbors and anchorages shall be undertaken, and the relevant statutory clearances obtained prior to implementation of works under the component. (Schedule 6, para (c))
Complied with.
11. All environmental mitigation measures identified in the Environmental Impact Act report are followed during construction, operation and maintenance of the project
Complied with.

48 Appendix 8
Covenant Status facilities and lay emphasis on community-based special area management planning approach to be adopted to protect wetlands and lagoons in the project area. (Schedule 6, para 29) 12. MFARD shall establish close working arrangements with NGOs at the project sites. The criteria for selection of NGOs shall be in consultation with ADB and in accordance with the Government's standard procedures.(Schedule 6, para 22)
An active collaboration with NGOs took place during implementation.
13. Special emphasis shall be placed on the poor including women. Women shall be mobilized to play effective role in household income generation through accessing credit, management of fisheries and coastal resource conservation. (Schedule 6, para 23)
Women played effective role in the project and was part of the community coordinating committees.
14. All agencies involved in project implementation shall prepare and maintain separate accounts for project-related disbursements; and for this purpose to strengthen the accounting and auditing capabilities of MFARD. (Schedule 6, para 24 (a))
Complied with
15. The process of cost recovery through levy of berthing charges shall be extended to the fishing harbors and anchorages, and shall be monitored and reported to ADB on an annual basis. (Schedule 6, para 12)
Process of cost recovery is not implemented in full because fishermen refused to pay. Action plan prepared by consultant have not been implemented. This requires further follow up.
16. Borrower shall phase out the subsidies for fishing boats progressively by reducing the subsidies by 15 percent annually for coastal and offshore boats and restrict the subsidy to only offshore vessels after 2002. (Schedule 6, para 15)
Partially complied with.
CCD=coast conservation department'; CEU=central extension unit; MFARD= ministry of fisheries and aquatic resources and development; PMD=planning and monitoring division Source: Asian Development Bank estimates