Embed Size (px)
Citation preview
P O S I V A O Y
FI -27160 OLKILUOTO, F INLAND
Tel +358-2-8372 31
Fax +358-2-8372 3709
Ursu la S ievänen
Pau la Ra iv io
U l l a Vuor inen
Johanna Hansen , Juhan i Noroka l l i o
Pau l i Sy r j änen
November 2006
Work ing Repor t 2006 -85
Optimisation of Technical Properties ofLow pH Cementitious Injection Grout
Laboratory Tests and Pilot Field Test 3
November 2006
Working Reports contain information on work in progress
or pending completion.
Ursu la S ievänen
Pöyry I n f r a Oy
Pau la Ra iv io
Contes ta Oy
Ul la Vuor inen
VTT P rosesses
Johanna Hansen , Juhan i Noroka l l i o
Pos iva Oy
Pau l i Syr jänen
Gr idpo in t F in l and Oy
Work ing Report 2006 -85
Optimisation of Technical Properties ofLow pH Cementitious Injection Grout
Laboratory Tests and Pilot Field Test 3
ABSTRACT
Posiva, SKB and NUMO co-operated in developing low-pH (pH<11 in the leachate)
grouts for deep repositories 2002 2005. The development of low-pH cementitious
grouts for fractures > 100 μm was done in Finland. The non-cementitious low-pH
grouts for fractures < 100 μm were studied in Sweden. Several cementitious binder
material combinations were studied within the project. The most promising and suitable
system was Portland cement + microsilica. The targets with regard to the main
properties (pH and penetration ability) were reached, but all technical properties were
not satisfying. Superplasticizers were avoided, but it turned out that in order to reach the
acceptable technical properties together with low pH, superplasticizers were necessary
to decrease water/dry material-ratio and fasten the early age strength development.
Posiva continued the optimisation of Portland cement + microsilica + superplasticizer –
mixes within the LPHTEK-project during 2005. The work comprised laboratory studies,
two batch mixing tests in field conditions, the third pilot field test and monitoring of the
test area.
The objective of the laboratory tests was to improve the properties of the mix P3
developed in earlier stage. The superplasticizer was changed to one which is considered
less harmful with respect to the long-term safety. The water/dry material-ratio and the
contents of microsilica and superplasticizer were varied and the behaviour of the mixes
was observed under cooled circumstances (12 ºC) and at room temperature. Several
mixes showed promising results and one mix, P308B (SF/PC=0.69, naphtalene
sulphonate SPL 4%) met the targets, except that set to yield stress. Technical tests
indicated that cement consignment, age of the cement, age of the microsilica, mixer type
and temperature affected on results, but it was not possible to study these in detail. The
improved composition of the mix stabilised the leachate pH-values with time as well as
somewhat lowered them; the observed pH in fresh AL-MR water was < 11 and in saline
OL-SR water < 10. The difference in the pH values were reflected in the released
alkaline elements; only KOH in OL-SR leachates while both KOH and Ca(OH)2 were
present in ALL-MR leachates. High ionic strength and the effect of common ions (Na
and Ca) in OL-SR and in cement pore water restrict the ionic behaviour. Based on leach
test results for mix f63 (base mix in developing mix P308B) the curing temperature
(20ºC or 50ºC) gives different pH values in the beginning of testing and those are
reflected in the amounts of released alkalies especially, as well.
Before the pilot field test 3, a batch mixing test was arranged in field conditions. A few
mixes were made with a full scale grouting mixer and tested for technical properties. All
mixes showed promising behaviour and mix P3080B met the targets. Two mixes
(P308B and P307B) were selected for the test grouting. In the pilot field test 3 arranged
in ONKALO access tunnel, one fan was grouted with test mixes. The sealing efficiency
was about 90% and small moist areas and minor leakages were observed after grouting.
Testing of technical properties showed practical problems due to testing conditions and
device failure. A second batch mixing test was arranged in order to verify the properties.
Marsh fluidity, bleeding and early age shear strengths were satisfying for P308B.

After excavation one borehole was drilled in the pilot field test 3 area through the
grouted zone, and groundwater sampling was carried out. As expected, pH decreases
more efficiently in low pH grout environment than in the case with ordinary cement
Keywords: grouting, grout, low pH (pH <11), penetration ability, Marsh fluidity, early
age shear strength, compressive strength, ONKALO, final disposal of spent nuclear
fuel, control of water inflow, tunnelling

TIIVISTELMÄ
Posiva, SKB ja NUMO kehittivät matalan pH:n (uutteen pH<11) injektointiaineita
ydinjätteen loppusijoitustilojen injektointiin vuosien 2002–2005 aikana. Yli 100 μm
rakojen injektointiin tarkoitettujen sementtipohjaisten massojen kehitystyö suoritettiin
Suomessa. Ruotsissa kehitettiin injektointiaineita alle 100 μm rakoihin.
Sementtipohjaisten injektointimassojen osalta tutkittiin useita sideainekombinaatioita.
Sopivimmaksi ja lupaavimmaksi sideainekombinaatioksi osoittautuivat Portland
sementti + mikrosilika pohjaset massat. Tavoitteet pääominaisuuksien (pH ja
tunkeutumiskyky) suhteen saavutettiin, mutta kaikki tekniset ominaisuudet eivät olleet
tyydyttäviä. Vaikka notkistimia pyrittiin välttämään, todettiin ne toistaiseksi
välttämättömiksi. Massojen vesi/kuiva-ainesuhde tuli saada riittävän pieneksi
halutunlaiseen lujuudenkehitykseen pääsemiseksi.
Posiva Oy jatkoi Portland sementti + mikrosilika + notkistin massojen optimointia
LPHTEK-projektin puitteissa vuonna 2005. Työ sisälsi laboratoriotutkimuksia, kaksi
kenttäolosuhteissa tehtyä sekoituskoetta, kolmannen pilottikenttäkokeen ja koealueen
monitorointia.
Laboratoriotyön tavoitteena oli parantaa aiemmin kehitetyn reseptin P3 ominaisuuksia.
Notkistin vaihdettiin toiseen, joka on nykytietämyksen mukaan pitkäaikais-
turvallisuutensa puolesta turvallisempi. Massan vesi/kuiva-ainesuhdetta, mikrosilikan ja
notkistimen määrää varioitiin ja massan käyttäytymistä tutkittiin jäähdytetyissä
olosuhteissa (12 ºC) ja huoneen lämpötilassa. Useat massat vaikuttivat lupaavilta ja yksi
massa, P308B (SF/PC=0.69, naftaleenisulfonaattinotkistin 4 %) oli tavoitteen mukainen
lukuun ottamatta myötöraja-arvoa. Teknisten testien perusteella vaikutti siltä, että
sementtierällä ja -iällä, mikrosilikan iällä, laboratoriosekoittimella ja lämpötilalla on
vaikutus tuloksiin. Näitä ei kuitenkaan tässä vaiheessa kyetty tarkemmin tutkimaan.
Massojen aiempaa parempi koostumus tasoittaa uutteiden pH-arvojen kehittymisen ajan
myötä ja jossain määrin alentaa pH:ta; makeammassa AL-MR-vedessä pH oli < 11 ja
suolaisemmassa OL-SR-vedessä < 10. Uuttovesien erilaiset pH-arvot heijastuivat myös
vesianalyysien tuloksissa; OL-SR veteen uuttui vain KOH kun taas AL-MR uutteessa
oli läsnä sekä KOH että Ca(OH)2. OL-SR veden korkeampi ionivahvuus ja yhteiset
ionit (Na ja Ca) sementin huokosveden kanssa rajoittavat uuttumista. Aikaisemmin
uuttotestatun massan f63 (josta kehitettiin P308B massa) kahdessa eri lämpötilassa
kovetettujen näytteiden uuttovesien analyysitulokset osoittivat, että kovettumislämpötila
(20 °C tai 50 °C) aiheuttaa uuttotestin alussa erilaisen pH käyttäytymisen, joka heijastuu
myös erityisesti vapautuvien alkalien määrissä.
Ennen pilottikenttäkoetta järjestettiin sekoituskoe, jossa muutama lupaavin resepti
sekoitettiin täyden mittakaavan sekoittimella ja eräät tekniset ominaisuudet testattiin
kenttäolosuhteissa. Tulosten perusteella valittiin kaksi parasta reseptiä pilotti-
kenttäkokeeseen (P308B ja P307B). Kaikkien massojen tulokset olivat lupaavia ja
massa P308B:n tulokset olivat tavoitteiden mukaisia. ONKALOn ajotunnelissa tehdyssä
pilottikenttäkoe 3:ssa yksi injektointiviuhka injektoitiin kahdella lupaavimmalla
laboratoriossa kehitetyllä massalla (P308B ja P307B). Injektointi vaikutti onnistuneelta;
noin 90 % vuodoista saatiin tiivistettyä ja pieniä kosteita alueita ja tippoja jäi

testialueelle. Massojen teknisten ominaisuuksien testaamisessa oli ongelmia
koeolosuhteiden ja laiterikkojen vuoksi. Pilottikenttäkoe 3:n jälkeen järjestettiin
ylimääräinen sekoituskoe, jonka tarkoituksena saada varmentavat tulokset massojen
teknisistä ominaisuuksista. P308B:n Marsh-juoksevuus, veden erottuminen ja
varhaislujuus olivat tavoitteen mukaisia.
Louhinnan jälkeen pilottikenttäkoealueelle kairattiin reikä injektoidun vyöhykkeen läpi,
ja reiästä otettuja pohjavesinäytteitä tutkittiin. pH laski nopeammin matalan pH:n
sementin ympäristössä verrattuna tavanomaisen sementin ympäristöön.
Avainsanat: injektointi, injektointiaine, matala pH (pH <11), tunkeutuvuus, Marsh-
juoksevuus, vedenerottuminen, varhaislujuus, puristuslujuus, ONKALO, käytetyn
ydinpolttoaineen loppusijoitus, vuotovesien hallinta, kalliorakentaminen

PREFACE
Since 2005 the further optimisation of low pH cementitious grout has been coordinated
by the LPHTEK project, which is responsible for developing and implementation of low
pH grouts during the construction of ONKALO access tunnel. This report presents the
work done and results achieved during 2005.
The LPHTEK project group consisted of project manager Tapani Lyytinen (ELY
Management Oy), Margit Snellman (Saanio & Riekkola), Ursula Sievänen (Pöyry Infra
Oy) and project responsible and customer contact Johanna Hansen (Posiva Oy).
The LPHTEK project group planned the laboratory studies together with geologist
Paula Raivio (Contesta Oy), who was responsible for testing the technical properties of
mixes. Batch mixing tests and pilot field test 3 were carried out by the project group,
ONKALO grouting designer and ONKALO contractor Kalliorakennus Oy. Leaching
tests and rheology measurements were done at the Technical Research Centre of
Finland. NES tests were carried out at Cementa’s cement factory in Degerhamn in
Sweden.
The LPHTEK project group took part in evaluating the results and contributing to this
report. The following persons have mainly contributed to this report: Chapters 1, 3,
partly Chapter 7, 8 and partly 9 Ursula Sievänen from Pöyry Infra Oy; Chapter 2, 4 and
5 Paula Raivio from Contesta Oy; Chapter 6 Ulla Vuorinen from VTT PRO; partly
chapter 7 Pauli Syrjänen from Gridpoint Finland Oy; Section 7.4.8 Juhani Norokallio
from Posiva; Chapter 7.7 Margit Snellman from Saanio & Riekkola Oy and partly
Chapter 9 Johanna Hansen from Posiva Oy. Conclusions present the opinion of the
project group. Ursula Sievänen has compiled this report.


1
TABLE OF CONTENTS
ABSTRACT
TIIIVISTELMÄ
PREFACE
LIST OF ABBREVIATIONS ............................................................................................ 3
1 BACKGROUND ...................................................................................................... 5
2 MATERIALS ........................................................................................................... 9
3 OBJECTIVES ....................................................................................................... 11
4 METHODS FOR TESTING GROUT PROPERTIES............................................. 13
4.1 General ......................................................................................................... 13
4.2 Fluidity by Marsh funnel ................................................................................ 14
4.3 Fluidity by Flow table .................................................................................... 15
4.4 Bleeding ........................................................................................................ 15
4.5 Early strength development by fall cone ....................................................... 16
4.6 Penetration ability by penetrability meter in laboratory tests......................... 17
4.7 Penetration ability by filter pump in field tests............................................... 18
4.8 Compressive strength ................................................................................... 18
4.9 Rheology....................................................................................................... 19
4.10 NES test........................................................................................................ 19
4.11 Evaluation of the grouting result of the field test ........................................... 20
5 LABORATORY STUDIES..................................................................................... 21
5.1 Tasks ............................................................................................................ 21
5.2 Tested mix compositions .............................................................................. 21
5.3 Mixing and conditions for testing the grouting related properties.................. 24
5.4 Test results and remarks .............................................................................. 25
5.5 Comprehensive laboratory test results ......................................................... 27
5.6 Tests with alternative superplasticizers ........................................................ 29
5.7 NES test........................................................................................................ 30
5.8 Conclusions of laboratory tests..................................................................... 31
6 LEACH TESTING ................................................................................................. 33
6.1 Leach testing of mix p308B........................................................................... 33
6.2 Results on old mixes..................................................................................... 41

2
7 PILOT FIELD TEST 3 ........................................................................................... 45
7.1 General ......................................................................................................... 45
7.2 Grouting equipment ...................................................................................... 45
7.3 Batch mixing test 1 and selection of the mixes for pilot field test 3 ............... 46
7.4 Pilot field test 3 – test grouting...................................................................... 49 7.4.1 Site description.......................................................................................... 49 7.4.2 Water penetration tests and flowlog results in probe holes....................... 49 7.4.3 Plan for test grouting ................................................................................. 51 7.4.4 Results of technical tests of grout mixes................................................... 53 7.4.5 Drilling of the grout holes .......................................................................... 56 7.4.6 Results of the grouting .............................................................................. 56 7.4.7 Quality control ........................................................................................... 58 7.4.8 Geological mapping after excavation ........................................................ 58 7.4.9 Leakage water inflow after excavation ...................................................... 62
7.5 Batch mixing test 2........................................................................................ 64
7.6 Summary and conclusions of pilot field test 3............................................... 66
7.7 Observations from monitoring of the effect of the low-pH cement on groundwater chemistry ............................................................................................. 67
8 SUMMARY OF P308B MATERIAL PROPERTIES MEASURED IN THE LABORATORY AND IN THE FIELD............................................................................. 71
9 CONCLUSIONS.................................................................................................... 73
REFERENCES ............................................................................................................. 75
APPENDIX 1: RHEOLOGY RESULTS BY VTT ........................................................... 77
APPENDIX 2: LABORATORY RESULTS .................................................................... 81
APPENDIX 3: RESULTS OF BATCH MIXING TEST 1................................................ 89
APPENDIX 4: PROBE HOLE DRILLING LOG............................................................. 93
APPENDIX 5: FLOW LOG RESULTS PR0502 ............................................................ 95
APPENDIX 6: RESULTS OF TECHNICAL TESTS OF MIXES IN TEST GROUTING.................................................................................................................................... 101
APPENDIX 7: GROUTING HOLE DRILLING LOG .................................................... 103
APPENDIX 8: GROUTING LOG................................................................................. 107
APPENDIX 9: GROUTING PRESSURES, FLOW AND GROUT TAKE..................... 111
APPENDIX 10: CONTROL HOLE DRILLING LOG.................................................... 133
APPENDIX 11: RESULTS OF BATCH MIXING TEST 2............................................ 135

3
LIST OF ABBREVIATIONS
ALL-MR Leach solution, simulated fresh Allard water
bcrit Critical aperture for a grout to penetrate (all grout penetrates)
bmin Minimum aperture for a grout to penetrate
BMT Batch mixing test (1. or 2.)
DM Dry material (weight)
DOC Dissolved organic content
G Gypsum
GA GroutAid, commercial stabilised microsilica slurry
HAC High alumina cement
KTH Royal University of Technology, Stockholm, Sweden
M-SPL Melamine based superplasticizer
LAC Japanese low alkaline cement
LPHTEK Project concerning the optimising of technical properties of
low pH cement grout
NES Apparatus for measuring penetrability properties of a grout
NS-SPL Naphtalene sulphonate based superplasticizer
NUMO Nuclear Waste Management Organisation of Japan
OL-SR Leach solution, simulated saline Olkiluoto water
PC Portland cement
PCB-SPL Polycarboxylate superplasticizer
PFL Posiva’s flowlog device
PFT Pilot field test
POSIVA Nuclear waste management company in Finland
RH Relative humidity
RQD Rock Quality Designation
SF Silica Fume /microsilica / = silica component of commercial
product GroutAid
SKB Svensk Kärnbränslehantering AB
SPL Superplasticizer
SSC Supersulphate cement –system
T Temperature
TOC Total organic carbon
UF16 Ultrafin16, microfine sulphate resistant Portland cement
VTT Technical Research Centre of Finland
W/DM Water to dry material ratio
WLM Water loss measurement (Lugeon-test)
wt-% Weight-%
vol-% Volume-%

4

5
1 BACKGROUND
SKB, Posiva and NUMO carried out a project “Low-pH injection grout for deep
repositories” during 2003-2005. The project was established and outlined based on the
outcome of the earlier feasibility study. The development work was divided so that
Posiva was responsible for developing a low pH cementitious grout for fractures with an
aperture over 100 μm and SKB was responsible for the development of a low pH non
cementitious grout for fractures with an aperture less than 100 μm. The project
concentrated on the technical development of properties for the low pH grouts;
long-term safety aspects, environmental acceptance and durability of materials were
preliminarily considered. The whole project “Low pH injection grout for deep
repositories” is reported by Bodén & Sievänen (2005).
The development of the low-pH cementitious grout consisted of several tasks. First the
requirements for the materials were set. The potential systems were selected and the
technical properties of some two hundred recipes were tested. The most promising
recipes were then tested for pH and leaching behaviour. Based on the results, the most
promising recipes were tested in pilot field-tests (PFTs) in Finland.
The development of the technical performance of the grouts was done by Kronlöf
(2005a). The tested binder-material systems were named Portland Cement + Silica
Fume (=microsilica) –system (PC+SF), Blast furnace slag –system, Super sulphate
cement –system, Japanese Low alkali cement –system and Fly ash –system. In this stage
superplasticizers (SPLs) were avoided. The grouting related properties tested in the
laboratory were penetrability, bleeding, early age shear strength viscosity and yield
value. For some mixes Marsh fluidity and uniaxial compressive strength were also
measured. The pH and leaching properties were studied by Vuorinen et al. (2005). The
methods for testing pH and leaching behaviour were the so-called “equilibrium test” and
“diffusion test”. In those tests the groundwater conditions (fresh ALL-MR and saline
OL-SR) were simulated by varying the composition of the leach solutions.
During the project all other systems except PC+SF were ruled out for different reasons.
Fly ash was ruled out in the early stage because there were problems with the
availability of material of uniform quality. LAC was ruled out due to poor penetrability
properties. At the late stage of the work Slag- and SSC-systems were ruled out due to
high leaching of sulphide from materials including slag.
A few PC+SF –mixes showed promising technical and leaching performance, these
mixes were named f63, f64, w1 and w2. Out of these f63 was selected to be tested in
PFT1 (Table 1-1). The properties of this mix, measured in the laboratory, are gathered
in Table 1-2. Mix f63 had good penetration ability.
Laboratory tests showed that the alkali content of the raw materials could not directly be
correlated to the measured pH of the leaching solutions. Minimum value for SF/PC ratio
in mixes based on PC+SF should be above 0.69 in order to yield pH 11 or lower. It was
also shown that the minimum content of SiO2 in mixes should be close to or above
50 wt % of total binder materials and Ca/Si molar ratio should be close to or less than

6
0.80 in order to reach the pH criteria, pH 11. The sum of CaO+MgO is an important
factor affecting the pH. It was also found that increasing W/DM improves penetration
ability of grouts but only up to the W/DM ratio of about 2. The penetration ability of
PC+SF mixes sharply became worse with W/DM below 2 but the penetration ability of
some slag mixes was relatively good down to a value of 1.6. Larger values still decrease
(improve) viscosity. Generally viscosity and yield values were unrelated to penetration
ability. The W/DM ratio controls strength development. Aluminium cement and/or
gypsum notably speeded up the PC+SF system. SF increases the strength in PC+SF
systems.
Mix f63 was tested in the PFT1 in Kamppi-Kruununhaka multipurpose tunnel (Sievänen
et al. 2005). Also two slag based mixes were tested, but later slag was ruled out. PFT1
showed that the PC+SF –system was too slow in field conditions (Table 1-2). There
were also problems in dosing of the components in the actual grouting work, and this
possibly partly affected on poor early age strength development. The sealing result was
not satisfying because regrouting was needed. SPL was regarded necessary in order to
decrease the W/DM-ratio and to speed up the development of strength and keep the
rheological properties satisfying at the same time. Further mix modification was
considered necessary.
Some tens of mix modifications with SPL were tested (Kronlöf 2005b). The mix f63
was further modified by changing the content of water, SPL, aluminium cement and
gypsum. The requirements were slightly modified due to the problems found in PFT1.
Attention was paid to increasing the early age shear strength, which was raised from
0.5 kPa to 2 kPa as a required property, and in the final strength of the mixes. Only
grouting related properties were tested. Leach testing was not done because the ratio of
SF/PC was not altered in the mixes and pH behaviour was assumed to be similar as that
of f63.
Three promising mixes were selected for the so-called batch mixing test (BMT)
(Sievänen et al. 2005). Based on those results mix P3 (Table 1-1) was selected to be
tested in PFT2 in ONKALO. The results of mix P3 obtained in the laboratory tests and
BMTs are gathered in Table 1-2. The mix had good penetration ability, promising
Marsh fluidity, promising strength development and satisfying compressive strength
and its composition was the simplest and among the alternatives it was the most
acceptable from the long-term safety point of view (lowest content of SPL). Only the
Marsh fluidity obtained in the laboratory was not satisfying. Although all properties
were not the best, the overall behaviour of the mix and the composition of it were
regarded best.
In PFT2, half of the grouting fan was grouted with P3 and the other half with the
ordinary grout used in ONKALO (Sievänen et al. 2005). The results of mix P3 were
promising but not satisfying (Table 1-2). The development of strength was promising;
the uniaxial compressive strength at 28 d was good. The results of penetrability and
Marsh-fluidity were poorer in actual grouting tests than in mixing tests. The results may
partly be explained by experiment conditions in the tunnel and malfunctioning of the
measuring equipment. Bleeding was good. It was found that mix P3 seemed to be
poorer than the ordinary grout, but some of the leakages were sealed and the thickness

7
of the grouted zone was estimated to be about 2-3 m. One dropping leakage and
moisture remained on the tunnel ceiling and walls after grouting. After rock bolting
there were a few dropping leakages. The conclusion of PFT2 was that the use of this
kind of low pH cementitious grout could be considered for repository grouting from a
technical performance point of view, but more field experiences were necessary to
verify the behaviour of the grout. Technical performance could be better, so further
optimising was recommended. Also based on a separate literature examination
(Hakanen & Ervanne 2006), the melamine based SPL used in mix P3 was not regarded
as the most suitable for repository grouting. According to them, naphthalene
sulphonate-based superplasticizer (NS-SPL) is the least problematic.
The further optimisation was started within the LPHTEK-project, which is managed by
Posiva Oy, and the laboratory work and field tests decided within this project are
presented in this report. In the future the developed mixes will be tested in a large scale
field test, named LPHTEK-field test and will be reported separately.

8
Tabl
e 1-
1. C
hem
ical
com
posi
tions
of t
he P
C+
SF –
mix
es f6
3 an
d P3
, whi
ch w
ere
the
mos
t pro
mis
ing
low
pH
cem
entit
ious
mix
es a
t the
ea
rlie
r sta
ge.
Mix
S
yste
m
PC
-typ
e
SF
-typ
e
SP
L-t
ype
G/P
C
HA
C/P
C
SF
/PC
S
PL/D
M(w
t-%
)C
a/S
i mola
r ra
tio S
iO2
W/D
M
f63
UF
16+
SF
+E
TT
A
UF
16
Gro
ut
Aid
- 0.0
27
0.0
75
0.6
9
0
0.8
3 C
a/S
i 49.3
%2.4
8
P3
UF
16+
SF
+S
PL
UF
16
Gro
ut
Aid
SP
-40
(mela
min
e-
base
d)
0.0
00
0.0
00
0.6
9
2.0
0.7
9
52.2
%
1.6
1
Tabl
e 1-
2. R
esul
ts o
f tec
hnic
al te
sts
in th
e la
bora
tory
and
in th
e fie
ld o
f the
mix
es f6
3 an
d P3
, whi
ch w
ere
the
mos
t pro
mis
ing
low
pH
cem
entit
ious
mix
es in
ear
lier s
tage
. Lab
ora
tory
re
quirem
ents
(to
the le
ft o
f th
e c
olu
mn)
and r
esu
lts (
to t
he r
igh
t)
Mix
B
lee
din
g
(vol-%
)6h s
he
ar
stre
ngth
(kP
a)
bm
in (μ
m)
bcr
it(μ
m)
Vis
cosi
ty
Bin
gham
(P
a)
Yie
ld s
tress
B
ing
ham
(P
a)
Mars
h f
luid
ity
(s)
Com
pr.
str
ength
(M
Pa)
28d/9
1d
f63
10
0
0.5
3.7
80
44
12
0
65
50
50
5
21
- -
4/-
-
P3
10
0
2
1.3
80
46
12
0
107
ALA
P(1
) -
ALA
P(1
) -
- 136
8/-
14.4
/-
Fie
ld t
est
requ
irem
ents
* (to
the le
ft o
f th
e c
olu
mn)
an
d r
esu
lts (
to t
he r
ight)
(m
ixin
g t
est
/gro
utin
g t
est
**/m
ixin
g t
est
Mix
B
lee
din
g
(vol-%
)6h s
hear
stre
ngth
(k
Pa)
Filt
er
pum
p
(ml) (
100μ
m)
Mars
h flu
idity
(s
)C
om
pr.
str
ength
(M
Pa)
28d/9
1d
f63
(5)1
0
1
0.5
0.1
5
(20
0)-
30
0
290-3
10
**(5
)10
39-4
0
S(2
) /-
1.5
7 /
-
P3
10
0-1
0.5
~
0.2
1/~
0.2
**
(20
0)-
30
0
300-3
20/1
40-2
70**
10
45-4
7/5
1-5
4**
S(2
) /-
10.9
/-*
*
(1) A
LA
P =
as
low
as
po
ssib
le
(2) S
= S
eve
ral
*th
e d
eta
iled
de
term
ina
tion
s a
nd
cla
ssifi
catio
ns
for
the
re
qu
ire
me
nts
ha
ve c
ha
ng
ed
du
rin
g t
he
pro
ject
an
d t
he
y a
re p
rese
nte
d in
wo
rkin
g r
ep
ort
s (K
ron
löf
20
05
a,
20
05
b,
Sie
vän
en
et
al.
20
05
, 2006)
** t
he
re
sult
is o
bta
ine
d in
PF
T3
, th
e o
the
r re
sults
in B
MT
1 a
nd
BM
T2

9
2 MATERIALS
Based on the outcome of the earlier project “Injection grout for deep repositories”
(Bodén & Sievänen 2005, Kronlöf 2005a, 2005b, Vuorinen et al. 2005 and Sievänen et
al. 2005) the further development of low pH cementitious grout and optimisation of the
grout properties is based on the binder material system Portland cement (PC) and
microsilica (SF). Superplasticizer (SPL) is considered necessary in order to get all the
wanted technical properties.
The PC used in further optimisation is commercial Ultrafin 16 (UF16) by Cementa AB.
Ultrafin 16 is a sulphate resistant (chromate reduced) and low alkaline injection
Portland cement, designation in accordance with EN 197-1: CEM I 52.5 R. Its d95
particle size is less than 16 μm. The used microsilica is commercial GroutAid (GA) by
Elkem. The bulk density of the GroutAid used in the laboratory and BMTs was
1390 kg/m3 which is an average bulk density given by the producer. The SPLs used in
the laboratory tests were Mighty 150 (naphtalene sulphonate) by Scancem and SP40
(melamine sulphonate) by Sika. Product information is gathered in Table 2-1.
A few preliminary tests with two polycarboxylate superplasticizers (PCB-SPL) were
also made in the laboratory. The target of these tests was to observe and compare the
properties of mixes with different SPL. The tested PCB-SPLs were Structuro 111X by
Fosroc A/S (agent Semtu Oy in Finland) and Glenium 51 by MAC S.P.A. (agent
Degussa Construction Chemicals Finland Oy).
Two mixes with SuperParmix-superplasticizer (naphthalene formaldehyde) by
Finnsementti were tested preliminarily in one BMT.
The tested mix compositions were defined by Posiva Oy together with the LPHTEK
project.

10
Tabl
e 2-
1. T
he m
ain
prop
ertie
s of t
he g
rout
com
pone
nts u
sed
at th
e la
bora
tory
. Dat
a co
llect
ed fr
om d
ata
shee
ts g
iven
by
the
prod
ucer
.
Pro
du
ct
/Pro
du
cer
Co
mp
osi
tion
M
ax
sto
rag
e
time
(month
s)
Sto
rage
T(
C)
De
nsi
ty
(co
mp
act
)
kg/m
3
So
lids
(wt
%)
Wa
ter
(wt-
%)
BE
Tsp
eci
ficsu
rfa
ce(m
2/k
g)
Ma
x p
art
icle
si
ze (
m)
pH
V
isco
sity
C
he
mic
al
pro
pe
rtie
s (w
t-%
) L
OI=
loss
o
n ig
niti
on
Ultr
afin
16
(U
F16
) ce
me
nt
/Ce
me
nta
Ab
Su
lph
ate
resi
sta
nt,
ch
rom
ate
re
du
ced
an
d
low
alk
alin
e
cem
en
t
6-
3100 -
32
00
--
1600
16 (
95 %
) -
-M
gO
ma
x 5.0
S
O3 m
ax
3.5
Gro
utA
id
/Elk
em
Sili
ca f
um
e
(mic
rosi
lica
) -
ba
sed
ad
diti
ve
- -
1390
(1350-1
410)
50
2
- 15 0
00 (
dry
) 1 (
>90 %
)
45 (
ma
x 1%
)4.5
- 6
.5
Max
100 c
P
SiO
2 m
in.
86
C
arb
on m
ax
2.5
LO
I m
ax
3.0
A
lka
li o
xid
es
max
2.0
Mig
hty
15
0
(SP
L)
/Sik
a
No
rge
AS
Na
fta
len
sulfo
nic
aci
d-
form
ald
eh
yde
con
de
nsa
te,
Na
-sa
lt
-+
5 -
+25
C1200
40
60 -
100
--
Ca.
9
50
mP
as
-
Sik
a-S
P 4
0
(SP
L)
/Sik
a
Su
lph
on
ate
dm
ela
min
efo
rmald
eh
yde
con
de
nsa
tes
-+
0 -
+25
C1260
(+20
C)
30 -
60
60 -
100
- -
10 -
12
(+20
C)
50 -
90
mP
as
(+20
C)
Form
ald
eh
yde
< 0
.2
Super-
Pa
rmix
(SP
L)
/Fin
nse
me
ntt
i
Na
ph
tha
len
efo
rmald
eh
yde
po
lyco
nd
en
sate
Min
. 1
2
(unopene
d)
> +
5C
> +
15
C(m
in.
wo
rkin
g T
)
1200
40
--
-8 -
9
--
Str
uct
uro
111X
(S
PL)
/Fo
sro
c A
/S
(Sem
tu)
Po
lyca
rbo
xyla
te
poly
mer
12
+5 -
+50
C1070
(+20
C)
- -
- -
ca. 6.5
-
Ch
lorid
e C
l-
<0
.05
So
diu
me
q.
Na
2O
<1
.0
Gle
niu
m 5
1
(SP
L)
/MA
C S
.P.A
(D
eguss
a)
Mo
difi
ed
po
lyca
rbo
xylic
eth
er
Min
. 1
2
(sh
elf
life
) >
+5
-
+5
0C
1100
50
35
1
--
-6 -
7
128
30
m
Pa
sC
hlo
rid
e<
0.0
1

11
3 OBJECTIVES
The objective of this work was to develop the grouts that fulfil certain requirements in
order to meet the workability and sealing requirements technically in short- and
long-term and also to meet the basic long-term safety requirement set (pH 11).
The objectives of the laboratory and field work have been set and justified in the project
internal memorandums. Originally the objectives were set within the project “Injection
Grout for Deep Repositories” and they were updated within the project LPHTEK based
on experiences obtained from the earlier project.
Because partly different testing methods are used in the laboratory and in the field, the
objectives are presented separately in Table 3-1 and Table 3-2. The objectives are
divided into required and desired properties. Given values are not absolute acceptance
criteria for any grouts; they are meant to be used as guidelines in this development
work.
Workability time was set to be 30 min, and it is meant to be determined so that certain
measurements are done at 30 min. However, due to testing arrangements in the
laboratory, mixes were tested soon after mixing and some properties were checked at 1
h.
Although several target properties are presented, all measurements are not done with all
mixes. If a mix showed poor Marsh-value, bleeding or shear strength at 6 h further
testing was passed. Only promising mixes were tested for penetration ability (by
penetrability meter). For mixes that fulfil the target for penetration ability the
rheological measurements were done. The leach test was done to one basic mix used
also in pilot field test 3 (PFT3). The mixes that ended up to the PFT3 were tested
thoroughly.
Although two target values for strength development were set (at 6 h and at 8 h),
measurement at 6 h was possible to do in the laboratory. In field it was not possible to
measure these at certain hour and the results at 6 h and 8 h were estimated from the
nearby results.
Target values for filter pump tests and NES tests were originally given, but they were
not systematically tested since penetrability meter is considered more reliable. NES
equipment was not available in field. Density was not separately measured in the
laboratory, since the components were dosed with scale and the risk for wrong dosing is
not as high as in field where density is systematically measured.

12
Table 3-1. Objectives for the laboratory work. All properties were not tested systematically in the laboratory; those that were not usually measured or were not possible to follow in the laboratory are written in light-blue colour.
Order of
importance
Property Requirement Measuring
methodpH 11.0 Leaching tests Density To be determined for
each mix. Acceptable limits 20 kg/m3
Densimeter. Acceptable value shall be obtained before other properties are tested.
Penetrability bmin
Penetrability bcrit
Penetrability
Penetrability
80 μm 120 μm
>300 ml
100 μm
Penetrability meter at 30 min
Filter pump (100 μm and smaller, if this target is reached) at 30 minNES-test at 30 min
Viscosity
Fluidity
50 mPas
45 s
Rheometry at 30 min
Marsh funnel at 30 min
Required properties
Shear strength at 6 h 500 Pa Fall cone at 6 h Workability time 30 min Determined by
penetrability and rheology
Shear strength at 8 h 2 kPa Fall cone at 8 h Bleed 2% Measuring tin at 2 h Yield value 5 Pa Rheometry at 30 min
Desired properties
Compressive strength 4 MPa Uniaxial compressive strength at 28 d
Table 3-2. Objectives for the field testing. Penetrability (light-blue text) was not measured by NES-equipment.
Order of
importance
Property Requirement Measuring
methodPenetrability / filtration stability Penetrability
>300 ml
< 100 μm
Filter pump, 100 μm mesh at 30 min Field NES equipment at 30 min
Density To be determined for each mix. Acceptable limits 50 kg/m3
Mud balance. Acceptable value shall be obtained before other properties are tested.
Fluidity 45 s Marsh funnel at 30 min
Required properties
Shear strength at 6 h 500 Pa Fall cone at 6 h
Bleed 2% Measuring glass at 2 h
Shear strength at 8 h 2 kPa Fall cone at 8 h Workability time 30 min Determined by fluidity
and penetrability
Desired properties
Compressive strength Several MPa Uniaxial compressive strength at 28 d

13
4 METHODS FOR TESTING GROUT PROPERTIES
4.1 General
The following laboratory tests were used to characterize the properties of the grouts:
1. Marsh funnel test; to determine the fluidity, which gives an idea of the
rheological properties of the grout.
2. Flow table test; to get an idea of the rheological properties of the mixes. The
flow table test was done because with some mixes no result was achieved with
the Marsh funnel test.
3. Bleeding test by measuring tin; to measure water separation.
4. Fall cone test; to follow up the early age strength development.
5. Penetrability meter test; to characterize the penetration ability.
6. Vicat-needle; to test the time taken for setting (made only for a few mixes).
7. NES-test; to measure penetration ability (was done only for a couple of mixes).
8. Uniaxial compressive strength; to get an idea of the final strength of the mix.
In order to measure the compressive strength of the hardened grout the samples were
cast in prisms.
Most materials were stored in a cooled cabinet (12 ºC), but some at room temperature.
Testing temperature 12 ºC was chosen because the prevailing temperature at the
repository level is about ~10.5-12 ºC. During mixing the mixer bowl was embedded in
cold, running tap water if cooling was required. The testing was performed at room
temperature, but the mixes were stored in a cooled cabinet the first 24 h, if required. The
mix temperature was recorded during mixing (Figure 4-1).

14
Figure 4-1. Set-up for the grout mixing under cooled conditions at the laboratory.
The following methods were used to characterize the properties of the grouts in the
PFT3 in ONKALO:
1. Filter pump; to determine the filtration stability, which gives a rough idea of the
penetration ability
2. Marsh funnel; to determine the fluidity, which gives an idea of the rheological
properties of the grout
3. Measuring glass; which measures water separation
4. Fall cone test; to follow up the early strength.
In BMTs the samples of the most promising mixes were cast for leach testing.
Temperature in the different field tests varied between 2 ºC and 25 ºC.
More detailed descriptions of the methods are available for example in Kronlöf (2005a).
4.2 Fluidity by Marsh funnel
The Marsh funnel (Figure 4-2) gives an idea of the rheological properties of the grout. It
gives neither viscosity nor yield value, but Marsh fluidity is a sort of combination of
these properties.
The Marsh funnel was filled with 1.5 litres of grout. When filling, the grout is run
through a mesh so that clumps etc. are removed. The time it takes for 1 l of grout to run
through the funnel is measured

15
Outlet d = 4.8 mm
305 mm
Filling height 302.5 mm
50.8 mm
d = 152 mm
Figure 4-2. Marsh funnel. The volume of the specimen run through the cone is 1 l.
4.3 Fluidity by Flow table
The flow of the mixes were measured by filling a brass cone (inner diameter = 39 mm,
height 50 mm) standing on a dry glass plate with grout and lifting the cone evenly so
that the grout spread out on the plate (BY1, 1972). The largest and the smallest
diameters of the flow pattern were measured and the result was the average in mm. The
flow table test was performed because in some cases no result was obtained with the
Marsh funnel (grout was too thick).
4.4 Bleeding
Bleeding (water separation) was measured with a measuring tin and pipette in the
laboratory (dimensions slightly modified from BY1, 1972). The tin was filled with
grout until the grout surface touched the measurement needle put over the top of the tin.
The volume of the mass was then 914 ml. The tin was covered with a lid, and stored
usually in the cold room until tested. The water separated at the surface of the grout was
sucked with a pipette and weighed. The result was given as volume-% of separated
water at about two hours after mixing.
In the field a 1000 ml measuring glass was used and bleeding was measured by volume
as water separated on the surface of the grout (Figure 4-3).

16
Figure 4-3. Illustration of measuring glass test for measuring bleeding (water separation). Water separates (shown by the arrows) on top of the grout.
4.5 Early strength development by fall cone
The fall cone test, according to standard CEN ISO/TS 17892-6, was used for
determining early shear strength of the mixes. The testing was performed at the ages of
6 h and 24 h in the laboratory.
The principle of the test is presented in Figure 4-4. After the cone was dropped into the
mix the depth of the indent was observed and the corresponding shear strength was
determined from a table.
Figure 4-4. Fall cone apparatus for measuring the early age shear strength.

17
4.6 Penetration ability by penetrability meter in laboratory tests
The penetration ability of some selected mixes was determined with the penetrability
meter developed by KTH (Royal University of Technology) (Eriksson & al. 2004). The
method gives the bmin and bcrit values for the mixes.
The mix was poured into the penetrability meter container (Figure 4-5) and then
squeezed out under 0.1 MPa pressure through a set of filters in an ascending series. Six
litres of freshly made mix at the age of about 0.5 h was tested. The filters used in the
tests were 35, 45, 54, 63, 75, 90, 104, 125, 144 and 200 μm. The mix was let to flow
through the filter for 10 seconds at the most or until the filter was blocked by the filter
cake. The filter was changed to one with bigger sieve opening until at least 1000 ml of
grout was collected after which the testing was stopped. With each filter the amount of
mix squeezed out was measured and then the results were plotted on a mesh size vs.
amount of mix –chart. The inversion points give the bmin and bcrit values. bmin represents
an opening that grout starts to penetrate into and bcrit represents an opening that all grout
penetrates into. The smaller the values are the smaller fractures the grout can penetrate
into.
Figure 4-5. Grout being squeezed out of the penetrability meter through a filter under 0.1 MPa pressure.

18
4.7 Penetration ability by filter pump in field tests
The penetration ability was measured with a filter pump according to VU-SC:27 (Figure
4-6). A short manual of the method is presented in the appendices of Kronlöf (2005a).
The pump is hand-operated. Filters with different mesh sizes can be used; typical sizes
are 63, 75 and 100 μm. The idea is to suck grout through the filter and then pump out
back through the filter and measure the outpumped volume. After the grout is sucked
into a cylinder, the contents are to be pressed into a measuring glass in order to measure
the exact volume. The volume of the pump is 310 ml, which is the maximum
penetration ability through the sieve. The exact penetration ability of the mix is obtained
by testing the grout with meshes of different sizes.
4.8 Compressive strength
The compressive strength is measured of prisms sized 40x40x160 mm at the age of 1,
28 and for some mixes at 91 days. Three measurements were performed for one prism
and the result was given as an average. Often no result was achieved with a fall cone
test at the age of 24 h, so 1 day compressive strength gave comparable results of all the
tested mixes.
The prisms were cast at the age of 1 h and stored in a mould covered by a glass plate at
room temperature or in a cooled cabinet (12 C), if required. After 24 hours the prisms
were de-moulded and moved to another cabinet for curing (20 C, 100% RH) and stored
there until testing.
Figure 4-6. Filter pump.

19
4.9 Rheology
The equipment for the rheology tests was brought to the laboratory and the 4 mixes to
be tested were prepared as usual in cooled conditions. The rheology methods are
described e.g. in Kronlöf (2005a). Viscosity determinations were done at spindle
rotation speeds 0-238 rpm with a Brookfield DV-III+ Rheometer by VTT PRO
(Appendix 1).
Each mix was tested twice for viscosity and yield values, first on freshly made mix and
then again 15 - 30 minutes later. The rest of the mix was kept in a cooled cabinet
(12 ºC) under constant mixing during the first test.
4.10 NES test
In the NES test grout material is pumped through an artificial smooth fracture at a
constant pressure. The amount of mass that comes through the fracture and the elapsed
time are recorded. A filter cake may form and stop the flow depending on the mix
composition. The equipment is situated at the Cementa factory at Degerhamn, Sweden.
The experimental set-up is illustrated in Figure 4-7.
Figure 4-7. NES test for penetrability analysis.

20
4.11 Evaluation of the grouting result of the field test
The grouting result was evaluated by comparing the calculated leakage water inflow
before grouting to 1) calculated leakage water inflow after grouting and
2) measured/mapped leakage water inflow after grouting. Evaluation of the sealing
efficiency is rough and qualitative.
Before grouting the rock was characterised with water loss measurements in four probe
holes. Posiva’s Flowlog was used for observing the water conductive fractures. After
grouting four control holes were drilled and studied to evaluate the grouting result. The
leakages on the tunnel walls and ceiling were mapped after excavation and after rock
bolting. In the geological mapping of the tunnel the fractures containing grouting
cement were observed.

21
5 LABORATORY STUDIES
5.1 Tasks
The laboratory tests were done by Contesta Oy during the time period March
2005-December 2005.
The objective of the laboratory testing was to improve the mix P3 which had given
promising results in earlier studies but was still too stiff for grouting (Bodén &
Sievänen 2005, Kronlöf 2005a, 2005b, Vuorinen et al. 2005 and Sievänen et al. 2005).
Mixing and testing low pH cementitious grouts in the laboratory was done at Contesta
Oy according to the instructions given by Posiva Oy. The mix composition was
optimised by 1) replacing the used SPL (SP-40, M-SPL) with one (Mighty 150, NS-
SPL) with expected less harmful effects on the long-term safety of a repository for spent
nuclear fuel (Hakanen & Ervanne 2006), 2) varying the dosing of SPL and SF and 3)
cooling the temperature of the mixes.
5.2 Tested mix compositions
The composition of the mix P3, that was selected to be further optimised, was
59.27 wt % of UF16 cement and 40.73 wt-% microsilica by dry weight (in form of GA)
leading to SF/PC -ratio 0.69, water to dry materials (W/DM as weight units) was 1.59
and SPL SP-40 was 2 wt % of the dry weight of the mix.
The tested mix compositions based on P3 and the recipes delivered by Posiva Oy are
given in Table 5-1. Detailed recipes (weighing in laboratory) of each mix are given in
Appendix 2. The task was to identify the most promising mixes for further testing on
the basis of early age test results and strength development. The mixes were tested at
two different temperatures and with two SPLs. The UF16 cement used was from the
same consignment as in the preliminary tests from December 2004 and was therefore
about 3-4 months old at the time of these second tests.
The mixes were numbered with running numbering (Appendix 2). It was agreed that it
was not necessary to test all mix compositions if some set of mixes did not show
acceptable results during the mixing and early testing. Nor was it necessary to test all
the mixes with decreased microsilica content if mixes with “low pH producing”
microsilica content behaved well. Here “low pH producing” refers to the content, which
is known to lead to pH-values 11 in leachates. The reason for testing mixes with
reduced microsilica content (-5 or -10 wt-% units compared to the “low pH producing”
content 40.73 wt-%) was that the preliminary tests of the mixes in December 2004 with
this amount of microsilica showed rather poor performance in the fresh state at room
temperature. The technical properties were improved at the expense of the low pH as
microsilica content was reduced. The best technical properties were achieved with
higher SPL dosage (3 wt-%). Low pH was prioritised over higher SPL dosage. Some
tests were added to the test series during the work, these are listed as B-mixes in Table

22
5-1. Altogether 28 mixes were tested from Table 5-1. The first tests showed that higher
SPL content lead to better results than higher water content. The test matrix was slightly
modified based on the results and P307B and P308B were added to the matrix.
The project group chose the most promising mixes, which were then tested more
comprehensively in the laboratory at low temperatures (Table 5-2). The mix P307C was
developed during the PFT3 and it was tested afterwards in the laboratory. Two
laboratory batches were made from each mix. One set of batches was used in the same
tests as the mixes in Table 5-1. The other set of batches was tested with a penetrability
meter. Fresh UF16 cement and GA were used in these tests. Seven mixes were tested in
this test series.
The rheological properties were measured for the mixes used in the PFT3.
Complementary laboratory studies were done with a different type of penetration ability
device. This NES-test series was done at the Cementa cement factory, Sweden.

23
Tabl
e 5-
1. M
ix c
ompo
sitio
n pl
an o
f the
test
seri
es. C
hang
es in
the
SPL
dosa
ge in
par
enth
esis
afte
r the
mix
num
ber.
Tem
p.
(C
)12
12
12
20
20
20
12
12
12
20
20
20
20
SP
L
(wt-
%)
SP
40
3
SP
40
2
SP
40
2
SP
40
3
SP
40
2
SP
40
2
Mig
hty
150
3
Mig
hty
150
2
Mig
hty
150
2
Mig
hty
150
3
Mig
hty
150
2
Mig
hty
150
2
Mig
hty
150
2
SF
, lo
w p
H d
osi
ng (
SF
/PC
= 0
.69)
W/D
M
Mix
nro
1.2
P301
1.4
P302
1.6
P303
1.2
P304
1.4
P305
1.6
P306
1.2
P307
P307B
(4%
)
1.4
P308 (
3%
)
P308B
(4%
)
1.6
P309
1.2
P310
1.4
P311
1.6
P312
1.8
P313
SF
-5 w
t-%
units
(S
F/P
C =
0.5
6)
W/D
M
Mix
nro
1.2
P321
1.4
P322
1.6
P323
1.2
P324
1.4
P325
1.6
P326
1.2
P327
1.4
P328
1.6
P329
1.2
P330
1.4
P331
1.6
P332
1.8
P333
SF
-10 w
t-%
units
(S
F/P
C =
0.4
4)
W/D
M
Mix
nro
1.2
P341
1.4
P342
1.6
P343
1.2
P344
1.4
P345
1.6
P346
1.2
P347
1.4
P348
1.6
P349
1.2
P350
1.4
P351
1.6
P352
1.8
P353

24
Table 5-2. Mix compositions chosen for further testing in the laboratory.
Mix P307 P307B P307C P308 P308B P309 P327
T ( C) 12 12 12 12 12 12 12
SPL-type
(wt-% of DM weight)
Mighty 150
3
Mighty 150
4
Mighty 150
3.3
Mighty 150
3
Mighty 150
4
Mighty 150
2
Mighty 150
3
W/DM 1.20 1.20 0.88 1.40 1.40 1.60 1.20
SF (in form of GA),
(wt-% of DM weight)
SF/PC
40.73
0.69
40.73
0.69
41.00
0.69
40.73
0.69
40.73
0.69
40.73
0.69
35.73
0.56
5.3 Mixing and conditions for testing the grouting related properties
In the first tests the quantity of each test batch was about 3 litres. For further testing
with the penetrability meter a double batch, about 6 litres, was prepared. Detailed
recipes of each mix are given in Appendix 2.
For testing at 12 ºC the materials were cooled in a cabinet and kept there all the time
except during weighing and testing at room temperature (about 20 ºC). The materials
tested at 20 ºC were kept at room temperature all the time and the tap water used was
lukewarm. Cold tap water (7- 9 ºC) was used in the 12 ºC mixes.
The mixing was done with a Polytron PT3100 high-speed mixer. The target for the
mixing speed was 12 000 rpm, but during all mixes the mixing speed had to be raised
even up to about 20 000 rpm in order to assure efficient mixing.
As the batch volume was rather small the temperature tended to rise during mixing. The
temperature rise was suppressed by cooling the 12 ºC mixes by immersing the whole
mixing device up to the edge of the mixing bowl in a tank filled with running cold tap
water. The mixes tested at room temperature were not cooled during mixing. The
temperature changes during mixing were recorded repeatedly.
The mixing order was the following: cement was added first to a major part of the water
and the mixing proceeded at about 12 000 rpm for 2 minutes after which SPL was
added together with the remaining water. Last some microsilicaslurry (GroutAid) was
slowly added to the mixture. Mixing continued for 3 minutes at elevated speeds. Total
mixing time was mostly about 5 minutes, but due to stiffness of some mixes, the mixing
may have taken a little longer. The mixer was not efficient enough for some mixes, but
it seemed that the mixes became homogenous enough to proceed with the testing. The
age of the mixes was measured from the end of the mixing time.
Directly after mixing the Marsh funnel test was performed as well as testing of fluidity
with a flow table test. The batch was held in a bucket in the cabinet at 12 ºC or at room
temperature until it was mixed again with a boring machine mixer and tested at the age

25
of 1 h with a Marsh funnel. Laboratory mixes were not agitated in the same way as in
the field.
Samples were taken after the first Marsh funnel test for the fall cone tests and for the
bleeding test. For compressive strength testing 3 prisms were cast of each mix of the
portion that was tested at a 1 hour Marsh funnel test. Otherwise there would not have
been enough mass for the prisms. The specimens were stored in the cabinet at 12 ºC or
at room temperature.
The bleeding test was measured at the age of 2 hours. The fall cone tests were
performed at the ages of 6 h and 24 h. As it was expected that no test result would be
achieved with many mixes in the 24 h fall cone test, the compressive strength testing
was performed at 24 h for almost all mixes. After 1 day the rest of the prisms were
stored at a temperature of 20 ºC and a humidity of 100% RH until tested at the age of
28 days (and later 91 days for some mixes).
For the penetrability meter two sets of batches were prepared, 6 litres altogether. Before
testing, the two sets of batches were poured into a bucket and mixed with a boring
machine mixer in order to achieve a uniform mix. The age of the mix in the test was
about 15 - 20 minutes counting from the age of the first batch. The mix run through the
penetrability meter was not used in any other test due to possible destruction of the
newly formed cement hydration products that would affect the results in other tests. In
actual grouting the grout batches are moved to the agitator after mixing and then
pumped into the bedrock. A new batch will be mixed with the former one in the agitator
and thus the mix, which is grouted, represents several batches of varying ages. Also the
pressure used at the laboratory penetrability test was only 0.1 MPa. It is remarkably low
compared to the normal grouting pressures (2-10 MPa).
5.4 Test results and remarks
The detailed mix and test results are given in Appendix 2.
The laboratory test results are not directly comparable to those obtained during the
actual grouting work in field conditions. This is due to environmental conditions such as
temperature that prevails in e.g. ONKALO, which has an effect on the behaviour of the
grout. Also when performing actual grouting, the mixing and grouting equipment and
the batch volume differ greatly from those used in the laboratory. Nevertheless,
laboratory test results are useful because many mixes that differ slightly from each other
can be tested quickly and they can be compared with each other. In these tests various
SPLs, their amounts and W/DM were compared. It is believed that the best candidates
for field tests can be chosen on the basis of the laboratory tests.
The laboratory mixer (max 3 litres) was not quite efficient enough to mix evenly some
of the mixes that were gel forming and became somewhat stiff. The stiffness of the
mixes was caused by microsilica added slightly after the superplasticizer when cement
and water had first been mixed for two minutes. When added to the mixes, the
microsilica that came into contact with the cement slurry first probably started to react

26
vigorously, thus delaying the efficient mixing of the rest of the microsilica. Even if
microsilica was added cautiously and the mixing speed was increased, it often occurred
that the mix formed gel and lumps that took some time to mix uniformly and this may
have increased somewhat the total mixing time. There are plans to change the mixer to a
bigger and more efficient one for future laboratory tests.
Another problem with a small volume in the mixer was that the temperature tended to
rise quickly as the cement started to react with water and GA. It was not possible to
maintain the temperature of the mix exactly at the target value even though cooling of
materials during mixing was used. In ONKALO the temperature of the grouting is
easier to manage as the environmental temperature is low and stable and the volume of
the batch is much bigger. Also the full-scale mixer is of different type.
The mixes listed in Table 5-1 were made with the UF16 cement consignment that was
3-4 months old, stored at 12 ºC in plastic bags. The mixes chosen for further laboratory
tests (Table 5-2) were made with fresh cement consignment. As the UF16 cement is a
very finely ground cement, the finest particles probably react easily with the
atmospheric moisture. This has an effect on the cement properties both in the fresh and
hardened state as can be seen from the test results of the same mixes both in Table 5-1
and Table 5-2 (App. 2). The mixes made with fresh cement show higher hydration
temperature during mixing (partly due to higher water temperature), poorer Marsh
funnel and flow table consistency and generally earlier and better strength build-up.
It turned out that P3-type mixes with SF/PC ratio 0.69 met the most important
requirements (Table 5-1 and Appendix 2) and there was no need to further study fluid
mixes with lower SF content (SF/PC=0.56 and 0.44).
The temperature of most mixes was near 12 ºC, which is close to the prevailing
temperature in the rock at repository depth at Olkiluoto. Generally the lower
temperature made the mixes more fluid; although there were some contradictory results
with the more fluid mixes being at room temperature (compare P307 & P310 and P309
& P312). However, of these mixes the room temperature ones with the same SPL and
dosage amounts as in the cooled conditions, showed a clear fall in the 28 days
compressive strength compared to the 12 ºC mixes, the reason of which is not known. It
may be possible that the efficiency of the SPL was stronger in the room temperature
mixes as they were prepared 1 month earlier than the 12 ºC mixes. It is also possible
while comparing to the other tests in Table 5-1, that the two types of SPLs (SP-40 &
Mighty150) have behaved vice versa at different temperatures.
The fluidity of the P3-mixes was improved by varying the W/DM content together with
SPL type and amount. Increasing the W/DM helped the mix to become more fluid, but
at the same time the strength development weakened. The W/DM was kept at a lower
level by increasing the SPL amount.
The dosage of 2 – 3 wt-% SP-40 superplasticizer was not enough to make the P3 mixes
fluid enough at any W/DM levels studied (=1.2 - 1.6). The mix achieved good flowing
properties while 3 – 4 wt-% of Mighty150 was used at W/DM=1.4, or 4 wt-% of
Mighty150 at W/DM=1.2. The NS-SPL Mighty150 is according to the literature study

27
(Hakanen & Ervanne 2006) less harmful with respect to the long-term safety aspects as
compared to the M-SPL based SP40, so the mixes with Mighty150 were preferred in the
testing.
It might be worth a try to change the mixing order in P3-mixes; first mix microsilica
with water for 1 - 2 minutes and after that add superplasticizer and cement and mix for a
few minutes. The idea of this mixing order is to suppress the cement hydration, as the
microsilica and water would form a homogeneous, even mix that would be ready to
react with the quickly hydrating cement as soon as the cement enters the mix. This
would also shorten the mixing time, because no hydration reactions would occur before
the cement is added.
5.5 Comprehensive laboratory test results
The main laboratory test results of the mixes chosen for further testing in the laboratory
are presented in Table 5-3. These mixes were also chosen for the field tests among some
other mixes excluding P327. The P307C recipe was developed during the pilot field test
3 and it was tested later in the laboratory. The P327 mix was the only mix that did have
a risk for not fulfilling the pH criteria (pH 11) as its microsilicaslurry content was
5 wt-%-units lower compared to the others.
Fluidity as determined with the Marsh funnel was at the required level only in the mix
P308B, but the fluidity of the mixes P307B and P308 were promising. The fluidity
became better as W/DM and the dosage of SPL were increased. The Marsh funnel
results were expected to be better in the field as the conditions there are more stable and
affect less the measurements. The fluidity of the mixes P307, P309 and P327 was poor
both in the fresh state and at the age of 1 h.
All the mixes in Table 5-3 fulfilled the requirement for the shear strength at 6 h
( 500 Pa) and for the compressive strength at 28 days ( 4 MPa). The strength
development became better as the W/DM content decreased. Higher dosage of SPL
seemed to have a slight negative effect on the early age strength development but on the
other hand, lead to somewhat better later age strength development (compare P307 &
P307B and P308 & P308B).
All the mixes in Table 5-3 fulfilled the requirement of penetrability bmin ( 80 μm) with
the penetrability meter. The required bcrit value ( 120 μm) was achieved in all mixes
except P307. Rheological properties were determined for four mixes in Table 5-3. The
requirement for viscosity ( 50 mPas) was fulfilled in all mixes except P307C. The
composition of P307C was decided in the field and calculated later for a laboratory mix.
In the rheological measurements P307C was relatively stiff.
Yield stress values were higher than the requirement (yield value 5 Pa) in all four
mixes. The P307C mix (designed as thick closing mix in field), was relatively stiff and
differed clearly from the other three. The P307C mix seemed to make a sort of
differentiated cone around the rotating axle at higher speeds during the test. At lower

28
speeds the mix seemed to be more uniform and to grab more firmly on the axle. The
rheological test results of P307C need to be taken with some caution.
Table 5-3. The main laboratory test results of the mixes chosen for further testing in the laboratory from the Table 5-1 including a field recipe P307C (see also Appendix 2). Temperature 12 ºC. Target values are given in Table 3-1.
Mix P307 P307B P307C P308 P308B P309 P327
SPL
Mighty 150, (wt-%) 3 4 3.3 3 4 2 3
W/DM 1.20 1.20 0.88 1.40 1.40 1.60 1.20
SF/PC 0.69 0.69 0.69 0.69 0.69 0.69 0.56
Marsh, fresh, (s) >100 57 >100 57 44 96 72
Marsh, 1 h, (s) >100 97 - 113 61 >100 >100
Shear strength, 6 h, (kPa)
3.2 2.1 1.3* 1.9 1.1 1.3 2.4
Compressive strength, 1 d, (MPa)
0.9 1.0 1.7* 0.6 0.7 0.4 1.1
Compressive strength, 28 d, (MPa)
19.6 21.3 31.1 15.2 17.0 10.0 18.1
Compressive strength, 91 d, (MPa)
- 31.9 - - 22.4 - -
Penetration-ability, bmin, ( m)
42 43 - 41 40 37 42
Penetration-ability, bcrit, ( m)
247 108 - 90 88 113 94
Viscosity, Bingham, (mPas)
1. measurement
2. measurement 10.7
18.0
**
86.5
133.1
23.5
33.6
10.9
15.3
Yield Stress, Bingham, (Pa)
1. measurement
2. measurement 18.5
18.5
*
113.4
114.9
22.2
22.2
12.1
13.8
* Curing temperature of the mix P307C was 8 C during the first 24 hours, which delayed the strength build-up to some degree.
** Composition of the mix P307C in the rheological measurements differed from the tabulated laboratory mix and was W/DM=0.89, SPL=3.1%, SF/PC=0.80.

29
5.6 Tests with alternative superplasticizers
For possible future needs other SPLs based on polycarboxylate (PCB) compositions
were tested with the P3-type grout. The purpose of these test series was to find a PCB
SPL that would behave acceptably with the P3-type grout during the fresh and
hardening stage. Another target was to be able to reduce the total amount of SPL by
using PCBs and in that way reduce the eventual harmful effects on the long-term safety.
Two PCB SPL were chosen for this test series, Glenium 51 (producer MAC S.P.A.,
Italy) and Structuro 111X (producer Fosroc A/S, Denmark). The amount of PCB SPL
was either 1 or 2 wt-% of the dry weight of the mix. The mixing and testing methods
were the same as earlier. The detailed composition of the tested mixes and the test
results are given in Appendix 2. As it turned out that 2 wt-% of PCB SPL was too much
and 1 wt-% too little, a test series with 1.3 - 1.5 wt-% of PCB SPL were performed
(Appendix 2, main results in Table 5-4).
The rotor speed control unit of the 3-liter mixer Polytron PT3100 broke down before
this test series and it was by-passed. As a result, no speed adjustments could be done
during mixing of the batches. The rotor speed depended on the stiffness of the mixes:
the mixing speed for stiffer mixes was around 18 000-20 000 rpm and for the more fluid
mixes around 22 000-25 000 rpm. Another disadvantage was that with especially stiff
mixes small bubbles formed and remained in some mixes during testing even in the
hardened stage. In order to see the effect of the small bubbles on the results, the
previously developed mix P308B was mixed both with the Polytron mixer and with the
electric blender (1.5 l, Electrolux Assistant Line, 600 W) and tested simultaneously with
the PCB SPL mixes.
The bubble build-up in the mixes during mixing and testing did affect the test results.
By comparing the test results of the mix P308B (Table 5-3 and Table 5-4) it looks like
the bubbles clearly increase the fresh Marsh value and somewhat also the 1 hour Marsh
value. On the other hand, the strength build-up seems to be delayed by the bubbles.
Based on this estimation the test results of the PCB SPL mixes are expected to be better
than those shown in Table 5-4 when the batches are mixed with proper equipment.
However, it is also possible that the PCB SPL itself creates some bubbles.
Compared to the mixes with Mighty 150, P3-type mixes with PCB SPL showed better
rheological properties but poorer early age strength development. The amount of the
PCB SPL needs to be adjusted further. The proper amount probably lies between
1.0-1.5 wt-% for the P3-type mixes with W/DM 1.2 - 1.6. With 1.6 W/DM value 1.3 wt-
% of PCB SPL seems to be too much. The results indicate that out of these two SPLs
the Glenium 51 behaves better than Structuro 111X in these mixes.

30
Table 5-4. The main laboratory test results of the PCB SPL mixes (see also App. 2). Temperature 12 ºC. - = no result (either not made or not achieved). P308B is given for comparison.
Mix
Mixer
P369S
Polytron-mixer
P379G
Polytron-mixer
P380G
Polytron-mixer
P381G
Polytron-mixer
P308B
Polytron-mixer
P308B
Electricblender
P308B
Polytron-mixer
Table 5-3
SPL- type Structuro 111X
Glenium51
Glenium51
Glenium51
Mighty 150
Mighty 150
Mighty 150
SPL (wt-%) 1.5 1.5 1.5 1.3 4 4 4
W/DM 1.20 1.20 1.40 1.60 1.40 1.40 1.40
SF/PC 0.69 0.69 0.69 0.69 0.69 0.69 0.69
Marsh, fresh, (s) 45 39 36 37 53 46 44
Marsh, 1 h, (s) 55 48 45 43 65 - 61
Shear strength, 6 h, (kPa)
1.27 0.23 - - 0.76 - 1.1
Compressive strength,1 d, (MPa)
1.3 1.1 0.7 0.5 0.6 - 0.7
Compressive strength, 28 days,(MPa)
21.7 23.5 12.1 12.1 12.3 - 17.0
5.7 NES test
Selected low pH-producing mixes were tested with the NES equipment during one day
in Cementa’s cement factory, Degerhamn, Sweden (Table 5-5). Also some ordinary
mixes already used in ONKALO (also called “normal mixes”) were tested with NES for
comparison. Fresh cement from the factory was used in the tests. The fracture width
was 75 μm in the tests. The amount of mass poured into the cylinder was 1000 ml and
the mass was squeezed out through the fracture at 2 MPa pressure.
All the 13 NES tests were acceptable in regard to timing. No filter cakes were formed
except with one normal mix (SF/PC = 0.18) which contained some accelerator and
formed a small filter cake.
According to a representative of Cementa (S. Hjerström) it should be no problem to
inject the rock with corresponding average fracture width if all grout penetrates a
specific NES slot. If only part of the grout penetrates the slot, the penetration and
sealing capacity will correspond to the volume that has penetrated the slot.

31
Table 5-5. NES test results of selected low pH producing mixes. Tests performed at room temperature.
Mix P308B P309 P308 P307B P379G
SPL-type Mighty 150 Mighty 150 Mighty 150 Mighty 150 Glenium 51
SPL (wt-%) 4 2 3 4 1.5
W/DM 1.40 1.60 1.40 1.20 1.20
SF/PC 0.69 0.69 0.69 0.69 0.69
NES, (s) 20 17 17 21 22
NES, passed amount, (wt-%)
82 68 82 80 85
Marsh, fresh, (s) 37 57 47 40 33
5.8 Conclusions of laboratory tests
The objective of the laboratory tests was to improve the mixes based on the earlier
P3-type mix, which fulfilled the requirement of pH 11.0 in the leachate. The desired
pH was achieved with a high dosage of microsilicaslurry (41 wt-% microsilica by dry
weight). In case these P3-type mixes were to behave unsatisfactorily in the fresh state,
two sets of mixes with a lower amount of microsilica were also planned (36 wt-% and
31-wt% microsilica, by dry weight). It was discovered during the work that the P3-type
mixes behaved acceptably, so the main emphasis was put on them.
The performance of the P3-type mixes in the fresh and hardened state depended on the
water to dry materials ratio, the type of SPL, the amount of SPL and temperature. Most
tests were carried out at about 12 ºC. This was achieved by cooling the materials and the
mixing bowl during mixing. 12 ºC is close to actual temperatures in ONKALO and the
mixes generally also behaved better at this temperature compared to those mixes made
at room temperatures. Higher temperatures probably caused most of the mixes to react
quicker and therefore the mixes became stiffer.
The choice of the NS-SPL (Mighty 150) for further testing was made partly due to its
better performance during the fresh state and partly because it was considered less
harmful with respect to the long-term safety aspects as compared to the M-SPL (SP-40).
The later strength development was better with SP-40, but mixes with Mighty 150
fulfilled the requirements for compressive strength at 6 h and 28 days, too.
The best mix based on the laboratory test results of the mixes chosen for further testing
was P308B judged by the behaviour at fresh state (Table 5-3). P307B was somewhat
poorer in the fresh state, but it showed better strength development than P308B. The
difference in performance was caused by lower W/DM of P307B.

32
Mix P308 was generally somewhat poorer compared to the other two, but its
performance was nearly acceptable. The other mixes in Table 5-3 were clearly poorer in
the fresh state and seemed not to be satisfying mixes for narrow fractures. It should be
remembered, however, that all mixes may actually behave better in the fresh state at
ONKALO due to the more stable and lower temperatures, and the far bigger batches
and more effective mixing compared to those done in the laboratory.

33
6 LEACH TESTING
6.1 Leach testing of mix p308B
Mix P308B was considered the best one based on its performance in the conducted
laboratory tests with laboratory equipment and therefore was also chosen for leach
testing. The mix was cast in plastic tubes at Contesta, and the cast pipes were then
delivered to VTT. The mix was let cure at room temperature until 56 d of age and then
sample disks for the leach tests were sawn. Descriptions of the sample preparations,
handling, dimensions, test methods etc. are found in more detail in Vuorinen et al. 2005.
The testing procedure of Mix P308B was the same as earlier (Vuorinen et al. 2005) with
two leach procedures (equilibrium and diffusion) and with two leach solutions (fresh
ALL-MR and saline OL-SR). In the equilibrium test the leachate was only partly
replaced at each sampling point (corresponding to renewal of 0.74 ml per day) while in
the diffusion test the entire amount of leachate (30 ml) was exchanged.
Table 6-1 gives the composition of mix P308B with mixes f63 and Ref 52 from the
earlier tests (Kronlöf 2005a, 2005b; Vuorinen et al. 2005). Ref 52 represents a
conventionally used grout material (high pH) including some superplasticizer and mix
f63 without superplasticizer is the grout mix that was found in the earlier tests to be the
most promising low-pH mix to be further developed to obtain P308B composition.
The pH values measured earlier for the conventional high-pH grout (Ref 52) did not
virtually show any decrease in either leach test, only slight variations were observed
between the different sampling points. The high pH was around 12.5 in the fresh
leachate (ALL-MR) and little less, about 12.3, in the saline leachate (OL-SR) in both
leach test (Vuorinen et al. 2005).
Table 6-1. Composition of three grout mixes.
Mix Binder PC
-type SF
-type SPL-type
PC/DM
SF/DM
G/PC HAC/PC
SF/PC
SPL/DM(%)
Ca/Simolar ratio SiO2 (wt-%)
W/DM
P308BUF16-SF
+SPLUF16 GA
Mighty 150
0.59 0.41 0.000 0.000 0.69 4 0.7952.8 %
1.4
f63UF16-SF
with ETTA UF16 GA - 0.56 0.38 0.027 0.075 0.69 0.0 0.83
49.3 % 2.48
Ref52UF16-SF
+SPLUF16 GA SPL-40 0.93 0.07 0.000 0 0.075 1
2.331.21
UF16 = commercial cement
ETTA = Ettringite Acceleration
PC = Portland Cement
SF = Silica Fume
GA = commercial slurry of SF
DM = dry matter
DM = dry matter
SPL = Superplasticizer
SPL-40 = sulphonated melamine formaldehyde condensate
Mighty-150 = naphtalenesulfonic acid polymer with formaldehyde
HAC = High Alumina Cement

34
Figure 6-1 shows the pH-values measured in the equilibrium leach test for mix P308B
and those for mix f63 from the earlier test. When comparing the outcome of the tests the
clear decreasing trend in the pH values of mix f63 is not seen for mix P308B as the
pH-values quickly, after about 3 weeks of testing, have reached a constant level; below
pH 11 in ALL-MR and below pH 10 in OL-SR. Already from the beginning of the leach
test the pH-values were lower for mix P308B than for mix f63. In the fresh leachate the
difference is about 0.5 pH units and even more in the saline leachate. Similar behaviour
between the two mixes is also seen in the diffusion test results, Figure 6-2; no
perceivable decreasing trends in the pH-values, as well as lower pH-values in the
leachates of mix P308B. Variation of the length between samplings (shorter or longer)
in the diffusion test is naturally always reflected in the pH-values measured, as can be
seen in the early test values, especially in the fresh leachates, Figure 6-2 a) and b).
When constant sampling intervals were used the pH-values either remained at about the
same level or showed a trend (the later test values).
MIX P308B (EQ): ALL-MR
9.0
9.5
10.0
10.5
11.0
11.5
12.0
12.5
1 2 3 4 5 6 7 8 9 10 11 12
Sampling point
pH
6w4w3w2w1w2d 5d 10w 8w 20w15w
MIX P308B (EQ): OL-SR
9.0
9.5
10.0
10.5
11.0
11.5
12.0
12.5
1 2 3 4 5 6 7 8 9 10 11 12
Sampling point
pH
6w4w3w2w1w2d 5d 10w 8w 25w20w15w
MIX f63 (EQ): ALL-MR
9.0
9.5
10.0
10.5
11.0
11.5
12.0
12.5
1 2 3 4 5 6 7 8 9 10 11 12
Sampling point
pH
6w4w3w2w1w2d 5d 10w8w 20w15w
MIX f63 (EQ): OL-SR
9.0
9.5
10.0
10.5
11.0
11.5
12.0
12.5
1 2 3 4 5 6 7 8 9 10 11 12
Sampling point
pH
6w4w3w2w1w2d 5d 10w8w 25w20w15w
a)
c)
b)
d)
Figure 6-1. Comparison of the pH values obtained in the equilibrium leach test for mixes P308B and f63. The upper row sub-figures show the results in the fresh leachate; (ALL-MR) a) for mix P308B and b) for mix f63. The lower row sub-figures give the pH values in the saline leachate (OL-SR); c) for mix P308B and d) for mix f63.

35
MIX P308B (DIFF): ALL-MR
9.0
9.5
10.0
10.5
11.0
11.5
12.0
12.5
1 2 3 4 5 6 7 8 9 10 11 12 13 14 15 16 17 18 19 20
Sampling point [d]
pH
1h 4h 1 2 3 4 5 6 8 11 15 22 29 36 43 50 57 65 71 78
MIX P308B (DIFF): OL-SR
9.0
9.5
10.0
10.5
11.0
11.5
12.0
12.5
1 2 3 4 5 6 7 8 9 10 11 12 13 14 15 16 17 18 19 20
Sampling point [d]
pH
1h 4h 1 2 3 4 5 6 8 11 15 22 29 36 43 50 57 65 71 78
MIX f63 (DIFF): ALL-MR
9.0
9.5
10.0
10.5
11.0
11.5
12.0
12.5
1 2 3 4 5 6 7 8 9 10 11 12 13 14 15 16 17 18 19 20 21
Sampling point
pH
1h 4h 1 2 3 4 5 6 8 11 15 22 29 36 43 49 51 59 66 73 80
MIX f63 (DIFF): OL-SR
9.0
9.5
10.0
10.5
11.0
11.5
12.0
12.5
1 2 3 4 5 6 7 8 9 10 11 12 13 14 15 16 17 18 19 20 21
Sampling point
pH
1h 4h 1 2 3 4 5 6 8 11 15 22 29 36 43 49 51 59 66 73 80
b)a)
c) d)
Figure 6-2. Comparison of the pH values obtained in the diffusion leach test for mixes P308B and f63. The upper row sub-figures show the results in the fresh leachate (ALL-MR); a) for mix P308B and b) for mix f63. The lower row sub-figures give the pH values in the saline leachate (OL-SR); c) for mix P308B and d) for mix f63. Figure 6-3 shows the results on the total alkalinity values obtained by titration (with
HCl) for some leachate samples from both leach tests for mix P308B (a and c) and mix
f63 (b and d). The pH values of the samples analysed are included as well.
In the equilibrium test in the case of mix f63 the total alkalinities gradually decreased in
both leachates with the declining pH values (Figure 6-3 b), whereas in the case of mix
P308B the trends were different (Figure 6-3 a). In the fresh leachate (ALL-MR)
alkalinities initially slightly increased from about 2.5 meq/l up to about 3 meq/l and then
evened out until at the end of testing dropped to around the initial value of 2.5 meq/l,
which corresponds to the value obtained at the end of mix f63 test, as well. In the saline
leachate (OL-SR) mix f63 showed similar trends as in the fresh leachate, while mix
P308B followed a quite different one. The alkalinity values increased, from about
1 meq/l up to about 3 meq/l, in 3 weeks of testing while the pH values remained
virtually at a constant level. After 3 weeks the total alkalinities decreased back to about
1 meq/l at the end of leach testing corresponding to the level obtained in mix f63 tests as
well. The differing behaviour of the alkalinity values measured may be due to organic
matter released from mix P308B as a result of the added SPL. It is known that some
organic ligands may contribute to alkalinity with other non carbonate contributors (e.g.
silicate and hydroxide).
In the diffusion test (Figure 6-3 c) the total alkalinities for mix P308B initially increased
in both leachates, then slightly dropped and showed some increase thereafter. A reason

36
for this varying behaviour might be a result of the role of the SPL in the internal
evolving of the material. Leach testing was stopped in the saline leachate (OL-SR)
earlier at which point (day 8) the alkalinity value measured was around 0.4 meq/l.
Testing in the fresh leachate was continued longer and towards the end of testing a
slight decreasing in total alkalinity was observed. The last alkalinity value measured
was about 1.5 meq/l. The results in the fresh leachate are difficult to compare to those
for mix f63, as only values for sampling points of much longer testing existed for mix
f63. In the case of mix P308B the alkalinity values in both leachates in the diffusion test
were, as expected, lower compared to the values obtained in the equilibrium test.
At this phase analysing total organic carbon (TOC) was only for tryout purposes and
therefore only three samples from ALL-MR leachates (diffusion test) for mix P308B
were analysed and not any for mix f63. The results showed clearly higher TOC value in
the first sample (about 30 mg/l) than in the two samples towards the end of testing
(around 3 mg/l). However, this only indicates that the difference in the trends of
alkalinity between the two mixes could be a result of SPL added to mix P308B.
In the diffusion test the amount of leachate at each sampling point was enough to allow
chemical analyses. Samples from both leachates, fresh ALL-MR and saline OL-SR, for
mix P308B were analysed, but as testing in the saline leachate was stopped sooner there
are results only up to 11 days of testing, while for the fresh leachate the results cover a
time period up to 80 days.
P308B (EQ)
9.0
9.5
10.0
10.5
11.0
11.5
0 1 2 3 4 5 6 7 8 9 10111213 141516171819 202122
sampling points [weeks]
pH
0
1
2
3
4
Alk
TO
T [
me
q/L
]
2d 5d 1 2 3 4 6 8 10 20 2d 5d 1 2 3 4 6 8 10
a) f63 (EQ)
9.0
9.5
10.0
10.5
11.0
11.5
0 1 2 3 4 5 6 7 8 9 10 11 12 13 14
sampling points [weeks]
pH
0
1
2
3
4
Alk
TO
T [
me
q/L
]
2d 3 6 10 15 20 2d 3 6 10 15 20
b)
P308B (DIFF)
9.0
9.5
10.0
10.5
11.0
11.5
0 1 2 3 4 5 6 7 8 9 10 11 12 13 14
sampling points [days]
pH
0
1
2
3
4
Alk
TO
T [
me
q/L
]
1h 1 4 8 57 73 79 1h 1 4 8
c)f63 (DIFF)
9.0
9.5
10.0
10.5
11.0
11.5
0 1 2 3 4 5 6 7 8 9
sampling points [days]
pH
0
1
2
3
4
Alk
TO
T [m
eq
/L]
85 106 271 316 85 106
d)
Figure 6-3. Total alkalinity results (pink dots and right side axel) and pH values (blue diamonds and left side axel) in equilibrium (a and b) and diffusion (c and d) leach tests for mix P308B (left sub-figures) and mix f63 (right sub-figures). In each sub-figure the solid vertical line in the middle separates the results in the two leachates used; on the left side for the fresh leachate (ALL-MR) and on the right side for the saline leachate (OL-SR).
37
The analysed results in the DIFF-test for mix P308B are presented in Figure 6-4 and
Figure 6-5 in mg/l. The corresponding pH values are included in Figure 6-4. In addition
to the pH values the major differences between the results in ALL-MR and OL-SR are
seen in the leached amounts of Na, Ca (Figure 6-4) and SO42-
(Figure 6-5); in OL-SR
rather than leaching disappearance from the leachate was observed while in ALL-MR
leaching occurred. The high ionic strength of OL-SR and the common ion effect
between the leachate and cement pore solution partly contributes to such a result,
especially in the case of Na and Ca, but also reactions with the cement matrix are
possible, e.g. for SO42-
. The total amount of K leached was higher in OL-SR, but the
increase of K in the leachate compared to the initial leachate amount was higher in
ALL-MR. In both leachates Mg disappeared (Figure 6-5) which could be due to
formation of brucite (Mg(OH)2) or other e.g., reactions with Ca-containing phases in
cement. The higher pH and lower ionic strength of ALL-MR may allow more Si to
leach (Figure 6-5). (Note! Some anomalous analytical results for Si may be related to
formation of a gel like formation observed in some leachate samples).
The analytical results from diffusion tests indicate that different reactions may occur
between the cement matrix and the leachate depending on the composition of the
leachate and especially the salinity.
Figure 6-6 shows comparison of the analytical results (in mmol/l) of the fresh leachate
samples for mix f63 (a) and mix P308B (b) and Mg results for both mixes (c). Table 6-2
gives the initial nominal concentrations in ALL-MR in mmol/l.
In the case of mix P308B the results show more congruent behaviour, especially K, Ca
and SO4, than in the case of mix f63. Additionally for mix P308B the pattern of Na and
Si results follows rather well that of the other results. The amount of leached K was
higher for mix f63 in the beginning, whereas Ca slightly increased towards the end of
testing. Practically no Cl was leached from mix P308B while in the case of mix f63
some leaching was observed in the beginning and towards the end of testing. Some
more Si was leached from mix P308B than from mix f63. As expected in both cases Mg
disappeared from the leachate samples (Figure 6-6c).
The major differences in the composition of mixes f63 and P308B were the lower water
to dry matter ratio (W/DM), addition of SPL and lack of gypsum and high alumina
cement in mix P308B. The modified composition resulted in more stable pH values
which were also somewhat lower than for mix f63.
Table 6-2. Initial nominal composition of fresh leachate, ALL-MR, in mmol/l. Na 2.3 Si 0.028 Ca 0.13 Cl 1.38 K 0.10 SO4 0.10 Mg 0.029 HCO3 1.07

38
Mix P308B (OL-SR)
9.4
9.6
9.8
10.0
10.2
10.4
10.6
10.8
11.0
1 2 3 4 5 6
time [days]
pH
0.1 0.2 1 4 8 11
Mix P308B (ALL-MR)
9.4
9.6
9.8
10.0
10.2
10.4
10.6
10.8
11.0
1 2 3 4 5 6 7 8 9 10
time [days]
pH
0.1 0.2 1 4 8 11 36 57 73 80 Mix P308B (OL-SR)
0
1000
2000
3000
4000
5000
6000
1 2 3 4 5 6
time [days]
Na
[m
g/L
]
0.1 0.2 1 4 8 11
Na
pH pH
Mix P308B (ALL-MR)
0
10
20
30
40
50
60
70
1 2 3 4 5 6 7 8 9 10
time [days]
Na
[m
g/L
]
0.1 0.2 1 4 8 11 36 57 73 80
Na
Mix P308B (ALL-MR)
0
20
40
60
80
100
120
1 2 3 4 5 6 7 8 9 10
time [days]
K [
mg
/L]
0.1 0.2 1 4 8 11 36 57 73
Mix P308B (OL-SR)
0
20
40
60
80
100
120
1 2 3 4 5 6
time [days]
K [
mg
/L]
0.1 0.2 1 4 8 11
KK
Mix P308B (ALL-MR)
0
5
10
15
20
25
30
1 2 3 4 5 6 7 8 9 10
time [days]
Ca
[m
g/L
]
0.1 0.2 1 4 8 1 1 36 57 73 80
Mix P308B (OL-SR)
0
500
1000
1500
2000
2500
3000
3500
4000
1 2 3 4 5 6
time [days]
Ca
[m
g/L
]
0.1 0.2 1 4 8 11
Ca Ca
Figure 6-4. Analytical results for mix P308B in diffusion test. The left sub-figures are for the fresh leachate (ALL-MR) and the right sub-figures for the saline leachate (OL-SR). (Note the different length of testing period; ALL-MR leachate 80 days, OL-SR 11 days). The two topmost figures are for pH and the orange line in the figures at pH 11 shows the limit below which the pH values should stay. The blue line across the element figures indicates the initial concentration in the leachate solution used.

39
Mix P308B (ALL-MR)
0.0
0.1
0.2
0.3
0.4
0.5
0.6
0.7
1 2 3 4 5 6 7 8 9 10
time [days]
Mg
[m
g/L
]
0.1 0.2 1 4 8 11 36 57 73 80
Mix P308B (OL-SR)
0
5
10
15
20
25
30
35
40
45
50
55
1 2 3 4 5 6
time [days]
Mg
[m
g/L
]
0.1 0.2 1 4 8 11 Mix P308B (OL-SR)
0
1
2
3
4
5
6
7
8
9
10
1 2 3 4 5 6
time [days]
Si [
mg
/L]
0.1 0.2 1 4 8 11
Mix P308B (ALL-MR)
0
5
10
15
20
25
30
35
1 2 3 4 5 6 7 8 9 10
time [days]
Si [
mg
/L]
0.1 0.2 1 4 8 11 36 57 73 80
MgMg
SiSi
Mix P308B (ALL-MR)
0
10
20
30
40
50
1 2 3 4 5 6 7 8 9 10
time [days]
Cl [
mg
/L]
0.1 0.2 1 4 8 1 1 36 57 73 80
Mix P308B (OL-SR)
0100020003000400050006000700080009000
100001100012000130001400015000
1 2 3 4 5 6
time [days]
Cl [
mg
/L]
0.1 0.2 1 4 8 11
Mix P308B (OL-SR) SO42- STOT
0.0
1.0
2.0
3.0
4.0
1 2 3 4 5 6
time [days]
[m
mo
l/L]
0.1 0.2 1 4 8 11
Mix P308B (ALL-MR) SO42- STOT
0.0
0.1
0.2
0.3
0.4
0.5
0.6
0.7
0.8
0.9
1 2 3 4 5 6 7 8 9 10
time [days]
[m
mo
l/L]
0.1 0.2 1 4 8 11 36 57 73 80
Figure 6-5. Analyses results for mix P308B in diffusion test. The left sub-figures are for the fresh leachate (ALL-MR) and the right sub-figures for the saline leachate (OL-SR). (Note the different length of testing period; ALL-MR leachate 80 days, OL-SR 11 days). The blue line across the figures indicates the initial concentration in the leachate solutions. The pink line across the figures indicates the detection limit.

40
f63
0.0
0.5
1.0
1.5
2.0
2.5
3.0
1 2 3 4 5 6 7 8 9 10
sampling point [days]
mm
ol/L
Na
Cl
K
Ca
Si
SO4
Mg
0.1 0.2 1 4 8 11 36 57 71
P308B
0.0
0.5
1.0
1.5
2.0
2.5
3.0
1 2 3 4 5 6 7 8 9 10
sampling point [days]
mm
ol/L
Na
Cl
K
Ca
SO4
Si
Mg
0.1 0.2 1 4 8 11 36 57 73 80
a)
b)
0.00
0.01
0.02
0.03
1 2 3 4 5 6 7 8 9 10
sampling point [days]
mm
ol/L
Mg P308B
Mg f63
0.1 0.2 1 4 8 11 36 57 73 80
c)
Figure 6-6. Analytical results together in mmol/L for the diffusion test leachates (ALL MR; the initial contents in Table 6-2); a) for mix f63 and b) for mix P308B. Additionally c) shows the Mg results together for both mixes on a smaller scale also the initial leachate concentration of Mg is shown with the horizontal turquoise line.

41
6.2 Results on old mixes
From the previous leach testing of grout mixes (Vuorinen et al. 2005) some samples
were stored in the glove-box and new measurements were done later.
Two test samples of mix Ref 52 had been stored for 1.5 years in a glove-box in the
initial leachate solutions; one in the fresh leachate and the other in the saline leachate.
These test samples had experienced no leachate renewal during the storage time. By
measuring the pH values in the leachates maximum pH at equilibrium in those
conditions was obtained; in the fresh leachate the pH value was 12.4 and in the saline
leachate 12.1. Slightly lower values were obtained for two corresponding samples that
had in the beginning of testing experienced leachate renewals, totally 104 ml in the
fresh leachate and 16 ml in the saline leachate, while the total volumes of renewed
leachates in a completed test were 750 ml and 600 ml, respectively. Thereafter the
samples had remained stored in the leachates for about a year and 1.5 years,
respectively. The pH values measured gave 12.3 for the fresh leachate and 12.0 for the
saline leachate.
The previous leach testing (Vuorinen et al. 2005) included samples for mix f63 that had
been cured at two different temperatures, 20 ºC and 50 ºC. The measured pH values
behaved differently in the beginning of testing in both leachates and both leach tests. An
example of the trends is shown in Figure 6-7 in the diffusion test in the fresh leachate
(ALL-MR). The pH values differed more in the beginning of testing but gradually
approached the same value as testing proceeded.
The reason for such behaviour was not clear and therefore some leachate samples were
analysed for the chemistry in order to see if the results could provide an answer. Results
on the analysed samples are shown in Figure 6-8 and Figure 6-9 in both leachates; for a
few sampling points from the beginning and a couple from the end of testing. When
comparing the differences between the fresh (ALL-MR) and saline (OL-SR) leachate
MIX f63 (DIFF): ALL-MR
9.0
9.5
10.0
10.5
11.0
11.5
12.0
12.5
1 2 3 4 5 6 7 8 9 10 11 12 13 14 15 16 17 18 19 20 21 22 23 24 25 26 27
Sampling point
pH AL 20
AL 50
Figure 6-7. The trends in pH values with increasing experimental time and leachate renewal for mix f63 samples cured at two different temperatures, 20 ºC and 50 ºC. Results are shown for the fresh leachate, ALL-MR.

42
sample results the main discrepancy is in the leached components; in OL-SR only K and
Si are leached while in ALL-MR also some Ca and SO4 are leached. As stated before
one reason for the different behaviour is due to the different ionic strengths of the
solutions and in the saline leachate the common ion effect (Ca and Na) with the pore
solution can be another reason. Mg disappears from all leachates probably as a result of
formation of brucite (Mg(OH)2) or reactions with Ca containing phases.
Mix f63 (AL-MR)
9.5
10.0
10.5
11.0
11.5
1 2 3 4 5
time [days]
pH
20 oC
50 oC
0.1 1 4 36 64
Mix f63 (OL-SR)
9.5
10.0
10.5
11.0
11.5
1 2 3 4 5
time [days]
pH
20 oC
50 oC
0.1 1 4 36 64 Mix f63 (AL-MR)
0
10
20
30
40
50
60
70
1 2 3 4 5
time [days]
Na
[m
g/L
]
20 oC
50 oC
0.1 1 4 36 64
Mix f63 (OL-SR)
0
1000
2000
3000
4000
5000
1 2 3 4 5
time [days]
Na
[m
g/L
]
20 oC
50 oC
0.1 1 4 36 64 Mix f63 (AL-MR)
0
10
20
30
40
50
1 2 3 4 5
time [days]
K [
mg
/L]
20 oC
50 oC
0.1 1 4 36 64
Mix f63 (OL-SR)
0102030405060708090
100110120
1 2 3 4 5
time [days]
K [
mg
/L]
20 oC
50 oC
0.1 1 4 36 64 Mix f63 (AL-MR )
0
10
20
30
40
50
60
70
1 2 3 4 5
time [days]
Ca
[m
g/L
]
20 oC
50 oC
0.1 1 4 36 64
Mix f63 (OL-SR )
0
1000
2000
3000
4000
1 2 3 4 5
time [days]
Ca
[m
g/L
]
20 oC
50 oC
0.1 1 4 36 64
Figure 6-8. The left sub-figures are for the fresh leachate (ALL-MR) and the right sub-figures for the saline leachate (OL-SR). The blue line across the figures indicates the initial concentration in the leachate solutions and the orange line in the pH figures the target pH in the development of the cement mixes.

43
Mix f63 (AL-MR)
0.0
0.1
0.2
0.3
0.4
0.5
0.6
0.7
0.8
1 2 3 4 5
time [days]
Mg
[m
g/L
]
20 oC
50 oC
0.1 1 4 36 64
Mix f63 (OL-SR)
05
1015202530354045505560
1 2 3 4 5
time [days]
Mg
[m
g/L
]
20 oC
50 oC
0.1 1 4 36 64 Mix f63 (AL-MR)
0
1
2
3
4
5
6
7
8
9
1 2 3 4 5
time [days]
Si [
mg
/L]
20 oC
50 oC
0.1 1 4 36 64
Mix f63 (OL-SR)
0
1
2
3
4
5
6
7
8
9
1 2 3 4 5
time [days]
Si [
mg
/L]
20 oC
50 oC
0.1 1 4 36 64 Mix f63 (AL-MR)
0
10
20
30
40
50
60
70
1 2 3 4 5
time [days]
Cl [
mg
/L]
20 oC
50 oC
0.1 1 4 36 64
Mix f63 (OL-SR)
0100020003000400050006000700080009000
10000110001200013000140001500016000
1 2 3 4 5
time [days]
Cl [
mg
/L]
20 oC
50 oC
0.1 1 4 36 64 Mix f63 (AL-MR)
0.0
0.5
1.0
1.5
2.0
2.5
3.0
3.5
4.0
4.5
1 2 3 4 5
time [days]
[m
mo
l/L]
SO4 20 oC
SO4 50 oC
0.1 1 4 36 64
Mix f63 (OL-SR)
0.0
0.5
1.0
1.5
2.0
2.5
3.0
3.5
4.0
4.5
1 2 3 4 5
time [days]
[m
mo
l/L]
SO4 20 oC
SO4 50 oC
0.1 1 4 36 64
Figure 6-9. The left sub-figures are for the fresh leachate (ALL-MR) and the right sub-figures for the saline leachate (OL-SR). The blue line across the figures indicates the initial concentration in the leachate solutions.

44
Comparison of the analytical results for the two different curing temperatures, 20 ºC or
50 ºC, reveals that in the fresh leachate (ALL-MR), in addition to the differing pH
values, the leached components show dissimilar behaviour,
- the sample cured at 20 ºC showed higher release of K in the early stage of
testing and overall higher release of Si while
- the sample cured at 50 ºC released more Ca and SO4 in the beginning of testing
and more K at the end of testing.
For both curing temperatures the amount of Si increased at the end of testing.
In the case of both curing temperatures the only components leached in the saline
leachate (OL-SR) were K and Si, and similarly to the fresh leachate results more K was
released in the beginning of testing from the sample cured at 20 ºC. Slightly increased
values of Si were observed towards the end of testing in the leachate of the sample
cured at 50 ºC, whereas a decrease was observed in the case of the sample cured at
20 ºC. Disappearance from the leachate samples were observed in Na, Ca and SO4
contents. Sulphate behaviour in both leachates (Figure 6-9) shows a very similar
pattern, which may imply that in the sample cured at 50 ºC the pore water contains more
SO4 as more is released to the fresh leachate but less is disappearing from the saline.

45
7 PILOT FIELD TEST 3
7.1 General
The field testing included three stages:
1. the first batch mixing test (BMT1) to select the most promising mixes for test
grouting
2. pilot field test (PFT) (test grouting)
3. the second batch mixing test (BMT2) to verify the mix properties
In the BMT1 several promising mixes were mixed in a full-scale mixer in field
conditions and the properties were verified and the most promising ones were selected
for actual test grouting (PFT3).
The test grouting was performed in the ONKALO access tunnel together with the
ONKALO contractor Kalliorakennus Oy. The procedure of the actual test grouting is
presented in Figure 7-1. In the beginning the suitable test area had to be found and the
grouting was planned based on the information obtained from four probe holes. The
intention was to avoid major fracture zones and tight rock. Before test grouting the
tunnel face was characterized with water loss measurements (Lugeon tests) done in four
probe holes and with the flowlog method in leaking probe holes. If needed,
modifications to the plan could be made.
The test grout was mixed and the grouting was performed like in normal grouting.
Samples for testing the technical properties were taken from the agitator.
After test grouting the grouting result was checked from quality control holes. After
excavation the remaining leakages were observed.
Because of difficulties in testing the mix properties during the PFT3, the BMT2 was
arranged in order to verify the mix properties.
7.2 Grouting equipment
The contractor co-operating in the PFT3 was Kalliorakennus Oy. The used grouting
equipment consisted of:
- mixer: Atlas Copco Cemix 201 E
- agitator: Atlas Copco Cemag 401 E
- pump: Atlas Copco Craelius ZBE-100
A Logac-system (by Atlas Copco) recorded the grouted volume and pressure.
Microsilicaslurry and SPL were dosed by hand.
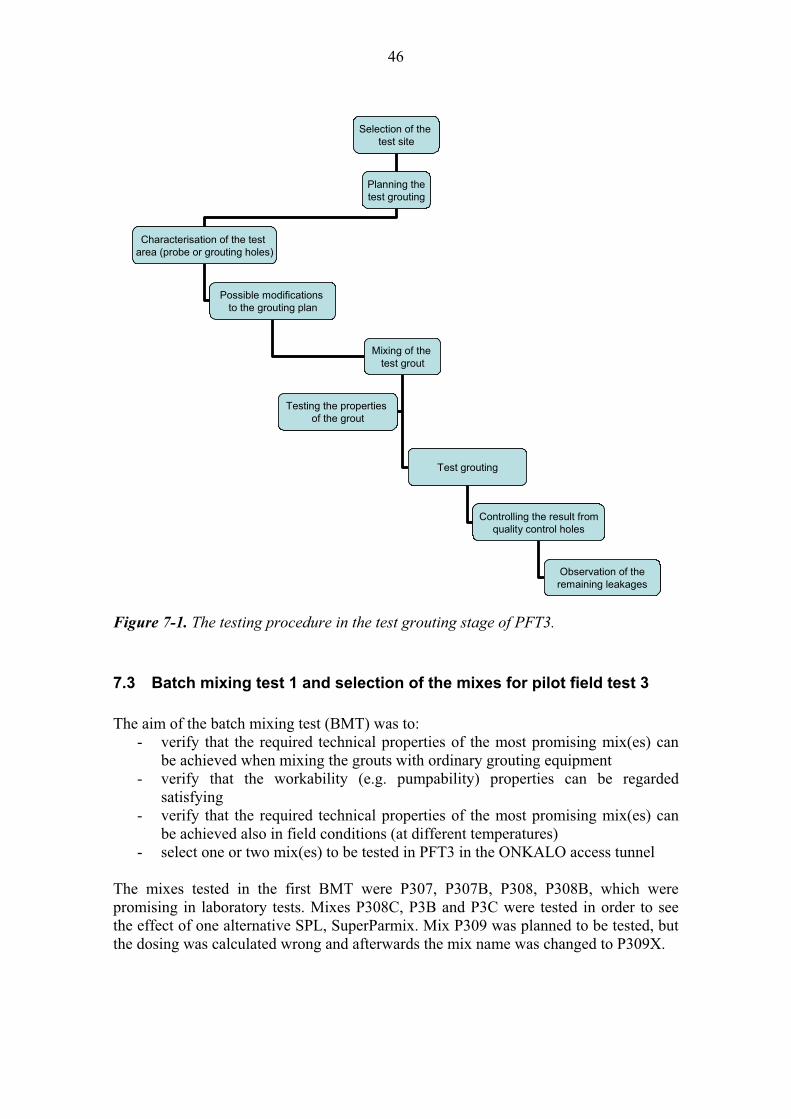
46
Selection of the test site
Planning thetest grouting
Characterisation of the testarea (probe or grouting holes)
Possible modificationsto the grouting plan
Mixing of the test grout
Test grouting
Testing the propertiesof the grout
Controlling the result fromquality control holes
Observation of theremaining leakages
Figure 7-1. The testing procedure in the test grouting stage of PFT3.
7.3 Batch mixing test 1 and selection of the mixes for pilot field test 3
The aim of the batch mixing test (BMT) was to:
- verify that the required technical properties of the most promising mix(es) can
be achieved when mixing the grouts with ordinary grouting equipment
- verify that the workability (e.g. pumpability) properties can be regarded
satisfying
- verify that the required technical properties of the most promising mix(es) can
be achieved also in field conditions (at different temperatures)
- select one or two mix(es) to be tested in PFT3 in the ONKALO access tunnel
The mixes tested in the first BMT were P307, P307B, P308, P308B, which were
promising in laboratory tests. Mixes P308C, P3B and P3C were tested in order to see
the effect of one alternative SPL, SuperParmix. Mix P309 was planned to be tested, but
the dosing was calculated wrong and afterwards the mix name was changed to P309X.

47
The mixes tested in the BMT are presented in Table 7-1 as corresponding laboratory
weights. In the field the recipes were given in field mixer scale and liquous components
were given as volumes. Mixing order and mixing times were: water, cement, 2 min
mixing, microsilicaslurry, SPL, 3 min mixing and finally mix to the agitator, from
which the samples for testing were taken.
The mixes were tested for density by mud balance, fluidity by Marsh funnel,
penetrability by filter pump (100/75 μm mesh sizes), and early age strength
development by fall cone and bleeding by measuring glass. Before testing the water
flow meter was checked and the recipes were corrected so that the real dosing would be
correct. The density was checked for each mix before tests were made. The temperature
during testing varied between 5-10 ºC. All results are presented in Appendix 3.
Mix P307 (W/DM 1.2 and SPL 3 wt-% of DM) was penetrable (300 ml/100 μm mesh),
but it was quite stiff (Marsh value 53-56 s during 1 h). Bleeding was good (0 vol-%)
and the strength development acceptable, 0.5 kPa was obtained at ~6 h and 2 kPa at
7-8 h.
Mix P307B (W/DM 1.2 and SPL 4 wt-%) was penetrable (300 ml/100 μm mesh and
280 ml/75 μm mesh). The Marsh value was 45-47 s during 1 h (Figure 7-2), which can
be regarded promising. The strength development was also acceptable – about 0.5 kPa
was obtained at ~6 h and 2 kPa at 7-8 h (Figure 7-3). There was no problem with
bleeding (0 vol-%).
Mix P308 (W/DM 1.4 and SPL 3 wt-% of DM) showed promising Marsh values
(43-46 s during 0.5 h). Penetrability was good (300 ml/75 μm mesh). Shear strength of
0.5 kPa was obtained at 6-7 h. Shear strength at 8 h is not possible to evaluate. Shear
strength 8.7 kPa was reached at 10 h. Bleeding was good (0 vol-%).
Mix P308B (W/DM 1.4 and SPL 4 wt-% of DM) was the best with regard to the Marsh
fluidity (39-41 s during 0.5 h, Figure 7-2). Also penetrability was good (300 ml/75 μm).
Bleeding was 0 vol-% and the shear strength of about 0.5 kPa was obtained at 6-7 h, and
2 kPa at 8 h (Figure 7-3)
Table 7-1. Mixes in BMT1.
P307 P307B P308 P308B P308C P3B P3C P309X
Binder UF16+SF UF16+SF UF16+SF UF16+SF UF16+SF UF16+SF UF16+SF UF16+SF
W/DM 1.2 1.4 1.2 1.4 1.4 1.6 1.6 1.6
SF-type GA GA GA GA GA GA GA GA
SF/PC 0.69 0.69 0.69 0.69 0.69 0.69 0.69 0.60
SPLMighty
150Mighty
150Mighty
150Mighty
150SuperParmix
Mighty 150
SuperParmix
Mighty 150
SPL/DM(wt-%)
3 4 3 4 3 2 2 2

48
Mix P309X (W/DM 1.4 and SPL 2 wt-% of DM; wrong GA dosage) did not show good
penetration ability (200 ml/100 μm mesh). Marsh values were promising (46-47 s
during 0.5 h). Shear strength of 0.5 kPa was obtained at 5-6 h and 2 kPa at ~7 h.
Bleeding was 0 vol-%.
Mix P308C (W/DM 1.4 and SPL SuperParmix 3 wt-% of DM) was penetrable
(300 ml/100 μm mesh) but quite stiff (Marsh value 47-52 s during 20 min). Shear
strength values 0.5 was obtained at 4-5 h and 2 kPa at ~6 h. Bleeding was good
(0 vol %).
Mix P3B (W/DM 1.6 and SPL 2 wt-% of DM) was penetrable (300 ml/75 μm mesh).
The Marsh value showed descending values during 40 min (from 47 to 38 s), which was
not expected. The shear strength value of 0.5 kPa was obtained at 6 h and 2 kPa at
7-8 h. Bleeding was 0 vol-%.
Mix P3C (W/DM 1.6 and SPL SuperParmix 2 wt-% of DM) showed good fluidity
(40-41 s during 0.5 h) and good penetrability (>300 ml/75 μm mesh). The shear strength
values 0.5 and 2 kPa were obtained at ~7 h and ~8 h. Bleeding was 0 vol-%.
Regarding all results, the mix P308B was chosen to be the most promising mix for
starting the grouting. Mix P307B with lower W/DM was chosen to be a good choice for
continuing grouting in case the grout take would be high.
P307B
30
35
40
45
50
55
60
0:00 0:10 0:20 0:30 0:40 0:50 1:00
Age of the sample (h:mm)
Ma
rsh
flu
idity
(s)
P308B
30
35
40
45
50
55
60
0:00 0:10 0:20 0:30 0:40 0:50 1:00
Age of the sample (h:mm)
Ma
rsh
flu
idity
(s)
Figure 7-2. Marsh fluidity of P307B and P308B in BMT1. Target value is < 45 s.
P307B
0123456789
101112
0:00 1:00 2:00 3:00 4:00 5:00 6:00 7:00 8:00 9:00 10:00
Age of the sample (h:mm)
Sh
ea
r st
ren
gth
(kP
a)
P308B
0123456789
101112
0:00 1:00 2:00 3:00 4:00 5:00 6:00 7:00 8:00 9:00 10:00
Age of the sample (h:mm)
Sh
ea
r st
ren
gth
(kP
a)
Figure 7-3. Strength development of P307B and P308B in BMT1. Target values are 0.5 kPa at 6 h (required) and 2 kPa at 8 h (desired).

49
7.4 Pilot field test 3 – test grouting
7.4.1 Site description
Pilot field test 3 (PFT3) was performed in the ONKALO access tunnel at the tunnel
chainage 502 to 528 (Figure 7-4) at the depth level of about -50 m.
Figure 7-4. Location of the PFT3 in ONKALO access tunnel.
7.4.2 Water penetration tests and flowlog results in probe holes
Four 29 m long probe holes were drilled before grouting. Figure 7-5 shows the location
of the probe holes (PR-holes). Probe holes are being drilled in order to investigate the
rock properties prior to excavation of the tunnel. Hydraulic conductivity measurements
are carried out in the holes; first flowlog measurement (PFL) is done and then water loss
measurement (WLM). The results are used, in addition to overall characterization, for
grouting design. The results of WLM and PFL are shown in Table 7-2, which also gives
the corresponding naming of the probe holes. The water loss measurements were done
with pressure series 0.8-1.2-1.6-1.2-0.8 MPa, each pressure was kept for 5 min. Only
the hole PR0502D could be measured with the flowlog because the other holes were
dry. The probe hole drilling log and flow log measurement records are presented in
Appendices 4 and 5. The probe holes were also grouted during grouting.

50
Figure 7-5. Location of the probe holes.
Table 7-2. Results of water loss measurements (WLM) and flowlog measurements (PFL) in the probe holes. The location of each probe hole in this table refers to their location in Figure 7-5.
PR0502B PR0502C
Outflowing water: dry
PFL: -
WLM: > 4.22 l/(m*min*MPa), the aimed pressures were not obtained; fracture(s) opened during WLM
Outflowing water: dry
PFL: -
WLM: 0.14-0.07-0.07-0.05-0.06 l/(m*min*MPa)
PR0502A PR0502D
Outflowing water: dry
PFL: -
WLM: 0.53-0.45-0.33-0.21-0.21 l/(m*min*MPa)
PFL: 1 water conductive fracture, see Appendix 5
Outflowing water: 2.15 l/min
WLM: 0.79-0.66-0.88-0.52-0.56 l/(m*min*MPa)

51
The need for grouting was clear (WLM > 0.1 Lug). Probe hole B was originally dry, but
water loss measurements showed such high water intake that Lugeon value could not be
calculated and it seemed that fracture(s) had opened. Probe hole D showed significant
water loss and the flowlog indicated the existence of one hydraulically conductive
fracture/zone at the end of the probe hole, at a depth of about 22.3 m (Appendix 5).
There were some problems in measurements, which are explained in Appendix 5. It was
concluded that there was one leaking fracture and its calculated hydraulic aperture was
about 120 μm.
Later it turned out that during the WLM a connection to one drill hole opened under the
pressure and that explains why the hole PR502B was first dry and then showed high
water losses.
If assuming that originally there was one leaking fracture having a T-value 9.6E 7 m2/s
as observed in PFL-measurement made in probe hole D, the inflow into the tunnel
without grouting would have been according to equation (1) below:
min/2.5/56.8
3502ln
/76.9502
ln
2 32
0
lsmEm
msmEm
RR
hTQ
t
(1)
The parameters and assumptions were as follows: Q = water inflow, h = groundwater
pressure expressed as the height of the water column, T = measured transmissivity,
R0= influence radius of the flow which is set as 2h and Rt=tunnel radius (~ 3 m).
However, as described above, WLM-test probably opened fracture(s) in probe hole B
and the inflow would have been higher than based on probe hole D.
7.4.3 Plan for test grouting
The grouting fan included 23 grouting holes, each of them 26 m long (packer depth
1 m). The maximum distance between grouting holes was 2.5 m (Figure 7-6). The
grouting started from the middle of the floor and continued clockwise.
Based on the BMT1, mix P308B was chosen to be the most promising mix to start
grouting with. Mix P307B with lower W/DM was chosen for continuing the grouting in
case the grout take was high. Mix compositions are given e.g. in Table 5-1 and Table
5-2. In the first grouting holes the grout takes turned out to be so high that one mix with
even lower W/DM-ratio was needed and an extra mix P307C was designed in the field.
The mix properties were tested in the laboratory afterwards. This stiff mix was used
only in a couple of grouting holes. Later it turned out that the grout penetrated into a
nearby (~10 m) drill hole.
The left side of the grouting fan was grouted with maximum grouting pressure of 3 MPa
and the right side with maximum 5 MPa pressure.

52
The grouting instruction (grout mixes, mixing orders, grouting pressures and stop
criteria) given to the contractor is shown in Table 7-3.
Figure 7-6. Grouting fan in PFT3.

53
Table 7-3. Grouting pressures, stop criteria and grout mixes in PFT3. LOW PH CEMENT – PFT3
Stip criteria in grouting holes 1 12: Grouting pressure 2.4-3 MPa, grout flow < 2 l/min during 5 min
Stop Criteria 2 in grouting holes 13-23: Grouting pressure 4…5 MPa, grout flow < 2 l/min during 5 min
Note: the water dosing in grout recipes is the real dosing, possible measuring errors are not taken in recipes.
TEST RECIPE 1: P308B, SPL 4 WT-%
Water 67 l
Ultrafin16 40 kg
Mixing 2 min
GroutAid 40 l
Superplasticizer Mighty 150 2.25 l
Mixing 3 min and then mix to agitator
W/DM 1.4
Density 1349 kg/m3 ( 50 kg/m3)
If grout take > 750 l/hole, then to test recipe 2:
TEST RECIPE 2: P307B, SPL 4 WT-%
Water 53.6
Ultrafin16 40 kg
Mixing 2 min
GroutAid 39.6 l
Superplasticizer Mighty 150 2.25 l
Mixing 3 min and then mix to agitator
W/DM 1.2
Density 1396 kg/m3 ( 50 kg/m3)
If grout take > 500 l/hole, then to test recipe 3:
TEST RECIPE 3: P307C, SPL 3.1 WT-% (Designed during grouting due to high grout take)
Water 32 l
Ultrafin16 40 kg
Mixing 2 min
GroutAid 40 l
Superplasticizer Mighty 150 2.25 l
Mixing 3 min and then mix to agitator
W/DM* 0.9
Density* 1490 kg/m3
Grouting stopped if grout take > 500 l/hole
* Calculated afterwards because the recipe was done in the field
7.4.4 Results of technical tests of grout mixes
Water flow meter was checked before grouting and the values to the recipes were
corrected so that the real dosing was correct.
Mix P308B was the starting mix and thus several batches were possible to be tested.
One batch of mix P307B was tested. The technical tests of the extra mix P307C were
not done, because the mix was established in the field due to high grout take in a couple

54
of grouting holes and it was not meant for substantial use. The results of the technical
tests are collected in Appendix 6.
Temperature in the tunnel was 12 ºC and the groundwater temperature was 7 ºC. Fall
cone tests were done in the work site laboratory where the temperature during testing
was 15-20 ºC.
Mix P308B showed Marsh values of 43-49 s, which were not totally satisfying and
poorer than those obtained in the BMT1. The filter pump was malfunctioning and only
two measurements were considered to be more or less reliable. The results were not
good, 240 ml with a 100 μm mesh (uncertain if the pump leaked). Bleeding was
0-1 vol-%, which is good (0-1 vol-% refers to an observation that a thin water layer was
observed, but it could not be measured).
Grouting took place at such a time of day that continuous follow up of the early age
strength development was not possible. Samples were taken from the agitator at
different times so that the gap between measurements done in the evening and in the
morning would be as short as possible. Unfortunately, the gap was during the most
interesting time range and target values are evaluated from Figure 7-7. The shear
strength of 0.5 kPa was possibly obtained at 4-5 h and 2 kPa was obtained at 5 h if
assuming a linear behaviour between 4-10 h.
Compared to the results received from the BMT and the laboratory, Marsh fluidity of
P308B was poorer now. Penetrability was not that good either. Bleeding was the same.
The differences may be explained by 1) more difficult testing conditions than in the
BMT, 2) different temperature, 3) quality differences in cement, 4) malfunctioning of
the test equipment, and/or that 5) the given instructions were not followed accurately
enough. There was also inaccuracy related to the testing methods and the number of
tested batches was limited. Early age strength development seemed to be a little faster
than in the BMT1, but one important reason for that was the higher temperature during
the latter test. The age of the cement is not known.
Mix P307B showed satisfying Marsh fluidity (43 s) and the filter pump test showed
penetrability of 170-300 ml with a 100 μm mesh, the lower value cannot be regarded as
good. Also some uncertainties were associated with these results because of
malfunctioning of the filter pump. Bleeding was 0 vol-%. The shear strength of 0.5 kPa
was obtained at 4:30-5 h and based on Figure 7-8 the value 2 kPa was obtained at ~7 h.
Marsh fluidity of mix P307B was a little better in this test than in the BMT1.
Penetrability was a little worse. There is no difference in the bleeding results and the
development of strength does not differ significantly. The explanations for the
differences in values between the BMT1 and the PFT3 are the same as those described
for mix P308B.

55
P308B - two samples taken at different time
0
1
2
3
4
5
6
7
8
9
10
11
12
0:00 1:00 2:00 3:00 4:00 5:00 6:00 7:00 8:00 9:00 10:00 11:00 12:00 13:00 14:00 15:00
Age of sample (hh:mm)
Sh
ea
r st
ren
gth
(kP
a)
Figure 7-7. Shear strength of mix P308B measured in PFT3. The target is 0.5 kPa at 6 h (required) and 2 kPa at 8 h (desired).
P307B
0
1
2
3
4
5
6
7
8
9
10
11
12
0:00 1:00 2:00 3:00 4:00 5:00 6:00 7:00 8:00 9:00 10:00 11:00 12:00 13:00 14:00 15:00
Age of sample (hh:mm)
Sh
ea
r st
ren
gth
(kP
a)
Figure 7-8. Shear strength of mix P307B measured in PFT3. The target is 0.5 kPa at 6 h (required) and 2 kPa at 8 h (desired).

56
7.4.5 Drilling of grouting holes
During drilling of the grouting holes observations of rock quality, fracturing and water
leakage were made (Appendix 7).
Soft rock quality was observed in hole 8 at the depth of 9-14 m. Joints were observed in
almost all grouting holes and they were located at every depth along the holes, but
mainly concentrated behind the hole depth of about 20 m. Crushed rock was observed in
holes 2, 5, 6, 17 and 22. Most of the holes were dry, but many of them leaked
1-10 l/min. Observations during drilling of the grouting holes refer to that more water
conductive fractures could be present.
7.4.6 Results of the grouting
The total grout take in the fan was about 15 m3 (21 l/borehole-m; Table 7-4), which is
within the typical range of the ONKALO access tunnel (10-20 m3 per grouting fan).
Also the grout take in different holes did not vary remarkably from that elsewhere in the
ONKALO access tunnel. Grouting logs are presented in Appendix 8.
In grouting holes 1 and 2 the grout flowed to nearby borehole (distance about 10 m)
OL-KR34 (Volume 460 l). This was noticed as the grout extruded to the ground surface
via a borehole. The volume of this “extra grout” was estimated to be about 450-1 000 l,
which is 3 7% of the total grout take. The total amount of cement was 5319 kg and the
total amount of microsilica slurry was 7429 kg and superplasticizer Mighty 150 was
consumed 377.7 kg.
The grouting was begun with mix P308B in every hole. If the grout take was more than
750 l/hole, grouting was continued with mix P307B. In the case of very high grout take
in a couple of holes the rest of the grouting was done with mix P307C. The total intake
of mix P308B was about 10 600 l, of mix P307B about 4 000 l and of mix P307C about
500 l.
The average grout take in the holes grouted with lower pressure (2.4-3 MPa, measured
average 2.6 MPa) was 22 l/borehole-m, about the same as in the holes grouted with
higher pressure (4-5 MPa, measured average 3.5 MPa). The different sides cannot be
compared because one side was grouted first which naturally had an effect on the other
side.
The grout take, grouting pressure and time are gathered in Table 7-4. Detailed grouting
information from each hole is gathered in Appendix 9.

57
Table 7-4. Grout takes, grout mixes and grouting pressures. Grout takes includes the amount of grout in grouting hole (about 57 l in each hole).
Hole Mix* Closing pressure
(MPa)
Average pressure
(MPa)
Max. meas. pressure
(MPa)
Grouting time
(hh:mm:ss)
Grout take (l)
Vol./bore-hole-m (l/m)
Cement
/borehole-m (kg/m)
1 1+2+3 3 2.7 3.4 2:07:08 1344.8** 53.8 18.4
2 1+2 3 2.6 4.4 1:55:23 1566.9** 62.7 20.4
3 1 3 2.9 4.0 0:57:23 184.2 7.4 2.3
4 1 3 3.5 8.2 0:54:51 335.3 13.4 4.2
5 1 3 3.2 3.7 0:18:50 36.6 1.5 0.5
6 1 3 2.5 3.6 0:27:40 88.5 3.5 1.1
7 1+2 3 2.1 3.5 2:11:52 966.3 38.7 12.5
8 1 3 2.4 3.3 0:19:51 110.5 4.4 1.4
9 1 3 2.4 3.5 1:44:11 331.9 13.3 4.2
10 1+2 3 2.4 2.8 2:24:51 771.9 30.9 9.8
11 1 3 2.4 3.0 0:30:00 146.4 5.9 1.8
12 1 3 1.4 3.0 0:07:10 56.8 2.3 0.7
13 1+2 3 3.9 4.5 2:35:41 1147.8 45.9 15.0
14 1 5 4.1 4.6 0:04:01 4.2 0.2 0.04
15 1 5 4.3 4.5 0:07:50 14.6 0.6 0.2
16 1+2 5 3.4 4.3 1:39:53 931.6 37.3 12.0
17 1+2 5 3.8 4.7 2:29:43 1179.0 47.2 15.5
18 1 5 3.1 4.9 0:05:50 59.5 2.4 0.8
19 1+2+3 5 2.6 4.7 4:59:16 1792.4 71.7 26.2
20 1+2+3 5 2.9 5.0 3:57:14 1585.9 63.4 22.5
21 1 5 4.3 8.4 0:11:20 6.3 0.3 0.1
22 1 5 3.2 5.3 0:09:40 55.4 2.2 0.7
23 1 5 3.9 4.8 1:46:23 622.2 24.9 11.0
PR0502A 1 5 4.5 4.7 0:05:30 1.1 0.0 0.0
PR0502B 1+2+3 5 1.8 3.1 3:56:12 1559.7 55.7 21.0
PR0502C 1 5 3.6 5.0 0:15:11 38.2 1.4 0.5
PR0502D 1 5 4.3 4.7 0:29:50 111.9 4.0 1.4
Average 1:21:57 557.4 21.9 7.6
Total 15049.9
**
*Mix 1 = P308B, Mix 2 = P307B and Mix 3 = P307C; which was designed during the test.
**Grout extruded to the ground surface via borehole KR34. The amount of this “extra grout” is estimated to be about 450-1 000 l.
A summary of the drilling observations and grout takes in different grouting holes is
presented in Table 7-5. In six holes the grouting hole did not leak although the grout
take was considerable. If a grouting hole leaked, the grout take varied a lot. There was
only one hole where crushed rock was observed and it leaked and at the same time the
grout take was considerable. The observations cannot be directly coupled to grout take,
but it should be noted that grouting order has an effect on grout take.
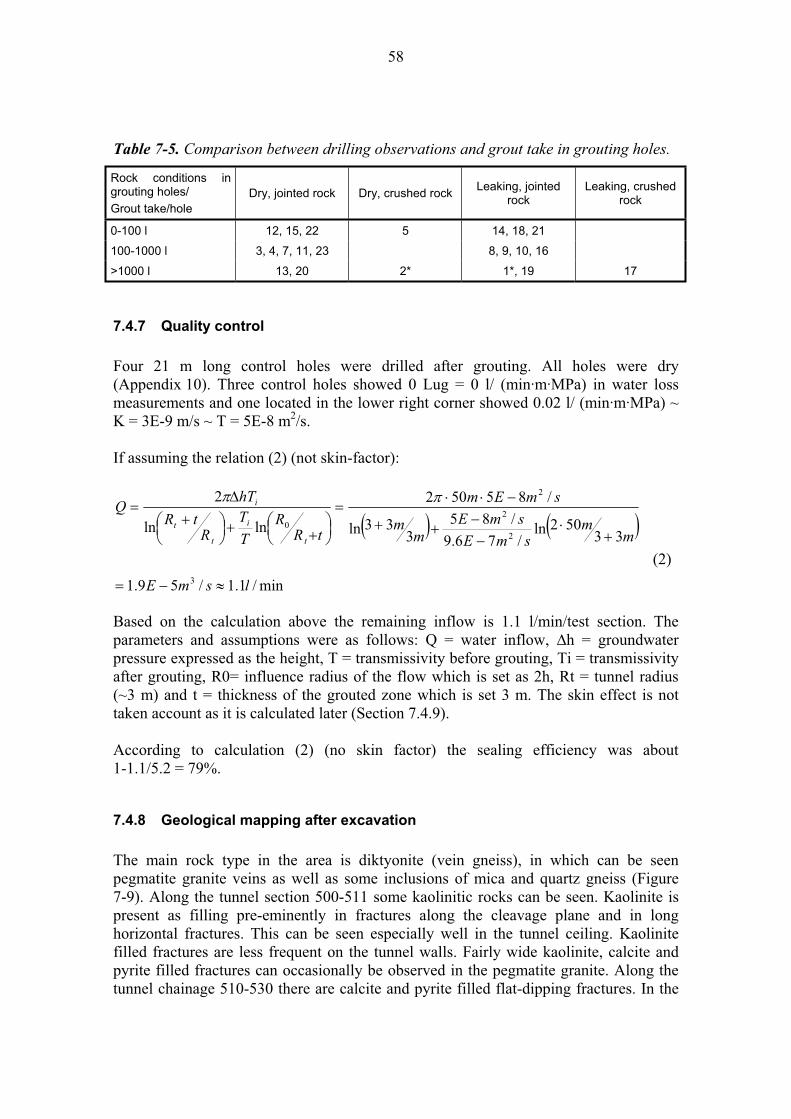
58
Table 7-5. Comparison between drilling observations and grout take in grouting holes.
Rock conditions in grouting holes/
Grout take/hole Dry, jointed rock Dry, crushed rock
Leaking, jointed rock
Leaking, crushed rock
0-100 l 12, 15, 22 5 14, 18, 21
100-1000 l 3, 4, 7, 11, 23 8, 9, 10, 16
>1000 l 13, 20 2* 1*, 19 17
7.4.7 Quality control
Four 21 m long control holes were drilled after grouting. All holes were dry
(Appendix 10). Three control holes showed 0 Lug = 0 l/ (min·m·MPa) in water loss
measurements and one located in the lower right corner showed 0.02 l/ (min·m·MPa) ~
K = 3E-9 m/s ~ T = 5E-8 m2/s.
If assuming the relation (2) (not skin-factor):
min/1.1/59.1
33502ln
/76.9
/85
333ln
/85502
lnln
2
3
2
2
2
0
lsmE
mm
smEsmE
mm
smEm
tRR
TT
RtR
hTQ
t
i
t
t
i
(2)
Based on the calculation above the remaining inflow is 1.1 l/min/test section. The
parameters and assumptions were as follows: Q = water inflow, h = groundwater
pressure expressed as the height, T = transmissivity before grouting, Ti = transmissivity
after grouting, R0= influence radius of the flow which is set as 2h, Rt = tunnel radius
(~3 m) and t = thickness of the grouted zone which is set 3 m. The skin effect is not
taken account as it is calculated later (Section 7.4.9).
According to calculation (2) (no skin factor) the sealing efficiency was about
1-1.1/5.2 = 79%.
7.4.8 Geological mapping after excavation
The main rock type in the area is diktyonite (vein gneiss), in which can be seen
pegmatite granite veins as well as some inclusions of mica and quartz gneiss (Figure
7-9). Along the tunnel section 500-511 some kaolinitic rocks can be seen. Kaolinite is
present as filling pre-eminently in fractures along the cleavage plane and in long
horizontal fractures. This can be seen especially well in the tunnel ceiling. Kaolinite
filled fractures are less frequent on the tunnel walls. Fairly wide kaolinite, calcite and
pyrite filled fractures can occasionally be observed in the pegmatite granite. Along the
tunnel chainage 510-530 there are calcite and pyrite filled flat-dipping fractures. In the

59
ceiling the thickness of fracture filling is centimetres, on the walls no equivalent filling
thickness has been observed. The gneiss inclusions and stripes (mica gneiss, quartz
gneiss) are homogenous, fine-grained inclusions inside the diktyonite. Cleavage in the
inclusions is systematic and two to three fracture directions can often be recognised.
Figure 7-10 presents the fault intersections.
No observations of channelling of flow paths were reported in combination with
mapping. Neither was any clear leakage of water observed. Naturally there is a large
variation in fracture length, the longest fracture being 20 m and the shortest about
10 cm, mean length is slightly over 2 m. Fracture filling thickness also varies, with the
mean value being about 1.8 mm.
There are two main fracture directions in the area. Furthermore there is an abundance of
random fractures. Of the main fracture directions the stronger is almost horizontal and
dipping to the southwest (Set1). The second (Set2) main fracture direction falls to the
southeast, in the direction of the rock schistosity. From the random fracturing one
direction stands out fairly well, it is almost vertical in the north-south direction (Set3)
(Table 7-6 and Figure 7-11).
Along the tunnel sections 516.10-517.20 m and 521.50-523.00 m (latter observed also
with the Flowlog) there are two clear, almost vertical fracture zones, which both have
slickenside surfaces. In the first zone the main fracture direction is 233 and the dip is
79. In the second zone the direction is 284 and the dip 89. Fracture filling thickness
varies between about 1-30 mm. Filling minerals are mainly chlorite, calcite, pyrite and
kaolinite.
Figure 7-9. Geological conditions in the test area. Lithology along the tunnel section 500-530 m. VGN means diktyonite, MGN is mica gneiss or quartz gneiss and PGR is pegmatite granite. The lightly shaded area on the left is clearly more altered than the surrounding rock, largely kaolinitic diktyonite.

60
Figure 7-10. Geological conditions in the test area. Brittle fault intersections (grey) and single shear fractures (line) along the test area (PL= Tunnel Chainage (m)).
Table 7-6. The main fracture directions along tunnel section 500-530.
Tunnel chainage (TC)(m)
Set 1 Set 2 Set 3
500-530, all fractures 209/14 155/43 258/86
Figure 7-11. Main fracture directions along tunnel section 500-530. All fractures have been taken into account in the interpretation.
From the fracture surfaces roughness and alteration factors were mapped in order to
determine the Q-classification. The main parts of the fractures are wavy and rough.
Along the tunnel interval 500-530 fracturing is fair. The RQD value varies between 70
and 95 (Table 7-7).

61
Along the chainage section 500-530 reports of fractures filled with grouting cement are
few. Grout has been reported only from tunnel sections 510-515 and 520-530 (see
Figure 7-12 and Table 7-8), in total 14 fractures. Both sections have 7 fractures with
pre-grouting cement as fracture filling. The thickness of the cement has not been
separately measured as the filling thickness coincides with the total fracture width.
Table 7-7. Rock quality of the ONKALO tunnel along the tunnel chainage (TC) 500 530.
TC (m) RQD Jn Jr Ja Jw SRF Q Quality
500-505 70 3 2 3 1 1 15.56 Good
505-510 90 6 2 3 1 1 10 Fair
510-515 95 6 2 3 1 1 10.56 Good
515-520 90 6 2 4 1 1 7.5 Fair
520-530 85 6 2 4 1 1 7.08 Fair
Fracture fillings in tunnel section chainage 500-530
0 %
20 %
40 %
60 %
80 %
100 %
PL500-505 PL505-510 PL510-515 PL515-520 PL520-525_vasen seinä PL520-530
BT CC EP GR HE IM IL KA KL KM KV MK MS MU SK SR SV None
Figure 7-12. Distribution of fracture minerals. Biotite (BT), calcite (CC), epidote (EP), graphite (GR), hematite (HE), pre-grouting cement (IM), illite (IL), kaolinite (KA), chlorite (KL), K-feldspar (KM), quartz (KV), pyrrhotite (MK), feldspar (MS), muscovite (MU), pyrite (SK), sericite (SR), clay mineral (SV) and none (no observable mineral).

62
Table 7-8. Fractures with pre-grouting cement filling along the tunnel section 500-530. VGN means diktyonite and PGR is pegmatite granite. Biotite (BT), calcite (CC), grouting cement (IM), kaolinite (KA), chlorite (KL) and pyrite (SK).
Tunnel chainage (m)
Fracture length (m)
Fracture type
Dip. Dir. Filling thickness
(mm)Fracture minerals
Rocktype
510-515 1.5 USM 11 013 0.3 IM,CC,KA PGR
510-515 1.5 USM 11 013 0.3 IM,CC,KA PGR
510-515 8 USM 10 121 20 CC,SK,IM PGR
510-515 2.5 USL 69 236 2 CC,IM,KL PGR
510-515 2.5 USL 69 236 2 CC,IM,KL PGR
510-515 8 USM 22 343 20 CC,IM,KL,SK VGN
510-515 1.7 USM 17 339 2 CC,IM,KL,SK VGN
520-530 2.48 URO 44 142 4 IM,CC VGN
520-530 0.9 USM 30 259 1 CC,KL,IM VGN
520-530 1.1 PSM 29 334 1 CC,IM,KL VGN
520-530 3.6 USM 39 004 1,5 KA,IM,KL VGN
520-530 1.3 URO 03 202 2 CC,IM,KA,SK VGN
520-530 1.3 URO 03 202 2 CC,IM,KA,SK VGN
520-530 10 USM 15 177 20 CC,KL,BT, SK,IM
VGN
7.4.9 Leakage water inflow after excavation
The leakage water inflow has been mapped three times (Figure 7-13 and Figure 7-14).
After excavation the PFT3 tunnel section was mainly dry but a few small damp areas
were observed. There were no dropping or leaking points. After rock bolting more damp
areas were observed. However, the tunnel part grouted with test grout is at least as dry
as other parts in the tunnel.
The measured inflow into ONKALO between tunnel chainage 0-580 (1. measuring
weir) is 1.7 l/min/100 m, which is ~0.4 l/min/25 m (= the length of the tested tunnel
section) if assuming similar remaining inflow overall in the tunnel. This means that the
observed leakage water inflow was according to the target inflow for ONKALO
(1-2 l/min/100 m) is less than calculated (Section 7.4.7).
The water inflow into the tested tunnel section without grouting was estimated to be
~ 5.2 l/min (or even more). This means that the sealing efficiency has been
approximately 1-0.4/5.2 ~ 92% (or more).
The calculated leakage water inflow (Section 7.4.7) becomes the same as observed
leakage water inflow if using skin effect value ~1.5 in the denominator.
Most water conductive fracturing was observed at the end of the grouted section (tunnel
chainage about 525). This part seems to be the driest.

63
Figure 7-13. Mapped leakage water inflow in the PFT3 area, marked with a red dashed circle, and in ONKALO.

64
Figure 7-14. Mapped leakage water inflow in the PFT3 area, marked with red dashed circle, and in ONKALO.
7.5 Batch mixing test 2
The second batch mixing test (BMT2) was arranged after the PFT3, because there were
problems with functioning of the test equipment and the testing conditions down in the
tunnel during grouting are usually difficult. The other interest was to see the effect of
temperature on the results. In the BMT2, the test grouts were mixed with a full scale
grouting mixer in field conditions and technical properties were measured. The tested
properties were fluidity by Marsh funnel, bleeding by measuring glass and early age
shear strength by fall cone. Unfortunately the filter pump broke again and no results
were obtained. Outside temperature during testing was 18-21 ºC.
Mixes P307, P307B, P308 and P308B were tested and all results are presented in
Appendix 11.
P307 and P307B (W/DM 1.2, SPL 3 and 4 wt-%) showed good Marsh values. The
Marsh value immediately after mixing was 37 s and at the age of 30 min again 37 s.
Bleeding was 0 vol-% for both mixes. Early age shear strength results are presented in
Figure 7-15.
P308 (W/DM 1.4, SPL 3 wt-%) showed Marsh values 36 s immediately after mixing
and at the age of 30 min. P308B (W/DM 1.4, SPL 4 wt-%) showed Marsh values of 35 s

65
immediately after mixing and at the age of 30 min. Bleeding was 0 vol-% for both
mixes. Early age shear strength results are presented in Figure 7-15.
For measuring the early age shear strength the samples were stored in a refrigerator
where the temperature varied between 7-14 ºC. Mix P307 achieved the required shear
strength (0.5 kPa) at the age of about 4:30 h and 2 kPa at the age of about 8 h. P307B
achieved 0.5 kPa at the age of about 5 h and 2 kPa at the age of about 7 h. P308
achieved 0.5 kPa at the age of 5:30 h and 2 kPa at the age of about 7 h. P308B achieved
0.5 kPa at the age of about 5:30 and 2 kPa at the age of about 7:30 h.
The BMT2 showed good Marsh values for all tested mixes. All Marsh values were
better than in the BMT1 and in PFT3. Early age shear strength and bleeding were also
satisfying. Unfortunately the penetrabilities could not be measured.
The tests indicated that the higher the water to dry material ratio was the better fluidity
the mix had. Also it was seen that the higher the SPL content was, the better the fluidity
was. However, the differences were quite small.
The smaller the W/DM was the quicker the strength development. The SPL seems to
delay the early age strength development a little.
P307: Shear strength (kPa)
0
1
2
3
4
5
6
7
8
9
10
0:00 1:00 2:00 3:00 4:00 5:00 6:00 7:00 8:00 9:00 10:00
Age of the sample (h:mm)
Shea
r st
reng
th (
kPa)
P307B: Shear strength (kPa)
0
1
2
3
4
5
6
7
8
9
10
0:00 1:00 2:00 3:00 4:00 5:00 6:00 7:00 8:00 9:00 10:00
Age of the sample (h:mm)
Shear
str
eng
th (
kP
a)
P308: Shear strength (kPa)
0
1
23
4
5
6
78
9
10
0:00 1:00 2:00 3:00 4:00 5:00 6:00 7:00 8:00 9:00 10:00
Age of the sample (h:mm)
Shear
str
engt
h (
kP
a)
P308B: Shear strength (kPa)
0
1
2
3
4
56
7
8
9
10
0:00 1:00 2:00 3:00 4:00 5:00 6:00 7:00 8:00 9:00 10:00
Age of the sample (h:mm)
Shea
r st
reng
th (
kPa)
Figure 7-15. Early age shear strength of the mixes tested in BMT2. Required target was 0.5 kPa at 6 h and desired target was 2 kPa at 8 h.

66
7.6 Summary and conclusions of pilot field test 3
Several mixes were tested for technical performance in the BMT1. Out of tested mixes
P307 (W/DM=1.2 and SPL 3 wt-%), P307B (W/DM=1.2 and SPL 4 wt %), P308
(W/DM=1.4 and SPL 3 wt-%), and P308B (W/DM=1.4 and SPL 4 wt-%), stood out to
be the most promising. P307 and P307B were penetrable with 100μm mesh and P308
and P308B with 75μm mesh. Marsh values of P307 and P307B were not within desired
limits, but for P308 and P308B they were good. Bleeding was good for all of the mixes.
P307 and P307B were a bit faster and the early age strength development was within
targets. For P308 and P308B the aimed early age strength development was nearly
reached. The temperature was about 5-10 °C. Regarding all results mix P308B and mix
P307B were chosen to be used in test grouting in the ONKALO tunnel.
One grouting fan was grouted with the test mixes. The mixes were tested for technical
properties. P308B was the starting mix, and if grout take was high, then the grouting
would be continued with mix P307B.
Mix P308B showed poorer Marsh values than in the BMT1, but not unacceptable. Filter
pump results were not reliable. Early age shear strength was good. Mix P307B showed
better Marsh fluidity than P308B and better than in the BMT1. Uncertainties were again
related to the penetrability results. Early age shear strength was satisfying. Bleeding was
good for both mixes. A third extra mix was developed during the grouting due to very
high grout take in two grouting holes, but it was not tested.
The total grout take in the fan of 23 grouting holes was 15 m3. Out of this about
450-1000 l penetrated into the nearby investigation hole 10 m away. Based on the
results obtained from probe holes and the grouting holes the water inflow into the tested
tunnel section would have been several to tens of litres per minute. Quality control holes
showed that the excavation could be continued. After excavation, small moist or damp
areas were observed but it seemed that most of the leakages were sealed and the
grouting could be regarded successful. After rock bolting more damp areas were found,
but still the grouting result is at least as good as elsewhere in the ONKALO tunnel.
The BMT2 was arranged to verify the results of the technical tests because uncertainties
were related to the testing conditions and functioning of the equipment. Marsh values
were good for all mixes. All Marsh values were better than in the BMT1 and in PFT3.
The early age shear strength and bleeding were also satisfying. Unfortunately, the
penetrabilities could not be measured, because the filter pump was broken.
The fluidity was tested for the most promising mixes (P308B and P307B) three times in
the field. The results varied so much that more tests in the field are recommended in
order to get a good picture of the mixes. Marsh fluidity values were often in target
ranges but not always. Penetrability results were often problematic to get in the field,
and more field tests are needed. Bleeding was always good and early age strength
development seems to be satisfying for the most promising test mixes.

67
7.7 Observations from monitoring of the effect of the low-pH cement on groundwater chemistry
In order to monitor the effect of cement on the groundwater chemistry four boreholes
(ONK-KR1…ONK-KR4) were drilled in August 2005 in ONKALO (Rautio, 2005).
The monitoring boreholes represent grouted areas of different ages, different grout-take
and different cement mixes (Table 7-9). The borehole ONK-KR3 was drilled in the
PFT3-area and it represents groundwater in low pH cementitious environment. The
proper location and direction of the holes, where fractures and grout are expected to
occur in fractures, was decided based on the WLM from the probeholes, drilling of the
grouting holes and grout take. Also observations from the rock surface in the tunnel
were used.
The first groundwater station ONK-PVA1 (length 26.30 m) in “native ungrouted rock”
at TC (m) 200 was also drilled in August, and is included in the same monitoring and
sampling programme as the cement monitoring boreholes.
Drill cores samples of the boreholes were mainly unweathered or from unweathered to
slightly weathered. Fractures in drillcores were mostly filled. Grout observations as
fracture infill in drill cores are limited to boreholes ONK-KR3 and -KR4. Kaolinite,
calcite and sulphides are the most common fracture infilling minerals in all of these
boreholes also in ONK-PVA1, though in ONK–KR2 calcite is observed only once.
Chlorite observations are also rather common (Rautio, 2005).
Table 7-9. Boreholes for monitoring of cement (Ahokas et al. 2005). Tunnel chainage
(m)
Date of grouting*/Cement and SPL used in grout mix
Cement-take (kg)**/grouting hole-m
Cement take (tons) **/ fan
Monitoring borehole length (m)
ONK-KR1 11023.11.04/ UF16+SetControl II
9.7 6.7 12.4
ONK-KR2 375 11. -18.4.05/
UF16+SP40 19.7 or 16.2 13.1 or 9.2 15.5
ONK-KR3 515
6. -7.6.05/
Low-pH cement
UF16+GroutAid+ Mighty 150
7.7 5.3 10.7
ONK-KR4 540 13. -21.6.05/
UF16+GroutAid+ SP40
10.1 or 2.3 6.4 or 2.3 11.7
*If a date is given as a range of about one week, the effects of grouting can possibly originate from two different grouting fans and it is not possible to determine which one.
** If the grout can originate from two alternative grouting fans, both grout takes are presented.

68
The daily monitoring of the boreholes for water inflow rate, pH, temperature and
electrical conductivity (EC) started within a few days after drilling. Based on the flow-
log observations and fracture mapping the boreholes were packed off in September-
October and dummies installed in the sections to reduce volume and to get the most
representative water volume. Complete chemical analyses of the waters were done at
four occasions during August-December, 2005. The flow rate in the boreholes has
varied along the monitoring periods, and boreholes have been occasionally dry. The
reason for the fluctuations in the flow is not known; these might be due to different
operations performed in ONKALO during the construction work or due to some
operations in the nearby boreholes.
Observations
The effect of cement was seen as elevated pH values in ONK-KR3 and ONK-KR4, very
soon after starting the monitoring (Figure 7-16). The low-pH cement monitoring
borehole ONK-KR3, shows more significant decrease with time than the later with
normal cement grouting. The decrease in pH cannot be explained by variable flow
conditions; hence it should be caused by the availability of hydroxide sources (Ca(OH)2,
etc.). Cement was observed in the drill cores of these most recently grouted boreholes.
These boreholes also represent the lowest flow rate of the monitoring boreholes.
Boreholes ONK-KR1 and ONK-PVA1 show values without cement influence typical to
“native” groundwaters in shallow bedrock at Olkiluoto (Pitkänen et al. 2004). EC values
seem to change with pH for the boreholes. The decrease of EC in the boreholes ONK
KR3 and –KR4 may partly result from decreasing pH. At the end of monitoring the EC
values increase with the depth of the monitored boreholes except in ONK-KR3, which
may also reflect direct connection to the surface.
As compared to the native groundwater the high pH samples from ONK-KR3 and
ONK-KR4 show a lower Mg, DIC and silica content in general and higher K, NH4 and
Ca, particularly in the case of ordinary cement (ONK-KR4). These may be explained by
precipitation reactions, e.g., Ca, Mg and DIC or dissolution and ion exchange, e.g. K,
NH4. Silica may be precipitated in cement grout. Dissolved organic content (DOC)
does not deviate from the usually found DOC in the shallow bedrock at Olkiluoto. Thus,
the influence of the eventual contamination due to organics introduced during
construction, such as any cement additives cannot be estimated based on the results
available so far.
The first observations based on ONK-KR3 and –KR4 suggest that, as would be
expected, pH decreases more efficiently in low pH grout environment than in the case
with ordinary cement. However a number of uncertainties influence the overall
interpretation (Ahokas et al. 2006), such as divergent chemical evolutionary paths for
the monitored sections, partly influence of cement and partly normal hydrogeochemical
evolution due to variable flow paths (passing or in contact with cement) and the time
frame for cement-water interaction. Also, buffering processes, e.g., alteration of silicates
or the neutralising of carbonic acid in groundwater need to be encountered.

69
Figure 7-16. Temporal variation of a) flow rate, b) pH and c) EC since the start of grouting in monitored boreholes at ONKALO. Days refer time after grouting of each borehole. Groundwater samples with complete chemical analyses have been taken at four occasions in Augus-December 2005 (Ahokas et al. 2006).

70

71
8 SUMMARY OF P308B MATERIAL PROPERTIES MEASURED IN THE LABORATORY AND IN THE FIELD
The results of mix P308B, which is the most promising low pH cement mixture for the
moment, are gathered in Table 8-1. Mix P308B has SF/PC 0.69, W/DM 1.4 and
naphtalene sulphonate SPL 4 wt-%. From long-term safety point of view this SPL is
considered the less harmful than the other types of SPLs.
The pH, which is the most important property together with penetration ability, of the
mix is as targeted (pH <11 in the leachate). Penetration ability, measured by
penetrability meter, is significantly better than the set target. Penetration ability was
characterised also in field by filter pump (only once the results can be regarded reliable,
because the pump got broken two times) and the result was better than the target.
Viscosity was measured by rheometer and obtained values were better than the target.
Marsh fluidity was as targeted when measured right after mixing. Instead, twice (out of
four determinations) it has been poorer than targeted at 30 or 60 min. Marsh values
obtained in field have been better than those obtained in the laboratory.
Early age strength development has been as targeted, but a couple of times very
narrowly above the set target value. Shear strength at 6 h was better in the laboratory
than in field tests. Bleeding has been as targeted every time. Also measured
compressive strength (28d) was as targeted.
The only property that is not as targeted is the yield stress values of the mix P308B.
This property has also an influence on Marsh values (not always as targeted).
The overall behaviour of mix P308B has been satisfying and the used SPL is less
harmful than the other ones. Mix P308B is recommended for further testing in field.
However, the laboratory tests have indicated that cement age, cement consignment,
mixer type etc. seems to have an effect on technical properties. Further testing is
recommended in order to verify the target properties can be obtained repeatedly.

72
Table 8-1. Target values for different grout properties and results of mix P308B obtained in the laboratory, BMTs and PFT3. Target properties are not in an order of importance.
Property Target value Laboratory BMT1 PFT3 BMT2
pH 11.0 ALL-MR < 11
OL-SR < 10 -
< 11 after 3 months
-
penetration ability
bmin/bcrit (μm) 80 / 120 40/88 - - -
penetration ability
filterpump (ml)
300
(100 μm) -
300
(75 μm) ? ?
Viscosity (mPas) 50 10.9-15.3 - - -
Marsh-fluidity (s) 45 44/61* 39/41** 43/49** 35/35**
Shear strength at
6 h (Pa) 500 1100 ~ 500 ? > 500
Shear strength at
8 h (Pa) 2000 - ~ 2000 ? > 2000
Bleeding (vol-%) 2 < 1 0 < 1 0
Yield value (Pa) 5 12.1–13.8 - - -
Compressive strength 28d (MPa)
4 17
* at 60 min**at 30 min ? results uncertain- not measured

73
9 CONCLUSIONS
Based on the outcome from the SKB-Posiva-NUMO joint project “Injection grouts for
deep repositories” Posiva continued the optimisation of Portland cement + microsilica +
superplasticizer –mixes in the LPHTEK-project during 2005. The work comprised of
laboratory studies, two batch mixing tests in field conditions, the third pilot field test
and monitoring of the test area.
The objective of the laboratory tests was to improve the properties of the mix P3
developed earlier. The superplasticizer was changed to one, which is considered less
harmful with respect to long-term safety. The water/dry material-ratio and the contents
of microsilica and superplasticizer were varied and the behaviour of the mixes was
observed in the laboratory. Basic properties (Marsh fluidity, early age shear strength,
bleeding) were systematically tested. The poor mixes were abandoned and promising
mixes were tested more comprehensively (penetration ability by penetrability meter
etc).
Several mixes showed promising results and one mix, P308B (SF/PC=0.69, W/DM 1.4,
naphtalene sulphonate SPL 4%) met the targets, except that set for yield stress. pH,
penetration ability and viscosity were very good. Early age shear strength was
satisfying. Cement consignment, age of the cement, age of the microsilica, mixer type
and temperature possibly have an effect on results, but these were not possible to study
in this project in detail. The improved composition of the mix stabilises the leachates
pH-values as well as somewhat lowers them. The pH value, which is the most important
property together with the penetration ability, of mix P308B is reflected in the leachate
pH values which were just below the target value of 11 in the fresh leachate (ALL-MR)
and clearly below in the saline leachate (OL-SR), <10. The pH values of leachate
samples also quickly reached a stable level and the release of several substances
appeared rather congruent compared with the corresponding results for mix f63 in
earlier tests. The results on alkalinity gave reason to suspect that some SPL was released
especially at the beginning of testing and was supported by the results of a few trial
analyses of TOC. In the laboratory tests mix P308B turned out to be most promising
mix to be tested in the field. Also a few other mixes were proposed for field tests.
Before the actual pilot field test 3, a batch mixing test was arranged in field conditions
(T = 5-10 ºC). A few mixes were made with a full-scale grouting mixer and tested for
technical properties. All mixes showed promising behaviour and mix P3080B was in
accordance with targets. Two mixes (P308B and P307B) were selected for test grouting.
In the pilot field test 3 arranged in ONKALO access tunnel (T = 7-11 ºC/15-20 ºC), one
fan was grouted with test mixes. The sealing efficiency was >90% and small moist areas
and minor leakages were observed after grouting. Grouting cement was observed in
several fractures. Testing of technical properties showed practical problems due to
testing conditions and device failure. A second batch mixing test (T= 20 ºC) was
arranged in order to verify the mix properties. Marsh fluidity, bleeding and early age
shear strength was satisfying for P308B. Penetrability was not obtained.

74
After excavation one borehole was drilled in the pilot field-test 3 area through the
grouted zone, and groundwater sampling has been carried out. As expected, pH
decreases more efficiently in low pH grout environment than in the case with ordinary
cement.
Mix P308B has shown behaviour as targeted, except yield stress, and the mix is
recommended for further studies in the laboratory and in the field to get a more
comprehensive idea of variations in its behaviour. The question, if the target properties
can be reached repeatedly in varying circumstances remains open and it is
recommended to study it in future. There should be a good understanding of typical
variation of all mix properties.
The target values were set in order to reach groutable material. However, some practical
problems in e.g., testing schedule and comparison of the results at different testing times
and conditions arose. It is recommended that all target properties be revised so that they
can be measured in a similar way and at similar sample age in the laboratory and in the
field. This enables better comparison between the results and the targets, as well as
comparison between the results obtained in the laboratory and in the field. Further, the
targets were set assuming a need for one basic mix. In reality mixes having different
properties are possibly needed in varying rock conditions. Thus it is recommended to
check if the requirements could be different for a couple of grout types to be used in
different rock scenarios (open fractures, small fractures). Also several low pH recipes
can be developed for varying purposes.

75
REFERENCES
Ahokas, H., Ahokas, T., Hansen, J., Hellä, P., Koskinen, L., Koskinen, K., Lehtinen, A.,
Löfman, J., Marcos, N., Meszàros, F., Partamies, S., Pitkänen, P., Sievänen, U.,
Snellman, M. & Vieno, T. 2006.Control of Water Inflow and Use of Cement in
ONKALO after Penetration of Fracture Zone R19. Posiva Report 2006 XX. To be
published.
Bodén, A. & Sievänen, U. 2005. Low-pH injection grout for deep repositories.
Summary report from a co-operation project between NUMO (Japan), Posiva (Finland)
and SKB (Sweden). Svensk Kärnbränslehantering AB, Stockholm, Sweden. Report
R 05-40.
BY1, 1972. Technical code. The Concrete Association of Finland (In Finnish).
Eriksson, M., Friedrich, M. & Vorschulze, C. 2004. Variations in the rheology and
penetrability of cement-based grouts - an experimental study. Cement and Concrete
Research 34, 1111-1119.
Hakanen, M. & Ervanne, H. 2006. The influence of Organic Additives on Radionuclide
Mobility. A literature Survey. Posiva Oy, Olkiluoto, Finland. Working Report 2006-06.
Kronlöf, Anna. 2005a. Injection Grout for Deep Repositories - Low-pH Cementitious
Grout for Larger Fractures: Testing technical performance of materials. VTT Building
and Transport 2005. Working report 2004-45.
Kronlöf, A. 2005b. Injection Grout for Deep Repositories – Low pH Cementitious
Grout for Larger Fractures: Testing Effect of Superplasticizer on Technical
Performance. Posiva Oy, Olkiluoto, Finland. Working report 2005-08.
Rautio, T. 2005, Core Dilling of Boreholes ONK-KR1, ONK-KR2, ONK-KR3,
ONK-KR4 and ONK-PVA1 in ONKALO at Olkiluoto 2005, Posiva Working Report
2005-66.
Sievänen, U. Syrjänen, P. & Ranta-Aho, S. 2005. Injection Grout for Deep Repositories.
Low pH Cementitious Grout for Larger Fractures. Subproject 3: Field Testing in
Finland, Pilot Tests. Posiva Oy, Olkiluoto, Finland. Working Report 2004 47.
Vuorinen U., Lehikoinen, J., Imoto, H., Yamamoto, T. & Cruz Alonso, M. 2005.
Injection Grout for Deep Repositories, Subproject 1: Low pH Cementitious Grout for
Larger Fractures, Leach Testing of Grout Mixes and Evaluation of the Long Term
Safety. Posiva Oy, Olkiluoto, Finland. Working Report 2004-46.

76

77
APPENDIX 1: RHEOLOGY RESULTS BY VTT

78

79

80

81
AP
PE
ND
IX 2
: L
AB
OR
AT
OR
Y R
ES
UL
TS
Inje
ctio
n g
routs
of
Posi
va 2
005,
labora
tory
test
ing
Te
stin
g a
t C
on
test
a O
y, R
aja
torp
an
tie 8
C,
PL
23
, F
IN-0
16
01
Va
nta
a,
tel.
+3
58
9 2
52
5 2
44
1,
gsm
+3
58
50
38
7 2
44
1,
fax
+3
58
9 2
52
5 2
42
6,
ww
w.c
on
test
a.f
i
Mix
co
mposi
tions
W/D
Mper
We
igh
tto
tal
Wa
ter
Dry
mat
Of
dry
ma
teria
ls
Of
dry
m
ate
ria
lsC
em
en
tC
em
en
tG
A d
ryG
A
slu
rry
Wa
ter
Su
pe
rpla
st.
Su
pe
rpl.
Su
pe
rpl.
Ba
tch
Date
Mix
W/D
Mto
tal
ma
ssg
tota
l g
tota
l g
cem
%
GA
%
sil/c
em
type
am
ou
nt
ga
mo
un
tg
am
ou
nt
ga
mo
un
tg
type
am
ou
nt
%a
mo
un
tg
volu
me
l
23
.12
.20
04
P3
1.5
90.6
145
3716
2283
1433
59.2
7
40.7
3
0.6
9U
F16
849
583
1167
1700
SP
40
229
2.8
1
Mix
co
mp
os
itio
ns b
as
ed
on
P3-r
ecip
e:
21
.4.2
00
5P
30
11
.20
0.5
455
4000
2182
1818
59.2
7
40.7
3
0.6
9U
F16
1078
741
1481
1441
SP
40
355
2.8
52
1.4
.20
05
P3
02
1.4
00.5
833
4000
2333
1667
59.2
7
40.7
3
0.6
9U
F16
988
679
1358
1655
SP
40
233
2.9
42
1.4
.20
05
P3
03
1.6
00.6
154
3800
2338
1462
59.2
7
40.7
3
0.6
9U
F16
866
595
1191
1743
SP
40
229
2.8
71
3.4
.20
05
P3
06
1.6
00.6
154
3800
2338
1462
59.2
7
40.7
3
0.6
9U
F16
866
595
1191
1743
SP
40
229
2.8
71
3.4
.20
05
P3
07
1.2
00.5
455
4000
2182
1818
59.2
7
40.7
3
0.6
9U
F16
1078
741
1481
1441
Mig
hty
15
03
55
2.8
51
3.4
.20
05
P3
07
B1
.20
0.5
455
4000
2182
1818
59.2
7
40.7
3
0.6
9U
F16
1078
741
1481
1441
Mig
hty
15
04
73
2.8
51
3.4
.20
05
P3
08
1.4
00.5
833
4000
2333
1667
59.2
7
40.7
3
0.6
9U
F16
988
679
1358
1655
Mig
hty
15
03
50
2.9
41
3.4
.20
05
P3
08
B1
.40
0.5
833
4000
2333
1667
59.2
7
40.7
3
0.6
9U
F16
988
679
1358
1655
Mig
hty
15
04
67
2.9
41
3.4
.20
05
P3
09
1.6
00.6
154
3800
2338
1462
59.2
7
40.7
3
0.6
9U
F16
866
595
1191
1743
Mig
hty
15
02
29
2.8
78
.3.2
00
5P
31
01
.20
0.5
455
4000
2182
1818
59.2
7
40.7
3
0.6
9U
F16
1078
741
1481
1441
Mig
hty
15
03
55
2.8
58
.3.2
00
5P
31
11
.40
0.5
833
3800
2217
1583
59.2
7
40.7
3
0.6
9U
F16
938
645
1290
1572
Mig
hty
15
02
32
2.8
08
.3.2
00
5P
31
21
.60
0.6
154
3800
2338
1462
59.2
7
40.7
3
0.6
9U
F16
866
595
1191
1743
Mig
hty
15
02
29
2.8
78
.3.2
00
5P
31
31
.80
0.6
429
3800
2443
1357
59.2
7
40.7
3
0.6
9U
F16
804
553
1106
1890
Mig
hty
15
02
27
2.9
42
1.4
.20
05
P3
21
1.2
00.5
455
4000
2182
1818
64.2
7
35.7
3
0.5
6U
F16
1169
650
1299
1532
SP
40
355
2.8
48
.3.2
00
5P
32
21
.40
0.5
833
4000
2333
1667
64.2
7
35.7
3
0.5
6U
F16
1071
596
1191
1738
SP
40
233
2.9
32
1.4
.20
05
P3
23
1.6
00.6
154
3800
2338
1462
64.2
7
35.7
3
0.5
6U
F16
939
522
1044
1816
SP
40
229
2.8
71
3.4
.20
05
P3
27
1.2
00.5
455
4000
2182
1818
64.2
7
35.7
3
0.5
6U
F16
1169
650
1299
1532
Mig
hty
15
03
55
2.8
48
.3.2
00
5P
32
81
.40
0.5
833
4000
2333
1667
64.2
7
35.7
3
0.5
6U
F16
1071
596
1191
1738
Mig
hty
15
02
33
2.9
31
3.4
.20
05
P3
29
1.6
00.6
154
3800
2338
1462
64.2
7
35.7
3
0.5
6U
F16
939
522
1044
1816
Mig
hty
15
02
29
2.8
71
5.3
.20
05
P3
30
1.2
00.5
455
4000
2182
1818
64.2
7
35.7
3
0.5
6U
F16
1169
650
1299
1532
Mig
hty
15
03
55
2.8
41
5.3
.20
05
P3
31
1.4
00.5
833
4000
2333
1667
64.2
7
35.7
3
0.5
6U
F16
1071
596
1191
1738
Mig
hty
15
02
33
2.9
31
5.3
.20
05
P3
32
1.6
00.6
154
3800
2338
1462
64.2
7
35.7
3
0.5
6U
F16
939
522
1044
1816
Mig
hty
15
02
29
2.8
71
5.3
.20
05
P3
33
1.8
00.6
429
3800
2443
1357
64.2
7
35.7
3
0.5
6U
F16
872
485
970
1958
Mig
hty
15
02
27
2.9
38
.3.2
00
5P
34
11
.20
0.5
455
4000
2182
1818
69.2
7
30.7
3
0.4
4U
F16
1259
559
1117
1623
SP
40
355
2.8
38
.3.2
00
5P
34
21
.40
0.5
833
4000
2333
1667
69.2
7
30.7
3
0.4
4U
F16
1155
512
1024
1821
SP
40
233
2.9
2

82
21
.4.2
00
5P
34
31
.60
0.6
154
3800
2338
1462
69.2
7
30.7
3
0.4
4U
F16
1012
449
898
1889
SP
40
229
2.8
68
.3.2
00
5P
34
71
.20
0.5
455
4000
2182
1818
69.2
7
30.7
3
0.4
4U
F16
1259
559
1117
1623
Mig
hty
15
03
55
2.8
38
.3.2
00
5P
34
81
.40
0.5
833
4000
2333
1667
69.2
7
30.7
3
0.4
4U
F16
1155
512
1024
1821
Mig
hty
15
02
33
2.9
2
P
en
etr
ab
ilit
y m
ete
r m
as
ses, te
sti
ng
fre
sh
an
d h
ard
en
ing
pro
pert
ies, à 1
batc
h:
10
.5.2
00
5P
30
71
.20
0.5
455
4000
2182
1818
59.2
7
40.7
3
0.6
9U
F16
1078
741
1481
1441
Mig
hty
15
03
55
2.8
51
0.5
.20
05
P3
07
B1
.20
0.5
455
4000
2182
1818
59.2
7
40.7
3
0.6
9U
F16
1078
741
1481
1441
Mig
hty
15
04
73
2.8
51
0.5
.20
05
P3
08
1.4
00.5
833
4000
2333
1667
59.2
7
40.7
3
0.6
9U
F16
988
679
1358
1655
Mig
hty
15
03
50
2.9
41
0.5
.20
05
P3
08
B1
.40
0.5
833
4000
2333
1667
59.2
7
40.7
3
0.6
9U
F16
988
679
1358
1655
Mig
hty
15
04
67
2.9
41
0.5
.20
05
P3
09
1.6
00.6
154
3800
2338
1462
59.2
7
40.7
3
0.6
9U
F16
866
595
1191
1743
Mig
hty
15
02
29
2.8
71
0.5
.20
05
P3
27
1.2
00.5
455
4000
2182
1818
64.2
7
35.7
3
0.5
6U
F16
1169
650
1299
1532
Mig
hty
15
03
55
2.8
4P
en
etr
ab
ilit
y m
ete
r m
as
ses, à 2
batc
hes f
or
just
pe
netr
ab
ilit
y m
ete
r:
10
.5.2
00
5P
30
71
.20
0.5
455
4000
2182
1818
59.2
7
40.7
3
0.6
9U
F16
1078
741
1481
1441
Mig
hty
15
03
55
2.8
51
0.5
.20
05
P3
07
B1
.20
0.5
455
4000
2182
1818
59.2
7
40.7
3
0.6
9U
F16
1078
741
1481
1441
Mig
hty
15
04
73
2.8
51
0.5
.20
05
P3
08
1.4
00.5
833
4000
2333
1667
59.2
7
40.7
3
0.6
9U
F16
988
679
1358
1655
Mig
hty
15
03
50
2.9
41
6.5
.20
05
P3
08
B1
.40
0.5
833
4000
2333
1667
59.2
7
40.7
3
0.6
9U
F16
988
679
1358
1655
Mig
hty
15
04
67
2.9
41
6.5
.20
05
P3
09
1.6
00.6
154
3800
2338
1462
59.2
7
40.7
3
0.6
9U
F16
866
595
1191
1743
Mig
hty
15
02
29
2.8
71
6.5
.20
05
P3
27
1.2
00.5
455
4000
2182
1818
64.2
7
35.7
3
0.5
6U
F16
1169
650
1299
1532
Mig
hty
15
03
55
2.8
4
Fie
ld t
est
rec
ipe
, la
bo
rato
ry s
cale
: 3
.11
.20
05
P3
07
C0.8
8200
0.4
687
4400
2062
2338
59.0
0
41.0
0
0.6
9U
F16
1379
959
1917
1104
Mig
hty
15
03
.31
978
2.9
2
Rh
eo
log
y m
ass
es:
24
.8.2
00
5P
30
7B
1.2
00.5
455
3000
1636
1364
59.2
7
40.7
3
0.6
9U
F16
808
555
1111
1081
Mig
hty
15
04
55
2.1
52
4.8
.20
05
P3
07
C0.8
8889
0.4
706
3200
1506
1694
55.5
56
44.4
44
0.8
0U
F16
941
753
1506
753
Mig
hty
15
03
.13
53
2.1
52
4.8
.20
05
P3
08
1.4
00.5
833
3000
1750
1250
59.2
7
40.7
3
0.6
9U
F16
741
509
1018
1241
Mig
hty
15
03
38
2.2
22
4.8
.20
05
P3
08
B1
.40
0.5
833
3000
1750
1250
59.2
7
40.7
3
0.6
9U
F16
741
509
1018
1241
Mig
hty
15
04
50
2.2
1
Alt
ern
ati
ve s
up
erp
lasti
ciz
er
ma
sses:
5.1
0.2
00
5P
36
2S
1.2
00.5
455
4000
2182
1818
59.2
7
40.7
3
0.6
9U
F16
1078
741
1481
1441
Str
uct
uro
236
2.8
55
.10
.20
05
P3
63
S1
.20
0.5
455
4000
2182
1818
59.2
7
40.7
3
0.6
9U
F16
1078
741
1481
1441
Str
uct
uro
118
2.8
55
.10
.20
05
P3
65
S1
.40
0.5
833
4000
2333
1667
59.2
7
40.7
3
0.6
9U
F16
988
679
1358
1655
Str
uct
uro
233
2.9
45
.10
.20
05
P3
66
S1
.40
0.5
833
4000
2333
1667
59.2
7
40.7
3
0.6
9U
F16
988
679
1358
1655
Str
uct
uro
117
2.9
45
.10
.20
05
P3
68
S1
.60
0.6
154
3900
2400
1500
59.2
7
40.7
3
0.6
9U
F16
889
611
1222
1789
Str
uct
uro
115
2.9
55
.10
.20
05
P3
72
G1
.20
0.5
455
4000
2182
1818
59.2
7
40.7
3
0.6
9U
F16
1078
741
1481
1441
Gle
niu
m 5
12
36
2.8
55
.10
.20
05
P3
73
G1
.20
0.5
455
4000
2182
1818
59.2
7
40.7
3
0.6
9U
F16
1078
741
1481
1441
Gle
niu
m 5
11
18
2.8
55
.10
.20
05
P3
75
G1
.40
0.5
833
4000
2333
1667
59.2
7
40.7
3
0.6
9U
F16
988
679
1358
1655
Gle
niu
m 5
12
33
2.9
45
.10
.20
05
P3
76
G1
.40
0.5
833
4000
2333
1667
59.2
7
40.7
3
0.6
9U
F16
988
679
1358
1655
Gle
niu
m 5
11
17
2.9
45
.10
.20
05
P3
78
G1
.60
0.6
154
3900
2400
1500
59.2
7
40.7
3
0.6
9U
F16
889
611
1222
1789
Gle
niu
m 5
11
15
2.9
56
.10
.20
05
P3
69
S1
.20
0.5
455
4000
2182
1818
59.2
7
40.7
3
0.6
9U
F16
1078
741
1481
1441
Str
uct
uro
1.5
27
2.8
5

83
6.1
0.2
00
5P
37
9G
1.2
00.5
455
4000
2182
1818
59.2
7
40.7
3
0.6
9U
F16
1078
741
1481
1441
Gle
niu
m 5
11
.527
2.8
56
.10
.20
05
P3
80
G1
.40
0.5
833
4000
2333
1667
59.2
7
40.7
3
0.6
9U
F16
988
679
1358
1655
Gle
niu
m 5
11
.525
2.9
46
.10
.20
05
P3
81
G1
.60
0.6
154
3900
2400
1500
59.2
7
40.7
3
0.6
9U
F16
889
611
1222
1789
Gle
niu
m 5
11
.320
2.9
56
.10
.20
05
P3
08
B1
.40
0.5
833
4000
2333
1667
59.2
7
40.7
3
0.6
9U
F16
988
679
1358
1655
Mig
hty
15
04
67
2.9
46
.10
.20
05
P3
08
B1
.40
0.5
833
2040
1190
850
59.2
7
40.7
3
0.6
9U
F16
504
346
692
844
Mig
hty
15
04
34
1.5
0
Test
pro
pert
ies
(measu
red)
C
uri
ng
of
com
p.s
tre
ng
th p
rism
s:
F
irst
24
h a
fte
r m
ixin
g in
ta
rge
t te
mpera
ture
12
°C o
r ro
om
tem
p.
After
1 d
ay
curin
g a
t 20°C
, 100%
RH
until
th
e t
est
ing
ag
e
M
ixin
g a
t ro
om
tem
p.
* C
oo
ling
d
urin
gm
ixin
g
W/D
M(s
up
erp
l.in
clu
de
d)
Mars
hfr
esh
Mars
hfr
esh
Mars
h 1
hM
ars
h 1
h
Flo
w
tab
le t
est
fresh
Ble
ed
ing
2h
Fall c
on
e
6h
Fall c
on
e
24h
Co
mp
. str
en
gth
1 d
ay
Co
mp
. str
en
gth
7 d
ay
Co
mp
. str
en
gth
28 d
ay
Co
mp
. str
en
gth
91 d
ay
Tem
p. °C
T
em
p. °C
T
em
p. °C
1
00
0 m
ls
Am
ou
nt
ml
10
00
ml
sA
mo
un
t
m
l P
rism
40m
mx4
0m
mx1
60
mm
Pri
sm40m
mx4
0m
mx1
60
mm
Pri
sm40m
mx4
0m
mx1
60
mm
Pri
sm40m
mx4
0m
mx1
60
mm
Date
Mix
targ
et
be
g.
of
mix
ing
en
d o
f m
ixin
gW
/DM
or
ma
x tim
ein
me
as.
tim
eo
r m
ax
time
in m
ea
s.
time
mm
vol-%
kP
akP
aM
Pa
MP
aM
Pa
MP
a
23
.12
.20
04
P3
12
13.5
21.1
1
.59
180
700
80
340
92
0.1
(3h)
1.1
1
8.6
(10h
)0,9
cylin
de
r d
ia1
05
mm
x h
eig
ht
10
0m
m
5,0
cylin
de
r d
iam
ete
r1
05
mm
x
he
igh
t1
00
mm
Mix
co
mp
os
itio
ns b
as
ed
on
P3-r
ecip
e:
21
.4.2
00
5P
30
11
2
8.5
1
2.9
* 1
.20
74
100
50
113
0.1
2.3
3
1.3
20.2
21
.4.2
00
5P
30
21
2
8.2
1
4.0
* 1
.40
100
100
87
0.0
2.6
9
2
1.4
.20
05
P3
03
12
7
.9
13
.4*
1.6
0117
100
30
98
0.1
1.4
9
157
0.5
12.1
13
.4.2
00
5P
30
620
20.0
25.7
1
.60
100
300
95
1
3.4
.20
05
P3
07
12
8
.5
12
.9*
1.2
0100
900
102
0.0
2.3
9
1.0
22.9
13
.4.2
00
5P
30
7B
12
8
.6
12
.2*
1.2
043
51
150
0.1
1.3
5
0.8
19.1
13
.4.2
00
5P
30
81
2
8.6
1
2.6
* 1
.40
45
86
136
0.1
1.3
5
196
0.6
16.8
13
.4.2
00
5P
30
8B
12
8
.9
12
.6*
1.4
037
43
177
0.1
0.6
8
157
0.5
16.5
13
.4.2
00
5P
30
91
2
8.4
1
3.3
* 1
.60
71
100
390
99
0.1
1.0
1
130
0.4
12.0
8.3
.20
05
P3
10
20
17.9
25.2
1
.20
52
118
128
0.0
11.7
0
1.8
13.5

84
8.3
.20
05
P3
11
20
21.4
26.6
1
.40
82
100
150
116
0.0
8.7
3
1.2
11.9
8.3
.20
05
P3
12
20
22.3
27.2
1
.60
50
93
129
0.1
6.4
7
240
0.7
7.7
8.3
.20
05
P3
13
20
19.1
23.5
1
.80
44
60
135
0.2
4.4
3
157
0.4
4.5
21
.4.2
00
5P
32
11
2
8.3
1
4.0
* 1
.20
68
100
50
105
0.1
2.1
4
1.5
24.1
8.3
.20
05
P3
22
12
7
.1
12
.8 *
1
.40
100
850
100
25
100
0.0
1.0
1
0.7
14.8
21
.4.2
00
5P
32
31
2
8.2
1
3.5
* 1
.60
63
100
160
108
0.2
1.3
5
130
0.5
12.7
13
.4.2
00
5P
32
71
2
8.6
1
3.0
* 1
.20
42
140
900
120
0.0
2.0
2
1.1
20.8
8.3
.20
05
P3
28
12
7
.3
13
.9 *
1
.40
95
100
125
120
0.1
1.5
7
240
0.7
14.7
13
.4.2
00
5P
32
91
2
7.5
1
3.5
* 1
.60
52
92
142
0.2
1.2
2
122
0.5
18.6
15
.3.2
00
5P
33
020
20.7
24.5
1
.20
54
100
950
119
0.1
9.8
0
1.9
20.6
15
.3.2
00
5P
33
120
20.5
25.6
1
.40
75
100
440
116
0.1
8.8
3
1.2
16.5
15
.3.2
00
5P
33
220
19.8
24.3
1
.60
50
80
132
0.2
4.8
8
0.7
11.2
15
.3.2
00
5P
33
320
20.2
25.9
1
.80
41
48
144
0.3
3.8
9
196
0.5
9.9
8.3
.20
05
P3
41
12
7
.0
14
.7 *
1
.20
47
101
150
0.1
1.0
7
1.4
17.7
8.3
.20
05
P3
42
12
6
.9
13
.0 *
1
.40
59
100
400
123
0.1
1.0
5
0.8
12.4
21
.4.2
00
5P
34
31
2
10
.0
14
.4*
1.6
048
91
126
0.4
0.9
0
157
0.4
11.4
8.3
.20
05
P3
47
12
6
.6
13
.1 *
1
.20
43
68
153
0.1
1.0
0
1.2
17.1
8.3
.20
05
P3
48
12
6
.8
12
.4 *
1
.40
46
103
144
0.2
0.9
4
0.8
10.8
P
en
etr
ab
ilit
y m
ete
r m
as
ses, te
sti
ng
fre
sh
an
d h
ard
en
ing
pro
pert
ies, à 1
batc
h:
1
0.5
.20
05
P3
07
12
9
.1
14
.2*
1.2
01
00
6
00
1
00
<
5
97
3.1
8
0
.9
1
9.6
10
.5.2
00
5P
30
7B
12
9
.2
14
.8*
1.2
057
97
138
2.1
4
1.0
21.3
31.9
1
0.5
.20
05
P3
08
12
8
.9
15
.0*
1.4
057
113
119
1.9
4
157
0.6
15.2
10
.5.2
00
5P
30
8B
12
9
.4
14
.7*
1.4
044
61
152
1.0
7
157
0.7
17.0
22.4
1
0.5
.20
05
P3
09
12
9
.7
16
.2*
1.6
096
100
600
112
1.3
0
103
0.4
10.0
10
.5.2
00
5P
32
71
2
8.2
1
5.7
* 1
.20
72
100
450
118
2.3
9
1.1
18.1
Pen
etr
ab
ilit
y m
ete
r m
as
ses, à 2
batc
hes f
or
just
pe
netr
ab
ilit
y m
ete
r:
1
0.5
.20
05
P3
07
12
8
.8
15
.6*
1.2
0
1
0.5
.20
05
P3
07
B1
2
8.5
1
6.1
* 1
.20
10
.5.2
00
5P
30
81
2
7.5
1
5.6
* 1
.40
16
.5.2
00
5P
30
8B
12
8
.9
16
.1*
1.4
0
1
6.5
.20
05
P3
09
12
8
.9
15
.2
1.6
0
1
6.5
.20
05
P3
27
12
9
.9
17
.2*
1.2
0
F
ield
test
rec
ipe
, la
bo
rato
ry s
cale
:
3
.11
.20
05
P3
07
C1
2
7.8
1
3.4
0
.89
100
300
118
0.0
1.3
4
1.7
31.1
Rh
eo
log
y m
ass
es:
Te
stin
g a
t 3
0m
in
24
.8.2
00
5P
30
7B
12
1
4.0
1
9.7
* 1
.20
49
57
Te
stin
g a
t 3
0m
in
24
.8.2
00
5P
30
7C
12
1
4.2
1
8.2
* 0
.90
66
2
4.8
.20
05
P3
08
12
1
4.1
1
9.2
* 1
.40
63
83

85
24
.8.2
00
5P
30
8B
12
1
4.2
1
9.0
* 1
.40
43
46
A
ltern
ati
ve s
up
erp
lasti
ciz
er
ma
sses:
5.1
0.2
00
5P
36
2S
12
13.7
19.8
1
.20
37
43
0.3
9
1.3
18.9
5.1
0.2
00
5P
36
3S
12
13.7
18.2
1
.20
136
750
120
0.0
2.7
7
1.1
18.7
5.1
0.2
00
5P
36
5S
12
13.9
17.8
1
.40
45
41
0
.19
the
ma
ss r
un
ou
t o
f th
e m
ou
lds
5.1
0.2
00
5P
36
6S
12
13.8
18.3
1
.40
96
120
123
0.0
1.7
1
0.8
7.9
5.1
0.2
00
5P
36
8S
12
13.7
20.9
1
.60
57
88
133
0.0
1.1
7
0.4
10.3
5.1
0.2
00
5P
372G
12
13.9
17.9
1
.20
40
43
0.9
20.8
5.1
0.2
00
5P
373G
12
13.5
22.1
1
.20
49
110
142
0.0
1.4
0
1.1
7.7
5.1
0.2
00
5P
375G
12
13.7
20.8
1
.40
36
39
0.6
13.8
5.1
0.2
00
5P
376G
12
13.8
20.9
1
.40
45
57
0
.0
0.9
8
0.6
10
.6
5
.10
.20
05
P378G
12
13.5
16.0
1
.60
44
48
0
.0
0.2
6
0.3
8.5
6.1
0.2
00
5P
36
9S
12
13.7
21.4
1
.20
45
55
1.2
7
1.3
21.7
6.1
0.2
00
5P
379G
12
13.8
20.7
1
.20
39
48
0.2
3
1.1
23.5
6.1
0.2
00
5P
380G
12
14.2
20.9
1
.40
36
45
0.7
12.1
6.1
0.2
00
5P
381G
12
14.1
21
1.6
037
43
0.5
12.1
6.1
0.2
00
5P
30
8B
12
13.9
17.1
1
.40
53
65
0.7
6
0.6
12.3
6.1
0.2
00
5P
30
8B
12
1
4.0
2
6.7
* 1
.40
46
0.0
Vic
at
beg
.(s
ett
ing
sta
rts)
Vic
at
en
d(s
ett
ing
ends)
Rem
ark
s!
Pe
ne
tra
bil
ity
me
ter
tes
t, p
res
su
re 0
.1 M
Pa
P
en
etr
ab
ilit
y m
ete
r te
st,
re
su
lts
Tim
e
Tim
e
Filt
er
size
m
(n
om
ina
l siz
es)
, m
l ma
ss p
en
etr
ate
d t
hro
ug
h a
filt
er,
te
st e
nd
ed
whe
n 1
00
0 m
l ach
ieve
d
bm
inB
crit
Date
Mix
h:m
inh
:min
35
45
54
63
75
90
104
125
144
200
mm
23
.12
.20
04
P3
Mix
co
mp
os
itio
ns b
as
ed
on
P3-r
ecip
e:
2
1.4
.20
05
P3
01
2
1.4
.20
05
P3
02
no
co
mp
ress
ive
str
en
gth
pri
sms
ma
de
21
.4.2
00
5P
30
3
13
.4.2
00
5P
30
6
m
ass
re
ject
ed
13
.4.2
00
5P
30
7
13
.4.2
00
5P
30
7B
14
:30
?
Vic
at
inst
rum
en
t fa
ilure
1
3.4
.20
05
P3
08
1
3.4
.20
05
P3
08
B
13
.4.2
00
5P
30
9
1
6:3
0?
V
ica
t in
stru
me
nt
failu
re

86
8.3
.20
05
P3
10
8
.3.2
00
5P
31
1
8.3
.20
05
P3
12
8
.3.2
00
5P
31
3
21
.4.2
00
5P
32
1
8.3
.20
05
P3
22
2
1.4
.20
05
P3
23
1
3.4
.20
05
P3
27
8
.3.2
00
5P
32
8
13
.4.2
00
5P
32
9
15
.3.2
00
5P
33
0
15
.3.2
00
5P
33
1
15
.3.2
00
5P
33
2
15
.3.2
00
5P
33
3
8.3
.20
05
P3
41
8
.3.2
00
5P
34
2
21
.4.2
00
5P
34
3
8.3
.20
05
P3
47
8
.3.2
00
5P
34
8
P
en
etr
ab
ilit
y m
ete
r m
as
ses, te
sti
ng
fre
sh
an
d h
ard
en
ing
pro
pert
ies, à 1
batc
h:
1
0.5
.20
05
P3
07
1
0.5
.20
05
P3
07
B
10
.5.2
00
5P
30
8
10
.5.2
00
5P
30
8B
1
0.5
.20
05
P3
09
1
0.5
.20
05
P3
27
P
en
etr
ab
ilit
y m
ete
r m
as
ses, à 2
batc
hes f
or
just
pe
netr
ab
ilit
y m
ete
r:
10
.5.2
00
5P
30
7
10
20
65
125
200
225
290
320
570
950
42
247
10
.5.2
00
5P
30
7B
15
35
125
225
475
750
1150
43
108
10
.5.2
00
5P
30
8
15
40
165
400
800
1300
41
90
16
.5.2
00
5P
30
8B
20
53
235
440
865
1050
40
88
16
.5.2
00
5P
30
9
20
50
200
305
625
860
960
1120
37
113
16
.5.2
00
5P
32
7
15
40
180
315
635
1080
42
94
F
ield
test
rec
ipe
, la
bo
rato
ry s
cale
:
3.1
1.2
00
5P
30
7C
Cu
rin
g a
t a
bo
ut
8°C
first
24
h
Rh
eo
log
y m
ass
es:
24
.8.2
00
5P
30
7B
2
4.8
.20
05
P3
07
C
2
4.8
.20
05
P3
08

87
24
.8.2
00
5P
30
8B
Alt
ern
ati
ve s
up
erp
lasti
ciz
er
ma
sses:
5
.10
.20
05
P3
62
S
5.1
0.2
00
5P
36
3S
ple
nty
of
sma
ll b
ub
ble
s in
ha
rde
ne
d g
rou
t
5.1
0.2
00
5P
36
5S
5
.10
.20
05
P3
66
S
p
len
ty o
f sm
all
bu
bb
les
in h
ard
en
ed
gro
ut
5
.10
.20
05
P3
68
S
p
len
ty o
f sm
all
bu
bb
les
in h
ard
en
ed
gro
ut
5
.10
.20
05
P372G
5
.10
.20
05
P373G
sma
ll b
ub
ble
s e
ven
ly in
1h
old
ma
ss
5
.10
.20
05
P375G
5
.10
.20
05
P376G
5
.10
.20
05
P378G
6
.10
.20
05
P3
69
S
a
fe
w s
ma
ll b
ub
ble
s in
ha
rde
ne
d g
rou
t
6.1
0.2
00
5P
379G
a c
ou
ple
of
sma
ll b
ub
ble
s in
ha
rde
ne
d g
rou
t
6
.10
.20
05
P380G
som
e s
ma
ll b
ub
ble
s in
ha
rde
ne
d g
rou
t
6.1
0.2
00
5P
381G
ple
nty
of
sma
ll b
ub
ble
s in
ha
rde
ne
d g
rou
t
6.1
0.2
00
5P
30
8B
6
.10
.20
05
P3
08
B
e
lect
ron
ic b
len
de
r m
ixe
r in
a c
old
ca
bin
et
at
12
°C

88

89
APPENDIX 3: RESULTS OF BATCH MIXING TEST 1 RESULTS OF THE PILOT TEST 3, BATCH MIXING TEST 17.5.2005 AT OLKILUOTOOutside temperature 6-7 C Temperature 19:00 ~10 C Marsh value for water 30,6 s.Temperature 21:00 7,5 C re during 12-22 hours ~5 CMIX P307 Teor. density 1397 50 kg/m3Mixing ready at 9:45 Meas. density 1400 kg/m3Mix temperature at 9:45 9,5 C Weight 1450 kg/cm3
TimeTime from
mixing (h:mm)
Marsh cone value (s)
Filter pump 100 μm (ml)
Filter pump 75 μm (ml)
Fall cone (mm)
Shear strength
(kPa)Bleeding (%) Notes
9:46 0:01 53 Small pieces (< 1 mm) in 9:50 0:05 300 the mesh of the Marsh 10:13 0:28 56 cone - probably from the 10:45 1:00 55 mixer11:38 1:53 011:40 1:55 2014:30 4:45 12 0.1715:33 5:48 6.8 0.5316:45 7:00 4.2 1.3517:50 8:05 6,4 (60g) 419:00 9:15 4,8 (60,g) 6.25
21.00 11:15 2 (60g)7:40 23:00 1 (100g)
MIX P307B Teor. density 1396±50 kg/m3Mixing ready at 9:55 Meas. density 1400 kg/m3Mix temperature at 9:55 10.2 C Weight 1365 kg/cm3
TimeTime from
mixing (h:mm)
Marsh cone value (s)
Filter pump 100 μm (ml)
Filter pump 75 μm (ml)
Fall cone (mm)
Shear strength
(kPa)Bleeding (%) Notes
9:55 0:00 45 Small pieces (< 1 mm) in 9:58 0:03 280 the mesh of the Marsh 10:03 0:08 300 cone - probably from the 10:24 0:29 46 mixer10:49 0:54 4711:38 1:43 011:40 1:45 2014:30 4:35 1815:40 5:45 7 0.516:45 6:50 6.4 0.618:00 8:05 6,4 (60g) 419:05 9:10 5,5 (60g) 5.0221:00 11:05 2,2 (60g)7:40 23:00 0,5 (100g)
MIX P308 Teor. density 1350±50 kg/m3Mixing ready at 10:58 Meas. density 1360 kg/m3Mix temperature at 10:58 9.2 C Weight kg/cm3
TimeTime from
mixing (h:mm)
Marsh cone value (s)
Filter pump 100 μm (ml)
Filter pump 75 μm (ml)
Fall cone (mm)
Shear strength
(kPa)Bleeding (%) Notes
11:01 0:03 4311:04 0:06 30011:26 0:28 4612:52 1:54 014:30 3:32 15.515:40 4:42 12 0.1716:45 5:47 7.6 0.4218:00 7:02 4.8 1.0421:00 10:02 4 (60g) 8.737:47 20:49 0(100g)
Samples casted for leaching tests at 11:30

90
MIX P308B Teor. density 1349±50 kg/m3Mixing ready at 11:07 Meas. density 1350 kg/m3Mix temperature at 11:07 8.0 C Weight kg/cm3
TimeTime from
mixing (h:mm)
Marsh cone value (s)
Filter pump 100 μm (ml)
Filter pump 75 μm (ml)
Fall cone (mm)
Shear strength
(kPa)Bleeding (%) Notes
11:10 0:03 3911:13 0:06 300 Filter cake formation11:35 0:28 4112:51 1:44 015:45 4:38 13.8 0.1216:45 5:38 9 0.318:00 6:53 4 1.5719:05 7:58 9 (60g) 2.0621:00 9:53 3 (60g) 117:40 20:33 1 (100g)
Samples casted for leaching tests at 11:38
MIX P309 Teor. density 1343±50 kg/m3Mixing ready at 11:48 Meas. density 1340 kg/m3Mix temperature at 11:48 9.2 C Weight kg/cm3
TimeTime from
mixing (h:mm)
Marsh cone value (s)
Filter pump 100 μm (ml)
Filter pump 75 μm (ml)
Fall cone (mm)
Shear strength
(kPa)Bleeding (%) Notes
11:50 0:02 4711:54 0:06 < 20011:54 0:06 20012:18 0:30 4614:30 2:42 015:50 4:02 12.8 0.1516:50 5:02 10 0.2518:05 6:17 5.4 0.8419:05 7:17 2.5 321:00 9:12 5 (60g) 5.837:52 20:04 3 (100g)
MIX P308C Teor. density 1350±50 kg/m3Mixing ready at 12:00 Meas. density 1360 kg/m3Mix temperature at 12:00 10.0 C Weight kg/cm3
TimeTime from
mixing (h:mm)
Marsh cone value (s)
Filter pump 100 μm (ml)
Filter pump 75 μm (ml)
Fall cone (mm)
Shear strength
(kPa)Bleeding (%) Notes
12:02 0:02 4712:07 0:07 30012:20 0:20 5214:30 2:30 015:55 3:55 11.8 0.1819:10 7:10 2.5 321:00 9:00 5 (60g) 5.837:54 19:54 ~0,5-1,0 (100g)
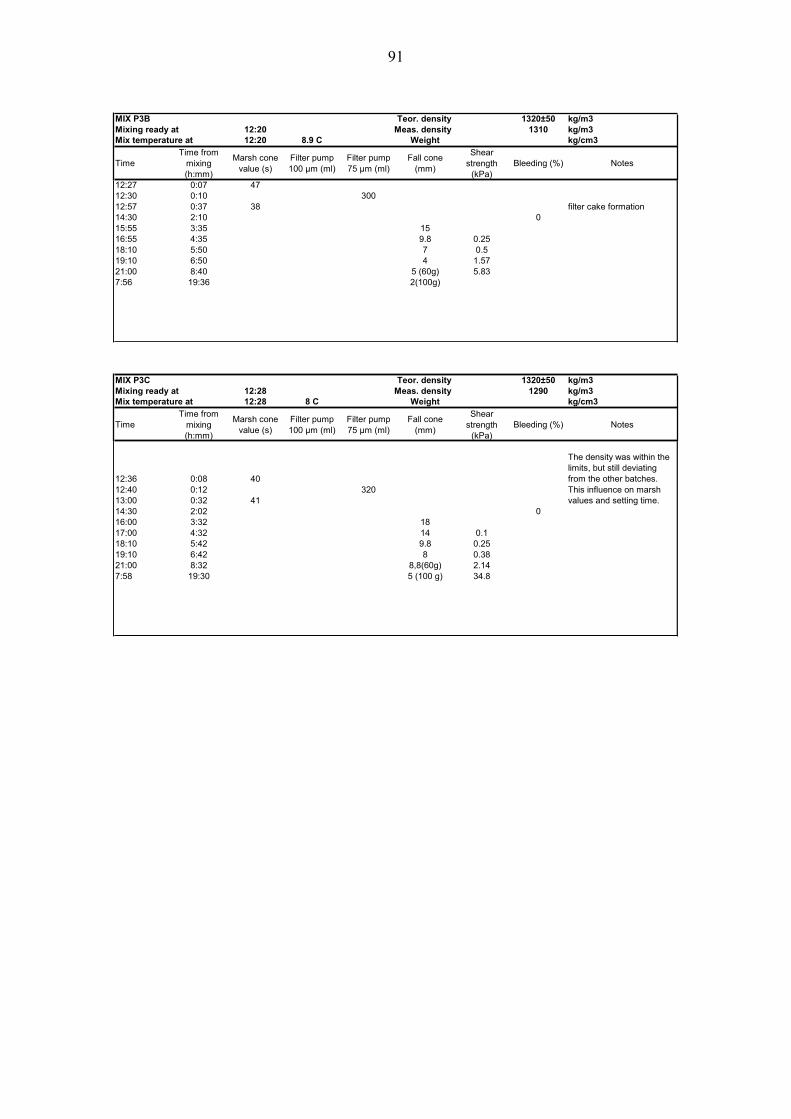
91
MIX P3B Teor. density 1320±50 kg/m3Mixing ready at 12:20 Meas. density 1310 kg/m3Mix temperature at 12:20 8.9 C Weight kg/cm3
TimeTime from
mixing (h:mm)
Marsh cone value (s)
Filter pump 100 μm (ml)
Filter pump 75 μm (ml)
Fall cone (mm)
Shear strength
(kPa)Bleeding (%) Notes
12:27 0:07 4712:30 0:10 30012:57 0:37 38 filter cake formation14:30 2:10 015:55 3:35 1516:55 4:35 9.8 0.2518:10 5:50 7 0.519:10 6:50 4 1.5721:00 8:40 5 (60g) 5.837:56 19:36 2(100g)
MIX P3C Teor. density 1320±50 kg/m3Mixing ready at 12:28 Meas. density 1290 kg/m3Mix temperature at 12:28 8 C Weight kg/cm3
TimeTime from
mixing (h:mm)
Marsh cone value (s)
Filter pump 100 μm (ml)
Filter pump 75 μm (ml)
Fall cone (mm)
Shear strength
(kPa)Bleeding (%) Notes
12:36 0:08 40
The density was within the limits, but still deviating from the other batches.
12:40 0:12 320 This influence on marsh 13:00 0:32 41 values and setting time. 14:30 2:02 016:00 3:32 1817:00 4:32 14 0.118:10 5:42 9.8 0.2519:10 6:42 8 0.3821:00 8:32 8,8(60g) 2.147:58 19:30 5 (100 g) 34.8

92

93
AP
PE
ND
IX 4
: P
RO
BE
HO
LE
DR
ILL
ING
LO
G
SIT
E:
502
9m
DR
ILLM
AN
:A
T-4
5m
FO
RE
MA
N:
AT
1m
Hole
Drilli
ng
H
ole
K-v
alu
eN
ote
sle
ng
thdia
m.
soft
norm
al
hard
join
tscr
ush
ed
ope
nd
rym
inor
no
rma
lm
ajo
rD
isp.
me
asu
ring
tim
e5
min
nr
[m]
[mm
][m
-m]
[m-m
][m
-m]
[m-m
][m
-m]
[m-m
][l/
min
][l/
min
][l/
min
][l/
min
]Lug
81
21
612
8[b
ar]
A2
9.0
64
X17-2
9X
0.3
519
42
48
19.6
7.5
l
0.1
40
.53
0.4
50.3
30.2
10
.21
Lug
B2
9.0
64
X13-1
420
X0.8
4300
l
25
1.8
90
.00
0.0
04.2
20.0
00
.00
Lug
C2
9.0
64
16-2
15,8
X0.0
85
6.2
11
52
l
24-2
823,2
40.0
30
.14
0.0
70.0
70.0
50
.06
Lug
D2
9.0
64
X20-2
28,1
42
.15
0.6
929
61
131
48
20.4
l
17
0.1
50
.79
0.6
60.8
80.5
20
.56
Lug
Tota
l
41
16
pcs
m
Aim
ed p
ress
ure
was
not
gre
y
3.6
.200
5
3.6
.200
5
of
wate
r
Mee
ri P
öllä
ne
n
Wate
rloss
measu
rem
ent
WA
TE
RLO
SS
ME
AS
.:
MIN
UT
ES
-KE
EP
ER
:
Wate
r le
aka
ges
Colo
ur
reach
ed
Kalli
ora
ken
nu
s O
y Ilk
ka P
uro
200
4
Dri
llin
g lo
g v
ers
ion
4.0
gre
y
Rock
qualit
yF
ract
uring
DR
ILLIN
G L
OG
NR
PR
OB
E H
OL
E D
RIL
LIN
GK
AT
126
-0351
-10
BD
RIL
LIN
G:
ON
KA
LO
W
OR
K 1
03
DR
AW
ING
:A
CC
ES
S T
UN
NE
L
M. K
an
tane
nS
TA
RT
ING
TIM
E:
M.J
un
ttila
EN
DIN
G T
IME
:
33
4 pcs
gre
y
gre
y
GR
OU
ND
WA
TE
R H
EA
D:
AV
ER
AG
E Z
:
PA
CK
ER
DE
PT
H:
ST
AT
ION
:
8.3
0 p
m
11
.20
pm

94
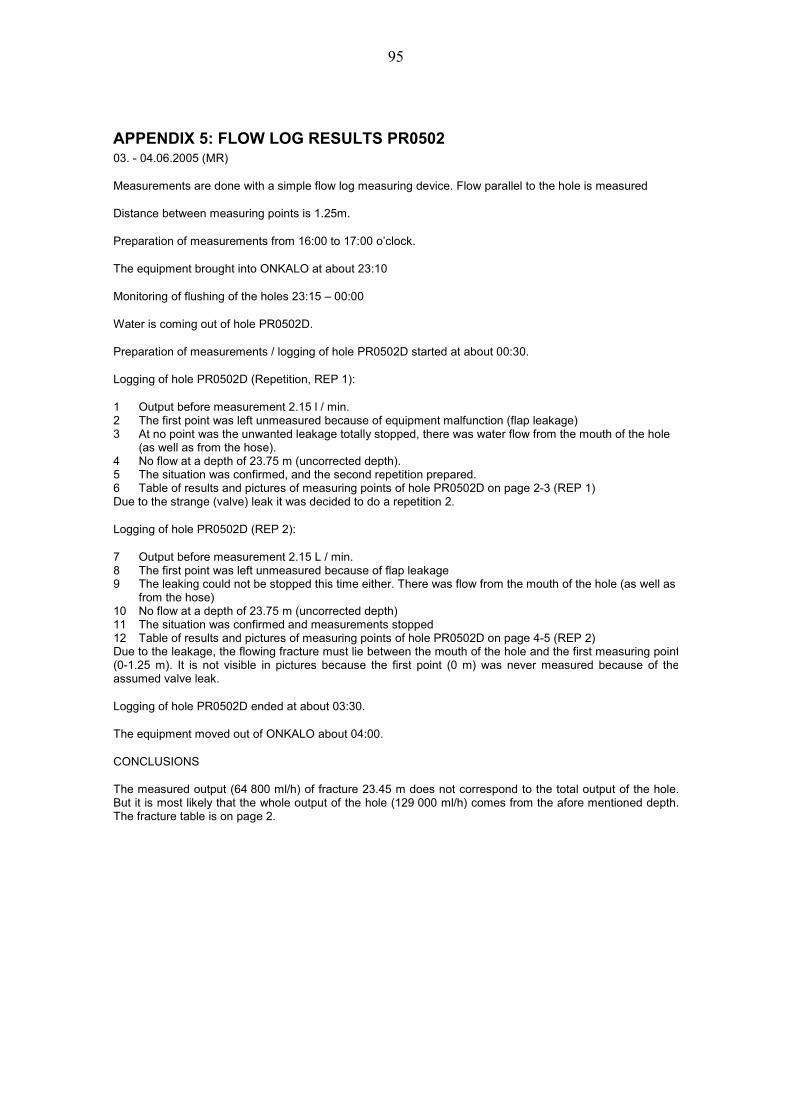
95
APPENDIX 5: FLOW LOG RESULTS PR0502 03. - 04.06.2005 (MR)
Measurements are done with a simple flow log measuring device. Flow parallel to the hole is measured
Distance between measuring points is 1.25m.
Preparation of measurements from 16:00 to 17:00 o’clock.
The equipment brought into ONKALO at about 23:10
Monitoring of flushing of the holes 23:15 – 00:00
Water is coming out of hole PR0502D.
Preparation of measurements / logging of hole PR0502D started at about 00:30.
Logging of hole PR0502D (Repetition, REP 1):
1 Output before measurement 2.15 l / min. 2 The first point was left unmeasured because of equipment malfunction (flap leakage) 3 At no point was the unwanted leakage totally stopped, there was water flow from the mouth of the hole
(as well as from the hose). 4 No flow at a depth of 23.75 m (uncorrected depth). 5 The situation was confirmed, and the second repetition prepared. 6 Table of results and pictures of measuring points of hole PR0502D on page 2-3 (REP 1) Due to the strange (valve) leak it was decided to do a repetition 2.
Logging of hole PR0502D (REP 2):
7 Output before measurement 2.15 L / min. 8 The first point was left unmeasured because of flap leakage 9 The leaking could not be stopped this time either. There was flow from the mouth of the hole (as well as
from the hose) 10 No flow at a depth of 23.75 m (uncorrected depth) 11 The situation was confirmed and measurements stopped 12 Table of results and pictures of measuring points of hole PR0502D on page 4-5 (REP 2) Due to the leakage, the flowing fracture must lie between the mouth of the hole and the first measuring point(0-1.25 m). It is not visible in pictures because the first point (0 m) was never measured because of theassumed valve leak.
Logging of hole PR0502D ended at about 03:30.
The equipment moved out of ONKALO about 04:00.
CONCLUSIONS
The measured output (64 800 ml/h) of fracture 23.45 m does not correspond to the total output of the hole.But it is most likely that the whole output of the hole (129 000 ml/h) comes from the afore mentioned depth.The fracture table is on page 2.
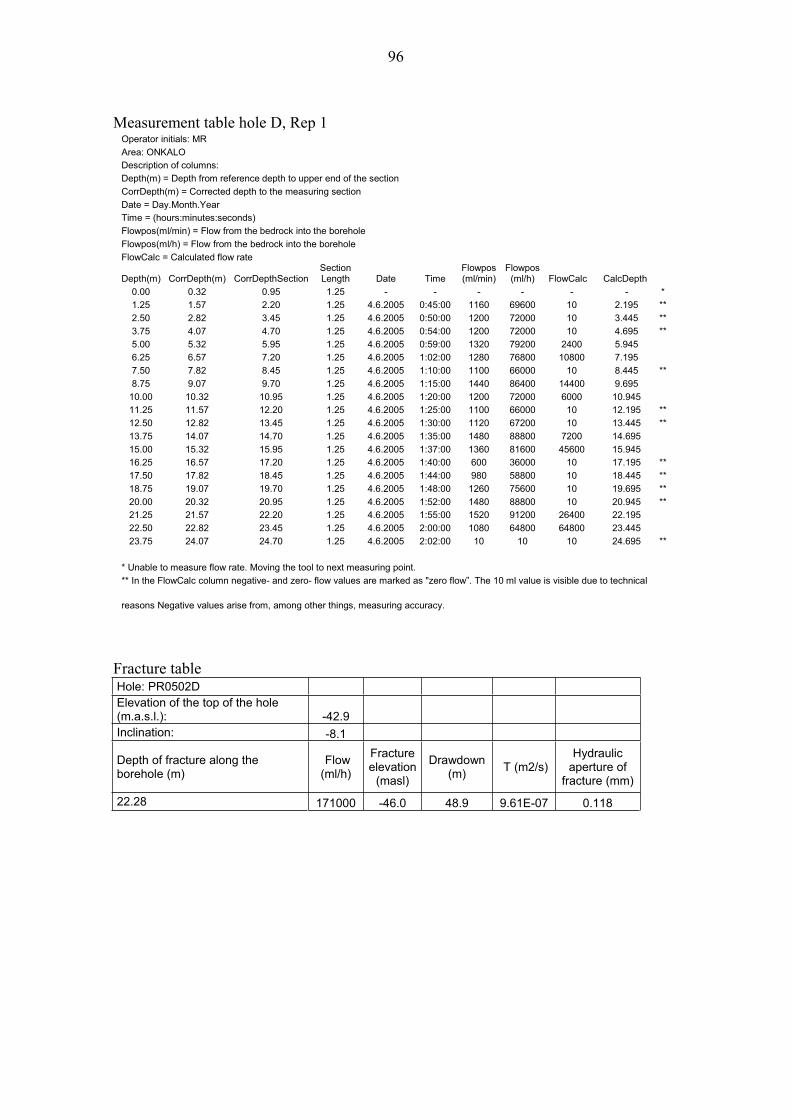
96
Measurement table hole D, Rep 1 Operator initials: MR
Area: ONKALO
Description of columns:
Depth(m) = Depth from reference depth to upper end of the section
CorrDepth(m) = Corrected depth to the measuring section
Date = Day.Month.Year
Time = (hours:minutes:seconds)
Flowpos(ml/min) = Flow from the bedrock into the borehole
Flowpos(ml/h) = Flow from the bedrock into the borehole
FlowCalc = Calculated flow rate
Depth(m) CorrDepth(m) CorrDepthSection Section Length Date Time
Flowpos(ml/min)
Flowpos(ml/h) FlowCalc CalcDepth
0.00 0.32 0.95 1.25 - - - - - - *
1.25 1.57 2.20 1.25 4.6.2005 0:45:00 1160 69600 10 2.195 **
2.50 2.82 3.45 1.25 4.6.2005 0:50:00 1200 72000 10 3.445 **
3.75 4.07 4.70 1.25 4.6.2005 0:54:00 1200 72000 10 4.695 **
5.00 5.32 5.95 1.25 4.6.2005 0:59:00 1320 79200 2400 5.945
6.25 6.57 7.20 1.25 4.6.2005 1:02:00 1280 76800 10800 7.195
7.50 7.82 8.45 1.25 4.6.2005 1:10:00 1100 66000 10 8.445 **
8.75 9.07 9.70 1.25 4.6.2005 1:15:00 1440 86400 14400 9.695
10.00 10.32 10.95 1.25 4.6.2005 1:20:00 1200 72000 6000 10.945
11.25 11.57 12.20 1.25 4.6.2005 1:25:00 1100 66000 10 12.195 **
12.50 12.82 13.45 1.25 4.6.2005 1:30:00 1120 67200 10 13.445 **
13.75 14.07 14.70 1.25 4.6.2005 1:35:00 1480 88800 7200 14.695
15.00 15.32 15.95 1.25 4.6.2005 1:37:00 1360 81600 45600 15.945
16.25 16.57 17.20 1.25 4.6.2005 1:40:00 600 36000 10 17.195 **
17.50 17.82 18.45 1.25 4.6.2005 1:44:00 980 58800 10 18.445 **
18.75 19.07 19.70 1.25 4.6.2005 1:48:00 1260 75600 10 19.695 **
20.00 20.32 20.95 1.25 4.6.2005 1:52:00 1480 88800 10 20.945 **
21.25 21.57 22.20 1.25 4.6.2005 1:55:00 1520 91200 26400 22.195
22.50 22.82 23.45 1.25 4.6.2005 2:00:00 1080 64800 64800 23.445
23.75 24.07 24.70 1.25 4.6.2005 2:02:00 10 10 10 24.695 **
* Unable to measure flow rate. Moving the tool to next measuring point.
** In the FlowCalc column negative- and zero- flow values are marked as "zero flow”. The 10 ml value is visible due to technical
reasons Negative values arise from, among other things, measuring accuracy.
Fracture table Hole: PR0502D Elevation of the top of the hole (m.a.s.l.): -42.9 Inclination: -8.1
Depth of fracture along the borehole (m)
Flow (ml/h)
Fracture elevation
(masl)
Drawdown (m)
T (m2/s) Hydraulic
aperture of fracture (mm)
22.28 171000 -46.0 48.9 9.61E-07 0.118

97
10 1001000
10000100000
Flow rate (mL/h)
30
29
28
27
26
25
24
23
22
21
20
19
18
17
16
15
14
13
12
11
10
9
8
7
6
5
4
3
2
1
0
De
pth
(m
)
Calculated difference flow (Section = 1.25 m, Flow direction = into the hole)2005-06-04
Measured flow along the borehole using manual flow logging device, 2005-06-04
Olkiluoto, Borehole OLPR0502DMeasure T1Measured flow rate of the borehole before flow logging = 129 000 ml / h

98
Measurement Table hole D, Rep 2
Operator initials: MR
Area: ONKALO
Description of columns:
Depth(m) = Depth from reference depth to upper end of the section
CorrDepth(m) = Corrected depth to the measuring section
Date = Day.Month.Year
Time = (hours:minutes:seconds)
Flowpos(ml/min) = Flow from the bedrock into the borehole
Flowpos(ml/h) = Flow from the bedrock into the borehole
FlowCalc = Calculated flow rate
Depth(m) CorrDepth(m) CorrDepthSectionSection Length Date Time
Flowpos(ml/min)
Flowpos (ml/h) FlowCalc CalcDepth
0.00 0.32 0.95 1.25 - - - - - - *
1.25 1.57 2.20 1.25 4.6.2005 2:10:00 1180 70800 10 2.195 **
2.50 2.82 3.45 1.25 4.6.2005 2:15:00 1240 74400 10 3.445 **
3.75 4.07 4.70 1.25 4.6.2005 2:22:00 1240 74400 10 4.695 **
5.00 5.32 5.95 1.25 4.6.2005 2:27:00 1350 81000 4200 5.945
6.25 6.57 7.20 1.25 4.6.2005 2:37:00 1280 76800 10800 7.195 **
7.50 7.82 8.45 1.25 4.6.2005 2:45:00 1100 66000 10 8.445 **
8.75 9.07 9.70 1.25 4.6.2005 2:48:00 1440 86400 12000 9.695
10.00 10.32 10.95 1.25 4.6.2005 2:53:00 1240 74400 8400 10.945
11.25 11.57 12.20 1.25 4.6.2005 2:59:00 1100 66000 10 12.195 **
12.50 12.82 13.45 1.25 4.6.2005 3:05:00 1120 67200 10 13.445 **
13.75 14.07 14.70 1.25 4.6.2005 3:10:00 1480 88800 4800 14.695
15.00 15.32 15.95 1.25 4.6.2005 3:13:00 1400 84000 50400 15.945
16.25 16.57 17.20 1.25 4.6.2005 3:16:00 560 33600 10 17.195 **
17.50 17.82 18.45 1.25 4.6.2005 3:20:00 1000 60000 10 18.445 **
18.75 19.07 19.70 1.25 4.6.2005 3:23:00 1260 75600 10 19.695 **
20.00 20.32 20.95 1.25 4.6.2005 3:26:00 1480 88800 10 20.945 **
21.25 21.57 22.20 1.25 4.6.2005 3:28:00 1520 91200 26400 22.195
22.50 22.82 23.45 1.25 4.6.2005 3:30:00 1080 64800 64800 23.445
23.75 24.07 24.70 1.25 4.6.2005 3:30:00 10 10 10 24.695 **
* Unable to measure flow rate. Moving the tool to next measuring point.
** In FlowCalc column the negative and zero values are presented as zero. 10 ml is presented due to graphical reasons..
Negative values are due to measuring accuracy.

99
10 1001000
10000100000
Flow rate (mL/h)
30
29
28
27
26
25
24
23
22
21
20
19
18
17
16
15
14
13
12
11
10
9
8
7
6
5
4
3
2
1
0
De
pth
(m
)
Calculated difference flow (Section = 1.25 m, Flow direction = into the hole)2005-06-04
Measured flow along the borehole using manual flow logging device, 2005-06-04
Olkiluoto, Borehole OLPR0502DMeasure T2Measured flow rate of the borehole before flow logging = 129 000 ml / h

100

101
APPENDIX 6: RESULTS OF TECHNICAL TESTS OF MIXES IN TEST GROUTINGRESULTS OF THE PILOT TEST 3, GROUTING TEST 6-7.6.2005 AT OLKILUOTOTunnel temperature 12 CGroundwater temperature 6.8 CTemperature in fall cone tests 15-20 C
Flow meter to dose the water was checked: the value 8.75 l corresponded to 10 l in reality
MIX P308B Batch 1 Teor. density 1349 50 kg/m3Mixing ready at 13:40 Meas. density 1400 kg/m3
TimeTime from
mixing (h:mm)
Marsh cone value (s)
Filter pump 100 μm (ml)
Fall cone (mm)
Shear strength
(kPa)Bleeding (%) Notes
13:52 0:12 49 Small pieces (< 1 mm) in the meshof the Marsh cone
14:00 0:20 50 Filter pump did not work
MIX P308B Batch 2 Teor. density 1349±50 kg/m3Mixing ready at 15:17 Meas. density 1380 kg/m3
TimeTime from
mixing (h:mm)
Marsh cone value (s)
Filter pump 100 μm (ml)
Fall cone (mm)
Shear strength
(kPa)Bleeding (%) Notes
15:27 0:10 4315:30 0:13 24015:31 0:14 240
MIX P308B Batch 3 Teor. density 1349±50 kg/m3Mixing ready at 18:20 Meas. density 1350 kg/m3
TimeTime from
mixing (h:mm)
Marsh cone value (s)
Filter pump 100 μm (ml)
Fall cone (mm)
Shear strength
(kPa)Bleeding (%) Notes
18:22 0:02 44.518:25 0:05 30 Filter pump did not work18:26 0:06 30 Filter pump did not work18:35 0:15 300 Uncertain result21:00 2:40 >20 < 0.1 0-122:18 3:58 14 0.137:00 12:40 2.5 (60g) > 118:40 14:20 1.2 (60g) > 11
Samples casted for fall cone test at 18:50Shear strength values are approximates
MIX P308B Batch 4 kg/m3Sample taken at 21:20 kg/m3
kg/cm3
TimeTime from
mixing (h:mm)
Marsh cone value (s)
Filter pump 100 μm (ml)
Fall cone (mm)
Shear strength
(kPa)Bleeding (%) Notes
7:00 9:40 2 (60g) > 118:40 11:20 1 (60g) > 11
Sample only for fall cone test - taken at 21:20Shear strength values are approximates

102
MIX P307B Teor. density 1396±50 kg/m3Mixing ready at 15:50 Meas. density 1440 kg/m3
Weight kg/cm3
TimeTime from
mixing (h:mm)
Marsh cone value (s)
Filter pump 100 μm (ml)
Fall cone (mm)
Shear strength
(kPa)Bleeding (%) Notes
16:00 0:10 4316:03 0:13 17016:04 0:14 300 Uncertain result19:03 3:13 14.1 0.13 020:07 4:17 8.8 0.3120:58 5:08 5 0.9822:15 6:25 1.2 > 1.67:00 14:40 0 (60g) > 11
Sample casted for fall cone test at 16:20Shear strength values are approximates, except the values got at 20:07 and 20:58

10
3
AP
PE
ND
IX 7
: G
RO
UT
ING
HO
LE
DR
ILL
ING
LO
G
SIT
E:
AC
CE
SS
TU
NN
EL, F
AN
28
502
9m
DR
ILLM
AN
:A
T-4
5m
FO
RE
MA
N:
AT
1m
Hole
Dri
lling
H
ole
K-v
alu
eN
ote
sle
ng
thd
iam
.so
ftnorm
al
hard
join
tscr
ush
ed
open
dry
min
or
norm
al
majo
rD
isp.
me
asu
rin
g t
ime
5m
in
nr
[m]
[mm
][m
-m]
[m-m
][m
-m]
[m-m
][m
-m]
[m-m
][l/
min
][l/
min
][l/
min
][l/
min
]L
ug
812
16
12
8[b
ar]
12
6.0
54
X20
-24
0.7
5l
0.0
00.0
00
.00
0.0
00
.00
0.0
0Lu
g
22
6.0
54
X11
-15
20,2
2X
l
0.0
00.0
00
.00
0.0
00
.00
0.0
0Lu
g
32
6.0
54
X20
-26
Xl
0.0
00
.00.0
0.0
0.0
0.0
Lu
g
42
6.0
54
X6
-9X
l
20
-24
0.0
00
.00.0
0.0
0.0
0.0
Lu
g
52
6.0
54
X20
-26
12
Xl
0.0
00
.00.0
0.0
0.0
0.0
Lu
g
62
6.0
54
X9
-12
15
Xl
0.0
00.0
00
.00
0.0
00
.00
0.0
0Lu
g
gre
y
M.J
un
ttila
30
gre
y
gre
y
T.K
uru
/R.P
ääkk
öS
TA
RT
ING
TIM
E:
A.R
aja
salo
/E
ND
ING
TIM
E:
ON
KA
LO
W
OR
K 1
03
DR
AW
ING
:
DR
ILLIN
G L
OG
NR
GR
OU
TIN
G H
OL
E D
RIL
LIN
GK
AT
126
-03
51
-22
DR
ILLIN
G:
5.6
.20
05
6.6
.20
05
Rock
qua
lity
Fra
cturi
ng
gre
y
Wa
ter
lea
kag
es
Colo
ur
gre
y
of
wate
r
Me
eri
Pö
lläne
n
-
Wate
rloss
me
asu
rem
ent
WA
TE
RL
OS
S M
EA
S.:
MIN
UT
ES
-KE
EP
ER
:
gre
y
GR
OU
ND
WA
TE
R H
EA
D:
ST
AT
ION
:
AV
ER
AG
E Z
:
PA
CK
ER
DE
PT
H:
10
.00
pm
10
.00
am

10
4
72
6.0
54
X15
-18
Xl
20
-24
0.0
00.0
00
.00
0.0
00
.00
0.0
0Lu
g
82
6.0
54
9-1
4X
12
-14
10.4
l
20
-25
0.0
00
.00.0
0.0
0.0
0.0
Lu
g
92
6.0
54
X12
7.4
l
0.0
00
.00.0
0.0
0.0
0.0
Lu
g
10
26
.05
4X
22,2
44
.1l
0.0
00
.00.0
0.0
0.0
0.0
Lu
g
11
26
.05
4X
9X
l
0.0
00
.00.0
0.0
0.0
0.0
Lu
g
12
26
.05
4X
18,2
0X
l
0.0
00
.00.0
0.0
0.0
0.0
Lu
g
13
26
.05
4X
20
-23
Xl
0.0
00
.00.0
0.0
0.0
0.0
Lu
g
14
26
.05
4X
0.3
l
0.0
00
.00.0
0.0
0.0
0.0
Lu
g
15
26
.05
4X
16,2
0X
l
0.0
00
.00.0
0.0
0.0
0.0
Lu
g
16
26
.05
4X
20
-23
1.5
l
0.0
00
.00.0
0.0
0.0
0.0
Lu
g
17
26
.05
4X
20
-22
16
0.5
5l
0.0
00
.00.0
0.0
0.0
0.0
Lu
g
18
26
.05
4X
12
-15
1.4
5l
0.0
00
.00.0
0.0
0.0
0.0
Lu
g
gre
y
gre
y
gre
y
gre
y
gre
y
gre
y
gre
y
gre
y
gre
y
gre
y
gre
y
gre
y

10
5
19
26
.05
4X
14
-19
0.7
l
0.0
00
.00.0
0.0
0.0
0.0
Lu
g
20
26
.05
4X
20
-22
Xl
25
-26
0.0
00
.00.0
0.0
0.0
0.0
Lu
g
21
26
.05
4X
15
2.4
l
0.0
00
.00.0
0.0
0.0
0.0
Lu
g
22
26
.05
4X
10,1
1X
l
0.0
00
.00.0
0.0
0.0
0.0
Lu
g
23
26
.05
4X
22
-24
Xl
0.0
00
.00.0
0.0
0.0
0.0
Lu
gT
ota
l 23
59
8pcs
m
gre
y
gre
y
gre
y
0 pcs
Ka
llio
rake
nnu
s O
y Ilk
ka P
uro
2004
Dri
llin
g lo
g v
ers
ion
4.0
gre
y
gre
y

10
6
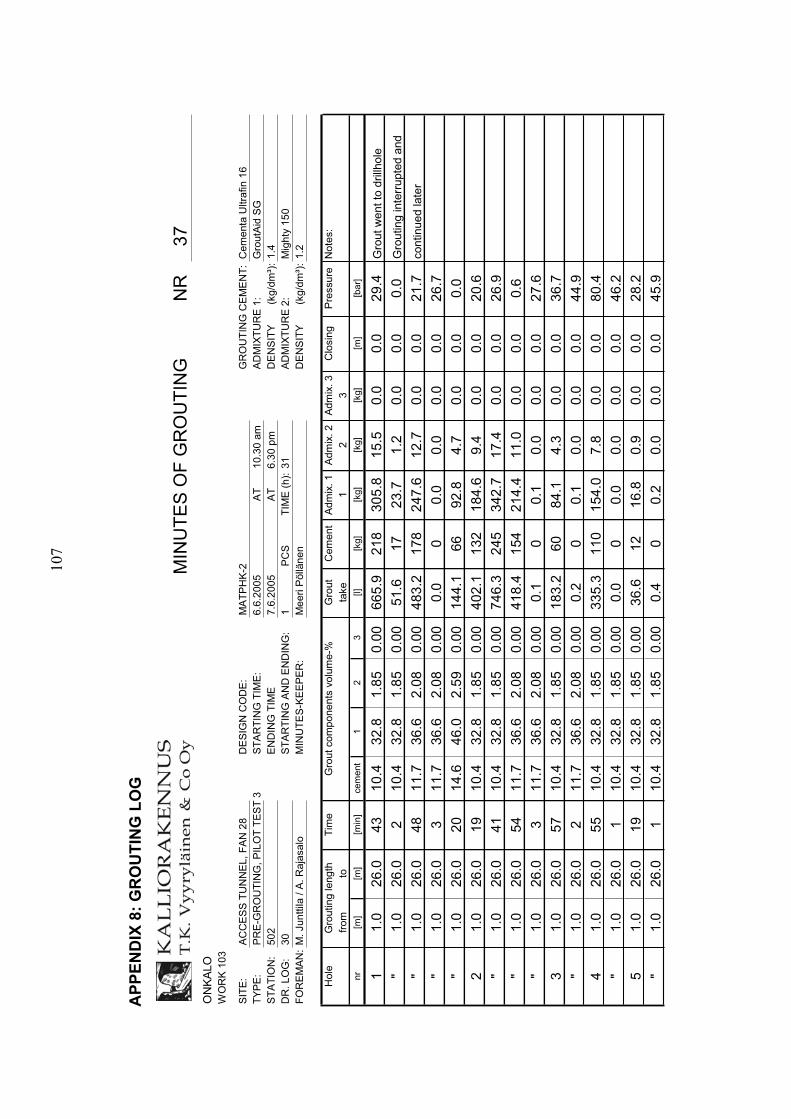
10
7
AP
PE
ND
IX 8
: G
RO
UT
ING
LO
G
ON
KA
LO
WO
RK
103
SIT
E:
DE
SIG
N C
OD
E:
GR
OU
TIN
G C
EM
EN
T:
TY
PE
:P
RE
-GR
OU
TIN
G,
PIL
OT
TE
ST
3S
TA
RT
ING
TIM
E:
AT
10
.30
am
AD
MIX
TU
RE
1:
ST
AT
ION
:E
ND
ING
TIM
E7.6
.2005
AT
6.3
0 p
mD
EN
SIT
Y(k
g/d
m³)
:1
.4
DR
. L
OG
:30
ST
AR
TIN
G A
ND
EN
DIN
G:
1P
CS
TIM
E (
h):
31
AD
MIX
TU
RE
2:
FO
RE
MA
N:
MIN
UT
ES
-KE
EP
ER
:D
EN
SIT
Y(k
g/d
m³)
:1
.2
Ho
leT
ime
Gro
ut
Ce
me
nt
Ad
mix
. 1
Ad
mix
. 2
Ad
mix
. 3
Clo
sin
gP
ress
ure
fro
mto
take
12
3
nr
[m]
[m]
[min
]ce
ment
12
3[l]
[kg]
[kg]
[kg]
[kg]
[m]
[bar]
11
.02
6.0
43
10
.43
2.8
1.8
50
.00
66
5.9
21
83
05
.81
5.5
0.0
0.0
29
.4
"1
.02
6.0
21
0.4
32
.81
.85
0.0
05
1.6
17
23
.71
.20
.00
.00
.0
"1
.02
6.0
48
11
.73
6.6
2.0
80
.00
48
3.2
17
82
47
.61
2.7
0.0
0.0
21
.7
"1
.02
6.0
31
1.7
36
.62
.08
0.0
00
.00
0.0
0.0
0.0
0.0
26
.7
"1
.02
6.0
20
14
.64
6.0
2.5
90
.00
14
4.1
66
92
.84
.70
.00
.00
.0
21
.02
6.0
19
10
.43
2.8
1.8
50
.00
40
2.1
13
21
84
.69
.40
.00
.02
0.6
"1
.02
6.0
41
10
.43
2.8
1.8
50
.00
74
6.3
24
53
42
.71
7.4
0.0
0.0
26
.9
"1
.02
6.0
54
11
.73
6.6
2.0
80
.00
41
8.4
15
42
14
.41
1.0
0.0
0.0
0.6
"1
.02
6.0
31
1.7
36
.62
.08
0.0
00
.10
0.1
0.0
0.0
0.0
27
.6
31
.02
6.0
57
10
.43
2.8
1.8
50
.00
18
3.2
60
84
.14
.30
.00
.03
6.7
"1
.02
6.0
21
1.7
36
.62
.08
0.0
00
.20
0.1
0.0
0.0
0.0
44
.9
41
.02
6.0
55
10
.43
2.8
1.8
50
.00
33
5.3
11
01
54
.07
.80
.00
.08
0.4
"1
.02
6.0
11
0.4
32
.81
.85
0.0
00
.00
0.0
0.0
0.0
0.0
46
.2
51
.02
6.0
19
10
.43
2.8
1.8
50
.00
36
.61
21
6.8
0.9
0.0
0.0
28
.2
"1
.02
6.0
11
0.4
32
.81
.85
0.0
00
.40
0.2
0.0
0.0
0.0
45
.9
Mig
hty
15
0
Gro
ut w
en
t to
drillh
ole
contin
ue
d la
ter
No
tes:
Gro
utin
g in
terr
upte
d a
nd
MIN
UT
ES
OF
GR
OU
TIN
GN
R
Gro
utA
id S
G
Ce
me
nta
Ultr
afin
16
MA
TP
HK
-2
6.6
.20
05
37
AC
CE
SS
TU
NN
EL,
FA
N 2
8
M.
Jun
ttila
/ A
. R
aja
salo
Gro
utin
g le
ng
th
50
2
Me
eri
Pö
llän
en
Gro
ut
com
po
ne
nts
vo
lum
e-%

10
8
61
.02
6.0
28
10
.43
2.8
1.8
50
.00
88
.42
94
0.6
2.1
0.0
0.0
28
.7
"1
.02
6.0
11
0.4
32
.81
.85
0.0
00
.10
0.0
0.0
0.0
0.0
44
.7
71
.02
6.0
87
10
.43
2.8
1.8
50
.00
74
9.0
24
63
43
.91
7.5
0.0
0.0
22
.8
"1
.02
6.0
45
11
.73
6.6
2.0
80
.00
21
7.3
80
11
1.3
5.7
0.0
0.0
29
.9
81
.02
6.0
20
10
.43
2.8
1.8
50
.00
11
0.5
36
50
.72
.60
.00
.02
8.1
91
.02
6.0
10
41
0.4
32
.81
.85
0.0
03
31
.91
09
15
2.4
7.7
0.0
0.0
26
.3
10
1.0
26
.01
29
10
.43
2.8
1.8
50
.00
74
9.2
24
63
44
.01
7.5
0.0
0.0
25
.5
"1
.02
6.0
16
11
.73
6.6
2.0
80
.00
22
.78
11
.60
.60
.00
.02
5.8
11
1.0
26
.03
01
0.4
32
.81
.85
0.0
01
46
.44
86
7.2
3.4
0.0
0.0
26
.8
12
1.0
26
.07
10
.43
2.8
1.8
50
.00
56
.81
92
6.1
1.3
0.0
0.0
31
.5
13
1.0
26
.08
21
0.4
32
.81
.85
0.0
07
69
.02
52
35
3.1
17
.90
.00
.03
9.4
"1
.02
6.0
74
11
.73
6.6
2.0
80
.00
37
8.8
14
01
94
.19
.90
.00
.04
2.6
14
1.0
26
.04
10
.43
2.8
1.8
50
.00
4.2
11
.90
.10
.00
.04
5.6
15
1.0
26
.08
10
.43
2.8
1.8
50
.00
14
.65
6.7
0.3
0.0
0.0
40
.9
16
1.0
26
.07
31
0.4
32
.81
.85
0.0
07
53
.42
47
34
6.0
17
.60
.00
.03
5.5
"1
.02
6.0
27
11
.73
6.6
2.0
80
.00
17
8.2
66
91
.34
.70
.00
.04
2.5
17
1.0
26
.07
71
0.4
32
.81
.85
0.0
07
67
.42
52
35
2.4
17
.90
.00
.03
8.4
"1
.02
6.0
73
11
.73
6.6
2.0
80
.00
41
1.6
15
22
10
.91
0.8
0.0
0.0
41
.0
18
1.0
26
.06
10
.43
2.8
1.8
50
.00
59
.52
02
7.3
1.4
0.0
0.0
46
.1
19
1.0
26
.08
81
0.4
32
.81
.85
0.0
07
48
.52
46
34
3.7
17
.40
.00
.02
2.6
"1
.02
6.0
71
11
.73
6.6
2.0
80
.00
49
6.7
18
32
54
.51
3.0
0.0
0.0
28
.5
"1
.02
6.0
12
51
4.6
46
.02
.59
0.0
05
46
.52
52
35
1.9
17
.80
.00
.04
2.4
"1
.02
6.0
15
14
.64
6.0
2.5
90
.00
0.7
00
.50
.00
.00
.01
.1
20
1.0
26
.01
00
10
.43
2.8
1.8
50
.00
74
9.7
24
63
44
.31
7.5
0.0
0.0
34
.5
"1
.02
6.0
93
11
.73
6.6
2.0
80
.00
49
8.3
18
42
55
.31
3.1
0.0
0.0
32
.7
"1
.02
6.0
44
14
.64
6.0
2.5
90
.00
33
7.9
15
62
17
.61
1.0
0.0
0.0
41
.9

10
9
21
1.0
26
.01
11
0.4
32
.81
.85
0.0
06
.32
2.9
0.1
0.0
0.0
39
.4
22
1.0
26
.01
01
0.4
32
.81
.85
0.0
05
5.4
18
25
.41
.30
.00
.04
1.0
23
1.0
26
.01
06
14
.64
6.0
2.5
90
.00
62
2.2
28
74
00
.72
0.3
0.0
0.0
40
.4
24
1.0
29
.06
10
.43
2.8
1.8
50
.00
1.1
00
.50
.00
.00
.04
1.0
25
1.0
29
.08
91
0.4
32
.81
.85
0.0
07
69
.72
53
35
3.4
17
.90
.00
.02
0.7
"1
.02
9.0
51
10
.43
2.8
1.8
50
.00
17
5.3
58
80
.54
.10
.00
.00
.0
"1
.02
9.0
64
11
.73
6.6
2.0
80
.00
49
9.5
18
42
55
.91
3.1
0.0
0.0
23
.0
"1
.02
9.0
33
14
.64
6.0
2.5
90
.00
11
5.2
53
74
.23
.80
.00
.02
5.8
26
1.0
29
.01
51
0.4
32
.81
.85
0.0
03
8.2
13
17
.50
.90
.00
.04
8.0
27
1.0
29
.03
01
0.4
32
.81
.85
0.0
01
11
.93
75
1.4
2.6
0.0
0.0
44
.9T
ota
l 27
22
10
15
05
05
31
97429
.0377.7
0.0
0m
inl
kgkg
kgkg
kg
Pro
be h
ole
Pro
be h
ole
pum
pe
d o
nly
re
cipe
3
m71
4
Pro
be h
ole
Pro
be h
ole
Pro
be h
ole
Pro
be h
ole
Pro
be h
ole
Gro
utin
g m
inu
tes
vers
ion
2.6
Ka
llio
rake
nn
us
Oy
Ilkka
Pu
ro 2
00
4

11
0

111
APPENDIX 9: GROUTING PRESSURES, FLOW AND GROUT TAKE
Grouting hole 1Closing pressure 30 bar. Total grout take 1345 l.
Highest measured pressure 33,9 bar.
0
5
10
15
20
25
30
35
40
45
0:00:00 0:15:00 0:30:00 0:45:00 1:00:00 1:15:00 1:30:00 1:45:00 2:00:00 2:15:00 2:30:00
Time (hh:mm:ss)
Pre
ss
ure
(b
ar)
, F
low
(l/
min
)
0
200
400
600
800
1000
1200
1400
Vo
lum
e (
l)
Pressure
Flow
Volume
Recipe 2
Recipe 3
Grouting hole 1Closing pressure 30 bar. Total grout take 1345 l.
Highest measured pressure 33,9 bar.
0
5
10
15
20
25
30
35
40
0:15:00 0:20:00 0:25:00 0:30:00 0:35:00 0:40:00 0:45:00
Time (hh:mm:ss)
Pre
ss
ure
(b
ar)
, F
low
(l/
min
)
0
75
150
225
300
375
450
525
600
Vo
lum
e (
l)
Pressure
Flow
Volume

112
Grouting hole 2Closing pressure 30 bar. Total grout take 1567 l.
Highest measured pressure 43,5 bar.
0
5
10
15
20
25
30
35
40
45
0:00:00 0:15:00 0:30:00 0:45:00 1:00:00 1:15:00 1:30:00 1:45:00 2:00:00
Time (hh:mm:ss)
Pre
ss
ure
(b
ar)
, F
low
(l/m
in)
0
200
400
600
800
1000
1200
1400
1600
1800
Vo
lum
e (
l)
Pressure
Flow
VolumeRecipe 2
Grouting hole 2Closing pressure 30 bar. Total grout take 1566 l.
Highest measured pressure 43,5 bar.
0
5
10
15
20
25
30
35
40
45
0:00:00 0:05:00 0:10:00 0:15:00 0:20:00 0:25:00 0:30:00 0:35:00 0:40:00
Time (hh:mm:ss)
Pre
ss
ure
(b
ar)
, F
low
(l/
min
)
0
100
200
300
400
500
600
700
800
900
Vo
lum
e (
l)
Pressure
Flow
Volume

113
Grouting hole 3Closing pressure 30 bar. Total grout take 183 l.
Highest measured pressure 39,5 bar.
0
5
10
15
20
25
30
35
40
45
0:00:00 0:15:00 0:30:00 0:45:00 1:00:00
Time (hh:mm:ss)
Pre
ss
ure
(b
ar)
, F
low
(l/m
in)
0
200
400
600
800
1000
1200
1400
Vo
lum
e (
l)
Pressure
Flow
Volume
Grouting hole 3Closing pressure 30 bar. Total grout take 183 l.
Highest measured pressure 39,5 bar.
0
5
10
15
20
25
30
35
0:00:00 0:15:00 0:30:00
Time (hh:mm:ss)
Pre
ss
ure
(b
ar)
, F
low
(l/
min
)
0
30
60
90
120
150
180
210
Vo
lum
e (
l)
Pressure
Flow
Volume

114
Grouting hole 4Closing pressure 30 bar. Total grout take 335 l.
Highest measured pressure 82,1 bar.
0
10
20
30
40
50
60
70
80
90
0:00:00 0:15:00 0:30:00 0:45:00 1:00:00
Time (hh:mm:ss)
Pre
ss
ure
(b
ar)
, F
low
(l/m
in)
0
200
400
600
800
1000
1200
1400
Vo
lum
e (
l)
Pressure
Flow
Volume
Grouting hole 4Closing pressure 30 bar. Total grout take 335 l.
Highest measured pressure 82,1 bar.
0
5
10
15
20
25
30
35
40
45
0:00:00 0:05:00 0:10:00 0:15:00 0:20:00 0:25:00 0:30:00
Time (hh:mm:ss)
Pre
ss
ure
(b
ar)
, F
low
(l/
min
)
0
30
60
90
120
150
180
210
240
270
Vo
lum
e (
l)
Pressure
Flow
Volume

115
Grouting hole 5Closing pressure 30 bar. Total grout take 36,6 l.
Highest measured pressure 38,3 bar.
0
5
10
15
20
25
30
35
40
45
0:00:00 0:05:00 0:10:00 0:15:00 0:20:00
Time (hh:mm:ss)
Pre
ss
ure
(b
ar)
, F
low
(l/
min
)
0
200
400
600
800
1000
1200
1400
Vo
lum
e (
l)
Pressure
Flow
Volume
Grouting hole 6Closing pressure 30 bar. Total grout take 89 l.
Highest measured pressure 36,0 bar.
0
5
10
15
20
25
30
35
40
45
0:00:00 0:05:00 0:10:00 0:15:00 0:20:00 0:25:00 0:30:00
Time (hh:mm:ss)
Pre
ss
ure
(b
ar)
, F
low
(l/
min
)
0
200
400
600
800
1000
1200
1400
Vo
lum
e (
l)
Pressure
Flow
Volume

116
Grouting hole 7Closing pressure 30 bar. Total grout take 966 l.
Highest measured pressure 34,7 bar.
0
5
10
15
20
25
30
35
40
45
0:00:00 0:15:00 0:30:00 0:45:00 1:00:00 1:15:00 1:30:00 1:45:00 2:00:00 2:15:00 2:30:00
Time (hh:mm:ss)
Pre
ss
ure
(b
ar)
, F
low
(l/m
in)
0
200
400
600
800
1000
1200
1400
Vo
lum
e (
l)
Pressure
Flow
VolumeRecipe 2
Grouting hole 7Closing pressure 30 bar. Total grout take 966,3 l.
Highest measured pressure 34,7 bar.
0
5
10
15
20
25
30
35
0:00:00 0:05:00 0:10:00 0:15:00 0:20:00 0:25:00 0:30:00
Time (hh:mm:ss)
Pre
ss
ure
(b
ar)
, F
low
(l/
min
)
0
30
60
90
120
150
180
210
Vo
lum
e (
l)
Pressure
Flow
Volume

117
Grouting hole 8Closing pressure 30 bar. Total grout take 111 l.
Highest measured pressure 32,9 bar.
0
5
10
15
20
25
30
35
40
45
0:00:00 0:05:00 0:10:00 0:15:00 0:20:00
Time (hh:mm:ss)
Pre
ss
ure
(b
ar)
, F
low
(l/m
in)
0
200
400
600
800
1000
1200
1400
Vo
lum
e (
l)
Pressure
Flow
Volume
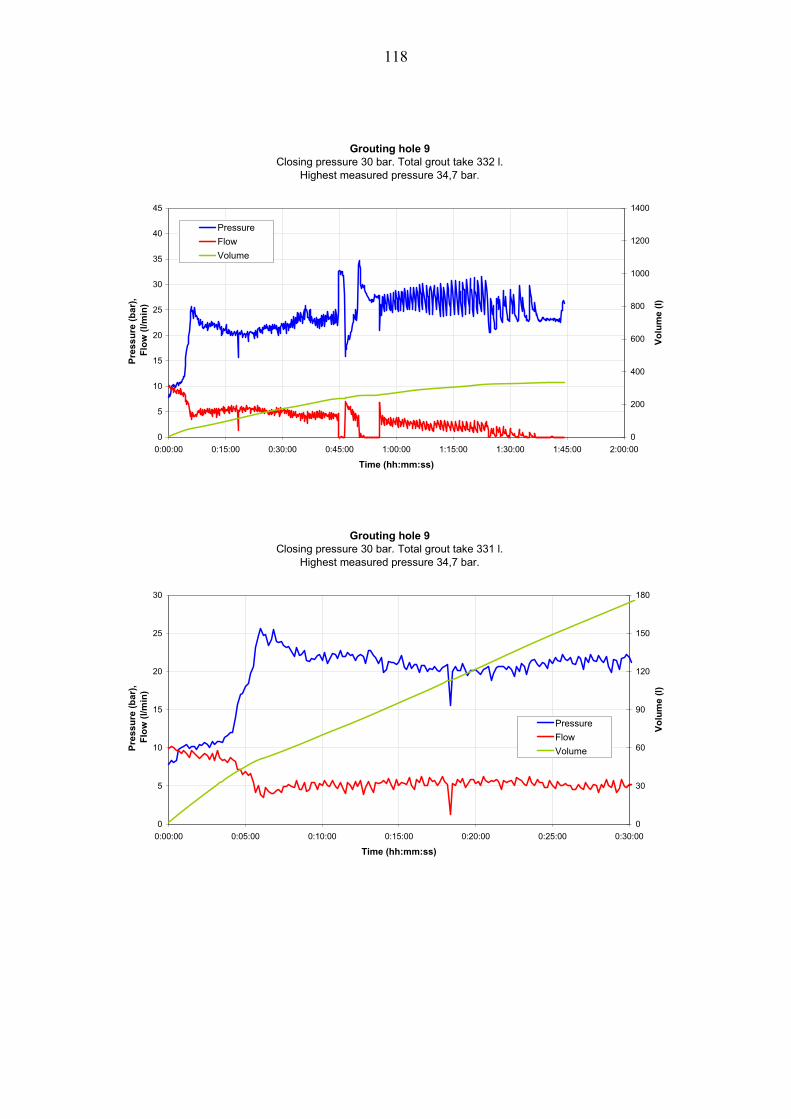
118
Grouting hole 9Closing pressure 30 bar. Total grout take 332 l.
Highest measured pressure 34,7 bar.
0
5
10
15
20
25
30
35
40
45
0:00:00 0:15:00 0:30:00 0:45:00 1:00:00 1:15:00 1:30:00 1:45:00 2:00:00
Time (hh:mm:ss)
Pre
ss
ure
(b
ar)
, F
low
(l/
min
)
0
200
400
600
800
1000
1200
1400
Vo
lum
e (
l)
Pressure
Flow
Volume
Grouting hole 9Closing pressure 30 bar. Total grout take 331 l.
Highest measured pressure 34,7 bar.
0
5
10
15
20
25
30
0:00:00 0:05:00 0:10:00 0:15:00 0:20:00 0:25:00 0:30:00
Time (hh:mm:ss)
Pre
ss
ure
(b
ar)
, F
low
(l/m
in)
0
30
60
90
120
150
180
Vo
lum
e (
l)
Pressure
Flow
Volume

119
Grouting hole 10Closing pressure 30 bar. Total grout take 771 l.
Highest measured pressure 27,7 bar.
0
5
10
15
20
25
30
35
40
45
0:00:00 0:15:00 0:30:00 0:45:00 1:00:00 1:15:00 1:30:00 1:45:00 2:00:00 2:15:00 2:30:00
Time (hh:mm:ss)
Pre
ss
ure
(b
ar)
, F
low
(l/
min
)
0
200
400
600
800
1000
1200
1400
Vo
lum
e (
l)
Pressure
Flow
Volume
Recipe 2
Grouting hole 10Closing pressure 30 bar. Total grout take 771 l.
Highest measured pressure 27,7 bar.
0
5
10
15
20
25
30
35
0:00:00 0:05:00 0:10:00 0:15:00 0:20:00 0:25:00 0:30:00
Time (hh:mm:ss)
Pre
ss
ure
(b
ar)
, F
low
(l/
min
)
0
50
100
150
200
250
300
350
Vo
lum
e (
l)
Pressure
Flow
Volume

120
Grouting hole 11Closing pressure 30 bar. Total grout take 146 l.
Highest measured pressure 30,4 bar.
0
5
10
15
20
25
30
35
40
45
0:00:00 0:05:00 0:10:00 0:15:00 0:20:00 0:25:00 0:30:00
Time (hh:mm:ss)
Pre
ss
ure
(b
ar)
, F
low
(l/m
in)
0
200
400
600
800
1000
1200
1400
Vo
lum
e (
l)
Pressure
Flow
Volume
Grouting hole 12Closing pressure 30 bar. Total grout take 56,8 l.
Highest measured pressure 34,0 bar.
0
5
10
15
20
25
30
35
40
45
0:00:00 0:01:00 0:02:00 0:03:00 0:04:00 0:05:00 0:06:00 0:07:00 0:08:00
Time (hh:mm:ss)
Pre
ss
ure
(b
ar)
, F
low
(l/m
in)
0
200
400
600
800
1000
1200
1400
Vo
lum
e (
l)
Pressure
Flow
Volume

121
Grouting hole 13Closing pressure 30 bar. Total grout take 1148 l.
Highest measured pressure 45,3 bar.
0
5
10
15
20
25
30
35
40
45
0:00:00 0:20:00 0:40:00 1:00:00 1:20:00 1:40:00 2:00:00 2:20:00 2:40:00
Time (hh:mm:ss)
Pre
ss
ure
(b
ar)
, F
low
(l/
min
)
0
200
400
600
800
1000
1200
1400
Vo
lum
e (
l)
Pressure
Flow
Volume
Recipe 2
Grouting hole 13Closing pressure 30 bar. Total grout take 1148 l.
Highest measured pressure 45,3 bar.
0
5
10
15
20
25
30
35
40
45
0:00:00 0:05:00 0:10:00 0:15:00 0:20:00 0:25:00 0:30:00
Time (hh:mm:ss)
Pre
ss
ure
(b
ar)
, F
low
(l/
min
)
0
30
60
90
120
150
180
210
240
270
Vo
lum
e (
l)
Pressure
Flow
Volume

122
Grouting hole 14Closing pressure 50 bar. Total grout take 4,2 l.
Highest measured pressure 46,0 bar.
0
5
10
15
20
25
30
35
40
45
50
55
60
65
0:00:00 0:01:00 0:02:00 0:03:00 0:04:00 0:05:00
Time (hh:mm:ss)
Pre
ss
ure
(b
ar)
, F
low
(l/
min
)
0
0.5
1
1.5
2
2.5
3
3.5
4
4.5
5
5.5
6
6.5
Vo
lum
e (
l)
Pressure
Flow
Volume
Grouting hole 15Closing pressure 50 bar. Total grout take 14,6 l.
Highest measured pressure 45,0 bar.
0
5
10
15
20
25
30
35
40
45
50
55
60
65
0:00:00 0:01:00 0:02:00 0:03:00 0:04:00 0:05:00 0:06:00 0:07:00 0:08:00
Time (hh:mm:ss)
Pre
ss
ure
(b
ar)
, F
low
(l/m
in)
0
2
4
6
8
10
12
14
16
18
Vo
lum
e (
l)
Pressure
Flow
Volume

123
Grouting hole 16Closing pressure 50 bar. Total grout take 932 l.
Highest measured pressure 43,4 bar.
0
5
10
15
20
25
30
35
40
45
50
55
60
65
0:00:00 0:15:00 0:30:00 0:45:00 1:00:00 1:15:00 1:30:00 1:45:00 2:00:00
Time (hh:mm:ss)
Pre
ss
ure
(b
ar)
, F
low
(l/
min
)
0
200
400
600
800
1000
1200
1400
Vo
lum
e (
l)
Pressure
Flow
Volume
Recipe 2
Grouting hole 16Closing pressure 50 bar. Total grout take 932 l.
Highest measured pressure 43,4 bar.
0
5
10
15
20
25
30
35
0:00:00 0:05:00 0:10:00 0:15:00 0:20:00 0:25:00 0:30:00
Time (hh:mm:ss)
Pre
ss
ure
(b
ar)
, F
low
(l/
min
)
0
50
100
150
200
250
300
350
Vo
lum
e (
l)
Pressure
Flow
Volume

124
Grouting hole 17Closing pressure 50 bar. Total grout take 1179 l.
Highest measured pressure 47,1 bar.
0
5
10
15
20
25
30
35
40
45
50
55
60
65
0:00:00 0:15:00 0:30:00 0:45:00 1:00:00 1:15:00 1:30:00 1:45:00 2:00:00 2:15:00 2:30:00
Time (hh:mm:ss)
Pre
ss
ure
(b
ar)
, F
low
(l/
min
)
0
200
400
600
800
1000
1200
1400
Vo
lum
e (
l)
Pressure
Flow
Volume
Recipe 2
Grouting hole 17Closing pressure 50 bar. Total grout take 1179 l.
Highest measured pressure 47,1 bar.
0
5
10
15
20
25
30
35
40
45
50
0:00:00 0:05:00 0:10:00 0:15:00 0:20:00 0:25:00 0:30:00
Time (hh:mm:ss)
Pre
ss
ure
(b
ar)
, F
low
(l/
min
)
0
25
50
75
100
125
Vo
lum
e (
l)
Pressure
Flow
Volume

125
Grouting hole 18Closing pressure 50 bar. Total grout take 60 l.
Highest measured pressure 48,8 bar.
0
5
10
15
20
25
30
35
40
45
50
55
60
65
0:00:00 0:01:00 0:02:00 0:03:00 0:04:00 0:05:00 0:06:00
Time (hh:mm:ss)
Pre
ss
ure
(b
ar)
, F
low
(l/
min
)
0
200
400
600
800
1000
1200
1400
Vo
lum
e (
l)
Pressure
Flow
Volume

126
Grouting hole 19Closing pressure 50 bar. Total grout take 1792 l.
Highest measured pressure 47,4 bar.
0
5
10
15
20
25
30
35
40
45
50
55
60
65
0:00:00 0:30:00 1:00:00 1:30:00 2:00:00 2:30:00 3:00:00 3:30:00 4:00:00 4:30:00 5:00:00 5:30:00
Time (hh:mm:ss)
Pre
ss
ure
(b
ar)
, F
low
(l/
min
)
0
200
400
600
800
1000
1200
1400
1600
1800
2000
Vo
lum
e (
l)
Pressure
Flow
Volume
Recipe 2
Recipe 3
Recipe 4
Grouting hole 19Closing pressure 50 bar. Total grout take 1792 l.
Highest measured pressure 47,4 bar.
0
5
10
15
20
25
30
35
0:00:00 0:05:00 0:10:00 0:15:00 0:20:00 0:25:00 0:30:00
Time (hh:mm:ss)
Pre
ss
ure
(b
ar)
, F
low
(l/m
in)
0
30
60
90
120
150
180
210
Vo
lum
e (
l)Pressure
Flow
Volume

127
Grouting hole 20Closing pressure 50 bar. Total grout take 1586 l.
Highest measured pressure 50,3 bar.
0
5
10
15
20
25
30
35
40
45
50
55
60
65
0:00:00 0:30:00 1:00:00 1:30:00 2:00:00 2:30:00 3:00:00 3:30:00 4:00:00
Time (hh:mm:ss)
Pre
ss
ure
(b
ar)
, F
low
(l/
min
)
0
200
400
600
800
1000
1200
1400
1600
1800
2000
Vo
lum
e (
l)
Pressure
Flow
Volume
Recipe 2
Recipe 3
Grouting hole 20Closing pressure 50 bar. Total grout take 1586 l.
Highest measured pressure 50,3 bar.
0
5
10
15
20
25
30
35
40
45
0:00:00 0:05:00 0:10:00 0:15:00 0:20:00 0:25:00 0:30:00
Time (hh:mm:ss)
Pre
ss
ure
(b
ar)
, F
low
(l/
min
)
0
40
80
120
160
200
240
280
Vo
lum
e (
l)
Pressure
Flow
Volume

128
Grouting hole 21Closing pressure 50 bar. Total grout take 6,3 l.
Highest measured pressure 84,0 bar.
0
10
20
30
40
50
60
70
80
90
0:00:00 0:01:00 0:02:00 0:03:00 0:04:00 0:05:00 0:06:00 0:07:00 0:08:00 0:09:00 0:10:00 0:11:00 0:12:00
Time (hh:mm:ss)
Pre
ss
ure
(b
ar)
, F
low
(l/
min
)
0
1
2
3
4
5
6
7
8
9
Vo
lum
e (
l)
Pressure
Flow
Volume
Grouting hole 22Closing pressure 50 bar. Total grout take 55,4 l.
Highest measured pressure 52,7 bar.
0
5
10
15
20
25
30
35
40
45
50
55
60
65
0:00:00 0:01:00 0:02:00 0:03:00 0:04:00 0:05:00 0:06:00 0:07:00 0:08:00 0:09:00 0:10:00 0:11:00
Time (hh:mm:ss)
Pre
ss
ure
(b
ar)
, F
low
(l/m
in)
0
200
400
600
800
1000
1200
1400
Vo
lum
e (
l)
Pressure
Flow
Volume

129
Grouting hole 23Closing pressure 50 bar. Total grout take 622 l.
Highest measured pressure 47,5 bar.
0
5
10
15
20
25
30
35
40
45
50
55
60
65
0:00:00 0:15:00 0:30:00 0:45:00 1:00:00 1:15:00 1:30:00 1:45:00 2:00:00
Time (hh:mm:ss)
Pre
ss
ure
(b
ar)
, F
low
(l/
min
)
0
200
400
600
800
1000
1200
1400
Vo
lum
e (
l)
Pressure
Flow
Volume
Probe hole 0502AClosing pressure 50 bar. Total grout take 1,1 l.
Highest measured pressure 46,9 bar.
0
5
10
15
20
25
30
35
40
45
50
55
60
65
0:00:00 0:01:00 0:02:00 0:03:00 0:04:00 0:05:00 0:06:00
Time (hh:mm:ss)
Pre
ss
ure
(b
ar)
, F
low
(l/
min
)
0
0.2
0.4
0.6
0.8
1
1.2
1.4
Vo
lum
e (
l)
Pressure
Flow
Volume

130
Probe hole 0502BClosing pressure 50 bar. Total grout take 1560 l.
Highest measured pressure 31,1 bar.
0
5
10
15
20
25
30
35
40
45
50
55
60
65
0:00:00 1:20:00 2:40:00 4:00:00 5:20:00 6:40:00 8:00:00 9:20:00 10:40:00 12:00:00 13:20:00
Time (hh:mm:ss)
Pre
ss
ure
(b
ar)
, F
low
(l/
min
)
0
200
400
600
800
1000
1200
1400
1600
Vo
lum
e (
l)
Pressure
Flow
Volume
Recipe 2
Recipe 3
Probe hole 0502BClosing pressure 50 bar. Total grout take 1560 l.
Highest measured pressure 31,1 bar.
0
2
4
6
8
10
12
14
16
18
20
0:00:00 0:05:00 0:10:00 0:15:00 0:20:00 0:25:00 0:30:00
Time (hh:mm:ss)
Pre
ss
ure
(b
ar)
, F
low
(l/m
in)
0
30
60
90
120
150
180
210
240
270
300
Vo
lum
e (
l)
Pressure
Flow
Volume

131
Probe hole PR0502CClosing pressure 50 bar. Total grout take 38,2 l.
Highest measured pressure 49,6 bar.
0
5
10
15
20
25
30
35
40
45
50
55
60
65
0:00:00 0:02:00 0:04:00 0:06:00 0:08:00 0:10:00 0:12:00 0:14:00 0:16:00
Time (hh:mm:ss)
Pre
ss
ure
(b
ar)
, F
low
(l/
min
)
0
20
40
60
80
100
120
Vo
lum
e (
l)
Pressure
Flow
Volume
Probe hole 0502DClosing pressure 50 bar. Total grout take 112 l.
Highest measured pressure 47,3 bar.
0
5
10
15
20
25
30
35
40
45
50
55
60
65
0:00:00 0:05:00 0:10:00 0:15:00 0:20:00 0:25:00 0:30:00
Time (hh:mm:ss)
Pre
ss
ure
(b
ar)
, F
low
(l/
min
)
0
20
40
60
80
100
120
Vo
lum
e (
l)
Pressure
Flow
Volume

132

13
3
AP
PE
ND
IX 1
0:
CO
NT
RO
L H
OL
E D
RIL
LIN
G L
OG
SIT
E:
502
9m
DR
ILL
MA
N:
AT
18
.50 p
m-4
5m
FO
RE
MA
N:
AT
19
.50 p
m1
m
Hole
Dri
llin
gH
ole
K-v
alu
eN
ote
sle
ng
thd
iam
.so
ftnorm
al
hard
join
tscr
ush
ed
open
dry
min
or
norm
al
majo
rD
isp.
measu
ring
tim
e5
min
nr
[m]
[mm
][m
-m]
[m-m
][m
-m]
[m-m
][m
-m]
[m-m
][l/
min
][l/
min
][l/
min
][l/
min
]L
ug
812
16
12
8[b
ar]
A2
1.0
54
XX
0.0
00
l/min
0.0
00.0
00.0
00.0
00.0
00.0
0Lu
g
B2
1.0
54
XX
0.0
00.9
l/min
0.0
10.0
00.0
10.0
00.0
00.0
0Lu
g
C2
1.0
54
XX
0.0
00
l/min
0.0
00.0
00.0
00.0
00.0
00.0
0Lu
g
D2
1.0
54
XX
0.0
01.2
l/min
0.0
10.0
00.0
20.0
00.0
00.0
0Lu
g
Tota
l
41
16
pcs
m
gre
y
Mee
ri P
öllä
ne
n
1-p
ress
ure
: 1
2 b
ar
WA
TE
LO
SS
ME
AS
.:
MIN
UT
ES
-KE
EP
ER
:
Ka
llio
rake
nn
us
Oy
Ilkka
Pu
ro 2
00
4
Dri
llin
g lo
g v
ers
ion
4.0
gre
y
Rock
qua
lity
Fra
cturi
ng
DR
ILLIN
G L
OG
NR
QU
AL
ITY
CO
NT
RO
L H
OL
ES
KA
T-1
26
-03
51
-23
KD
RIL
LIN
G:
ON
KA
LO
W
OR
K 1
03
DR
AW
ING
:A
CC
ES
S T
UN
NE
L
T.
Ku
ruS
TA
RT
ING
TIM
E:
A.
Ra
jasa
loE
ND
ING
TIM
E:
15
4 pcs
gre
y
gre
y
Wate
rlo
ss m
easu
rem
en
t
ST
AT
ION
:
Co
lour
of
wate
r
GR
OU
ND
WA
TE
R H
EA
D:
AV
ER
AG
E Z
:
PA
CK
ER
DE
PT
H:
Wate
r le
aka
ge
s
7.6
.20
05
7.6
.20
05

13
4

135
APPENDIX 11: RESULTS OF BATCH MIXING TEST 2
RESULTS OF THE PILOT TEST 3, BATCH MIXING TEST 18.8.2005 AT OLKILUOTO
Outside temperature 18.1-20.6 C (shadow) Marsh value for water 27.8 sWater temperature 18.3-19.2 CTemperature in fall cone test 7.4-14.2 C (in fridgerator, T lowering) Weighter shower wrong valuesMIX P307 W/DM 1.2, SPL 3% Teor. density 1397 50 kg/m3Mixing ready at 10:31 Meas. density 1310? kg/m3Mix temperature at Weight 1300 kg/cm3
TimeTime from
mixing (h:mm)
Marsh cone value (s)
Filter pump 100 μm (ml)
Cone size (g)Fall cone
(mm)
Shear strength
(kPa)Bleeding (%) Notes
10:33 0:02 37.0 It was observered that the 10:35 0:04 no result mixes were better mixes if 11:02 0:31 36.6 the batch was bigger than 10:40 0:09 started the minimum batch size12:28 1:57 013:29 2:58 013:35 2:30 10 16.9 0.15 Possibly some air bubbles14:48 3:43 10 12.5 0.16 were observed during 15:44 4:39 10 7.0 0.5 Marsh test16:42 5:37 10 7.0 0.517:45 6:40 10 4.8 1.04 Filter pump leaked18:49 7:44 60 9.0 2.068:10 20:05 100 1-2 46.9Samples casted for leaching tests at -Samples casted for fall cone test at 11:05
MIX P307B W/DM 1.2, SPL 4% Teor. density 1396±50 kg/m3Mixing ready at 10:45 Meas. density 1370 kg/m3Mix temperature at Weight 1340 kg/cm3
TimeTime from
mixing (h:mm)
Marsh cone value (s)
Filter pump 100 μm (ml)
Cone size (g)Fall cone
(mm)
Shear strength
(kPa)Bleeding (%) Notes
10:46 0:01 37.3 Filter pump leaked10:49 0:04 -11:15 0:30 37.4 Possibly some air bubbles11:17 0:32 started were observed during 12:28 1:43 0 Marsh test 13:29 2:44 013:35 2:35 10 16.6 0.1513:45 2:45 10 15.2 0.1514:49 3:49 10 10.5 0.2315:45 4:45 10 7 0.516:45 5:45 10 5.2 0.917:45 6:45 10 4 1.5718:51 7:51 60 6.5 3.898:10 21:10 100 1-2 46.9Samples casted for leaching tests at 11:00Samples casted for fall cone test at 10:50
MIX P308 W/DM 1.4, SPL 3% Teor. density 1350±50 kg/m3Mixing ready at 11:28 Meas. density 1360 kg/m3Mix temperature at 11:35 22.4 C Weight kg/cm3Mix temperature at 11:51 23.7 C
TimeTime from
mixing (h:mm)
Marsh cone value (s)
Filter pump 100 μm (ml)
Cone size (g)Fall cone
(mm)
Shear strength
(kPa)Bleeding (%) Notes
11:30 0:02 35.811:31 0:03 started11:59 0:31 36.012:00 0:32 no result filter pump leaked12:28 1:00 013:29 2:01 013:39 2:04 10 18-20 0.1514:46 3:11 10 18-20 0.1515:47 4:12 10 12.0 0.1716:47 5:12 10 7.8 0.417:45 6:10 10 5.4 0.8418:45 7:10 60 9.0 2.068:10 20:35 100 1-2 46.9Samples casted for leaching tests at 11:52Samples casted for fall cone test at 11:35 Temperature in fridgerator 7.4-14.2