Embed Size (px)
Citation preview
Noninvasive evaluation of collagen andhemoglobin contents and scatteringproperty of in vivo keloid scars andnormal skin using diffuse reflectancespectroscopy: pilot study
Sheng-Hao TsengChao-Kai HsuJulia Yu-Yun LeeShih-Yu TzengWan-Rung ChenYu-Kai Liaw
Downloaded From: https://www.spiedigitallibrary.org/journals/Journal-of-Biomedical-Optics on 7/3/2018Terms of Use: https://www.spiedigitallibrary.org/terms-of-use

Noninvasive evaluation of collagen and hemoglobincontents and scattering property of in vivo keloid scars andnormal skin using diffuse reflectance spectroscopy: pilotstudy
Sheng-Hao Tseng,a,b Chao-Kai Hsu,c,d Julia Yu-Yun Lee,c Shih-Yu Tzeng,a Wan-Rung Chen,c and Yu-Kai Liawa
aNational Cheng-Kung University, Department of Photonics, Tainan 701, TaiwanbNational Cheng-Kung University, Advanced Optoelectronic Technology Center, Tainan 701, TaiwancNational Cheng-Kung University College of Medicine and Hospital, Department of Dermatology, Tainan 701, TaiwandNational Cheng-Kung University College of Medicine and Hospital, Institute of Clinical medicine, Tainan 701, Taiwan
Abstract. Collagen is a rich component in skin that provides skin structure integrity; however, its contribution to theabsorption and scattering properties of various types of skin has not been extensively studied. We considered thecontribution of the collagen to the absorption spectrum of in vivo normal skin and keloids of 12 subjects derivedfrom our diffuse reflectance spectroscopy (DRS) system in the wavelength range from 550 to 860 nm. It was foundthat the collagen concentration, the hemoglobin oxygen saturation, and the reduced scattering coefficient of keloidswere remarkably different from that of normal skin. Our results suggest that our DRS system could assist clinicians inunderstanding the functional and structural condition of keloid scars. In the future, we will evaluate the accuracy ofour system in the keloid diagnosis and investigate the applicability of our system for other skin-collagen-relatedstudies. © 2012 Society of Photo-Optical Instrumentation Engineers (SPIE). [DOI: 10.1117/1.JBO.17.7.077005]
Keywords: diffuse reflectance spectroscopy; skin optical properties; skin collagen concentration.
Paper 12176 received Mar. 14, 2012; revised manuscript received Jun. 5, 2012; accepted for publication Jun. 6, 2012; published onlineJul. 18, 2012.
1 IntroductionKeloids occur as a result of abnormal wound healing and are char-acterized by excessive deposition of collagen in the dermis andextension of scar tissue beyond the original borders of thewounds.1,2 It has been reported that the predominant extracellularmatrix (ECM) component that synthesized by keloid-derivedfibroblast is collagen.3 Keloids do not regress with time andare usually difficult to treat or surgically remove because the treat-ment result is unpredictable and the recurrence rate is high. Thepathogenesis of keloid is still unclear and the theories that exist toexplain the keloid formation are not mutually exclusive.2 Despitethe large amount of research devoted to the scar therapy, currentlythere is no reliable keloid treatment modality. For example, intra-lesional corticosteroid injection, surgery, compression therapy,silicone therapy, radiation therapy, laser therapy, and pharmaco-logic therapy have been used for keloid treatment, but no singlemethod has produced consistent results.4–6
Most clinicians rely on the visible light photography or the tis-sue biopsy to characterize and/or monitor the growth andredness of keloid. However, these methods are usually not quan-titative and not objective and can only derive limited informationof problem scars. Since collagen and elastin can efficientlygenerate second harmonic generation (SHG) and two-photonexcited fluorescence (TPEF) signals, respectively, SHG andTPEF imaging techniques have been used to investigate thedistribution of collagen and elastin of various ECM relatedskin problems such as wound healing and photoaging.7–9
Recently, SHG and TPEF based imaging techniques have beenused to study the ECM structure of normal and keloid skin exvivo; the structure and the volume concentration of collagenand elastin were found to be distinct between normal and keloidskin.10–12 The multi-photon microscopy has been used for in vivoand ex vivo collagen and elastin quantification, and it has been sug-gested that the multi-photon microscopy could be a potential toolfor in vivo keloid and scar diagnosis.10–13 However, the long mea-surement time, the relatively high overall system cost, and the lackof ability to quantify skin redness are the limiting factors forwidely adopting the multi-photon-based techniques in the clinicalsetting for investigating keloid disease.
In this paper, we demonstrate the use of a relatively lowsystem cost, high measurement efficiency diffuse reflectancespectroscopy (DRS) technique to characterize the opticalproperties of keloid and normal skin in vivo. Different fromthe multi-photon microscopy that provides structural informationof tissues, DRS is useful for obtaining the macroscopic informa-tion, such as scattering property, collagen concentration, andhemoglobin concentration, of tissue samples. DRS has beenemployed to study the optical properties of various types ofbiological tissue, for example, brain, breast, and skin.14–16 Thegeneral measurement configuration of this technique involvesthe injection of visible to near-infrared light into the tissueunder investigation as well as the collection of the diffuse reflec-tance from the tissue using a detector placed on the same side withthe light source. A photon transport model is usually needed torecover the absorption and scattering properties of samplesfrom the measured diffuse reflectance. Moreover, the absorption
Address all correspondence to: Sheng-Hao Tseng, National Cheng-Kung Univer-sity, Department of Photonics, Tainan 701, Taiwan; Tel: 886-6-2757575ext:63925; Fax: 886-6-2084933; E-mail: [email protected] 0091-3286/2012/$25.00 © 2012 SPIE
Journal of Biomedical Optics 077005-1 July 2012 • Vol. 17(7)
Journal of Biomedical Optics 17(7), 077005 (July 2012)
Downloaded From: https://www.spiedigitallibrary.org/journals/Journal-of-Biomedical-Optics on 7/3/2018Terms of Use: https://www.spiedigitallibrary.org/terms-of-use
spectra derived from the DRS measurements can be further trans-lated into the concentrations of tissue chromophores: hemoglobin,melanin, water, and lipid, for instance. The average interrogationdepth of DRS is proportional to the separation between the sourceand the detector at a given source wavelength.17 The interrogationdepth of DRS reduces dramatically as the source wavelengthapproaches visible and infrared regions due to the strong absorp-tion features of hemoglobin and water, respectively. In general,DRS measurements employing source-detector separations largerthan 10 mm can work with a simple, efficient “standard diffusionmodel” in the near infrared region, where tissue absorption andscattering are relatively low, to investigate the functional informa-tion, such as oxygen saturation and status of edema, of deep tissuessuch as breast and muscle.15,18 Lately, Nachabe et al. and Taroni etal. reported the use of DRS techniques to quantify the collagencontent of breast tissues.19,20 They found that the collagen concen-tration of in vivo biological tissues can be reasonably derived, andit could be used as one of important factors for the breast tumorclassification.
Applying DRS to study superficial tissues often requires accu-rate yet complicatedmodels, such as theMonte Carlomethod andthe radiative transport theory.21,22 The simple and efficient stan-dard diffusion model generally cannot be used to describe photonpropagation in such applications where the source-detectorseparations have to be short and the detected photons are not suffi-ciently diffused.23 The standard diffusionmodel fails here becausethe majority of detected photons do not travel long enough tosatisfy thediffusion approximation,which is the essential assump-tion in deriving the standard diffusion equation from the radiativetransport theory.17,24 However, in our previous studies,we demon-strated that, by employing a specially designed “diffusing probe,”the optical properties of in vivo skin could be efficiently recoveredusing an efficient standard diffusion theory.16,25 The diffusing
probe incorporates a high scatteringmaterial to effectively diffusethe photons before they arrive at the detector, and therefore thevalidity of the diffusion approximation is assured even at avery short, source-detector separation. The absorption spectraof skin derived from the diffusing probe measurements wereutilized to calculate the chromophore concentrations andmonitor the hemodynamics of dermis.25 In this pilot study, the dif-fusing probe was employed to measure the diffuse reflectance ofkeloid and normal skin of 12 subjects. We considered the contri-bution of collagen absorption to the skin absorption and deter-mined the collagen and hemoglobin concentrations from theskin absorption spectra. To the best of our knowledge, this isthe first report of the use of the DRS method to evaluate the col-lagen content of in vivo normal and pathological skin.
2 Materials and Methods
2.1 In Vivo Keloid Measurement
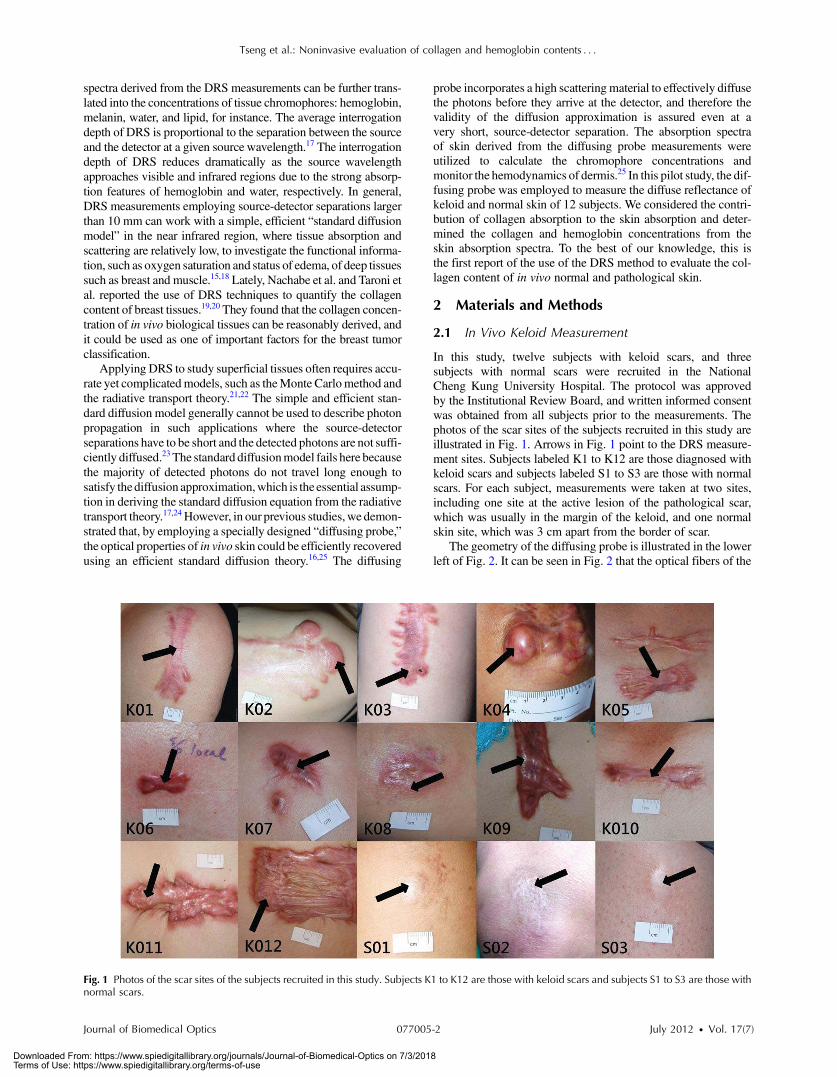
In this study, twelve subjects with keloid scars, and threesubjects with normal scars were recruited in the NationalCheng Kung University Hospital. The protocol was approvedby the Institutional Review Board, and written informed consentwas obtained from all subjects prior to the measurements. Thephotos of the scar sites of the subjects recruited in this study areillustrated in Fig. 1. Arrows in Fig. 1 point to the DRS measure-ment sites. Subjects labeled K1 to K12 are those diagnosed withkeloid scars and subjects labeled S1 to S3 are those with normalscars. For each subject, measurements were taken at two sites,including one site at the active lesion of the pathological scar,which was usually in the margin of the keloid, and one normalskin site, which was 3 cm apart from the border of scar.
The geometry of the diffusing probe is illustrated in the lowerleft of Fig. 2. It can be seen in Fig. 2 that the optical fibers of the
Fig. 1 Photos of the scar sites of the subjects recruited in this study. Subjects K1 to K12 are those with keloid scars and subjects S1 to S3 are those withnormal scars.
Journal of Biomedical Optics 077005-2 July 2012 • Vol. 17(7)
Tseng et al.: Noninvasive evaluation of collagen and hemoglobin contents : : :
Downloaded From: https://www.spiedigitallibrary.org/journals/Journal-of-Biomedical-Optics on 7/3/2018Terms of Use: https://www.spiedigitallibrary.org/terms-of-use

diffusing probe are aligned. To investigate the possible tissueinhomogeneity of keloid and normal skin, measurements werecarried out in two orthogonal fiber alignment directions foreach site. This was achieved by rotating the diffusing probe by90 deg after one set of measurements were done and carriedout another set ofmeasurements on the same site. Each set ofmea-surementswascomposedof fivemeasurements inwhich theprobewas physically removed and replaced each time. Thus a total num-ber of 20 measurements were taken on each subject, which tookabout five minutes to complete. The Vancouver scar scale (VSS)was also rated by the clinician for each scar. TheVSSevaluates thepliability, the height, the vascularity, and the pigmentation of thescar and is accepted by many dermatologists and plastic surgeonsas a sort of quantitative measure of the scar condition.26
2.2 Instrumentation
The configuration of the measurement system is shown in Fig. 2.The optical fibers employed in this probe are multimode fiberswith 440-μm core diameter and 0.22 numerical aperture. Thediameter of the high scattering Spectralon (Labshpere, NH)slab is 6.5 mm. The detection fiber penetrates the1-mm-thick Spectralon layer so that it is flush with the lowersurface of the Spectralon. There are four source fibers placedon the upper surface of the Spectralon; their distances fromthe detection fiber are 1.44, 1.92, 2.4, and 2.88 mm,respectively. The presence of the Spectralon can effectivelydiffuse the photons coming from the source fibers beforethey hit the sample. The asymmetric arrangement of the detectorfiber and the source fibers is to ensure that the all detectedphotons are diffused and have passed through the sample.
A spectrometer equipped with a back-thinned CCD(QE65000, Ocean Optics, FL) was used to collect reflectancefrom the detector fiber. An 1*4 optical switch (PiezosystemJena, Germany) bridged the optical fiber connecting to abroadband Tungsten Halogen light source (HL2000, OceanOptics, FL) and one of the four source optical fibers of the dif-fusing probe at a time. The spectrometer and the optical switchwere connected to a laptop computer and were coordinated andcontrolled by a graphic user interface developed based on Lab-view (National Instruments, TX). At each measurement, fourreflectance spectra associated with four source-detector pairswere sequentially acquired and stored into one file. The averagetime required to take one complete measurement was about 10 s.Due to limited light intensity of the light source and spectralrange of the spectrometer, the diffuse reflectance spectraacquired in this study were within 550 to 860 nm range.
2.3 Determination of Skin Optical Properties andChromophore Concentrations
A modified two-layer diffusion model described in the next sec-tion was employed as a forward model essential for solving theinverse problem that converted the diffuse reflectance spectra tothe absorption and reduced scattering spectra. The derivedreduced scattering spectra were fit to the scattering powerlaw (μ 0
s ¼ a � λ-b) to obtain “a” and “-b” parameters and tosmooth the raw scattering spectra. The parameters “a” and λrepresent the magnitude of scattering and the wavelength innanometer, respectively. The wavelength exponent “b” charac-terizes the mean size of the tissue scatterers and defines spectralbehavior of the reduced scattering coefficient.27 The recoveredabsorption spectra were fit linearly with known chromophoreabsorption spectra, including oxygenated hemoglobin, deoxyge-nated hemoglobin, melanin, and collagen, as depicted in Fig. 3,to extract the tissue chromophore concentrations based onBeer’s law.20,28,29 Jacques et al. obtained the melanin absorptionspectrum from measuring the extinction of human skin melano-somes,28 and Taroni et al. determined the collagen absorptionspectrum based on the collagen type I powder from bovineAchilles tendon at a density of 0.196 g∕cm3 (Ref. 20). Sincethe collagen sample used for deriving the absorption spectrumhad a density of 0.196 g∕cm3, by assuming dry collagen has adensity of 1.4 g∕cm3 (Ref. 30), we can estimate the volumepercent concentration of collagen of the sample. It should benoted that the recovered chromophore concentration representthe equivalent concentration of homogeneously distributedchromophores, thus the recovered concentrations could deviatefrom the true values. In addition, it can be observed in Fig. 3 thatthe collagen absorption increases as the wavelength decreases,which is similar to the trend of melanin absorption. Thus therecovered collagen and melanin concentration could possiblybe correlated. To investigate the correlation between the tworecovered chromophore concentrations, statistical analyseswere performed and will be discussed in the next section.
The interrogation depth of the diffusing probe can beestimated using Monte Carlo simulations. We demonstratedthat the average probing depth of diffusing probe is generallyless than 2 mm depending on the optical properties of sample.25
In this study, we defined the interrogation depth of a MonteCarlo simulation as follows. Let Pi ¼ Wi∕
Pni¼1 Wi, where
Wi is the weight of a detected photon packet and n is the
Fig. 2 Configuration of the DRS system and the diffusing probe used inthis study.
550 600 650 700 750 800 850
0.000
0.002
0.004
0.006
0.008
0.010
0.012
0.014
0.016
Wavelength (nm)
a(1
/mm
)
Melanosome *10-4
Collagen Hb (1µM) HbO
2 (1µM)
Fig. 3 Absorption spectra of one ten-thousandth of pure melanosome,collagen type I, 1 μM deoxygenated hemoglobin, and 1 μM oxygenatedhemoglobin.
Journal of Biomedical Optics 077005-3 July 2012 • Vol. 17(7)
Tseng et al.: Noninvasive evaluation of collagen and hemoglobin contents : : :
Downloaded From: https://www.spiedigitallibrary.org/journals/Journal-of-Biomedical-Optics on 7/3/2018Terms of Use: https://www.spiedigitallibrary.org/terms-of-use

total number of photon packets detected. The averageinterrogation depth of a simulation is determined asz̄ ¼ P
ni¼1 PiðzaveÞi, where zave ¼
Pmj¼1 dj∕m is the average
penetration depth of a detected photon packet, dj is the depthat which a collision happens in the sample, and m is thetotal collision number in the sample of the detected photonpacket. Based on the optical properties of the skin (either normalor scarred) that will be shown later, our Monte Carlo simulationresults indicate that the average interrogation depth of thediffusing probe is in the range from 293 to 949 μm withinthe 550 to 860 nm wavelength region. At short wavelengths,the interrogation depth is relatively shallow due to high hemo-globin absorption, and at long wavelengths, the interrogationdepth is relatively deep due to low absorption and scatteringproperties of typical skin. The recovered optical propertiesfrom DRS measurements represent the average property of abulk sample. From our simulations results, it can be estimatedthat the absorption and scattering spectra determined from oursystem characterize the average optical properties of humandermis and epidermis.
2.4 Theory
The photon propagation model in the modified two-layer geo-metry has been described in detail previously.25 In this section,we briefly describe its derivation. In a two-layer turbid med-ium system, the diffusion equation can be written as:
�1
ci
∂∂t
þ μai − ∇½DiðrÞ∇��Φiðr; tÞ ¼ Siðr; tÞ; (1)
where D ¼ 1∕3ðμa þ μsÞ and Φ are the diffusion constant andthe fluence rate, respectively. S is the source term, c is thespeed of light in the medium, and i ¼ 1, 2 is the numberof the layer. The pencil beam light source from the sourcefiber can be approximated as a point source beneath the sur-face and is expressed as S1 ¼ δðx; y; z-z0Þ and S2 ¼ 0, wherez0 ¼ 1∕ðμa þ μ 0
sÞ) is the location of the point source.31 Byapplying the extrapolated boundary condition and assumingthe fluence and the flux are continuous at the boundary, thefluence rate of the diffusion equation system can be solved inthe Fourier domain. The detector in the modifiedtwo-layer geometry is located at the boundary of the firstlayer and the second layer. The fluence rate at the detectorhas the following form in the Fourier domain:
ϕ2ðz; sÞ ¼sinh½α1ðzb þ z0Þ�
D1α1 cosh½α1ðlþ zbÞ� þD2α2 sinh½α1ðlþ zbÞ�;
(2)
where ϕ2ðz; sÞ ¼ ∫ ∞−∞∫
∞−∞Φ2ðx; y; zÞ exp½iðs1xþ s2yÞ�dxdy,
α22 ¼ ðD2s2 þ μa2 þ jω∕cÞ∕D2, ω is the source modulationfrequency, l is the thickness of the first layer, ands2 ¼ s21 þ s22. By performing inverse Fourier transform tothe solution numerically, we can obtain the fluence rate at thedetector. The spatially resolved reflectance can be calculatedas the integral of the radiance L2 at the boundary, whereL2 ¼ Φ2 þ 3D2ð∂Φ2∕∂zÞ cos θ, over the backwardhemisphere:
RðρÞ ¼Z2π½1 − RfresðθÞ� cos θðL2∕4πÞdΩ: (3)
Here ρ ¼ffiffiffiffiffiffiffiffiffiffiffiffiffiffiffix2 þ y2
p, and RfresðθÞ is the Fresnel reflection
coefficient for a photon with an incident angle θ relative tothe normal to the boundary.23 In the derivation of this two-layer diffusion model, it is assumed that the top layer is ahigh scattering slab that has an infinite lateral extent, and thesample layer is semi-infinite and homogeneous. Using such asimplified model for recovering optical properties of layeredsamples such as skin can only approximate the true propertiesof samples, which has been studied in our previous work.32 Itshould be noted that the sample geometry used in the modelderivation includes gross assumptions of skin morphologyand therefore the derived optical properties and chromophoreconcentrations of skin are apparent and may not represent theexact values. Moreover, we found that as the source-detectorseparation was smaller than 3 mm, a man-made high scatteringslab with a diameter of around 10 mm was large enough tosatisfy the assumption of infinite layer lateral extension.17
In practice, measured reflectance spectra were fit to the for-ward two-layer model derived above to obtain the absorptionand scattering spectra of the sample. To solve this inverseproblem, the “lsqcurvefit” nonlinear curve fitting function inMATLAB (MathWorks, MA) was employed for performingthe least-squares fittings. The “lsqcurvefit” function inMATLAB uses the trust-region-reflective algorithm, which isbased on the interior-reflective Newton method, by default.With a personal computer equipped with an Intel Q9550processor, absorption and reduced scattering spectra, and thechromophore concentrations can be determined from a singlemeasurement within 10 seconds.
3 Results and DiscussionThe typical reflectance spectra of normal skin and keloid of asubject obtained by normalizing the raw sample reflectancespectra with the integrating sphere reflectance spectrum areillustrated in Fig. 4. Although the intensities of these tworeflectance spectra are distinct, their spectral shapes are quitesimilar. The corresponding absorption and reduced scatteringspectra of keloid and normal skin of the same subject areillustrated in Fig. 5. It can be seen that the absorption coefficientof keloid skin is apparently higher than that of normal skin at the550 to 650 nm region. Most scar tissues have denser blood
550 600 650 700 750 800 850
0.2
0.4
0.6
0.8
1.0
1.2
Wavelength (nm)
Rel
ativ
e re
flec
tan
ce in
ten
sity
normal skin keloid
Fig. 4 Typical reflectance spectra of normal skin and keloid measuredfrom a subject.
Journal of Biomedical Optics 077005-4 July 2012 • Vol. 17(7)
Tseng et al.: Noninvasive evaluation of collagen and hemoglobin contents : : :
Downloaded From: https://www.spiedigitallibrary.org/journals/Journal-of-Biomedical-Optics on 7/3/2018Terms of Use: https://www.spiedigitallibrary.org/terms-of-use
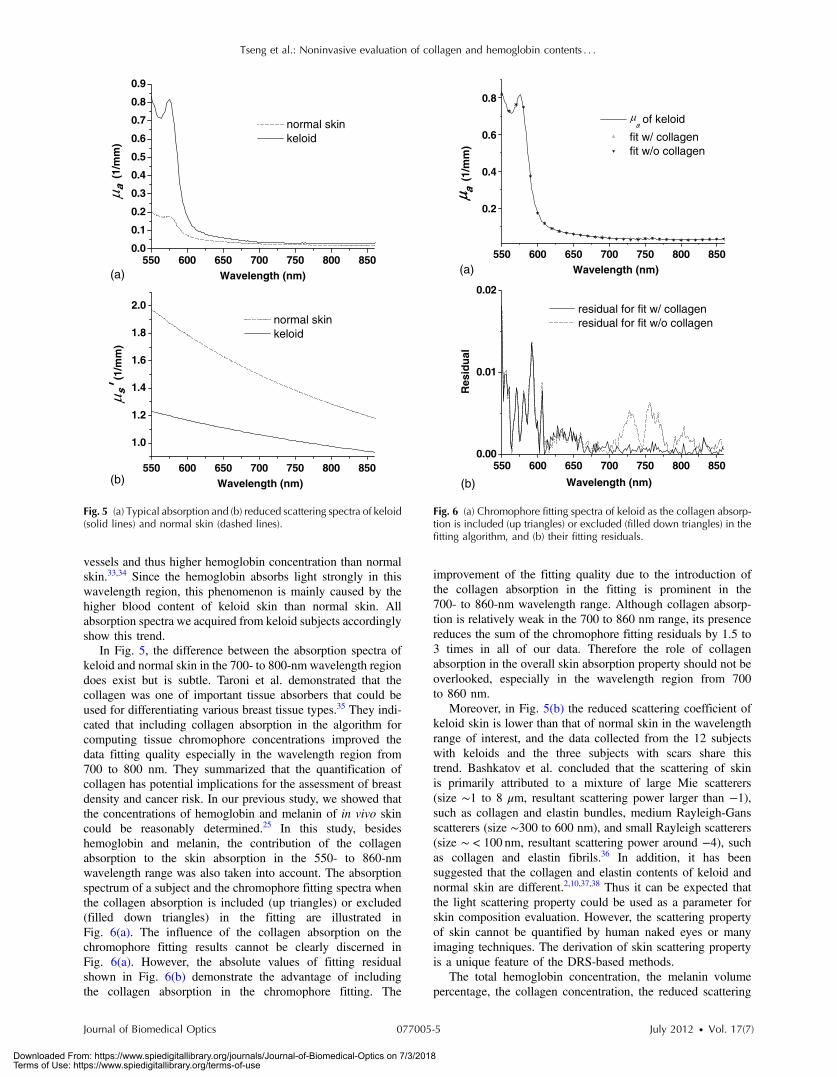
vessels and thus higher hemoglobin concentration than normalskin.33,34 Since the hemoglobin absorbs light strongly in thiswavelength region, this phenomenon is mainly caused by thehigher blood content of keloid skin than normal skin. Allabsorption spectra we acquired from keloid subjects accordinglyshow this trend.
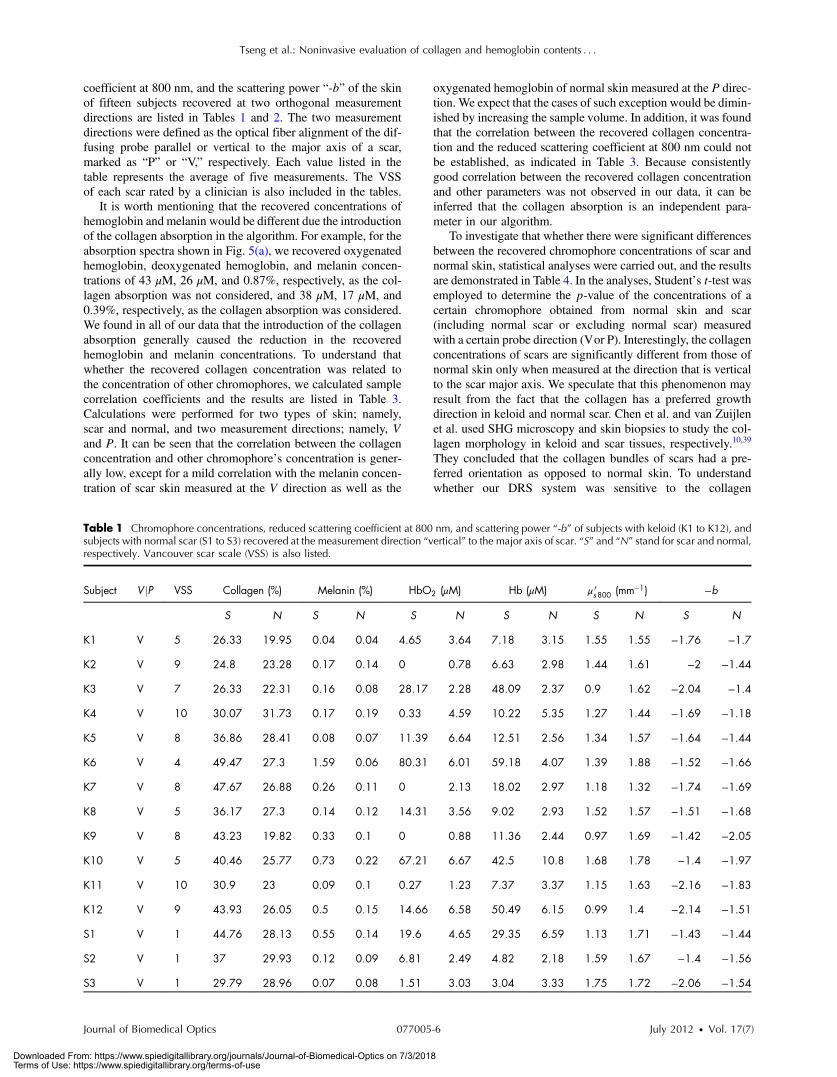
In Fig. 5, the difference between the absorption spectra ofkeloid and normal skin in the 700- to 800-nm wavelength regiondoes exist but is subtle. Taroni et al. demonstrated that thecollagen was one of important tissue absorbers that could beused for differentiating various breast tissue types.35 They indi-cated that including collagen absorption in the algorithm forcomputing tissue chromophore concentrations improved thedata fitting quality especially in the wavelength region from700 to 800 nm. They summarized that the quantification ofcollagen has potential implications for the assessment of breastdensity and cancer risk. In our previous study, we showed thatthe concentrations of hemoglobin and melanin of in vivo skincould be reasonably determined.25 In this study, besideshemoglobin and melanin, the contribution of the collagenabsorption to the skin absorption in the 550- to 860-nmwavelength range was also taken into account. The absorptionspectrum of a subject and the chromophore fitting spectra whenthe collagen absorption is included (up triangles) or excluded(filled down triangles) in the fitting are illustrated inFig. 6(a). The influence of the collagen absorption on thechromophore fitting results cannot be clearly discerned inFig. 6(a). However, the absolute values of fitting residualshown in Fig. 6(b) demonstrate the advantage of includingthe collagen absorption in the chromophore fitting. The
improvement of the fitting quality due to the introduction ofthe collagen absorption in the fitting is prominent in the700- to 860-nm wavelength range. Although collagen absorp-tion is relatively weak in the 700 to 860 nm range, its presencereduces the sum of the chromophore fitting residuals by 1.5 to3 times in all of our data. Therefore the role of collagenabsorption in the overall skin absorption property should not beoverlooked, especially in the wavelength region from 700to 860 nm.
Moreover, in Fig. 5(b) the reduced scattering coefficient ofkeloid skin is lower than that of normal skin in the wavelengthrange of interest, and the data collected from the 12 subjectswith keloids and the three subjects with scars share thistrend. Bashkatov et al. concluded that the scattering of skinis primarily attributed to a mixture of large Mie scatterers(size ∼1 to 8 μm, resultant scattering power larger than −1),such as collagen and elastin bundles, medium Rayleigh-Gansscatterers (size ∼300 to 600 nm), and small Rayleigh scatterers(size ∼ < 100 nm, resultant scattering power around −4), suchas collagen and elastin fibrils.36 In addition, it has beensuggested that the collagen and elastin contents of keloid andnormal skin are different.2,10,37,38 Thus it can be expected thatthe light scattering property could be used as a parameter forskin composition evaluation. However, the scattering propertyof skin cannot be quantified by human naked eyes or manyimaging techniques. The derivation of skin scattering propertyis a unique feature of the DRS-based methods.
The total hemoglobin concentration, the melanin volumepercentage, the collagen concentration, the reduced scattering
550 600 650 700 750 800 8500.0
0.1
0.2
0.3
0.4
0.5
0.6
0.7
0.8
0.9
normal skin keloid
a(1
/mm
)
Wavelength (nm)(a)
550 600 650 700 750 800 850
1.0
1.2
1.4
1.6
1.8
2.0 normal skin keloid
s'(1
/mm
)
Wavelength (nm)(b)
Fig. 5 (a) Typical absorption and (b) reduced scattering spectra of keloid(solid lines) and normal skin (dashed lines).
0.2
0.4
0.6
0.8
a of keloid
fit w/ collagen fit w/o collagen
a(1
/mm
)
Wavelength (nm)(a) 550 600 650 700 750 800 850
550 600 650 700 750 800 8500.00
0.01
0.02
Res
idu
al
Wavelength (nm)
residual for fit w/ collagen residual for fit w/o collagen
(b)
Fig. 6 (a) Chromophore fitting spectra of keloid as the collagen absorp-tion is included (up triangles) or excluded (filled down triangles) in thefitting algorithm, and (b) their fitting residuals.
Journal of Biomedical Optics 077005-5 July 2012 • Vol. 17(7)
Tseng et al.: Noninvasive evaluation of collagen and hemoglobin contents : : :
Downloaded From: https://www.spiedigitallibrary.org/journals/Journal-of-Biomedical-Optics on 7/3/2018Terms of Use: https://www.spiedigitallibrary.org/terms-of-use
coefficient at 800 nm, and the scattering power “-b” of the skinof fifteen subjects recovered at two orthogonal measurementdirections are listed in Tables 1 and 2. The two measurementdirections were defined as the optical fiber alignment of the dif-fusing probe parallel or vertical to the major axis of a scar,marked as “P” or “V,” respectively. Each value listed in thetable represents the average of five measurements. The VSSof each scar rated by a clinician is also included in the tables.
It is worth mentioning that the recovered concentrations ofhemoglobin and melanin would be different due the introductionof the collagen absorption in the algorithm. For example, for theabsorption spectra shown in Fig. 5(a), we recovered oxygenatedhemoglobin, deoxygenated hemoglobin, and melanin concen-trations of 43 μM, 26 μM, and 0.87%, respectively, as the col-lagen absorption was not considered, and 38 μM, 17 μM, and0.39%, respectively, as the collagen absorption was considered.We found in all of our data that the introduction of the collagenabsorption generally caused the reduction in the recoveredhemoglobin and melanin concentrations. To understand thatwhether the recovered collagen concentration was related tothe concentration of other chromophores, we calculated samplecorrelation coefficients and the results are listed in Table 3.Calculations were performed for two types of skin; namely,scar and normal, and two measurement directions; namely, Vand P. It can be seen that the correlation between the collagenconcentration and other chromophore’s concentration is gener-ally low, except for a mild correlation with the melanin concen-tration of scar skin measured at the V direction as well as the
oxygenated hemoglobin of normal skin measured at the P direc-tion. We expect that the cases of such exception would be dimin-ished by increasing the sample volume. In addition, it was foundthat the correlation between the recovered collagen concentra-tion and the reduced scattering coefficient at 800 nm could notbe established, as indicated in Table 3. Because consistentlygood correlation between the recovered collagen concentrationand other parameters was not observed in our data, it can beinferred that the collagen absorption is an independent para-meter in our algorithm.
To investigate that whether there were significant differencesbetween the recovered chromophore concentrations of scar andnormal skin, statistical analyses were carried out, and the resultsare demonstrated in Table 4. In the analyses, Student’s t-test wasemployed to determine the p-value of the concentrations of acertain chromophore obtained from normal skin and scar(including normal scar or excluding normal scar) measuredwith a certain probe direction (Vor P). Interestingly, the collagenconcentrations of scars are significantly different from those ofnormal skin only when measured at the direction that is verticalto the scar major axis. We speculate that this phenomenon mayresult from the fact that the collagen has a preferred growthdirection in keloid and normal scar. Chen et al. and van Zuijlenet al. used SHG microscopy and skin biopsies to study the col-lagen morphology in keloid and scar tissues, respectively.10,39
They concluded that the collagen bundles of scars had a pre-ferred orientation as opposed to normal skin. To understandwhether our DRS system was sensitive to the collagen
Table 1 Chromophore concentrations, reduced scattering coefficient at 800 nm, and scattering power “-b” of subjects with keloid (K1 to K12), andsubjects with normal scar (S1 to S3) recovered at the measurement direction “vertical” to the major axis of scar. “S” and “N” stand for scar and normal,respectively. Vancouver scar scale (VSS) is also listed.
Subject V jP VSS Collagen (%) Melanin (%) HbO2 (μM) Hb (μM) μ 0s800 (mm−1) −b
S N S N S N S N S N S N
K1 V 5 26.33 19.95 0.04 0.04 4.65 3.64 7.18 3.15 1.55 1.55 −1.76 −1.7
K2 V 9 24.8 23.28 0.17 0.14 0 0.78 6.63 2.98 1.44 1.61 −2 −1.44
K3 V 7 26.33 22.31 0.16 0.08 28.17 2.28 48.09 2.37 0.9 1.62 −2.04 −1.4
K4 V 10 30.07 31.73 0.17 0.19 0.33 4.59 10.22 5.35 1.27 1.44 −1.69 −1.18
K5 V 8 36.86 28.41 0.08 0.07 11.39 6.64 12.51 2.56 1.34 1.57 −1.64 −1.44
K6 V 4 49.47 27.3 1.59 0.06 80.31 6.01 59.18 4.07 1.39 1.88 −1.52 −1.66
K7 V 8 47.67 26.88 0.26 0.11 0 2.13 18.02 2.97 1.18 1.32 −1.74 −1.69
K8 V 5 36.17 27.3 0.14 0.12 14.31 3.56 9.02 2.93 1.52 1.57 −1.51 −1.68
K9 V 8 43.23 19.82 0.33 0.1 0 0.88 11.36 2.44 0.97 1.69 −1.42 −2.05
K10 V 5 40.46 25.77 0.73 0.22 67.21 6.67 42.5 10.8 1.68 1.78 −1.4 −1.97
K11 V 10 30.9 23 0.09 0.1 0.27 1.23 7.37 3.37 1.15 1.63 −2.16 −1.83
K12 V 9 43.93 26.05 0.5 0.15 14.66 6.58 50.49 6.15 0.99 1.4 −2.14 −1.51
S1 V 1 44.76 28.13 0.55 0.14 19.6 4.65 29.35 6.59 1.13 1.71 −1.43 −1.44
S2 V 1 37 29.93 0.12 0.09 6.81 2.49 4.82 2.18 1.59 1.67 −1.4 −1.56
S3 V 1 29.79 28.96 0.07 0.08 1.51 3.03 3.04 3.33 1.75 1.72 −2.06 −1.54
Journal of Biomedical Optics 077005-6 July 2012 • Vol. 17(7)
Tseng et al.: Noninvasive evaluation of collagen and hemoglobin contents : : :
Downloaded From: https://www.spiedigitallibrary.org/journals/Journal-of-Biomedical-Optics on 7/3/2018Terms of Use: https://www.spiedigitallibrary.org/terms-of-use

orientation, we calculated the ratio of the collagen concentrationmeasured at the vertical direction to that measured at the paralleldirection for each subject, and further subtracted 1 from the ratioand took the absolute value, denoted by “collagen (jV∕P − 1j)”as shown in Table 5. This data manipulation could reveal theanisotropy of the collagen orientation in which higher valuesrepresents higher degree of anisotropy. Our data suggest thatthe orientation of keloid collagen has a significantly higheranisotropy than that of normal skin (p ¼ 0.000106). Thus, ifthe measurement direction were not taken into consideration,one could get indefinite relation between the collagen concen-trations of normal skin and keloid, as implied by the data listedin Tables 1 and 2. The collagen concentrations obtained from thetwo measurement directions were averaged for each subject and
are listed in Table 5. The resultant average collagen concentra-tions of keloid are significantly higher than those of normal skin(p ¼ 0.006214). Our results indicate that using collagenconcentrations recovered from a certain diffusing probedirection may not suffice for robustly distinguishing keloidsfrom normal skin, and at least two orthogonal measurementdirections are needed for this purpose.
Furthermore, we can see from Table 4 that while the oxyge-nated hemoglobin concentrations of normal skin and keloidshave no statistical difference (p > 0.05), the deoxygenatedhemoglobin concentrations of keloids are significantly higherthan those of normal skin (p < 0.05). The oxygen saturationsof samples were calculated as shown in Table 5. Differentfrom oxygenated hemoglobin, statistical analysis shows that
Table 2 Chromophore concentrations, reduced scattering coefficient at 800 nm, and scattering power “-b” of subjects with keloid (K1 to K12), andsubjects with normal scar (S1 to S3) recovered at the measurement direction “parallel” to the major axis of scar. “S” and “N” stand for scar and normal,respectively. Vancouver scar scale (VSS) is also listed.
Subject VjP VSS Collagen (%) Melanin (%) HbO2 (μM) Hb (μM) μ 0s800 (mm−1) −b
S N S N S N S N S N S N
K1 P 5 16.77 23.14 0.03 0.08 6.62 3.35 6.25 2.94 1.46 1.46 −1.67 −1.85
K2 P 9 22.45 23.56 0.2 0.14 0.28 1.82 12.52 4.16 1.17 1.5 −2.11 −1.55
K3 P 7 22.03 19.68 0.09 0.07 36.52 1.5 59.44 1.88 0.89 1.47 −2.33 −1.67
K4 P 10 23 31.73 0.11 0.16 0.21 14.49 7.35 8.04 1.34 1.39 −1.99 −1.2
K5 P 8 22.17 23.14 0.06 0.05 6.17 3.03 8.08 3.33 0.89 1.29 −1.81 −1.93
K6 P 4 30.21 23.56 0.37 0.05 72.41 3.18 69.13 3.11 0.86 1.78 −1.87 −1.89
K7 P 8 33.53 24.94 0.16 0.11 0.4 2.44 9.69 3.12 0.94 1.18 −1.86 −1.84
K8 P 5 26.19 27.44 0.07 0.13 10.61 4.07 6.07 4.46 1.43 1.54 −1.57 −1.64
K9 P 8 27.99 21.62 0.23 0.1 0 0.56 7.08 2.07 1.04 1.72 −1.99 −2.12
K10 P 5 19.82 22.73 0.12 0.19 2.94 7.94 5.78 11.5 1.18 1.66 −2.18 −2.13
K11 P 10 26.47 21.76 0.09 0.08 0 1.44 5.64 3.22 1.02 1.75 −2.07 −2.01
K12 P 9 29.1 23.28 0.52 0.12 18.6 5.45 58.34 9.34 0.92 1.33 −2.32 −1.77
S1 P 1 33.26 30.9 0.13 0.16 4.88 8.3 10.11 7.92 1.34 1.74 −1.56 −1.36
S2 P 1 39.08 30.07 0.11 0.11 6.34 4.12 5.4 4.5 1.67 1.78 −1.48 −1.37
S3 P 1 30.76 27.3 0.09 0.08 1.34 4.48 3.54 2.99 1.65 1.73 −1.98 −1.45
Table 3 Sample correlation coefficients between the recovered collagen concentration and other parameters, including melanin, deoxygenatedhemoglobin, oxygenated hemoglobin, and reduced scattering at 800 nm, determined at two measurement directions (vertical and parallel) andtwo measurement sites (scar and normal skin).
Correlation r VjP Melanin HbO2 Hb μ 0s800
Scar V 0.67 0.43 0.48 −0.22
Normal skin V 0.30 0.40 0.20 −0.07
Scar P 0.28 0.06 0.03 0.2
Normal skin P 0.46 0.70 0.34 0.14
Journal of Biomedical Optics 077005-7 July 2012 • Vol. 17(7)
Tseng et al.: Noninvasive evaluation of collagen and hemoglobin contents : : :
Downloaded From: https://www.spiedigitallibrary.org/journals/Journal-of-Biomedical-Optics on 7/3/2018Terms of Use: https://www.spiedigitallibrary.org/terms-of-use
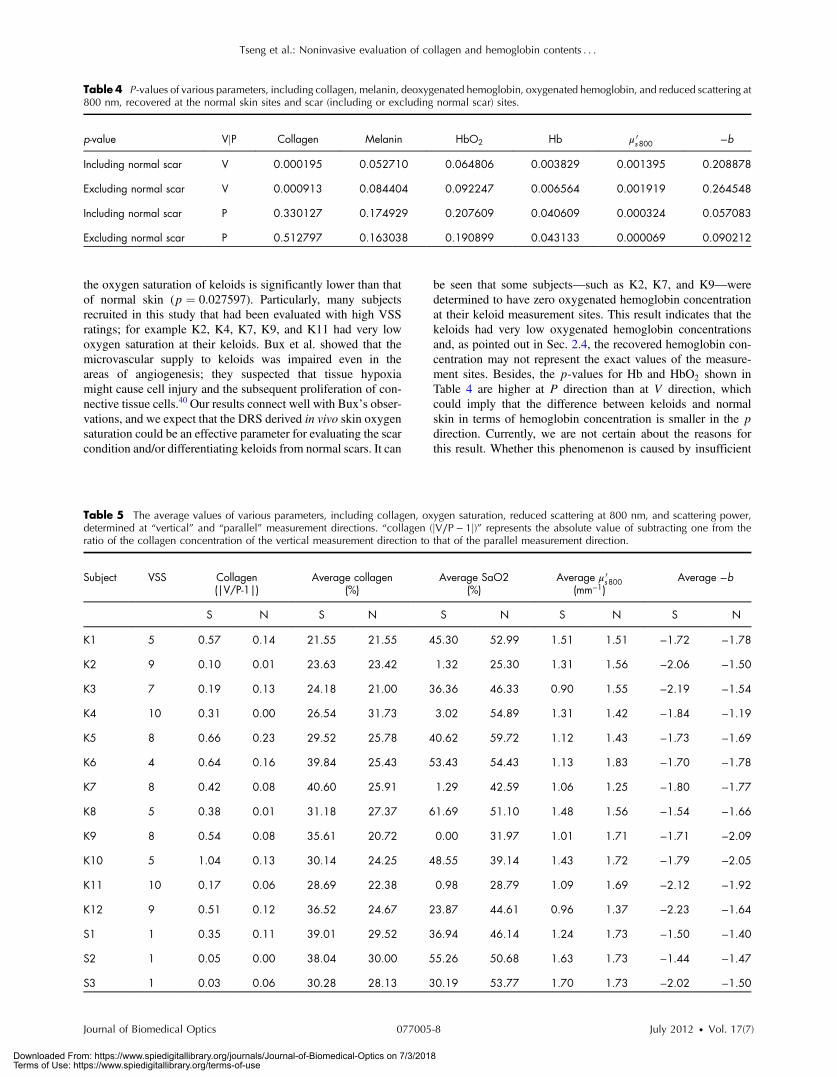
the oxygen saturation of keloids is significantly lower than thatof normal skin (p ¼ 0.027597). Particularly, many subjectsrecruited in this study that had been evaluated with high VSSratings; for example K2, K4, K7, K9, and K11 had very lowoxygen saturation at their keloids. Bux et al. showed that themicrovascular supply to keloids was impaired even in theareas of angiogenesis; they suspected that tissue hypoxiamight cause cell injury and the subsequent proliferation of con-nective tissue cells.40 Our results connect well with Bux’s obser-vations, and we expect that the DRS derived in vivo skin oxygensaturation could be an effective parameter for evaluating the scarcondition and/or differentiating keloids from normal scars. It can
be seen that some subjects—such as K2, K7, and K9—weredetermined to have zero oxygenated hemoglobin concentrationat their keloid measurement sites. This result indicates that thekeloids had very low oxygenated hemoglobin concentrationsand, as pointed out in Sec. 2.4, the recovered hemoglobin con-centration may not represent the exact values of the measure-ment sites. Besides, the p-values for Hb and HbO2 shown inTable 4 are higher at P direction than at V direction, whichcould imply that the difference between keloids and normalskin in terms of hemoglobin concentration is smaller in the pdirection. Currently, we are not certain about the reasons forthis result. Whether this phenomenon is caused by insufficient
Table 4 P-values of various parameters, including collagen, melanin, deoxygenated hemoglobin, oxygenated hemoglobin, and reduced scattering at800 nm, recovered at the normal skin sites and scar (including or excluding normal scar) sites.
p-value VjP Collagen Melanin HbO2 Hb μ 0s800 −b
Including normal scar V 0.000195 0.052710 0.064806 0.003829 0.001395 0.208878
Excluding normal scar V 0.000913 0.084404 0.092247 0.006564 0.001919 0.264548
Including normal scar P 0.330127 0.174929 0.207609 0.040609 0.000324 0.057083
Excluding normal scar P 0.512797 0.163038 0.190899 0.043133 0.000069 0.090212
Table 5 The average values of various parameters, including collagen, oxygen saturation, reduced scattering at 800 nm, and scattering power,determined at “vertical” and “parallel” measurement directions. “collagen (jV∕P − 1j)” represents the absolute value of subtracting one from theratio of the collagen concentration of the vertical measurement direction to that of the parallel measurement direction.
Subject VSS Collagen(|V/P-1|)
Average collagen(%)
Average SaO2(%)
Average μ 0s800
(mm−1)Average −b
S N S N S N S N S N
K1 5 0.57 0.14 21.55 21.55 45.30 52.99 1.51 1.51 −1.72 −1.78
K2 9 0.10 0.01 23.63 23.42 1.32 25.30 1.31 1.56 −2.06 −1.50
K3 7 0.19 0.13 24.18 21.00 36.36 46.33 0.90 1.55 −2.19 −1.54
K4 10 0.31 0.00 26.54 31.73 3.02 54.89 1.31 1.42 −1.84 −1.19
K5 8 0.66 0.23 29.52 25.78 40.62 59.72 1.12 1.43 −1.73 −1.69
K6 4 0.64 0.16 39.84 25.43 53.43 54.43 1.13 1.83 −1.70 −1.78
K7 8 0.42 0.08 40.60 25.91 1.29 42.59 1.06 1.25 −1.80 −1.77
K8 5 0.38 0.01 31.18 27.37 61.69 51.10 1.48 1.56 −1.54 −1.66
K9 8 0.54 0.08 35.61 20.72 0.00 31.97 1.01 1.71 −1.71 −2.09
K10 5 1.04 0.13 30.14 24.25 48.55 39.14 1.43 1.72 −1.79 −2.05
K11 10 0.17 0.06 28.69 22.38 0.98 28.79 1.09 1.69 −2.12 −1.92
K12 9 0.51 0.12 36.52 24.67 23.87 44.61 0.96 1.37 −2.23 −1.64
S1 1 0.35 0.11 39.01 29.52 36.94 46.14 1.24 1.73 −1.50 −1.40
S2 1 0.05 0.00 38.04 30.00 55.26 50.68 1.63 1.73 −1.44 −1.47
S3 1 0.03 0.06 30.28 28.13 30.19 53.77 1.70 1.73 −2.02 −1.50
Journal of Biomedical Optics 077005-8 July 2012 • Vol. 17(7)
Tseng et al.: Noninvasive evaluation of collagen and hemoglobin contents : : :
Downloaded From: https://www.spiedigitallibrary.org/journals/Journal-of-Biomedical-Optics on 7/3/2018Terms of Use: https://www.spiedigitallibrary.org/terms-of-use

sample number or the possible correlation between the orienta-tions of collagen bundles and blood vessels in keloids will beinvestigated in our future study.
The oxygen saturation for all normal skin listed in Table 5 isin the range from 25% to 59%. This could result from the factthat our probe’s interrogation depth is superficial (about 300 μmat the wavelength of 550 nm) and may contain mostly thecapillaries of superficial blood vessel plexus in the dermis.25
In contrast, the oxygen saturation of keloids was in the rangefrom 0 to 61%. Thus we observed that the color of the keloidscars varied from pink to burgundy as oxygen saturationdecreased. Although the digital images of scars like thoseshown in Fig. 1 taken with typical handheld cameras couldbe post possessed to calculate the intensity of red componentin the images, such intensity may not be able to represent thetrue redness or the hemoglobin concentration of scars due tophotographic artifacts introduced by lighting condition,distance, and angle. The DRS derived parameters are notaffected by the aforementioned artifact-introducing factorsand could facilitate the objective evaluation of local hemoglobinconcentrations.
As shown in Table 4, no statistical significant differencebetween the melanin volume percentages of normal skin andkeloid scars could be observed in this study (p > 0.05). How-ever, it can be seen from Table 4 that the p-values for melaninhave similar trend to those of hemoglobin. We speculate that,due to the dominance of the hemoglobin absorption and the rela-tively weak contribution of melanin absorption in the 550- to650-nm region, the accuracy of the recovered melanin concen-tration was compromised at measurement sites with high bloodsupply. In addition, the melanin absorption spectrum employedin this study derived from an approximate equation, which maynot depict true melanin absorption spectrum in the region ofinterest with high fidelity;28 this factor would also influencethe accuracy of recovered melanin concentrations. We carriedout correlation analyses for the recovered concentrations ofmelanin and hemoglobin, and the results are listed in Table 6.Our results point out that the correlation between recovered
melanin concentrations and deoxygenated hemoglobin concen-trations may exist. Similar results were reported by Stamatas andKollias; they found that the deoxygenated hemoglobin contrib-uted to a pigmented skin appearance due to the similaritybetween the absorption spectra of deoxygenated hemoglobinand melanin in the 630- to 700-nm range.41 We will look foran alternative melanin absorption spectrum or extend the mea-surement spectral region to include shorter wavelengths so thatthe recovered melanin concentration would be less interfered bythe hemoglobin absorption.
We noticed that the reduced scattering coefficient of allkeloid sites was consistently smaller than that of correspondingnormal skin sites at all wavelengths. The reduced scatteringcoefficients at 800 nm for all sites measured at the V and Pdirections are listed in Tables 1 and 2, respectively. The reducedscattering coefficients for keloids recovered in either V or Pdirections are significantly lower than those for normal skinas indicated by the values listed in Table 4 (p < 0.05). Theaverage of the reduced scattering coefficients obtained fromV and Pmeasurement directions for each site is listed in Table 5.The average reduced scattering coefficients for keloids are stillsignificantly smaller than those of normal skin (p ¼ 0.000126).Moreover, it can be observed in Tables 1 and 2 that the values ofscattering power of all keloid sites and all normal skin sites arewithin the range of −1.40 to −2.33, and −1.20 to −2.13, respec-tively. The scattering power is related to the size of scatterers,and a smaller average scatterer size causes a smaller scatteringpower (for example, in the small particle Rayleigh scatteringregime, scattering power approaches −4). From Mie scatteringtheory, it can be estimated that the average size of the scatterersthat causes light scattering in this study is roughly in the rangefrom 0.1 to 0.3 μm.27 Typical human erythrocytes have diskdiameter of 6 to 8 μm and a thickness of around 2 μm;based on Mie scattering theory, they have scattering powerlarger than −0.5 and produce strong forward scattering.Relatively high absorption and strong forward scattering oferythrocytes at wavelengths shorter than 550 nm could be thereasons that the reflectance collected by our DRS system was
Table 6 Sample correlation coefficients between the recovered melanin concentration and hemoglobin concentrations determined at two measure-ment directions (vertical and parallel) and two measurement sites (keloid and normal skin).
Correlation r VjP HbO2 Hb
Keloid V 0.86 0.75
Normal skin V 0.21 0.77
Keloid P 0.44 0.67
Normal skin P 0.62 0.77
Table 7 Sample correlation coefficients between the VSS ratings and various parameters listed in Table 5 as normal scar samples are included orexcluded.
Correlation r Collagen(jV∕P − 1j)
Average collagen(%)
Average SaO2
(%)Average μs 0 800 nm
(mm−1)Average -b
Including normal scar 0.11 −0.33 −0.68 −0.64 0.56
Excluding normal scar −0.57 −0.11 −0.85 −0.43 0.58
Journal of Biomedical Optics 077005-9 July 2012 • Vol. 17(7)
Tseng et al.: Noninvasive evaluation of collagen and hemoglobin contents : : :
Downloaded From: https://www.spiedigitallibrary.org/journals/Journal-of-Biomedical-Optics on 7/3/2018Terms of Use: https://www.spiedigitallibrary.org/terms-of-use

very low and not useful for deriving μa and μ 0s spectra. In the
wavelength region of interest of this study, erythrocytes may notbe the main contributor to the light scattering for the followingtwo reasons: 1. its size is much larger than the light wavelength,and 2. its size is much larger than the expected average size ofscattering centers of 0.1 to 0.3 μm. Ushiki reported that thethickness of collagen fibers and elastin fibers were within therange of 1 to 20 μm and 0.2 to 1.5 μm, respectively.42 We spec-ulate that the elastin fibers, elastin fibrils, and collagen fibrilsthat have thickness smaller than 0.3 μm were responsible forthe light scattering in the interrogation region of our diffusingprobe. In addition, Chen et al. reported that while the elastin wasscarce and had fragmented structure in the upper dermis ofkeloid, elastin fibers were abundant in the upper dermis of nor-mal skin.10 Amadeu et al. performed morphological and quan-titative analysis of the skin elastic system components and foundthat in superficial dermis, elastin volume density was higher innormal skin compared with normal scars and keloids.38 Thiscould be the reason we obtained smaller reduced scattering coef-ficients for keloid sites than for the normal skin sites as demon-strated in Tables 1, 2, and 5. Besides, it is noteworthy that nogood correlation between the collagen concentration and thereduced scattering coefficient can be perceived for all keloidsites, as shown in Table 3. This may imply that the collagenstructure that absorbs light does not have a pronounced scatter-ing property in the wavelength region of concern.
In this study, three subjects with normal scar were recruited.For these three subjects, their scar sites had higher average col-lagen concentrations and lower reduced scattering coefficientsthan those of normal skin sites. These trends were also applic-able to keloid scars. No consistent trends between normal scarand normal skin were observed for other parameters. Becausethe sample volume for normal scar is not large enough inthis study, we cannot draw a statistically meaningful conclusionregarding the difference between keloid scars and normal scarsfrom our data. We will enroll more subjects with normal scar inour future study to find out whether our system could be used todistinguish keloids from normal scars.
4 ConclusionIn this pilot study, we employed a relatively low-cost DRS sys-tem equipped with a novel diffusing probe, which had a probingdepth less than 1 mm, to measure the optical properties of keloidscars, normal scars, and normal skin of 15 subjects. We foundthat by considering the collagen absorption, in addition to thehemoglobin and melanin absorption, the chromophore fittingresiduals were significantly decreased in the 700- to 850-nmrange. Our data indicated that while the recovered collagenconcentrations at the keloid sites were not always higher thanthose at the normal skin sites, the average of the collagenconcentrations recovered at the two orthogonal measurementdirections was significantly higher than that of normal skin.We speculate that due to the low elastin fiber volume densityof keloids, the reduced scattering coefficient of keloid scarswas concordantly smaller than that of normal skin for allsubjects. Furthermore, tissue hypoxia, which is a unique featurethat separates keloid scars from other type of scars, wasobserved for some keloids with high VSS ratings. Our resultscan be reasonably explained by the results reported by variousindependent research groups using multi-photon-basedtechniques and histology. Our preliminary data demonstratethe potential of our system in clinical keloid evaluation. We
will further assess the applicability and accuracy of our systemfor in vivo keloid diagnosis and for differentiating the keloidfrom the hypertrophic scar and the normal scar. In the nearfuture, we will employ our system to quantify the variationof skin collagen content introduced by lesion developmentor aging.
AcknowledgmentsWe thank Dr. Andrea Bassi for kindly providing the absorptionspectrum of collagen. Dr. Tseng would like to acknowledge thesupport provided by the National Science Council of Taiwanunder Grant No. NSC-100-2628-E-006-007.
References1. G. M. Bran et al., “Keloids: current concepts of pathogenesis (review),”
Int. J. Mol. Med. 24(3), 283–293 (2009).2. J. Y. Lee et al., “Histopathological differential diagnosis of keloid and
hypertrophic scar,” Am. J. Dermatopathol. 26(5), 379–384 (2004).3. G. P. Sidgwick and A. Bayat, “Extracellular matrix molecules
implicated in hypertrophic and keloid scarring,” J. Eur. Acad. Dermatol.Venereol. 26(2), 141–152 (2012).
4. A. Al-Attar et al.., “Keloid pathogenesis and treatment,” Plast.Reconstr. Surg. 117(1), 286–300 (2006).
5. A. Burd and L. Huang, “Hypertrophic response and keloid diathesis:two very different forms of scar,” Plast. Reconstr. Surg. 116(7),150e–157e (2005).
6. A. E. Slemp and R. E. Kirschner, “Keloids and scars: a review of keloidsand scars, their pathogenesis, risk factors, and management,”Curr. Opin. Pediatr. 18(4), 396–402 (2006).
7. S. J. Lin et al., “Evaluating cutaneous photoaging by use of multiphotonfluorescence and second-harmonic generation microscopy,” Opt. Lett.30(17), 2275–2277 (2005).
8. B. A. Torkian et al., “Modeling aberrant wound healing using tissue-engineered skin constructs and multiphoton microscopy,” Arch. FacialPlast. Surg. 6(3), 180–187 (2004).
9. A. T. Yeh et al., “Imaging wound healing using optical coherence tomo-graphy and multiphoton microscopy in an in vitro skin-equivalent tissuemodel,” J. Biomed. Opt. 9(2), 248–253 (2004).
10. J. Chen et al., “Multiphoton microscopy study of the morphological andquantity changes of collagen and elastic fiber components in keloid dis-ease,” J. Biomed. Opt. 16(5), 051305 (2011).
11. V. Da Costa et al., “Nondestructive imaging of live human keloid andfacial tissue using multiphoton microscopy,” Arch. Facial Plast. Surg.10(1), 38–43 (2008).
12. P. J. Su et al., “Discrimination of collagen in normal and pathologicalskin dermis through second-order susceptibility microscopy,”Opt. Express 17(13), 11161–11171 (2009).
13. T. H. Tsai et al., “Visualizing radiofrequency-skin interaction usingmultiphoton microscopy in vivo,” J. Dermatol. Sci. 65(2), 95–101(2012).
14. F. Bevilacqua et al., “In vivo local determination of tissue optical proper-ties: applications to human brain,” Appl. Opt. 38(22), 4939–4950(1999).
15. A. Cerussi et al., “In vivo absorption, scattering, and physiologicproperties of 58 malignant breast tumors determined by broadband dif-fuse optical spectroscopy,” J. Biomed. Opt. 11(4), 044005 (2006).
16. S. H. Tseng, A. Grant, and A. J. Durkin, “In vivodetermination of skinnear-infrared optical properties using diffuse optical spectroscopy,” J.Biomed. Opt. 13(1), 014016 (2008).
17. S. H. Tseng et al., “Investigation of a probe design for facilitating theuses of the standard photon diffusion equation at short source-detectorseparations: Monte Carlo simulations,” J. Biomed. Opt. 14(5), 054043(2009).
18. A. Kienle and T. Glanzmann, “In vivo determination of the opticalproperties of muscle with time-resolved reflectance using a layeredmodel,” Phys. Med. Biol. 44(11), 2689–2702 (1999).
19. R. Nachabe et al., “Diagnosis of breast cancer using diffuse opticalspectroscopy from 500 to 1600 nm: comparison of classificationmethods,” J. Biomed. Opt. 16(8), 087010 (2011).
Journal of Biomedical Optics 077005-10 July 2012 • Vol. 17(7)
Tseng et al.: Noninvasive evaluation of collagen and hemoglobin contents : : :
Downloaded From: https://www.spiedigitallibrary.org/journals/Journal-of-Biomedical-Optics on 7/3/2018Terms of Use: https://www.spiedigitallibrary.org/terms-of-use

20. P. Taroni et al., “Diffuse optical spectroscopy of breast tissue extendedto 1100 nm,” J. Biomed. Opt. 14(5), 054030 (2009).
21. F. Bevilacqua and C. Depeursinge, “Monte Carlo study of diffuse reflec-tance at source-detector separations close to one transport mean freepath,” J. Opt. Soc. Am. A 16(12), 2935–2945 (1999).
22. A. D. Kim, C. Hayakawa, and V. Venugopalan, “Estimating opticalproperties in layered tissues by use of the Born approximation of theradiative transport equation,” Opt. Lett. 31(8), 1088–1090 (2006).
23. S. H. Tseng et al., “Quantitative spectroscopy of superficial turbidmedia,” Opt. Lett. 30(23), 3165–3167 (2005).
24. A. Ishimaru,Wave Propagation and Scattering in RandomMedia, Aca-demic Press, Waltham, MA (1978).
25. S. H. Tseng et al., “Chromophore concentrations, absorption and scat-tering properties of human skin in-vivo,” Opt. Express 17(17), 14599–14617 (2009).
26. M. J. Baryza and G. A. Baryza, “The Vancouver Scar Scale: an admin-istration tool and its interrater reliability,” J. Burn Care Rehabil. 16(5),535–538 (1995).
27. G. Zonios and A. Dimou, “Light scattering spectroscopy of human skinin vivo,” Opt. Express 17(3), 1256–1267 (2009).
28. S. L. Jacques, “Melanosome absorption coefficient,” (1998), http://omlc.ogi.edu/spectra/melanin/mua.html.
29. S. Prahl, “Hemoglobin absorption coefficient,” (1999), http://omlc.ogi.edu/spectra/hemoglobin/index.html.
30. V. Podrazky and V. Sedmerova, “Densities of collagen dehydrated bysome organic solvents,” Experientia 22(12), 792 (1966).
31. R. C. Haskell et al., “Boundary-conditions for the diffusion equation inradiative-transfer,” J. Opt. Soc. Am. A 11(10), 2727–2741 (1994).
32. S. H. Tseng and M. F. Hou, “Efficient determination of the epidermaloptical properties using a diffusion model-based approach: Monte Carlostudies,” J. Biomed. Opt. 16(8), 087007 (2011).
33. T. Amadeu et al., “Vascularization pattern in hypertrophic scars andkeloids: a stereological analysis,” Pathol. Res. Pract. 199(7), 469–473 (2003).
34. M. Valluru et al., “Blood vessel characterization in human dermalwound repair and scarring,” Br. J. Dermatol. 165(1), 221–224 (2011).
35. P. Taroni et al., “Absorption of collagen: effects on the estimate of breastcomposition and related diagnostic implications,” J. Biomed. Opt. 12(1),014021 (2007).
36. A. N. Bashkatov et al., “Optical properties of human skin, subcutaneousand mucous tissues in the wavelength range from 400 to 2000 nm,” J.Phys. D Appl. Phys. 38(15), 2543–2555 (2005).
37. X. Zhu et al., “Quantified characterization of human cutaneous normalscar using multiphoton microscopy,” J. Biophotonics 3(1–2), 108–116(2010).
38. T. P. Amadeu et al., “Fibrillin-1 and elastin are differentially expressedin hypertrophic scars and keloids,” Wound Repair Regen. 12(2), 169–174 (2004).
39. P. P. van Zuijlen et al., “Collagen morphology in human skin and scartissue: no adaptations in response to mechanical loading at joints,”Burns 29(5), 423–431 (2003).
40. S. Bux and A. Madaree, “Keloids show regional distribution of prolif-erative and degenerate connective tissue elements,” Cells TissuesOrgans 191(3), 213–234 (2010).
41. G. N. Stamatas and N. Kollias, “Blood stasis contributions to theperception of skin pigmentation,” J. Biomed. Opt. 9(2), 315–322 (2004).
42. T. Ushiki, “Collagen fibers, reticular fibers and elastic fibers. Acomprehensive understanding from a morphological viewpoint,”Arch. Histol. Cytol. 65(2), 109–126 (2002).
Journal of Biomedical Optics 077005-11 July 2012 • Vol. 17(7)
Tseng et al.: Noninvasive evaluation of collagen and hemoglobin contents : : :
Downloaded From: https://www.spiedigitallibrary.org/journals/Journal-of-Biomedical-Optics on 7/3/2018Terms of Use: https://www.spiedigitallibrary.org/terms-of-use