Embed Size (px)
Citation preview

MEMOIRS OF THE
QUEENSLAND MUSEUM BRISBANE
© Queensland Museum PO Box 3300, South Brisbane 4101, Australia
Phone 06 7 3840 7555 Fax 06 7 3846 1226
Email [email protected] Website www.qm.qld.gov.au
National Library of Australia card number
ISSN 0079-8835
NOTE Papers published in this volume and in all previous volumes of the Memoirs of the
Queensland Museum maybe reproduced for scientific research, individual study or other educational purposes. Properly acknowledged quotations may be made but queries regarding the republication of any papers should be addressed to the Editor in Chief. Copies of the journal can be purchased from the Queensland Museum Shop.
A Guide to Authors is displayed at the Queensland Museum web site
A Queensland Government Project Typeset at the Queensland Museum
FAUNAL SURVEY OF NEW ENGLAND. V. THE LIZARDS AND SNAKES
HAROLD HEATWOLE, JOHN de BAVAY AND PAUL WEBBER
Heatwole, H., de Bavay, J. & Webber, P. 2003 06 30: Faunal survey of New England. V. Thelizards and snakes. Memoirs of the Queensland Museum 49(1): 299-325. Brisbane. ISSN0079-8835.
A 34-year study (1966-2000) of the lizards and snakes of the New England region of NewSouth Wales yielded 14 species of geckos, 4 of pygopodids, 8 of dragons, 3 of goannas, 47 ofskinks, and 30 of snakes, for a total of 106 species. Four additional species reported by Swan(1990), and an additional one from the Atlas of NSW Wildlife brings the total knownsquamatan fauna of New England to 111 species. Most terrestrial families of squamates inNew England represent 10-15% of the total Australian species. The exceptions are thefamilies Elapidae (26%) and Colubridae (18%). Generic representation is higher and morevariable. A fifth of the species are widespread. Other species are predominantly separatedinto eastern and western faunal groups. In some species the Great Dividing Range coincideswith east-west distributional boundaries. In others, the borders of the distributional range lieone side or the other of this topographical feature. In both western and eastern groups, thereare species associated mainly with either the northern or southern quadrants; otherwisedistributions of only a few species are oriented with respect to the north-south axis. Therewere no strictly central species. Some species are represented by only one or a few recordsand the full extent of their distributions may not be appreciated, or they may be sparselydistributed, rare, or cryptic. A number of species were distributed randomly with regard toparticular environmental attributes; these were unlikely to be affecting distribution withinNew England. Where correlations did exist, causal effects could only be hypothesised, butoptimal habitats could be defined by over-representation in localities with particular levels ofelevation, rainfall, or temperature, or characterised by certain types of vegetation, rock orsoil. El New England, snakes, lizards, faunal survey, distribution, habitat.
Harold Heatwole, Department of Zoology, North Carolina State University, Raleigh NC27695-7617, USA; John de Bavay, School of Biological Sciences, University of NewEngland, Armidale 2351, Australia; Paul Webber, Webber and Associates, 125 TaylorStreet, Armidale 2350, Australia; 15 September, 2001.
An initial paper of the faunal survey of NewEngland described the general geography of thearea (Heatwole & Simpson, 1986); this wasfollowed by accounts of the gastropods (Simpson& Stanisic, 1986), birds (Ford & McFarland,1991) and frogs (Heatwole et al., 1995). Thepresent paper reports on the lizards and snakes.
There have been several interpretations of theboundaries of New England (see Lea et al., 1977and electoral maps). We recognise the boundariesas defined in the previous papers of this series(Fig. 1).
Treatment of the fauna is at the specfic level;subspecific designations are not included.
METHODSIn the interests of conservation, we collected
only a few voucher specimens of each speciesfrom any given area. Nevertheless, over the 34years of the study (1966-2000) we collected andidentified more than 6,000 specimens of snakesand lizards and deposited them in the AustralianMuseum.
This material was augmented by otherherpetological collections in the AustralianMuseum (up to 2000), and by the holdings of theMuseum of Victoria, and the QueenslandMuseum (both up to 1996). Initially, we eliminatedrecords referring to specimens that had beendiscarded or lost, or which had deterioratedbeyond accurate identification, corrected somemisidentifications, and verified or corrected datafor unusual specimens such as geographicaloutliers. After this editing, we relied heavily onthe registers of those museums. Especiallyimportant has been the progressive upgrading bythe Australian Museum of their herpetologicalcollections, whereby incompletely unidentifiedspecimens were identified, previously identifiedspecimens checked for accuracy, nomenclaturalchanges incorporated, and geographical co-ordinates and other data verified or corrected.
Taxonomic nomenclature follows that ofCogger (2000) and Cogger et al. (1983), butincorporates recent name changes and genericallocations by King (1983), Wells & Wellington

NEWSOUTHWAI ES
ACT r
300^MEMOIRS OF THE QUEENSLAND MUSEUM
(1985), Ingram & Covacevich (1988), Hutchison(1990), Hutchison et al. (1990) Sadleir (1990),Rawlinson (1991), Greer (1992, 1997), Hutch-ison & DonneIlan (1992), Couper et al. (1993,1994, 1997), Sadleir et al. (1993) and Shea(1995a, 1995b).
A number of surveys and environmentalconsultancies for specific purposes amassed acorpus of data relating to the New England area.Specimens arising from these studies were depositedin the Australian Museum and automaticallybecame part of our database. In addition, a largenumber of the records were not based on voucherspecimens, but rather upon field identificationsof varying reliability. We have not included anysight records in our database but do discuss thembelow where relevant.
Our final, edited dataset, consisting of ourcollections plus the other acquisitions of the threemuseums, is based on more than 12,800specimens that were collected from the late 19thcentury to the end of the twentieth century. Usingthe statistical package, StatView, locality datawere formatted for the Arc View Mapping Systemto produce distribution maps of each species. Inthis system, multiple records of a given speciesfor a particular locality were grouped as a singleentity and latitudes and longitudes from museumrecords were converted to a decimal degree.
The final edited dataset totalled 4,045 recordsand comprised 3,175 localities within theboundaries of New England (Fig. 1), and 888records from sites immediately extralimital (Figs2, 3-108) that were included for mappingpurposes. This has been placed in each of thethree museums both as hard copies and CD ROM.
The New England survey of frogs (Heatwole etal., 1995) related species distributions to fourenvironmental parameters: mean daily minimumtemperature for July, mean annual rainfall,elevation, and vegetation. Because manysquamates behaviourally thermoregulate, arecryptic, or are substrate-dependent in variousways, an enlarged set of parameters wasemployed, including soil type and rock type.Heatwole & Simpson (1986) presented a map ofthe lithology of New England based on 'An AtlasofNew England' (Lea et al., 1977). For the presentpaper an improved map, derived from the NewSouth Wales Department of Mineral Resources1/25000 Geological map, was used.
The soil map derives from Lea et al., 1977. Thiswas digitised, and the map prepared using theEnvironmental Research mapping Program
FIG. 1. Collecting grid and study area within NewSouth Wales indicating the main towns, connectingroads, and the Great Dividing Range (GDR). Insetshows the location of the study area in New SouthWales.
(ERMS) in the Armidale office of the NationalParks and Wildlife Service of New South Wales(Ferrier, 1989).
The vegetation map is based on a modificationof the classification of vegetation systems fornortheastern New South Wales (NSW NationalParks and Wildlife Service, 1994). The ninecategories of that classification were lumped intothree categories: 'disturbed' (including pastoraland agricultural land), 'dry forest and woodland'and 'wet forest' (including rainforest).
New, more detailed maps of elevation, rainfalland temperature were prepared. TheEnvironmental Research Mapping System(ERMS) in the Armidale office of the NationalParks and Wildlife Service of New South Wales(Ferrier, 1989) was used to prepare maps of thedistribution of soils, and the distribution ofvarious variables.
Long-term monthly means of minimumtemperature, maximum temperature, andprecipitation were derived by linking a griddeddigital elevation model with climate surfacemodels developed by Hutchinson (1989). These
NEW ENGLAND LIZARDS AND SNAKES^ 301
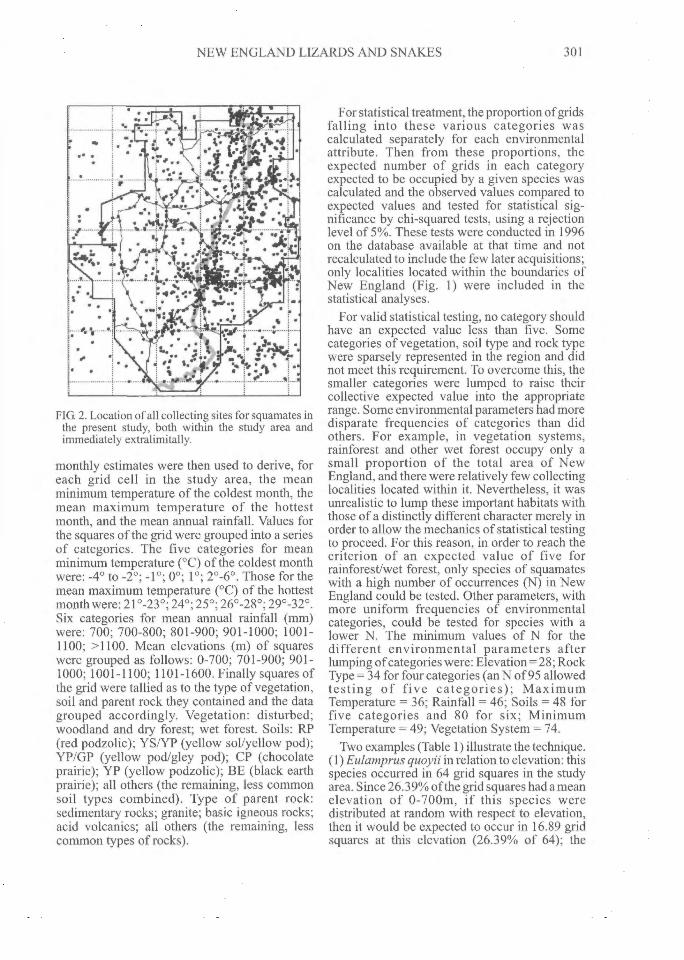
FIG. 2. Location of all collecting sites for squamates inthe present study, both within the study area andimmediately extralimitally.
monthly estimates were then used to derive, foreach grid cell in the study area, the meanminimum temperature of the coldest month, themean maximum temperature of the hottestmonth, and the mean annual rainfall. Values forthe squares of the grid were grouped into a seriesof categories. The five categories for meanminimum temperature (°C) of the coldest monthwere: -4' to -2'; -1 0 ; 0'; 1 0 ; 2°-6°. Those for themean maximum temperature (°C) of the hottestmonth were: 21 0 -23 0 ; 24'; 25'; 26°-28°; 29°-32°.Six categories for mean annual rainfall (mm)were: 700; 700-800; 801-900; 901-1000; 1001-1100; >1100. Mean elevations (m) of squareswere grouped as follows: 0-700; 701-900; 901-1000; 1001-1100; 1101-1600. Finally squares ofthe grid were tallied as to the type of vegetation,soil and parent rock they contained and the datagrouped accordingly. Vegetation: disturbed;woodland and dry forest; wet forest. Soils: RP(red podzolic); YS/YP (yellow sol/yellow pod);YP/GP (yellow pod/gley pod); CP (chocolateprairie); YP (yellow podzolic); BE (black earthprairie); all others (the remaining, less commonsoil types combined). Type of parent rock:sedimentary rocks; granite; basic igneous rocks;acid volcanics; all others (the remaining, lesscommon types of rocks).
For statistical treatment, the proportion of gridsfalling into these various categories wascalculated separately for each environmentalattribute. Then from these proportions, theexpected number of grids in each categoryexpected to be occupied by a given species wascalculated and the observed values compared toexpected values and tested for statistical sig-nificance by chi-squared tests, using a rejectionlevel of 5%. These tests were conducted in 1996on the database available at that time and notrecalculated to include the few later acquisitions;only localities located within the boundaries ofNew England (Fig. 1) were included in thestatistical analyses.
For valid statistical testing, no category shouldhave an expected value less than five. Somecategories of vegetation, soil type and rock typewere sparsely represented in the region and didnot meet this requirement. To overcome this, thesmaller categories were lumped to raise theircollective expected value into the appropriaterange. Some environmental parameters had moredisparate frequencies of categories than didothers. For example, in vegetation systems,rainforest and other wet forest occupy only asmall proportion of the total area of NewEngland, and there were relatively few collectinglocalities located within it. Nevertheless, it wasunrealistic to lump these important habitats withthose of a distinctly different character merely inorder to allow the mechanics of statistical testingto proceed. For this reason, in order to reach thecriterion of an expected value of five forrainforest/wet forest, only species of squamateswith a high number of occurrences (N) in NewEngland could be tested. Other parameters, withmore uniform frequencies of environmentalcategories, could be tested for species with alower N. The minimum values of N for thedifferent environmental parameters afterlumping of categories were: Elevation = 28; RockType = 34 for four categories (an N of 95 allowedtesting of five categories); MaximumTemperature = 36; Rainfall = 46; Soils = 48 forfive categories and 80 for six; MinimumTemperature = 49; Vegetation System = 74.
Two examples (Table 1) illustrate the technique.(1)Eulamprus quoyii in relation to elevation: thisspecies occurred in 64 grid squares in the studyarea. Since 26.39% of the grid squares had a meanelevation of 0-700m, if this species weredistributed at random with respect to elevation,then it would be expected to occur in 16.89 gridsquares at this elevation (26.39% of 64); the

302^MEMOIRS OF THE QUEENSLAND MUSEUM
observed value was 11. Similarly expected valueswere 11.96 for 701-900, 10.42 for 901-1000, 12.2for 1001-1100, and 12.44 for 1101-1600. Thecorresponding observed values were: 8, 16, 13and 16. The chi-square value of the comparisonof observed to expected values was 7.414(0.25>P>0.10). Since P>0.05, E. quoyii was con-sidered to be distributed randomly with respect toelevation, within the range of elevationsoccurring within the study area. (2) Ctenotusrobustus in relation to rainfall. The expected(observed) values for the 46 grid squares in whichthis species occurred was: 4.50 for <700mmrainfall, 14.86 for 700-800mm, 9.17 for 801-900mm, 5.82 for 901-1000mm, 5.43 for 1001-1100, and 6.17 for >1100mm. The respectiveobserved values were 8, 23, 8, 5, 2 and 0. Thechi-square value was 15.197 and 0.01>P>0.005(highly significant). Thus, this species was notrandomly distributed with respect to rainfall.Note that the observed values were greater thanexpected by randomness in the first twocategories (<700mm and 700-800mm) and lessthan expected in all the rest. The optimal habitatfor C. robustus therefore seems to be the drierparts of the area.
For some species, over-representation occurredonly in one category, in other species over-representation occurred over a broader range ofvalues and encompassed several categories.
Copies of the detailed statistical tests, includingall observed and expected values, chi-squaresand P values, as well as histograms of frequencydistributions of environmental parameters, havebeen placed on file in the Australian Museum andin the Queensland Museum.
Although nearby extralimital localities wereplotted on species' distribution maps, only thelocalities within the boundaries of the NewEngland region were included in the statisticalanalyses.
A transparency of the State of New SouthWales, with the area of New England delineatedas defined in the present study, was produced atthe same scale as Swan's (1990) maps. Byoverlapping this transparency onto Swan's mapsand comparing them, the species and localitiesincluded in his study were detected and comparedwith ours.
COVERAGE
The long duration of this survey allowedopportunity for a comprehensive geographicalcoverage of the area (Fig. 2). Collections were
made throughout the area with no large gaps,although the collecting localities were slightlyless densely distributed in the west thanelsewhere.
Even with a relatively complete geographiccoverage, a distorted picture could he obtained ifimportant habitats were poorly represented. Forexample, not collecting along streamsides inNew England would have failed to reveal thepresence of several species. We attempted tocover all habitats. In order to assess the extent towhich that attempt was successful, the areas coveredby each category of the various environmentalparameters was calculated from the computer-generated environmental maps, and the numberof collecting sites represented in each categoryascertained. For each parameter, the number ofcollecting sites in a given category was roughlyproportional to the representation of thatcategory in the region. Thus, it appears that allrecognised habitats were adequately covered.
The seasonal coverage was not as good. Manylocalities were visited only once. Consequently,if certain species were active only outside thatperiod, they would have been missed.
OTHER RECORDS FOR NEW ENGLAND
Swan's (1990) maps were based partly onrecords not available to us and they add fourspecies (Hypsilurus spimpes, Tympanocryptisdiemenensis, Lerista punctatovittata, Crypto-blepharus carnabyi) to the fauna of NewEngland. He reported Phyllurus cornutus fromthe area, but Couper et al. (1993) restricted thisspecies to northeastern Queensland and allocatedthe New England population to Saltuariusswami. Swan also reported Ramphotyphlopsbroomi from New England but Shea (1995)demonstrated the New England species to be R.wiedii. Thus, we have excluded Phyllurus corn utusand Ramphotyphlops broomi from the list ofspecies from New England.
The Sarah River Survey (Webber & Heatwole,1991), an action plan for threatened Australianreptiles (Cogger et al., 1993) and the EastlinkSurvey of 1995-1997, conducted along a transectthrough northern New England and southernQueensland (Debus, unpubl. data) yielded nospecies for the New England squamatan faunabeyond those listed in Table 1 from other sources.The Atlas of NSW Wildlife of (NSW NationalParks and Wildlife Service, database of the year2000) summarised all records from New SouthWales, including New England, arising from a

NEW ENGLAND LIZARDS AND SNAKES^ 303
variety of sources and of varying reliability.Almost all the records in the Atlas that werebased on voucher specimens had already beenincluded automatically in our database by virtueof the specimens having been deposited in theAustralian Museum.
However, two new species records, Ctenotuseurydice and Denisonia devisi, were based onvoucher specimens. The former is now regardedas an invalid species (Sadleir, pers. comm.), butthe latter can be added to the known fauna of NewEngland.
The following species were recorded from NewEngland only on the basis of field identifications:Phyllurus platurus, Egernia striata, Eulamprustympanum, Hemisphaeriodon gerarrdii, all witha reliability index of 4 or 5 (with 1 being mostreliable, 6 least reliable). The last is knownextralimitally just east of New England andfurther investigation may well extend its rangeinto the region. However, the first three speciesalmost certainly represent erroneous identifi-cations and we do not consider them part of theNew England fauna; their known ranges are farremoved from New England (Cogger, 2000).
One of the species listed in our database,Denisonia maculata, may be in error. The recordis based on a single specimen from the AustralianMuseum (AM R4765) that was later donated tothe Museum of Comparative Zoology at Harvard.J. Rosado (pers. comm.) indicated that because ofrenovations this specimen would be unavailablefor an identity check for at least another year.Cogger (2000) showed the range of D. maculataas coastal central Queensland, well beyond thelimits of New England. D. maculata is closelyrelated to D. devisi and the latter was onceconsidered a subspecies of the former (Cogger etal.,1983). D. devisi is one of the species reliablyrecorded from New England by the Atlas ofNSWWildlife (Table 1 and see above) and it is likelythat the purported specimen of D. maculata is, infact, D. devisi.Ctenotus eurydice: This species is now regardedas an invalid species(R. Sadleir, pers. comm.),since it cannot be reliably distinguished from C.taeniolatus, and is therefore excluded from ourdata base. The New England specimens of C.eurydice were SPXEI013 (NSW Wildlife Survey,1988), SPXEI006 (Atlas of NSW Wildlife)Neither of them can now be located.Gehyra australis: There are three records of thisspecies from closely adjacent sites in the MoonbiRanges near Tamworth, NSW, (AM R29700,
AM R75990, VM D55544). They form a clusterwithin a predominantly G. dubia population. TheAustralian Museum specimens could not belocated, but that from the Victorian Museum wasinitially identified as G australis by the ActingCurator of Herpetology, (D.J. Bray), and by oneof the authors (J.de B). The specimen was thenreferred to the Australian Museum where it wasidentified as G dubia because of the presence ofan internasal scale, a characteristic of that species(R.Sadlier, pers. com .). Consequently the threerecords of G australis were transferred to Gdubia.
The reliably known squamatan fauna of NewEngland therefore consists of (a) our database of106 species (14 species of geckos, 4 of pygo-podids, 8 of dragons, 3 of goannas, 47 of skinks,and 30 of snakes); (b) four additional species (2dragons and 2 skinks) reported by Swan (1990);and (c) an additional species based on voucherspecimens from the Atlas of NSW Wildlifedatabase, for a total of 111 species.
Several more are immediately extralimital andfurther collecting may record their presence inNew England. Faunal surveys involving parts ofNew England are in progress (e.g., NandewarRanges in western New England; Demon NatureReserve on the Timbarra Plateau in eastern NewEngland). The preliminary lists are subject torevision and reassessment before they arepermissible for quotation; accordingly, it was notpossible to include information from them in thepresent study.
THE REGIONAL FAUNA IN RELATION TOTHE HERPETOFAUNA OF AUSTRALIAThe majority of Australian squamates live in
tropical or arid habitats and are thus excludedfrom New England (Cogger, 2000). Overall, 14%of Australian species of squamates and 47% ofthe genera occur in New England. At the specificlevel, all Australian families of lizards are similarin their proportional representation in NewEngland (12-15% of the total species fromAustralia) (Table 2). By contrast, the differentophidian families, have markedly divergentproportional representations in New England atthe species level. The Typhlopidae and Boidaehave about the same proportional representation(10-13%) as the saurian families, whereas thecolubrids and the elapids are unusually wellrepresented (Table 2).
Generic representation is higher than specificrepresentation. All Australian monitors belong toVaranus and consequently New England has a
304^MEMOIRS OF THE QUEENSLAND MUSEUM
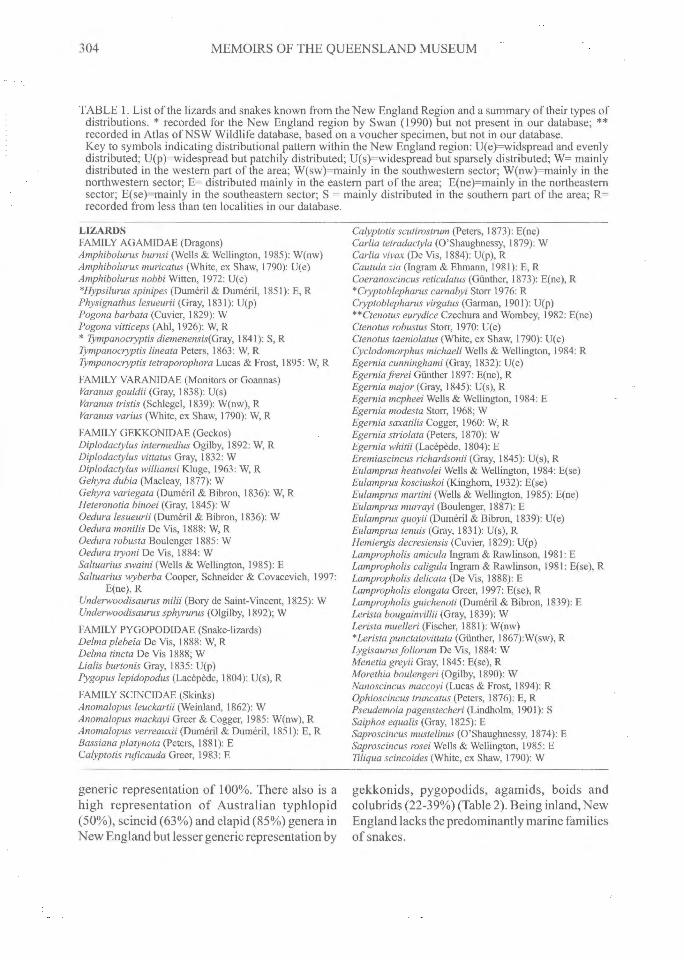
TABLE 1. List of the lizards and snakes known from the New England Region and a summary of their types ofdistributions. * recorded for the New England region by Swan (1990) but not present in our database; **recorded in Atlas of NSW Wildlife database, based on a voucher specimen, but not in our database.Key to symbols indicating distributional pattern within the New England region: U(e)=widspread and evenlydistributed; U(p)=widespread but patchily distributed; U(s)—widespread but sparsely distributed; W= mainlydistributed in the western part of the area; W(sw)=mainly in the southwestern sector; W(nw)=mainly in thenorthwestern sector; E= distributed mainly in the eastern part of the area; E(ne)=mainly in the northeasternsector; E(se)=mainly in the southeastern sector; S = mainly distributed in the southern part of the area; R=recorded from less than ten localities in our database.
LIZARDSFAMILY AGAMIDAE (Dragons)Amphibolurus burnsi (Wells & Wellington, 1985): W(nw)Amphibolurus muricatus (White, ex Shaw, 1790): U(e)Amphibolurus nobbi Witten, 1972: U(e)*Hypsilurus spinipes (Dumêril & Dumêril, 1851): E, RPhysignathus lesueurii (Gray, 1831): U(p)Pogona barbata (Cuvier, 1829): WPogona vitticeps (Ahl, 1926): W, R* Tympanoctyptis diemenensis(Gray, 1841): S, R1Ympanoctyptis lineata Peters, 1863: W, R7Ympanocryptis tetraporophora Lucas & Frost, 1895: W, RFAMILY VARANIDAE (Monitors or Goannas)Varanus gouldii (Gray, 1838): U(s)Varanus tristis (Schlegel, 1839): W(nw), RVaranus varius (White, ex Shaw, 1790): W, RFAMILY GEKKONIDAE (Geckos)Diplodactylus intermedius Ogilby, 1892: W, RDiplodactylus vittatus Gray, 1832: WDiplodactylus williamsi Kluge, 1963: W, RGehyra dubia (Macleay, 1877): WGehyra variegata (Dumeril & Bibron, 1836): W, RHeteronotia binoei (Gray, 1845): WOedura lesueurii (Dumèril & Bibron, 1836): WOedura monilis De Vis, 1888: W, ROedura robusta Boulenger 1885: WOedura byoni De Vis, 1884: WSalt uarius swami (Wells & Wellington, 1985): ESaltuarius wyberba Cooper, Schneider & Covacevich, 1997:
E(ne), RUnderwoodisaurus milii (Bory de Saint-Vincent, 1825): WUnderwoodisaurus sphyrurus (Olgilby, 1892); WFAMILY PYGOPODIDAE (Snake-lizards)Delma plebeia De Vis, 1888: W, RDelma tincta De Vis 1888; WLialis burtonis Gray, 1835: U(p)Pygopus lepidopodus (Lacèpêcle, 1804): U(s), RFAMILY SCINCIDAE (Skinks)Anomalopus leuckartii (Weinland, 1862): WAnomalopus mackayi Greer & Cogger, 1985: W(nw), RAnomalopus verreauxii (Dumóril & Dumeril, 1851): E, RBassiana platynota (Peters, 1881): ECalyptotis ruficauda Greer, 1983: E
Calyptotis scutirostrum (Peters, 1873): E(ne)Carlia tetradactyla (O'Shaughnessy, 1879): WCarlia vivax (De Vis, 1884): U(p), RCautula zia (Ingram & Ehmann, 1981): E, RCoeranoscincus reticulatus (Gunther, 1873): E(ne), R*Cryptoblepharus carnabyi Storr 1976: RCryptoblepharus virgatus (Garman, 1901): U(p)**Ctenotus eutydice Czechura and Wombey, 1982: E(ne)Ctenotus robustus Storr, 1970: U(e)Ctenotus taeniolatus (White, ex Shaw, 1790): U(e)Cyclodomorphus michaeli Wells & Wellington, 1984: REgernia cunninghami (Gray, 1832): U(e)Egernia frerei ainther 1897: E(ne), REgernia major (Gray, 1845): U(s), REgernia mcpheei Wells & Wellington, 1984: EEgernia modesta Storr, 1968; WEgernia saxatilis Cogger, 1960: W, REgernia striolata (Peters, 1870): WEgernia whitii (Lacêpêcle, 1804): EEretniascincus richardsonii (Gray, 1845): U(s), REulamprus heatwolei Wells & Wellington, 1984: E(se)Eulamprus kosciuskoi (Kinghom, 1932): E(se)Eulamprus martini (Wells & Wellington, 1985): E(ne)Eulamprus murrayi (Boulenger, 1887): EEulamprus quoyii (Dumeril & Bibron, 1839): U(e)Eulamprus tenuis (Gray, 1831): U(s), RHem iergis decresiensis (Cuvier, 1829): U(p)Lampropholis amicula Ingram & Rawlinson, 1981: ELampropholis caligula Ingram & Rawlinson, 1981: E(se), RLampropholis delicata (De Vis, 1888): ELampropholis elongata Greer, 1997: E(se), RLampropholis guichenoti (Dumeril & Bibron, 1839): ELerista bougainvillii (Gray, 1839): WLerista muelleri (Fischer, 1881): W(nw)*Lerista punctatovittata (Gunther, 1867):W(sw), RLygisaurus foliorum De Vis, 1884: WMenetia greyii Gray, 1845: E(se), RMorethia boulengeri (Ogilby, 1890): WNanoscincus maccoyi (Lucas & Frost, 1894): ROphioscincus truncatus (Peters, 1876): E, RPseudemoia pagenstecheri (Lindholm, 1901): SSaiphos equalis (Gray, 1825): ESaproscincus mustelinus (O'Shaughnessy, 1874): ESaproscincus rosei Wells & Wellington, 1985: EMiqua scincoides (White, ex Shaw, 1790): W
generic representation of 100%. There also is ahigh representation of Australian typhlopid(50%), scincid (63%) and elapid (85%) genera inNew England but lesser generic representation by
gekkonids, pygopodids, agamids, boids andcolubrids (22-39%) (Table 2). Being inland, NewEngland lacks the predominantly marine familiesof snakes.

NEW ENGLAND LIZARDS AND SNAKES^ 305
TABLE 1 (Cont.).SNAKESFAMILY TYPHLOPIDAE (Blind Snakes or Worm Snakes)Ramphotyphlops bituberculatus (Peters, 1863): W(sw), RRamphotyphlops nigrescens (Gray, 1845): U(e)Ramphotyphlops proximus (Waite, 1893): W(sw), RRamphotyphlops wiedii (Peters, 1867): WFAMILY BOIDAE (Pythons)Antaresia maculosa (Peters, 1873): W, RMorelia spilota (Lacèpede, 1804): U(p)FAMILY COLUBRIDAEBoiga irregularis (Merrem, 1802): E, RDendrelaphis punctulata (Gray,1827): E(ne), RFAMILY ELAPIDAEAcanthophis antarcticus (Shaw & Nodder, 1802): E, RAustrelaps ramsayi (Krefft, 1864): E(se)Cacophis harriettae ICreffi, 1869: E, RCacophis krefftii Gunther, 1863): E, R
Cacophis squamulosus (Dumeril, Bibron & Dumêril 1854): EDemansia psammophis (Schlegel, 1837): W**Denisonia devisi Waite & Longman, 1920: WDrysdalia coronoides (Gunther, 1858): U(p)Furina diadema (Schlegel, 1837): WHemiaspis sign ata (Jan, 1859): EHoplocephalus bitorquatus (Jan, 1859): U(s)Hoplocephalus stephensii Krefft, 1869: E(ne), RNotechis scutatus (Peters, 1861): EPseudechis guttatus De Vis, 1905: WPseudechis porphyriacus (Shaw, 1794): EPseudonaja textilis (Dumeril, Bibron & Dui/16UL 1854): WRhinoplocephalus nigrescens (Gunther, 1862): ESimoselaps australis (Krefft, 1864): WSuta dwyeri (Worrell, 1956): U(e)Suta suta (Peters, 1863): W, RTropidechis carinatus (Krefft, 1863): E, RVermicella annulata (Gray, 1841): U(s)
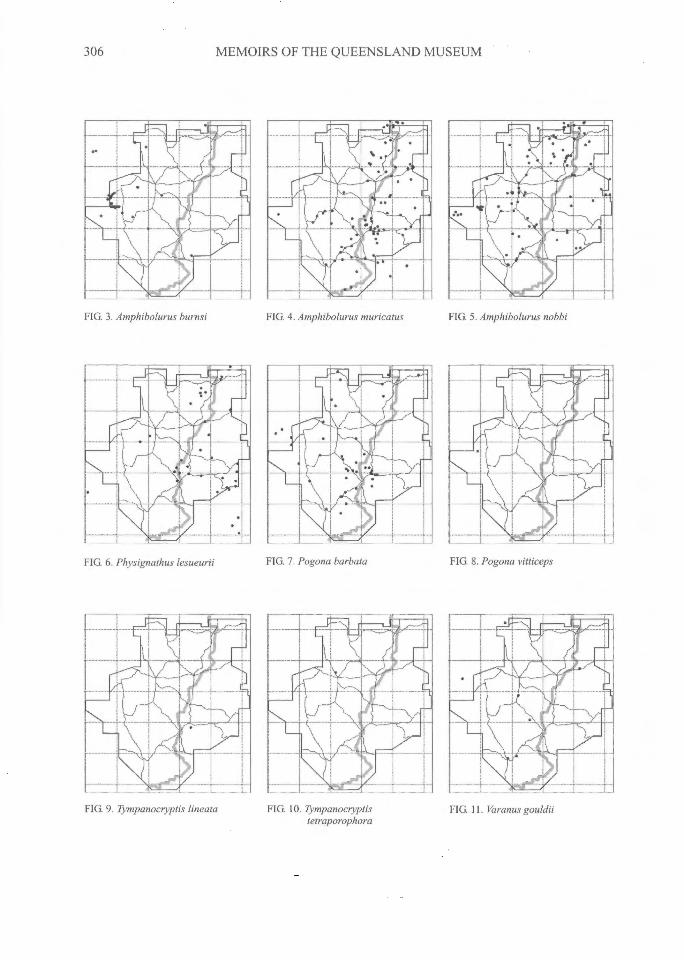
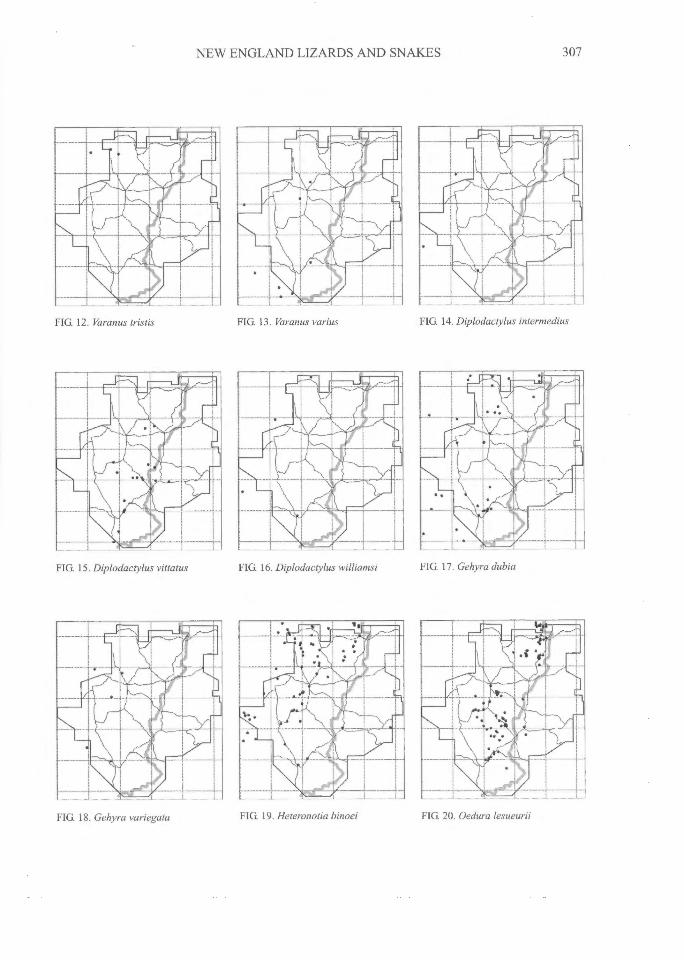
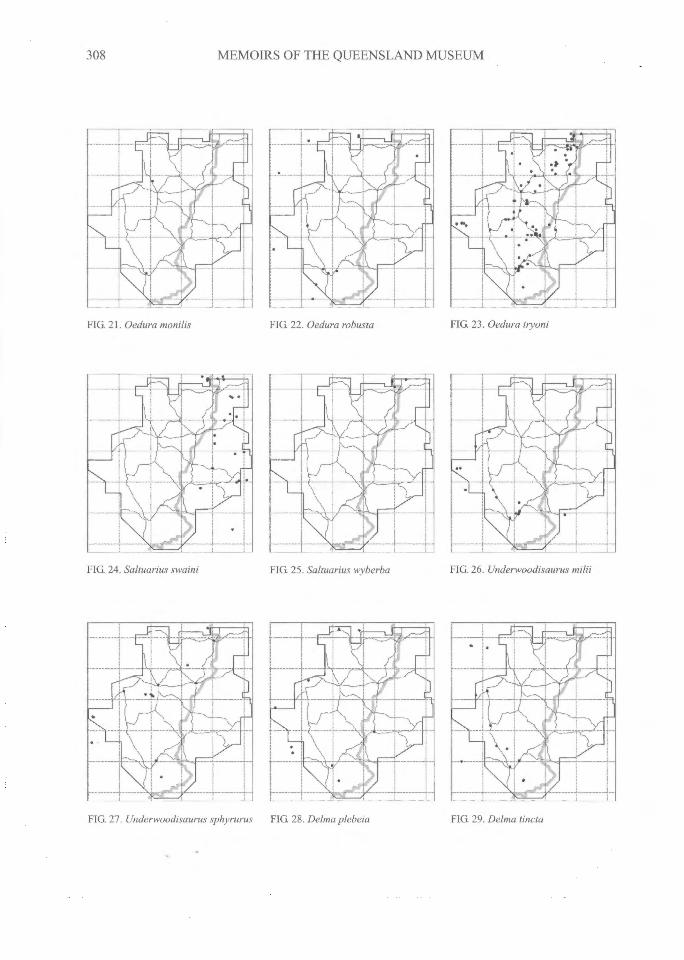
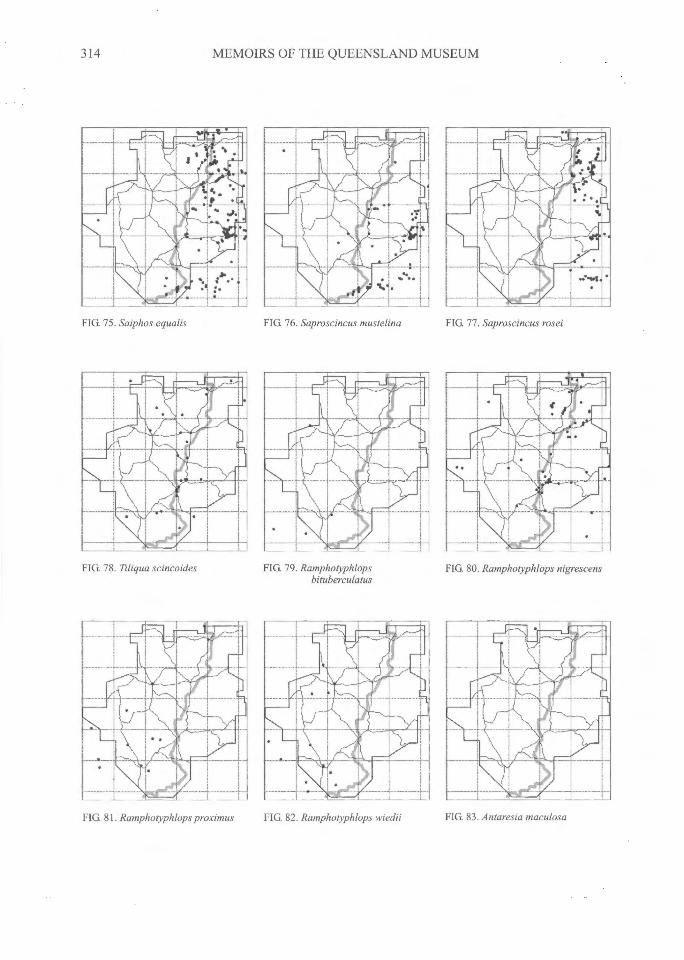
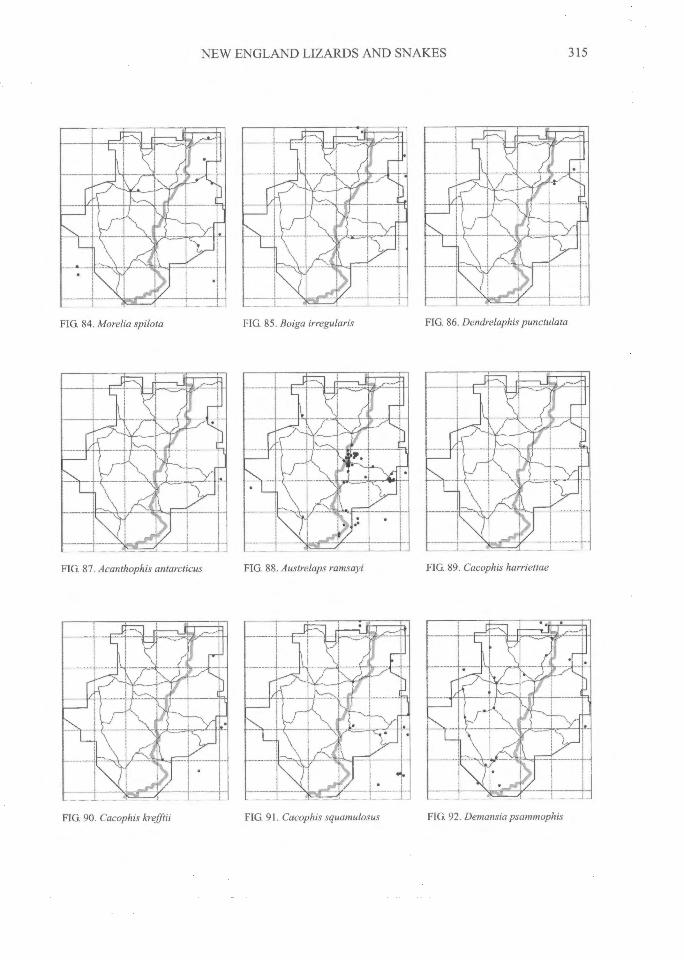
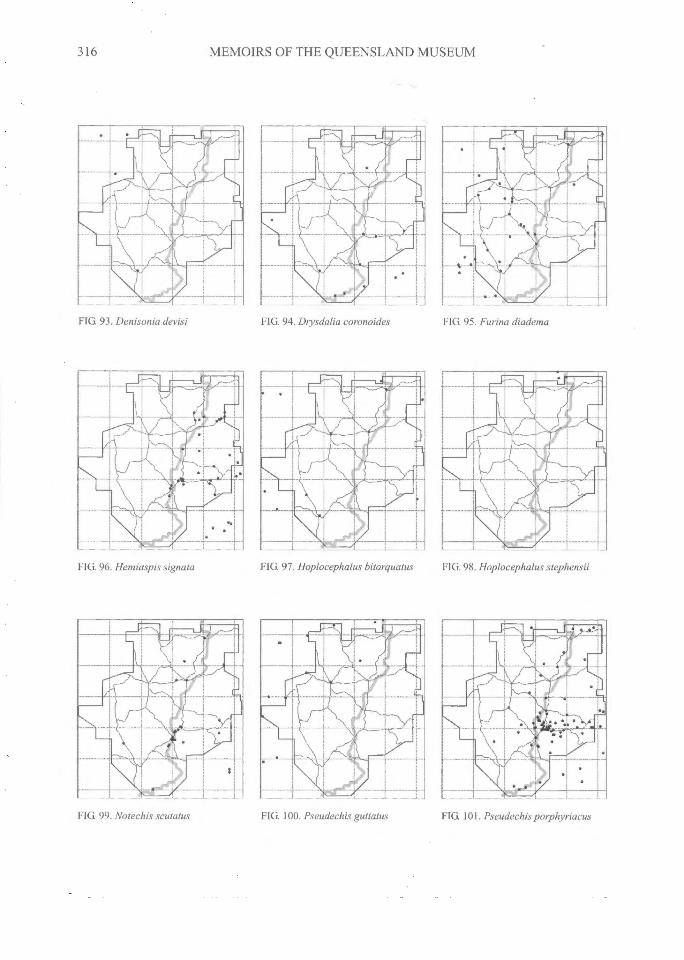
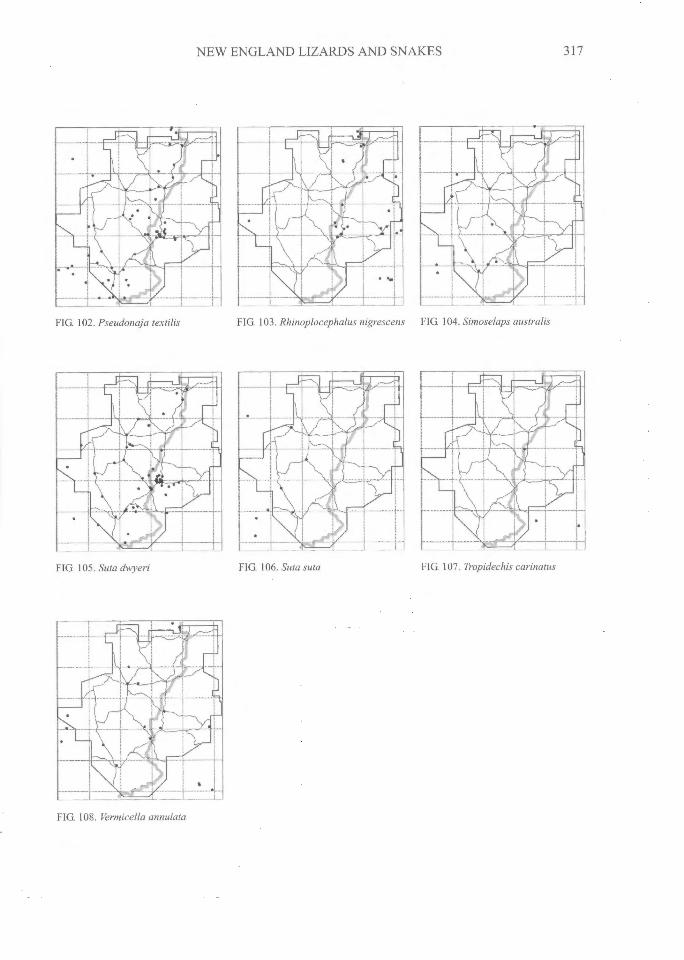
DISTRIBUTIONAL PATTERNSThe distributions of all species (Figs 3-108)
can be grouped into several general categories.The following interpretations have relied on ourdatabase and maps, supplemented by theadditional localities on the maps of Swan (1990)and from specimen-based entries in the databaseof the Atlas of NSW Wildlife (NSW NationalParks and Wildlife Service, 2000).
TABLE 2. Representation in New England of the totalAustralian Squamata. Total genera and speciescalculated from Cogger (2000); number of generaand species from New England from the presentdatabase plus valid additions from Swan (1990).
Species & genera in New England (New England taxa as % ofAustralian total)
Taxon^Genera^Species Genera SpeciesLizards
Gekkonidae 18 111 6(33) 14(13)Pygopodidae 8 34 3(38) 4(12)Agamidae 13 65 5 (39) 10(15)Varanidae 1 26 1(100) 3 (12)Scincidae 38 379 24(63) 50(13)
SnakesTyphlopidae 2 40 1(50) 4(10)Boidae 6 15 2(33) 2(13)Acrochordidae 1 2 0 (0) 0 (0)Colubridae 9 11 2 (22) 2 (18)Elapidae 20 87 17 (85) 22 (26)Hydrophiidae 12 31 0(0) 0 (0)
Laticaudidae 1 2 0 (0) 0 (0)Total 129 803 61(47) 111 (14)
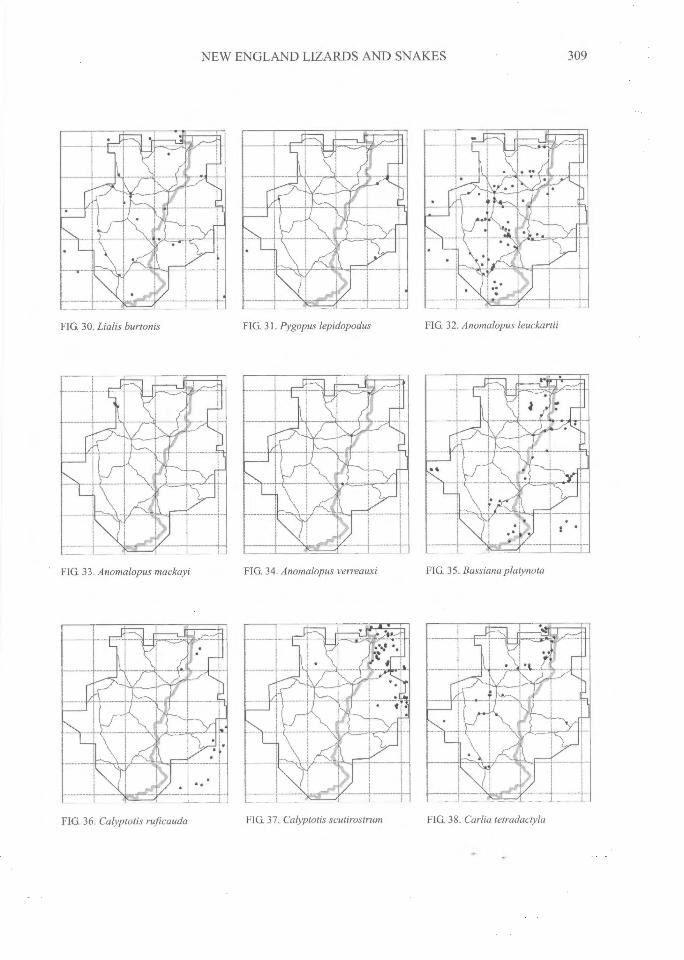
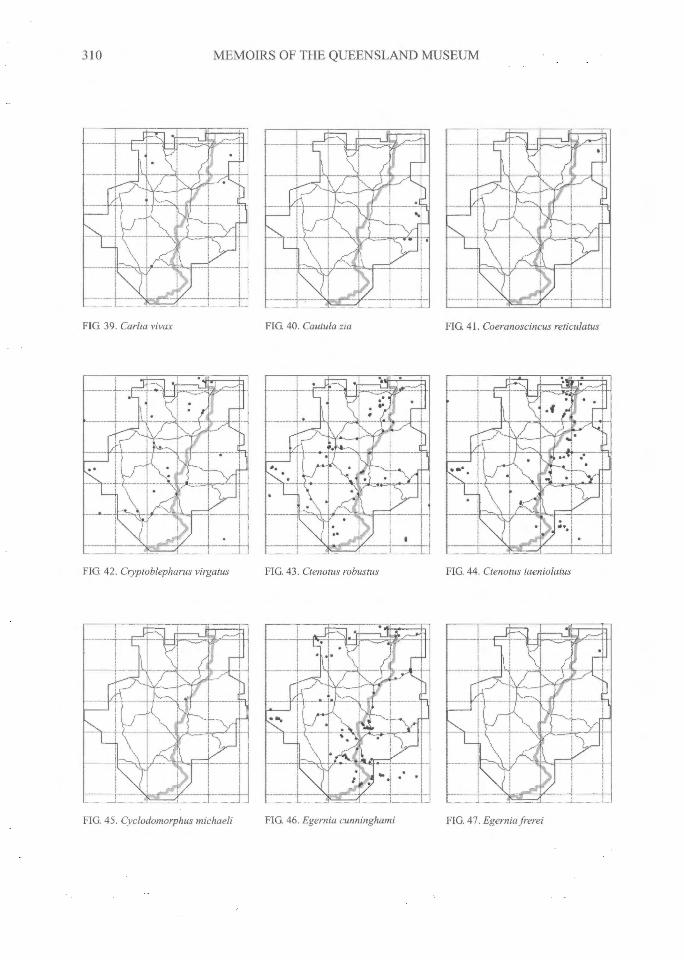
WIDESPREAD DISTRIBUTIONS. Widespreadspecies usually have broad tolerances and habitatpreferences. However, this is not always the case;sometimes widespread distributions may bepatchy, reflecting discontinuous habitat within alarge area. For example, although Egerniacunninghami is widespread (Fig. 46), it is largelyrestricted to exfoliating granite outcrops. Theoccurrences of Physignathus lesueurii andPseudechis porphyriacus are locally restricted bythe distribution of the rivers and other bodies ofwater with which they are closely associated. Inother cases, especially in fossorial or secretivespecies, patchiness may be more apparent thanreal; a species like Pygopus lepidopodus may berecorded only sparsely from an area merelybecause it is difficult to find.
Twenty-two species (20% of the total squamatanfauna) were widespread in New England. Ofthese about equal numbers were evenly wide-spread in the area (8 species), and widespread butpatchily (7 species) or sparsely (7 species)distributed over the region (Table 1).
EASTERN VERSUS WESTERN DISTRIB-UTIONS. There are gradients in climate andnatural vegetation in New England from east towest; accordingly, 74% of the species have eithera predominantly western distribution, or apredominantly eastern one. The Great DividingRange coincides with the boundary of thegeographic range of only a few species (e.g.,Gehyra dubia, Eulamprus kosciuskoi) and insome others, distributions have penetratedslightly to the opposite side only in a few smallareas (e.g., Oedura lesueurii, Oedura tryoni,
306^MEMOIRS OF THE QUEENSLAND MUSEUM
FIG. 3. Amphibolurus burnsi FIG. 4. Amphibolurus muricatus^FIG. 5. Amphibolurus nobbi
FIG. 6. Physignathus lesueurii FIG. 7. Pogona barbata
FIG. 8. Pogona vitticeps
FIG. 9. Tympanoctyptis lineata FIG. 11. Varanus gouldiiFIG. 10. Tympanoctyptistetraporophora
NEW ENGLAND LIZARDS AND SNAKES^
307
FIG. 12. Varanus tristis^FIG. 13. Varanus varius^FIG. 14. Diplodactylus intermedius
FIG. 15. Diplodactylus vittatus^FIG. 16. Diplodactylus wIliamsi^FIG. 17. Gehyra dubia
FIG. 18. Gehyra variegata^FIG 19. Heteronotia binoei^
FIG. 20. Oedura lesueurii
308^MEMOIRS OF THE QUEENSLAND MUSEUM
FIG. 21. Oedura monilis FIG. 22. Oedura robusta FIG. 23. Oedura ttyoni
FIG. 24. Saltuarius swami FIG. 25. Saltuarius wyberba FIG 26. Underwoodisaurus milii
FIG. 27. Underwoodisaurus sphyrurus^FIG. 28. DeIma plebeia FIG. 29. Delma tincta
NEW ENGLAND LIZARDS AND SNAKES^
309
FIG. 30. Lialis burtonis FIG. 31. Pygopus lepidopodus FIG. 32. Anomalopus leuckartii
FIG. 33. Anomalopus mackayi FIG. 34. Anomalopus verreauxi FIG. 35. Bassiana platynota
FIG. 37. Calyptotis scutirostrum^FIG. 38. Carlia tetradactylaFIG. 36. Calyptotis ruficauda
310^MEMOIRS OF THE QUEENSLAND MUSEUM
FIG 39. Carlia vivcvc
FIG. 40. Cautula zia FIG. 41. Coeranoscincus reticulatus
FIG. 42. Cryptoblepharus virgatus^FIG. 43. Ctenotus robustus FIG. 44. Ctenotus taeniolatus
FIG. 45. Cyclodomorphus michaeli^FIG. 46. Egernia cunninghami FIG. 47. Egernia frerei
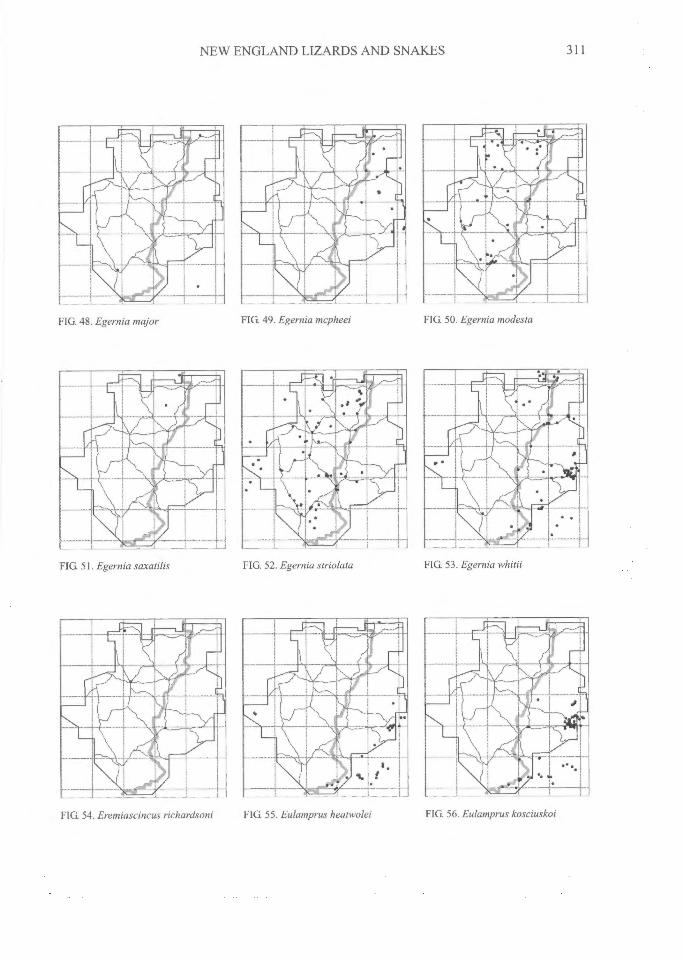
FIG. 50. Egernia modestaFIG 49. Egernia mcpheeiFIG. 48. Egernia major
-- —
FIG. 51. Egernia saxatilis FIG. 52. Egernia striolata FIG. 53. Egernia whitii
NEW ENGLAND LIZARDS AND SNAKES^
311
FIG 54. Eremiascincus richardsoni^FIG 55. Eulamprus heatwolei^
FIG. 56. Eulamprus kosciuskoi

312^MEMOIRS OF THE QUEENSLAND MUSEUM
FIG. 57. Eulamprus martini FIG. 58. Eulamprus murrayi FIG. 59. Eulamprus quoyii
FIG. 60. Eulamprus tenuis
FIG. 61. Hemiergis decresiensis^FIG 62. Lampropholis amicula
FIG 63. Lampropholis caligula FIG. 64. Lampropholis delicata^FIG. 65. Lampropholis elongata
NEW ENGLAND LIZARDS AND SNAKES^
313
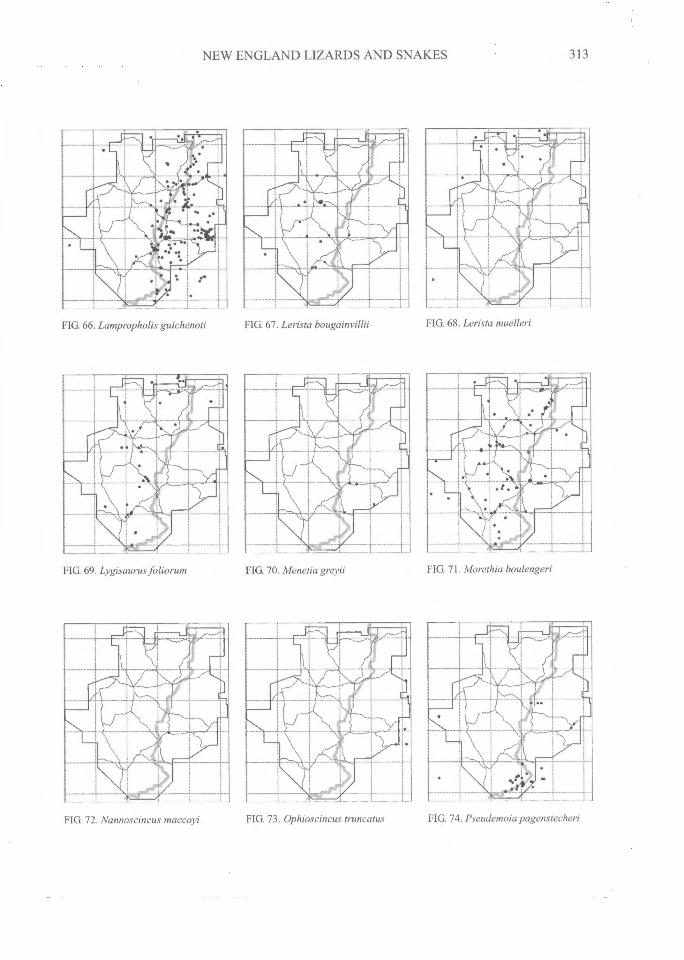
FIG 66. Lampropholis guichenoti^FIG 67. Lerista^ FIG 68. Lerista muelleri
FIG 69. Lygisaurus foliorum^FIG. 70. Menetia greyii^FIG. 71. Morethia boulengeri
FIG. 72. Nannoscincus maccoyi^FIG. 73. Ophioscincus truncatus^FIG. 74. Pseudemoia pagenstecheri
314^MEMOIRS OF THE QUEENSLAND MUSEUM
FIG. 75. Saiphos equalis FIG. 76. Saproscincus mustelina^FIG. 77 . Saproscincus rosei
FIG. 78. Tiliqua scincoides FIG 79. Ramphotyphlopsbituberculatus
FIG. 80. Ramphotyphlops nigrescens
FIG. 82. Ramphotyphlops wiedii^FIG. 83. Antaresia maculosaFIG. 81. Ramphotyphlops proximus
NEW ENGLAND LIZARDS AND SNAKES^
315
FIG 84. Morelia spilota FIG 85. Boiga irregularis FIG. 86. Dendrelaphis punctulata
FIG 87. Acanthophis antarcticus^FIG. 88. Austrelaps ramsayi FIG 89. Cacophis harriettae
FIG 91. Cacophis squamulosus^FIG 92. Demansia psammophisFIG. 90. Cacophis krefflii
316^MEMOIRS OF THE QUEENSLAND MUSEUM
FIG. 93. Denisonia devisi FIG. 94. Thysdalia coronoides FIG. 95. Furina diadema
FIG. 96. Hemiaspis signata FIG. 97. Hoplocephalus bitorquatus^FIG. 98. Hoplocephalus step hensii
FIG. 100. Pseudechis guttatusFIG. 99. Notechis scutatus FIG. 101. Pseudechis porphyriacus
NEW ENGLAND LIZARDS AND SNAKES^
317
FIG. 102. Pseudonaja textilis FIG. 103. Rhinoplocephalus nigrescens FIG. 104. Simoselaps australis
FIG 105. Suta dwyeri FIG. 106. Suta suta FIG. 107. Tropidechis carinatus
FIG. 108. Vermicella annulata

318^MEMOIRS OF THE QUEENSLAND MUSEUM
Egernia modesta, Hem iaspis signata). However,the topography is not severe on the continentaldivide and it is unlikely to constitute a physicalbarrier to dispersal for many species. For a numberof species, the boundary of the geographic rangelies considerably to one side or the other of thecontinental divide (e.g., Anomalopus leuckartii,Bassiana platynota, Lampropholis delicata, Lam-propholis guichenoti, Pseudechis porphyriacus).In such cases, it is likely that distribution islimited by one or more climatic parameters withan east-west gradient (see below), rather than bythe Great Dividing Range itself.
Some of the eastern species certainly candisperse beyond the Great Dividing Range asthere are outlier populations on the western edgeof the study area at Mt Kaputar, where elevation,rainfall and vegetation parallel those on the easternside, but differ from those of the western areassurrounding the mountain. Such outliers are:Bassiana platynota, Ctenotus taeniolatus,Egernia cunninghami, Egernia whitii, Eulamprusheatwolei, Hemiergis decresiensis, Lampropholisdelicata, Pseudemoia pagenstecheri andRhinoplocephalus nigrescens. Conversely, a fewpredominantly western species (e.g, Heteronotiabinoei) are found in a few localities in the east.
A number of the species that are predominantlywestern within the confines of New England areabsent or uncommon in eastern New Englandbecause of their exclusion from the wetter forestsof that region; beyond that gap their ranges doextend eastward, often to the coast. Examples areOedura robusta, Lygisaurus foliorum, Tiliquascincoides, Ramphotyphlops wiedii, Demansiapsammophis, Furina diadema, Pseudonajatextdis and Simoselaps australis.
There are slightly more species with a pre-dominantly western distribution (40%) than apredominantly eastern one (30%). The differencemay be even more disparate than these figuressuggest, as there are a number of western species,e.g., Trachydosaurus rugosus, Pseudechis australis,that have been found near, but not inside, thewestern boundary of New England. With furthercollecting, or upon completion of some of thesurveys still in progress, the ranges of some ofthese will likely be found to extend into NewEngland.
It should also be noted that gorges and rivervalleys permit the penetration of coastal speciesinto New England e.g. Boiga irregularis (Webber& Heatole, 1991).
Different taxa vary in regard to east-westdistributional patterns. The geckos (13 specieswestern, 2 species eastern), pygopodids (2 w, 0e), varanids (2 w, 0 e), agamids (5 w, 1 e),typhlophids (3 w, 0 e) and boids (1 w, 0 e) aremainly western rather than eastern, whereas thereverse is true of the skinks (24 species eastern,12 species western), elapids (11 e, 7 w) andcolubrids (2 e, 0 w).
NORTHERN VERSUS SOUTHERNDISTRIBUTIONS. The north-south axis doesnot feature prominently in the distribution ofsquamates in New England. The northerlydistributed species occur on only one side orother of the Great Dividing Range and hencerepresent subsets of the eastern (8 species) orwestern (4 species) groups, but whose southernlimits of distribution are reached in NewEngland. There are no species restricted to thenorth that range widely from east to west in thatregion.
There are just two species in New England thatspan New England from east to west butprimarily in the south; these are Pseudemoiapagenstecheri (Fig. 74) and Tympanocryptisdiemensis (Swan, 1990). There are six speciesfrom only the southeastern quadrant and fourfrom only the southwestern one; these wereconsidered subgroups of the eastern and westerngroups.
'CENTRAL' DISTRIBUTION. There was nospecies with a strictly central distribution. How-ever, Hem iergis decresiensis was predominantlycentral in that it was represented by manylocalities in the central region, along the con-tinental divide and immediately adjacent to it;beyond that area it was widespread (and waslisted as such for statistical purposes), but only atscattered localities.
The only other species known only fromcentral locations were represented by so fewrecords that their distribution within NewEngland could not be interpreted.
INFREQUENTLY ENCOUNTERED. A salientaspect of the New England reptilian fauna is thelarge number of species that were recorded fromonly a small number of localities (`R' in Table 1).In many cases, supplementation by the additionallocalities mapped by Swan (1990) allowedallocation of these species to one of thedistributional categories mentioned above. Theremaining (4 species) were represented by onlyone locality in New England and supplementary
III >1400^ 1200-1399^ 800-1199^ 400-799
0-399
NEW ENGLAND LIZARDS AND SNAKES^
319
information was not available to aid ininterpretation of their local distributional pattern.For example, Nannoscincus maccoyi (Fig. 72)was found at only one locality, southeast of thecenter of New England. This is a considerablerange extension as formerly it was not knownnorth of Sydney (Swan, 1990). It is likely that theranges of such species will be extended withfurther information, or these localities shown tobe outliers.
Some of these R species may be rare; in othercases they may be more common than suggestedby their frequency in collections because they aresecretive and therefore less subject to beingfound. Gibbons et al. (1997) noted that over along period of collecting, the known extent ofdistributions tend to increase remarkably andspecies' ranges often are much broader thanindicated by less intensive collecting.
RELATION OF DISTRIBUTION TOENVIRONMENTAL CONDITIONS
In the following account, the range ofconditions under which the various species arefound within New England is given. Outside ofNew England some of these species may extendinto areas with environments beyond the limitsencountered within the study area. Wherecorrelations are made between distributionalpatterns and particular levels of environmentalfeatures, the relationship is referable only to theNew England area, not to the geographic range ofa species as a whole.
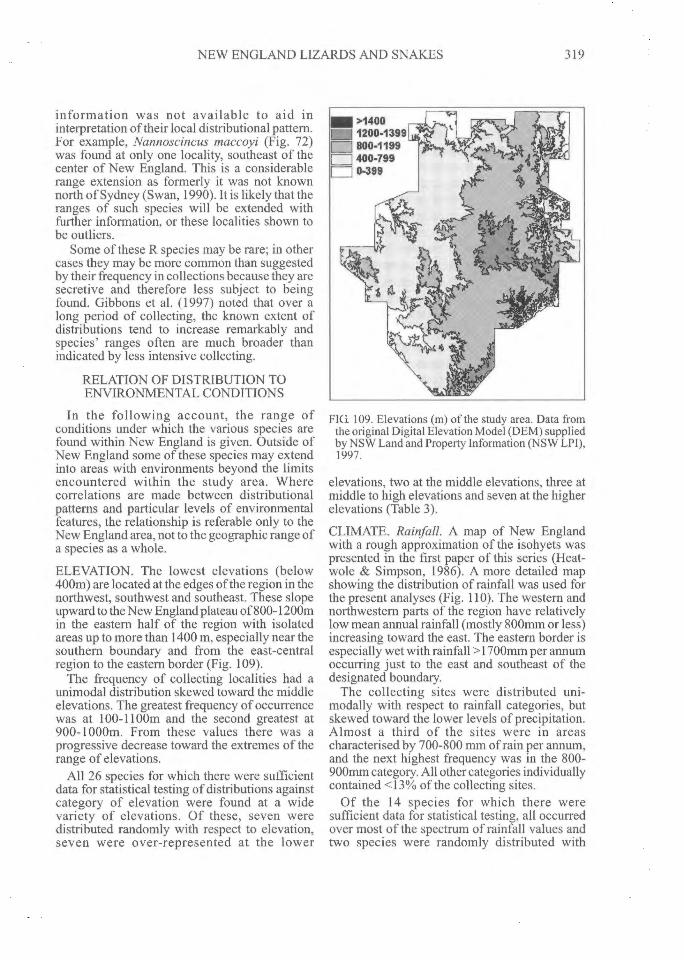
ELEVATION. The lowest elevations (below400m) are located at the edges of the region in thenorthwest, southwest and southeast. These slopeupward to the New England plateau of 800-1200min the eastern half of the region with isolatedareas up to more than 1400 m, especially near thesouthern boundary and from the east-centralregion to the eastern border (Fig. 109).
The frequency of collecting localities had aunimodal distribution skewed toward the middleelevations. The greatest frequency of occurrencewas at 100-1100m and the second greatest at900-1000m. From these values there was aprogressive decrease toward the extremes of therange of elevations.
All 26 species for which there were sufficientdata for statistical testing of distributions againstcategory of elevation were found at a widevariety of elevations. Of these, seven weredistributed randomly with respect to elevation,seven were over-represented at the lower
FIG. 109. Elevations (m) of the study area. Data fromthe original Digital Elevation Model (DEM) suppliedby NSW Land and Property Information (NSW LPI),1997.
elevations, two at the middle elevations, three atmiddle to high elevations and seven at the higherelevations (Table 3).
CLIMATE. Rainfall. A map of New Englandwith a rough approximation of the isohyets waspresented in the first paper of this series (Heat-wole & Simpson, 1986). A more detailed mapshowing the distribution of rainfall was used forthe present analyses (Fig. 110). The western andnorthwestern parts of the region have relativelylow mean annual rainfall (mostly 800mm or less)increasing toward the east. The eastern border isespecially wet with rainfall >1700mm per annumoccurring just to the east and southeast of thedesignated boundary.
The collecting sites were distributed uni-modally with respect to rainfall categories, butskewed toward the lower levels of precipitation.Almost a third of the sites were in areascharacterised by 700-800 mm of rain per annum,and the next highest frequency was in the 800-900mm category. All other categories individuallycontained <13% of the collecting sites.
Of the 14 species for which there weresufficient data for statistical testing, all occurredover most of the spectrum of rainfall values andtwo species were randomly distributed with
320^MEMOIRS OF THE QUEENSLAND MUSEUM
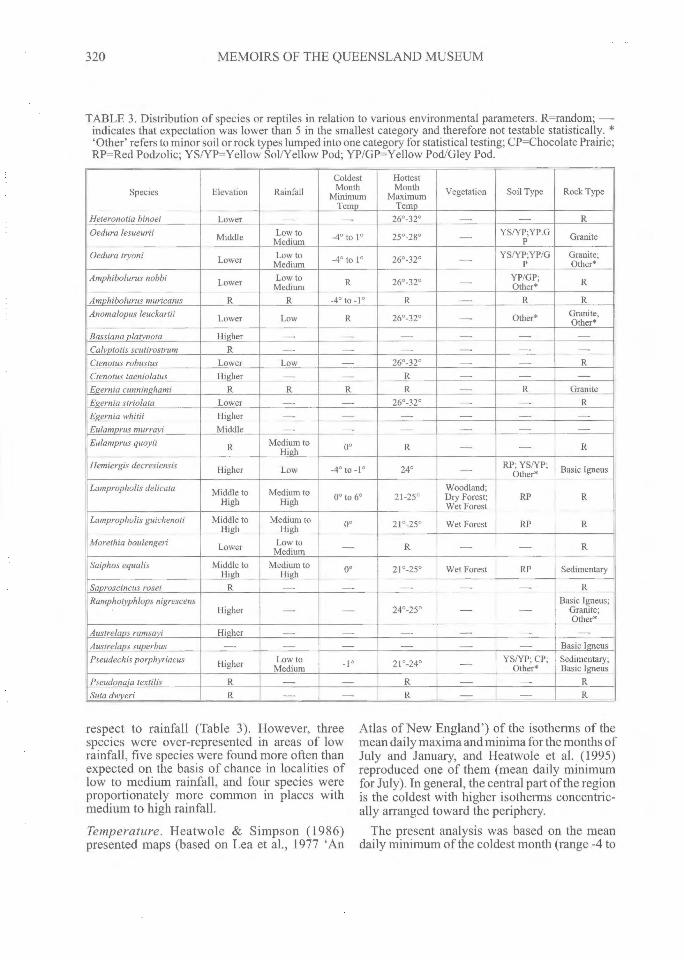
TABLE 3. Distribution of species or reptiles in relation to various environmental parameters. R=random; --indicates that expectation was lower than 5 in the smallest category and therefore not testable statistically. *'Other' refers to minor soil or rock types lumped into one category for statistical testing; CP=Chocolate Prairie;RP=Red Podzolic; YS/YP=Yellow Sol/Yellow Pod; YP/GP=Yellow Pod/Gley Pod.
Species Elevation RainfallColdestMonth
MinimumTemp
HottestMonth
MaximumTemp
Vegetation Soil Type Rock Type
Heteronotia binoei Lower — — 26°-32° — — ROedura lesueurii Middle Low to
Medium -4° to 10 25°-28° -- YS/YP;YP.GP Granite
Oedura Pyoni Lower Low toMedium -40 to 1° 26°-32° — YS/YP;YP/G
PGranite;Other*
Amphibolurus nobbi Lower Low toMedium R 26°-32° — YP/GP;
Other* R
Amphibolurus muricatus R R -4° to -1 0 R — R RAnomalopus leuckartii Lower Low R 26°-32° — Other* Granite,
Other*Bassiana platynota Higher — — — — —
Calyptotis scutirostrum R — — — — — —
Ctenotus robustus Lower Low — 26°-32° — — RCtenotus taeniolatus Higher R — — —
Egernia cunninghami R R R R — R GraniteEgernia striolata Lower — 26°-32° — — REgernia whitii Higher — — — —
Eulamprus murrayi Middle — — — — —
Eulamprus quoyii R Medium toHigh 0° R — R
Hemiergis decresiensis Higher Low -4° to -1° 24° — RP; YS/YP "Other* Basic Igneus
Lampropholis delicata Middle toHigh
Medium toHigh 0° to 6° 21-25°
Woodland;Dry Forest;Wet Forest
RP R
Lampropholis guichenoti Middle toHigh
Medium toHigh 0° 21°-25° Wet Forest RP R
Morethia boulengeri Lower Low toMedium — R — — R
Saiphos equalis Middle toHigh
Medium toHigh 0° 21°-25° Wet Forest RP Sedimentary
Saproscincus rosei R — -- — — — RRamphotyphlops nigrescens
Higher — 24°-25° — —Basic Igneus;
Granite;Other*
Austrelaps ramsayi Higher — — — — —
Austrelaps superbus — — — — — Basic IgneusPseudechis porphyriacus Higher Low to
Medium 210-24° — YS/YP; CP;Other*
Sedimentary;Basic Igneus
Pseudonaja textilis R — — R — RSuta dwyeri R — — R — — R
respect to rainfall (Table 3). However, threespecies were over-represented in areas of lowrainfall, five species were found more often thanexpected on the basis of chance in localities oflow to medium rainfall, and four species wereproportionately more common in places withmedium to high rainfall.
Temperature. Heatwole & Simpson (1986)presented maps (based on Lea et al., 1977 'An
Atlas of New England') of the isotherms of themean daily maxima and minima for the months ofJuly and January, and Heatwole et al. (1995)reproduced one of them (mean daily minimumfor July). In general, the central part of the regionis the coldest with higher isotherms concentric-ally arranged toward the periphery.
The present analysis was based on the meandaily minimum of the coldest month (range -4 to

ri < 600
Et 600 - 700
700 -800
17] 800-900
M 900 - 1000
• 1000 - 1100
• 1100 - 1200
• > 1200
NEW ENGLAND LIZARDS AND SNAKES^ 321
FIG. 110. Mean annual rainfall (mm) of the study area.Original DEM supplied by NSW LPL Mean potentialrainfall data derived from ESOCLIM program whichwas supplied by CRES at National University, 1997.
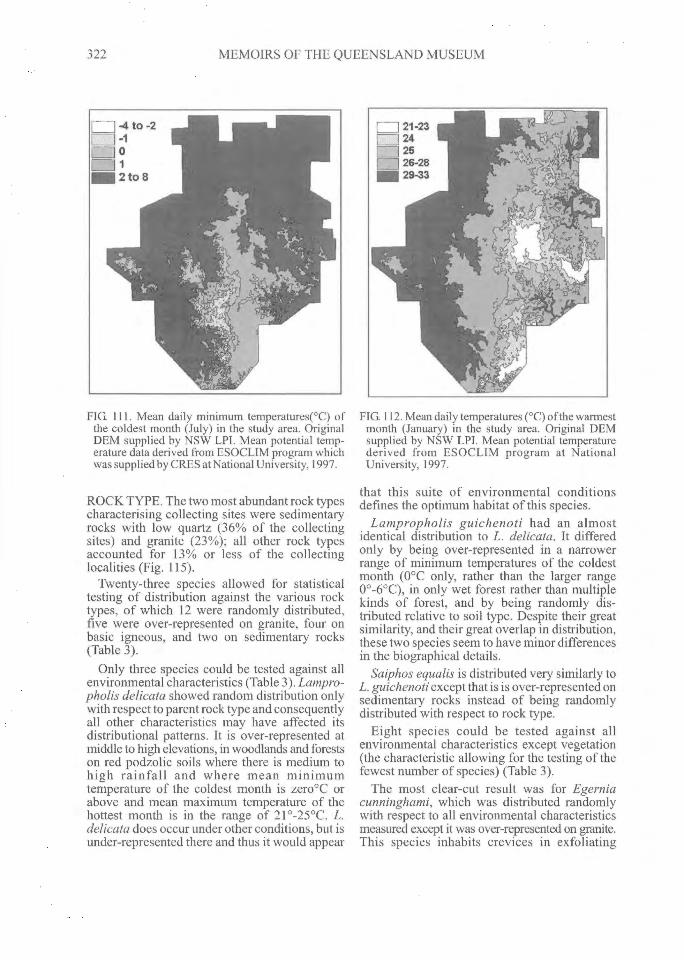
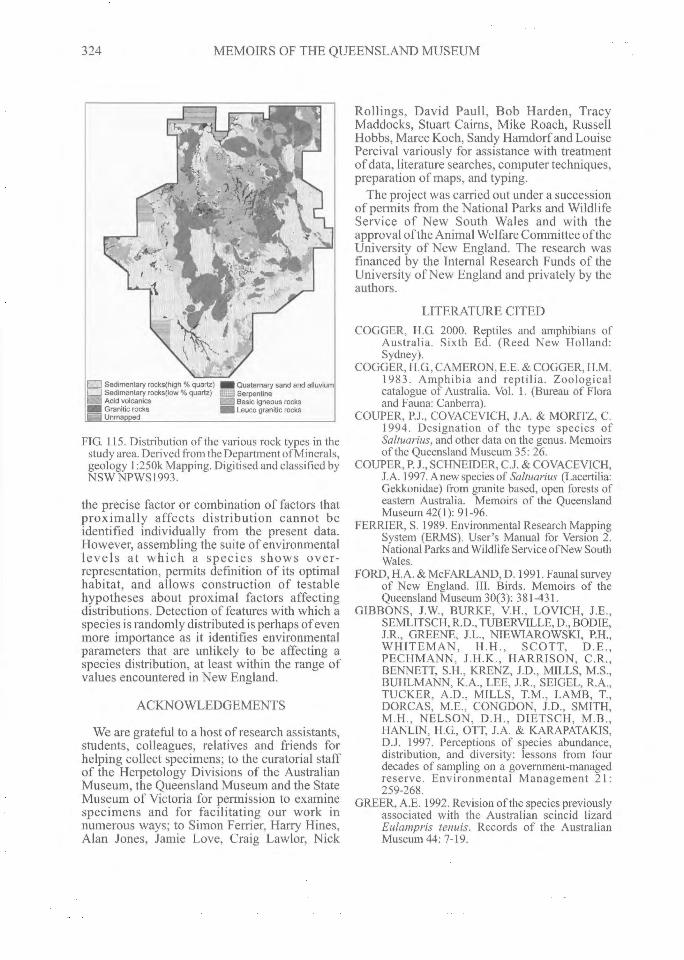
6°C) (Fig. 111) and mean daily maximum of thehottest month (range within the area of 12°C to32°C) (Fig. 112).
The mean daily minima of the coldest monthwere unimodally distributed with a peak at andjust below freezing, gradually descending towardthe higher and lower values. Intervals of meandaily minima of 2°C or above accounted for onlyslightly more than 9% of the collecting sites andthose of 2°C or above for only about 14%.
Of the twelve species for which statisticalanalysis was feasible, three showed randomdistribution with regard to levels of mean dailyminimum temperature of the coldest month(Table 3). The remainder, while found over mostof the spectrum of minimum temperatures,statistically favoured certain levels. Four speciestended to occur more often than expected in thecoldest localities, four at intermediate localities(near zero), and one was enigmatic, being foundmore often than expected by chance over a widerange of the higher temperatures.
The mean daily maximum temperature of thehottest month showed a bimodal frequencydistribution with one peak at 24°C (20.6% of thecollecting sites) and 25°C (21.4%) and the other
at 28 °C (12.1%); all other temperature intervalsindividually accounted for <10% of the sites.
Of the 20 species for which statistical testingcould be conducted, seven were shown to bedistributed at random with respect to mean dailymaximum temperature for the hottest month(Table 3). Four species were over-represented inthe thermal categories in the range of 21°-24°C or21°-25°C, two in the ranges of 24°C or 24°-25°C,and seven in various ranges of categories from25° C and higher.
VEGETATION. The New England area isdevoted to the pastoral industry and consequentlyis highly modified by human activity. Accord-ingly, many of the collecting sites occurred oncleared land (45%), with disturbed remnantsaccounting for an additional 11% of the localities.The forest types containing the greatest frequencyof occurrence of collecting sites were Dry ForestComplex (19%) and Dry Open Forest (15%); allother vegetation types individually contained11% of the sites (Fig. 113).
Each of the previous papers in this series hasused a different classification of vegetation orland-use. The present analysis is based on amodification of the classification of vegetationsystems for northeastern New South Wales (NSWNational Parks and Wildlife Service, 1994).
Only three species could be tested because of thesmall areas occupied by wet forests and the statisticallimitations this imposed. Saiphos equalis andLampropholis guichenoti were found in wetforest significantly more often than expected atrandom, whereas Lampropholis delicata wasover-represented in woodlands and in both dryand wet forests (Table 3).
SOIL TYPE. The soil types (Fig. 114) accountingfor the greatest number of collecting localitieswere Yellow Pod/Grey Pod (24% of the sites),Red Podzolic (21%) and Yellow Sol/Yellow Pod(19%); the other 15 soil types each accounted for<10% of the collecting localities and collectivelyfor 36%.
Eleven species were tested against thedistribution of soil types. Of these, two weredistributed randomly with respect to soil type(Table 3), three were found oftener than expectedby chance on red podzolic soils, and five wereover-represented on more than one soil type, butalways involving yellow sol/yellow pod and/oryellow pod/gley pod soils in combination withothers.
322^MEMOIRS OF THE QUEENSLAND MUSEUM
FIG. 111. Mean daily minimum temperatures(°C) ofthe coldest month (July) in the study area. OriginalDEM supplied by NSW LPI. Mean potential temp-erature data derived from ESOCLIM program whichwas supplied by CRES at National University, 1997.
ROCK TYPE. The two most abundant rock typescharacterising collecting sites were sedimentaryrocks with low quartz (36% of the collectingsites) and granite (23%); all other rock typesaccounted for 13% or less of the collectinglocalities (Fig. 115).
Twenty-three species allowed for statisticaltesting of distribution against the various rocktypes, of which 12 were randomly distributed,five were over-represented on granite, four onbasic igneous, and two on sedimentary rocks(Table 3).
Only three species could be tested against allenvironmental characteristics (Table 3). Lampro-pholis delicata showed random distribution onlywith respect to parent rock type and consequentlyall other characteristics may have affected itsdistributional patterns. It is over-represented atmiddle to high elevations, in woodlands and forestson red podzolic soils where there is medium tohigh rainfall and where mean minimumtemperature of the coldest month is zero°C orabove and mean maximum temperature of thehottest month is in the range of 21°-25°C. L.delicata does occur under other conditions, but isunder-represented there and thus it would appear
FIG. 112. Mean daily temperatures (°C) of the warmestmonth (January) in the study area. Original DEMsupplied by NSW LPI. Mean potential temperaturederived from ESOCLIM program at NationalUniversity, 1997.
that this suite of environmental conditionsdefines the optimum habitat of this species.
Lampropholis guichenoti had an almostidentical distribution to L. delicata. It differedonly by being over-represented in a narrowerrange of minimum temperatures of the coldestmonth (0°C only, rather than the larger range0°-6°C), in only wet forest rather than multiplekinds of forest, and by being randomly dis-tributed relative to soil type. Despite their greatsimilarity, and their great overlap in distribution,these two species seem to have minor differencesin the biographical details.
Saiphos equalis is distributed very similarly toL. guichenoti except that is is over-represented onsedimentary rocks instead of being randomlydistributed with respect to rock type.
Eight species could be tested against allenvironmental characteristics except vegetation(the characteristic allowing for the testing of thefewest number of species) (Table 3).
The most clear-cut result was for Egerniacunninghami, which was distributed randomlywith respect to all environmental characteristicsmeasured except it was over-represented on granite.This species inhabits crevices in exfoliating

',Rainforest• MOist Open ForestMDry Forest & Woodland• Moist Open ForestEDry Open ForestNVoodland"'Plantationfl Unmapped
NEW ENGLAND LIZARDS AND SNAKES^
323
553 black earth-euchrozemblack earth-praise
Elm choc-black earthpiffp chocolate-prairie
krasznozem-chocolateES] non-calcic brownNM red brown earth red podzolic
1̂ 1 no data1111111111 soled sol yellow earthPIN solodised solonetz red brown earth
solonetzic red brown earthyellow pod gley pod
\s, • yellow podzolicyellow sot yellow pod
M yellow sol-solod sot
FIG. 113. Vegetation systems of the study area.Derived from broad vegetation boundaries mappedon 1:100k Landsat imagery. Mapping undertaken byNPWS in 1991.
rocks throughout its range (Cogger, 2000);granite is especially prone to such structure. It isnot surprising that the distribution of E.cunnighami is strongly related to the occurrenceof this primary feature of its habitat.
Similarly, Amphibolurus muricatus thatshowed random distribution with respect to allenvironmental parameters tested except for meanminimum of the coldest month; this species wasover-represented in the coldest part of the area(Table 3). The remaining six species in thiscategory departed from randomness in respect toa number of parameters and distributionalpatterns may be influenced in more complexways than for A. muricatus and E. cunninghami.
For the remaining species tests there were threeor more environmental parameters for whichtests could not be conducted and consequentlyoptimal habitats are defined less completely.Heteronotia binoei and Egernia striolata aredistributed randomly with respect to rock type,Suta dwyeri and Pseudonaja textilis to elevation,maximum temperatures and rock type,
FIG. 114. Distribution of the various soil types in thestudy area. From the Atlas of New England (Lea et al.,1997), digitised and executed using EnvironmentalResearch Mapping Scheme (Ferrier, 1989), NPWS,NSW, Armidale office.
Saproscincus rosei to elevation and rock type,Calyptotis scutirostrum to elevation, Ctenotustaeniolatus to maximum temperatures, andMorethia boulengeri to maximum temperaturesand rock type. Some of the species with a limitednumber of available tests were over-representedon some categories. Heteronotia binoei wasover-represented at lower elevations and highmaximum temperatures, Bass iana platynota athigh elevations, Ctenotus robustus at low rainfall(see above), low elevation, and high maximumtemperatures, Ctenotus taeniolatus to highelevations, Egernia striolata at low elevations,Egernia whitii at high elevations, Eulamprusmurrayi at middle elevations, Morethiaboulengeri at low elevations and low to mediumrainfall, Ramphotyph lops nigrescens at highelevations and maximum temperatures inmidrange, and Austrelaps ramsayi at highelevations (Table 3).
Various of the environmental attributes of theregion are correlated with each other (e.g.,temperature, elevation, and rainfall) and hence
Sedimentary rocks(high % quartz) IIIIIII Quaternary sand and alluviumSedimentary rocks(low °A quartz) 'i'i'iii Serpentine
M Acid volcanics^ S Basic igneous rocksIIIII Granitic rocks^ NM Leuco granitic rocksM Unmapped
324^MEMOIRS OF THE QUEENSLAND MUSEUM
FIG. 115. Distribution of the various rock types in thestudy area. Derived from the Department of Minerals,geology 1:250k Mapping. Digitised and classified byNSW NPWS1993.
the precise factor or combination of factors thatproximally affects distribution cannot beidentified individually from the present data.However, assembling the suite of environmentallevels at which a species shows over-representation, permits definition of its optimalhabitat, and allows construction of testablehypotheses about proximal factors affectingdistributions. Detection of features with which aspecies is randomly distributed is perhaps of evenmore importance as it identifies environmentalparameters that are unlikely to be affecting aspecies distribution, at least within the range ofvalues encountered in New England.
ACKNOWLEDGEMENTS
We are grateful to a host of research assistants,students, colleagues, relatives and friends forhelping collect specimens; to the curatorial staffof the Herpetology Divisions of the AustralianMuseum, the Queensland Museum and the StateMuseum of Victoria for permission to examinespecimens and for facilitating our work innumerous ways; to Simon Ferrier, Harry Hines,Alan Jones, Jamie Love, Craig Lawlor, Nick
Rollings, David Paull, Bob Harden, TracyMaddocks, Stuart Cairns, Mike Roach, RussellHobbs, Maree Koch, Sandy Hamdorf and LouisePercival variously for assistance with treatmentof data, literature searches, computer techniques,preparation of maps, and typing.
The project was carried out under a successionof permits from the National Parks and WildlifeService of New South Wales and with theapproval of the Animal Welfare Committee of theUniversity of New England. The research wasfinanced by the Internal Research Funds of theUniversity of New England and privately by theauthors.
LITERATURE CITEDCOGGER, H.G. 2000. Reptiles and amphibians of
Australia. Sixth Ed. (Reed New Holland:Sydney).
COGGER, HG, CAMERON, E.E. & COGGER, H.M.1983. Amphibia and reptilia. Zoologicalcatalogue of Australia. Vol. 1. (Bureau of Floraand Fauna: Canberra).
COUPER, P.J., COVACEVICH, J.A. & MORITZ, C.1994. Designation of the type species ofSaltuarius, and other data on the genus. Memoirsof the Queensland Museum 35: 26.
COUPER, P. J., SCHNEIDER, C.J. & COVACEVICH,J.A. 1997. Anew species of Saltuarius (Lacertilia:Gekkonidae) from granite based, open forests ofeastern Australia. Memoirs of the QueenslandMuseum 42(1): 91-96.
FERRIER, S. 1989. Environmental Research MappingSystem (ERMS). User's Manual for Version 2.National Parks and Wildlife Service ofNew SouthWales.
FORD, H.A. & McFARLAND, D. 1991. Faunal surveyof New England. III. Birds. Memoirs of theQueensland Museum 30(3): 381-431.
GIBBONS, J.W., BURKE, V.H., LOVICH, J.E.,SEMLITSCH, R.D., TUBERVILLE, D., BODIE,JR., GREENE, J.L., NIEWIAROWSKI, P.H.,WHITEMAN, H.H., SCOTT, D.E.,PECHMANN, J.H.K., HARRISON, C.R.,BENNETT, S.H., KRENZ, J.D., MILLS, M.S.,BUHLMANN, K.A., LEE, J.R., SEIGEL, R.A.,TUCKER, A.D., MILLS, T.M., LAMB, T.,DORCAS, M.E., CONGDON, J.D., SMITH,M.H., NELSON, D.H., DIETSCH, M.B.,HANLIN, HG, OTT, J.A. & KARAPATAKIS,D.J. 1997. Perceptions of species abundance,distribution, and diversity: lessons from fourdecades of sampling on a government-managedreserve. Environmental Management 21:259-268.
GREER, A.E. 1992. Revision of the species previouslyassociated with the Australian scincid lizardEulampris tenuis. Records of the AustralianMuseum 44: 7-19.
NEW ENGLAND LIZARDS AND SNAKES^ 325
1997. A new species of Lampropholis (Squamata :Scincidae) with a restricted high altitudedistribution in eastern Australia. AustralianZoologist 30(3): 360-368.
HEATWOLE, H. & SIMPSON, R.D. 1986. Faunalsurvey of New England. I. Introduction andgeneral description of the area. Memoirs of theQueensland Museum 22: 107-113.
HEATWOLE, H., de BAVAY, J., WEBBER, P. &WEBB, G. 1995. Faunal survey of New EnglandIV. The Frogs. Memoirs of the QueenslandMuseum 38: 229-249.
HUTCHINSON, M.F. 1989. A new objective methodfor spatial interpolation of meteorologicalvariables from irregular networks applied to theestimation of monthly mean solar radiation,temperature, precipitation and windrun. CSIRODivision of Water Resources TechnicalMemorandum 5: 95-104
HUTCHISON, M.N. 1990. The generic classificationof the Australian elapid snakes. Memoirs of theQueensland Museum 29: 397-405.
HUTCHISON, M.N. & DONNELLAN, S.C. 1992Taxonomy and genetic variation in the Australianlizards of the genus Pseudemoia (Scincidae:Lygosominae). Journal of Natural History 26:215-264.
HUTCHISON, M.N., DONNELLAN, S.C, BAVER-STOCK, P.R., KRIEG, M., SIMMS, S. &BURGIN, S. 1990. Immunological relationshipsand generic revision of the Australian lizardsassigned to the genus Leiolopisma (Scincidae:Lygosominae). Australian Journal of Zoology:535-554.
INGRAM, G & COVACEVICH, J. 1988. Revision ofthe genus Lygisaurus de Vis (Scincidae: Reptilia)in Australia. Memoirs of the Queensland Museum25(2): 333-354.
KING, M. 1983. The Gehyra australis species complex(Sauna: Gecklconidae). Amphibia-Reptilia 4:147-169.
LEA, D.A.M., PIGRAM, J.J. & GREENWOOD, L.1977. Pp. 51, 340. An atlas of New England.(University of New England: Armidale).
NSW NATIONAL PARKS AND WILDLIFESERVICE, 1994. Vegetation systems of
north-east NSW forests. North East ForestsBiodiversity Report No. 26: 1-19.
NSW NATIONAL PARKS AND WILDLIFESERVICE. 2000. Atlas of NSW Wildlife,print-out of database.
RAWLINSON, P.A. 1991. Taxonomy and distributionof the Australian Tiger snakes (Notechis) andCopper Heads (Austrelaps) (Serpentes: Elapidae).Proceedings of the Royal Society of Victoria103(2): 125 -135.
SADLIER, R.A., 1990. The scincid genusNannoscincus Gunther: a re-evaluation. Memoirsof the Queensland Museum 29: 487-494.
SADLIER, R.A., COLGAN, D.J. & SHEA, GM. 1993.Taxonomy and distribution of the scincid lizardSaproscincus challengeri and related species insoutheastern Australia. Memoirs of theQueensland Museum 34:138-158.
SHEA, G.M. 1995a. The effect of an inadequate key:Ramphotyphlops broomi (Squamata:Typhlopidae) does not occur in New South Wales.Herpetofauna 25(1): 15-18.
1995b. A taxonomic revision of the Cyclodomorphuscasuarinae complex (Squamata: Scincidae).Records of the Australian Museum 44: 7-19.
SIMPSON, R.D. & STANISIC, J. 1986. Faunal surveyof New England. II. The distribution of gastropodmolluscs. Memoirs of the Queensland Museum22(2): 115-139.
SMITH, W.J.S., OSBORNE, W.S., DONNELLAN,S.C. & COOPER, P.D. 1999. The systematicstatus of the earless dragon lizards, Tymanoctyptis(Reptilia: Agamidae), in south eastern Australia.Australian Journal of Zoology 47: 51-564.
SWAN, G. 1990. A field guide to the snakes and lizardsof New South Wales. (Three Sisters Publications:Winmalee, NSW).
WEBBER, P. & HEATWOLE, H. 1991. A survey ofreptiles, amphibians and mammals of the SarahRiver. (Unpubl. report for Greg HockeyEngineering).
WELLS R.W. & WELLINGTON, C.R. 1985. Aclassification of the Amphibia and reptiles ofAustralia. Australian Journal of HerpetologySuppl. series (1): 1-65.