Embed Size (px)
Citation preview
MatlabGraphics
S. Awad, Ph.D.
M. Corless, M.S.E.E.
E.C.E. Department
University of Michigan-Dearborn
Introduction to Matlab:
2D Graphics
2
MATLAB Graphics:U of M-Dearborn ECE DepartmentIntroduction to MATLAB and its Toolboxes
2D Graphics
2D Graphics Topics Creating Two Dimensional Plots Creating Multiple Plots Using a Legend Box Customizing Axes Zoom Command Adding Text Getting Data from a Graph Sub Plotting Other 2D Features and Plot Types 2D EZPlot

3
MATLAB Graphics:U of M-Dearborn ECE DepartmentIntroduction to MATLAB and its Toolboxes
2D Graphics
» theta=[0:pi/128:2*pi]';
» y=sin(theta);
» plot(theta,y,'b.');
» xlabel('Angle in Radians');
» ylabel('Amplitude');
» title('One Period of a Sine Wave');
Two-Dimensional Plots Plot Command for 2D plots Sinewave Example:
Marker: Point
Color: Blue
Writes Title of Graph

4
MATLAB Graphics:U of M-Dearborn ECE DepartmentIntroduction to MATLAB and its Toolboxes
2D Graphics
To Disable Grid
2-D Grids
To Enable Grid
» grid on
» grid off
Grid Toggles
5
MATLAB Graphics:U of M-Dearborn ECE DepartmentIntroduction to MATLAB and its Toolboxes
2D Graphics
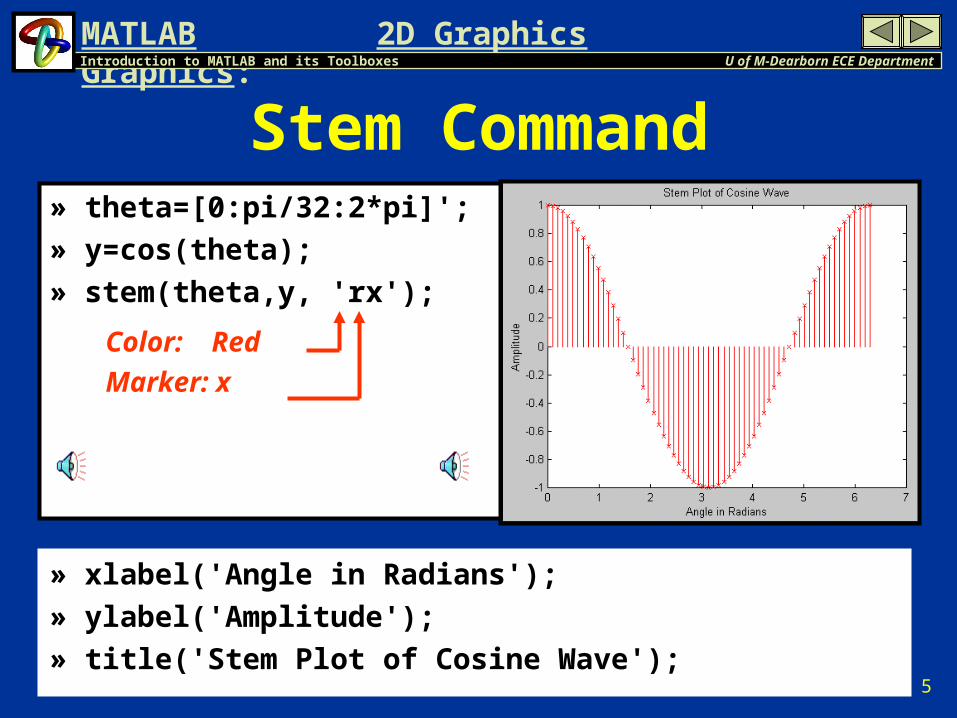
» theta=[0:pi/32:2*pi]';
» y=cos(theta);
» stem(theta,y, 'rx');
» xlabel('Angle in Radians');
» ylabel('Amplitude');
» title('Stem Plot of Cosine Wave');
Color: Red
Marker: x
Stem Command

6
MATLAB Graphics:U of M-Dearborn ECE DepartmentIntroduction to MATLAB and its Toolboxes
2D Graphics
Clearing a Figure In case a figure already exists, the plot command
will clear the current figure window and draws a new plot.
To clear a figure use the clf command
» clf
7
MATLAB Graphics:U of M-Dearborn ECE DepartmentIntroduction to MATLAB and its Toolboxes
2D Graphics
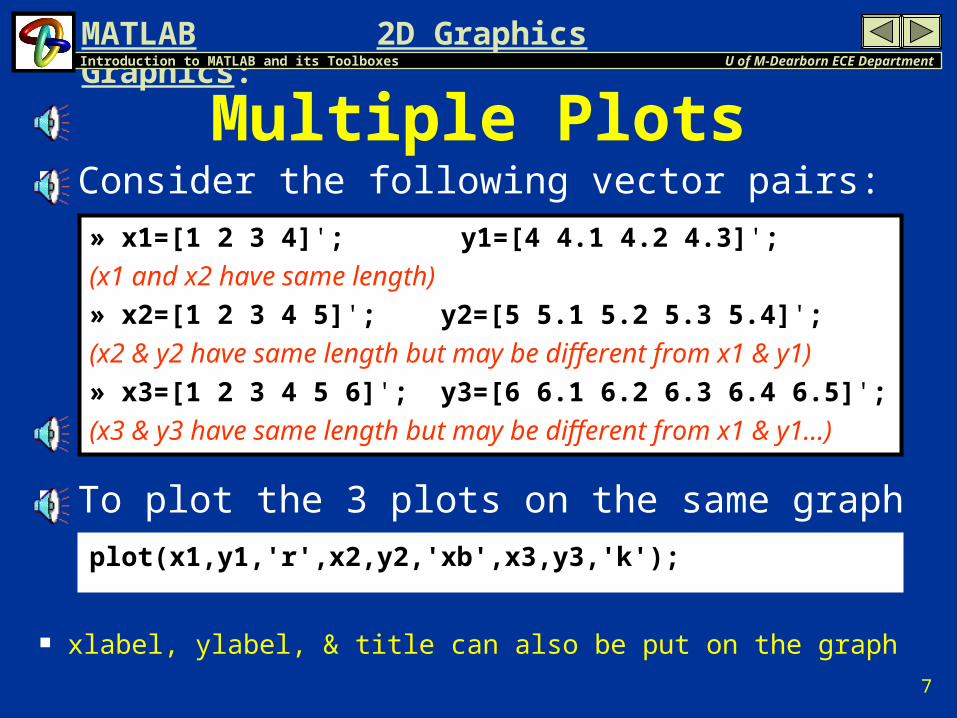
Multiple Plots Consider the following vector pairs:
» x1=[1 2 3 4]'; y1=[4 4.1 4.2 4.3]';
(x1 and x2 have same length)
» x2=[1 2 3 4 5]'; y2=[5 5.1 5.2 5.3 5.4]';
(x2 & y2 have same length but may be different from x1 & y1)
» x3=[1 2 3 4 5 6]'; y3=[6 6.1 6.2 6.3 6.4 6.5]';
(x3 & y3 have same length but may be different from x1 & y1...)
To plot the 3 plots on the same graph
plot(x1,y1,'r',x2,y2,'xb',x3,y3,'k');
xlabel, ylabel, & title can also be put on the graph

8
MATLAB Graphics:U of M-Dearborn ECE DepartmentIntroduction to MATLAB and its Toolboxes
2D Graphics
Figure with Multiple Plotsplot(x1,y1,'r',x2,y2,'xb',x3,y3,'k');
r = color: red
xb = marker: x
color: blue
k = color: black
9
MATLAB Graphics:U of M-Dearborn ECE DepartmentIntroduction to MATLAB and its Toolboxes
2D Graphics
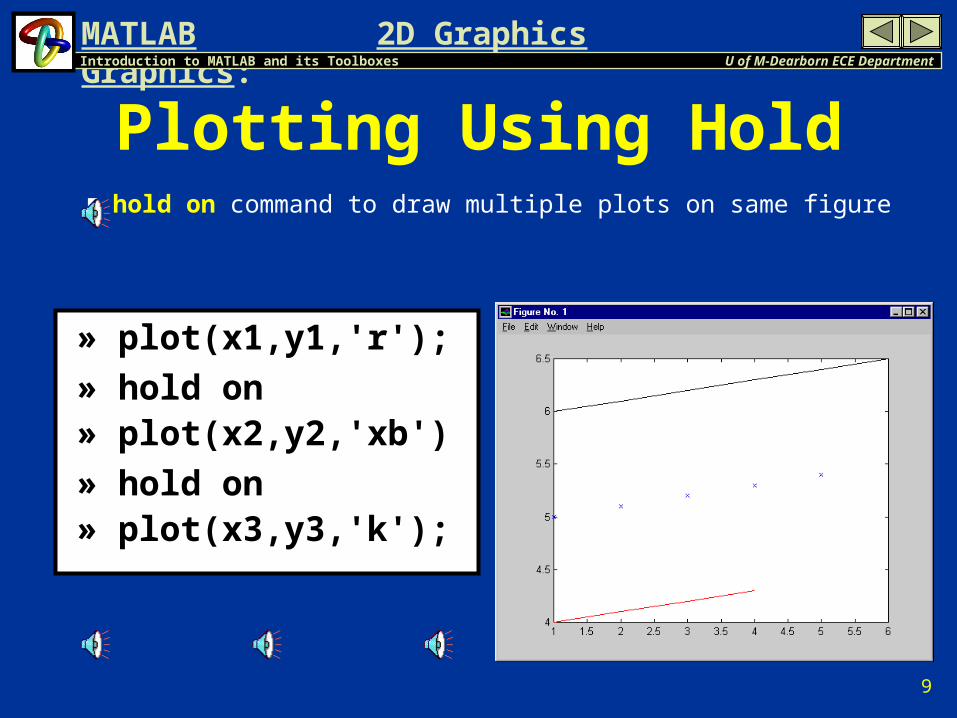
Plotting Using Hold hold on command to draw multiple plots on same figure
» plot(x1,y1,'r'); » hold on» plot(x2,y2,'xb')» hold on» plot(x3,y3,'k');
10
MATLAB Graphics:U of M-Dearborn ECE DepartmentIntroduction to MATLAB and its Toolboxes
2D Graphics
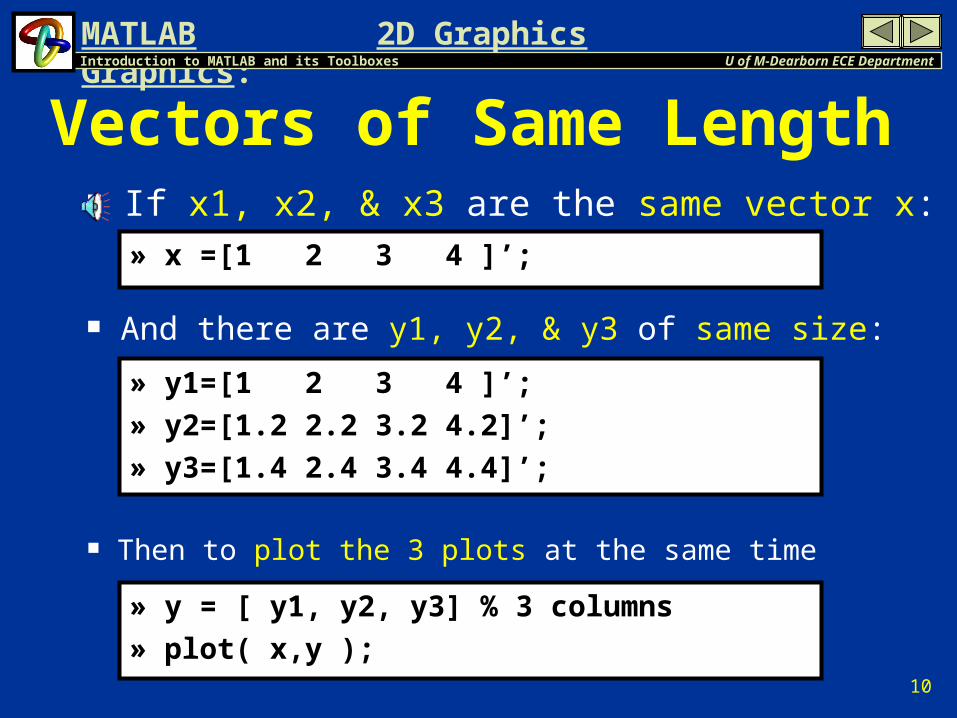
If x1, x2, & x3 are the same vector x:» x =[1 2 3 4 ]’;
And there are y1, y2, & y3 of same size:» y1=[1 2 3 4 ]’;
» y2=[1.2 2.2 3.2 4.2]’;
» y3=[1.4 2.4 3.4 4.4]’;
Then to plot the 3 plots at the same time» y = [ y1, y2, y3] % 3 columns
» plot( x,y );
Vectors of Same Length
11
MATLAB Graphics:U of M-Dearborn ECE DepartmentIntroduction to MATLAB and its Toolboxes
2D Graphics
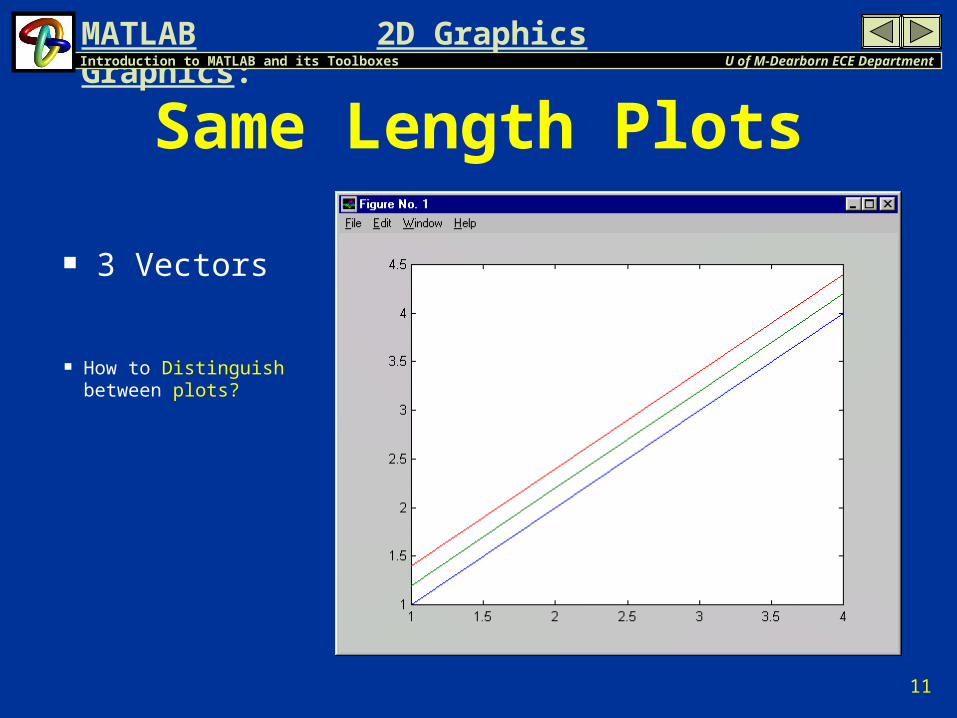
Same Length Plots
3 Vectors
How to Distinguish between plots?

12
MATLAB Graphics:U of M-Dearborn ECE DepartmentIntroduction to MATLAB and its Toolboxes
2D Graphics
Legend Box To create a legend box in the upper right corner
of the plot for the previous example:
» legend('First', 'Second', 'Third' );
To move the legend, click and hold the left mouse button near the edge of the legend and drag it to the required place.
To delete the legend, use
» legend off

13
MATLAB Graphics:U of M-Dearborn ECE DepartmentIntroduction to MATLAB and its Toolboxes
2D Graphics
Placing Legend Box
Click and Drag to place Legend

14
MATLAB Graphics:U of M-Dearborn ECE DepartmentIntroduction to MATLAB and its Toolboxes
2D Graphics
Customizing Axes To set each axis minimums and maximums
» axis([ xmin xmax ymin ymax]);
To return to default settings
» axis('auto') or » axis auto
Set scaling factors for both axes to be equal» axis equal
To keep MATLAB from altering the proportions of the axes if the view is changed
» axis vis3d
15
MATLAB Graphics:U of M-Dearborn ECE DepartmentIntroduction to MATLAB and its Toolboxes
2D Graphics
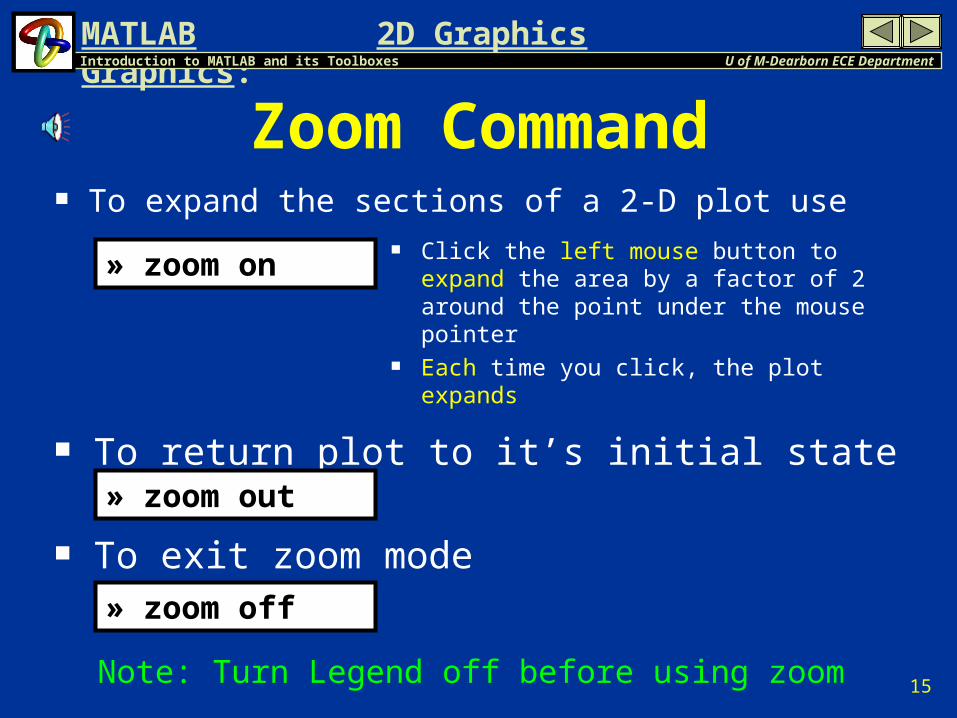
Zoom Command To expand the sections of a 2-D plot use
» zoom on Click the left mouse button to expand
the area by a factor of 2 around the point under the mouse pointer
Each time you click, the plot expands
To return plot to it’s initial state» zoom out
To exit zoom mode» zoom off
Note: Turn Legend off before using zoom
16
MATLAB Graphics:U of M-Dearborn ECE DepartmentIntroduction to MATLAB and its Toolboxes
2D Graphics
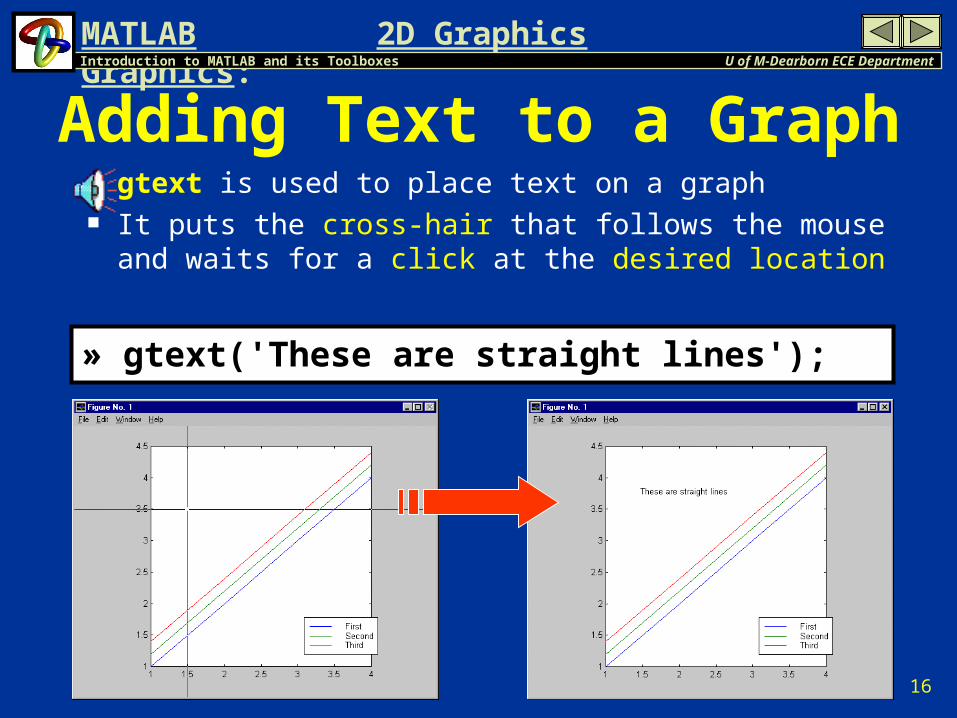
Adding Text to a Graph gtext is used to place text on a graph It puts the cross-hair that follows the mouse and
waits for a click at the desired location
» gtext('These are straight lines');
17
MATLAB Graphics:U of M-Dearborn ECE DepartmentIntroduction to MATLAB and its Toolboxes
2D Graphics
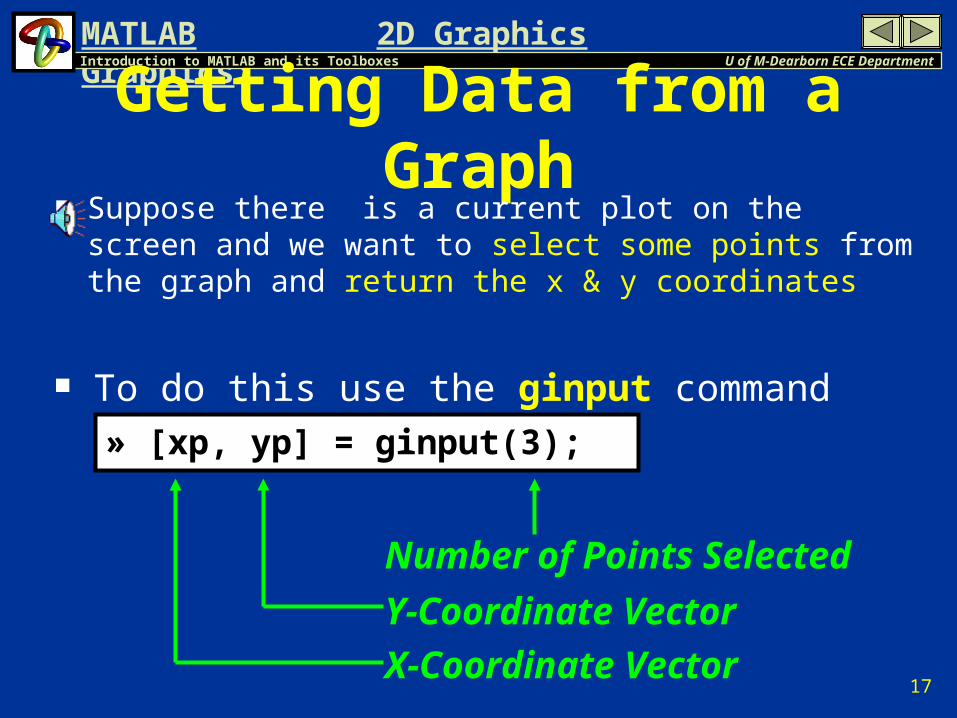
Getting Data from a Graph Suppose there is a current plot on the screen
and we want to select some points from the graph and return the x & y coordinates
To do this use the ginput command
Number of Points Selected
Y-Coordinate Vector
X-Coordinate Vector
» [xp, yp] = ginput(3);

18
MATLAB Graphics:U of M-Dearborn ECE DepartmentIntroduction to MATLAB and its Toolboxes
2D Graphics
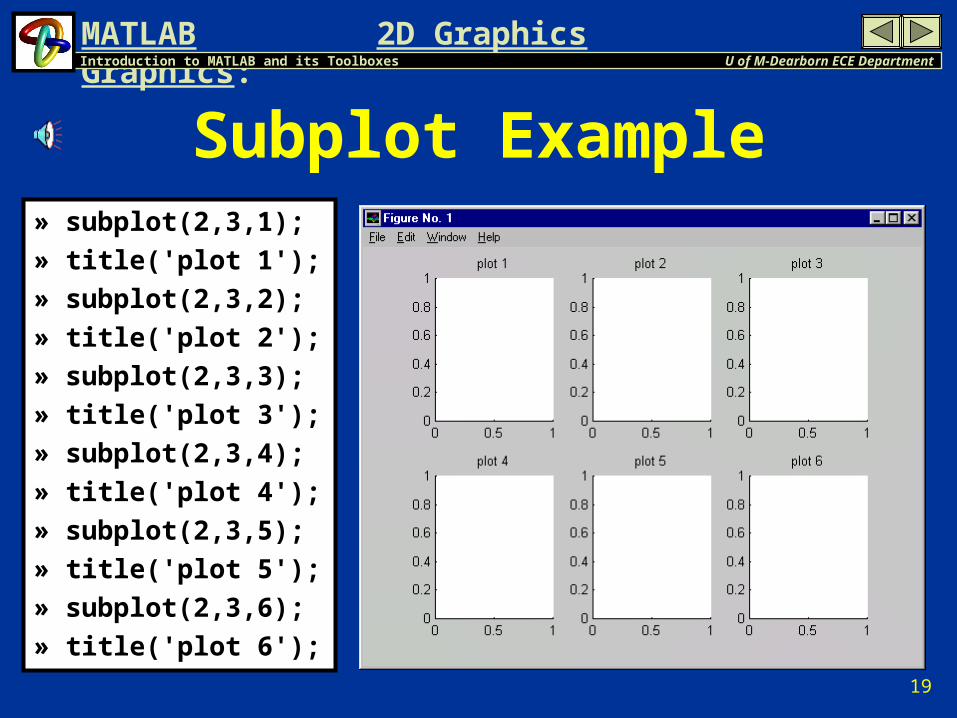
Subplots on Same Figure subplot(m,n,p) breaks the Figure window into an
m-by-n matrix of small axes & selects the p-th axes The p-th axis is numbered left to right along the top row,
second row, etc. Each subplot is a separate graph
When a particular subplot is active, it is the only subplot (or axis) that is responsive to axis, xlabel, etc. The other subplots are not affected.
To return to default mode use:
» subplot(1,1,1)
19
MATLAB Graphics:U of M-Dearborn ECE DepartmentIntroduction to MATLAB and its Toolboxes
2D Graphics
Subplot Example» subplot(2,3,1);
» title('plot 1');
» subplot(2,3,2);
» title('plot 2');
» subplot(2,3,3);
» title('plot 3');
» subplot(2,3,4);
» title('plot 4');
» subplot(2,3,5);
» title('plot 5');
» subplot(2,3,6);
» title('plot 6');
20
MATLAB Graphics:U of M-Dearborn ECE DepartmentIntroduction to MATLAB and its Toolboxes
2D Graphics
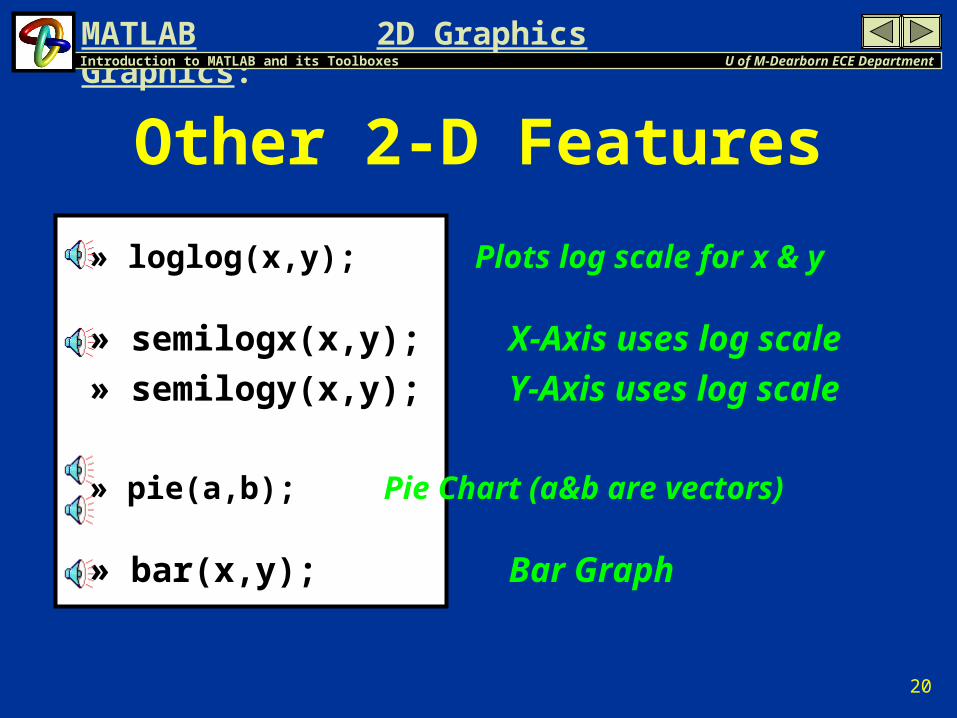
Other 2-D Features
» loglog(x,y); Plots log scale for x & y
» semilogx(x,y); X-Axis uses log scale
» semilogy(x,y); Y-Axis uses log scale
» pie(a,b); Pie Chart (a&b are vectors)
» bar(x,y); Bar Graph
21
MATLAB Graphics:U of M-Dearborn ECE DepartmentIntroduction to MATLAB and its Toolboxes
2D Graphics
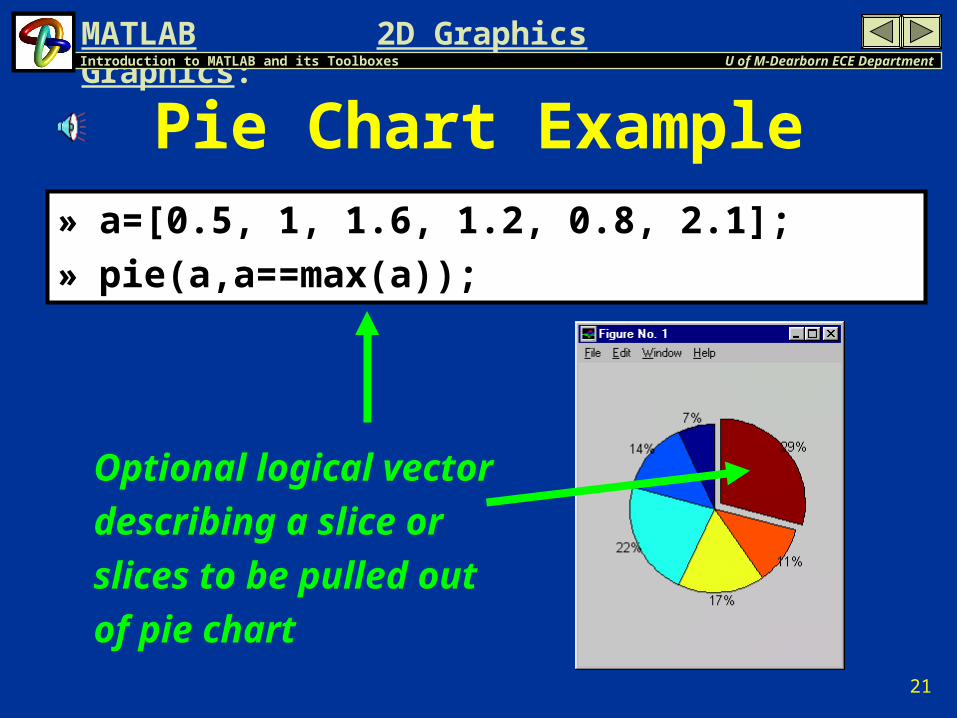
Pie Chart Example» a=[0.5, 1, 1.6, 1.2, 0.8, 2.1];
» pie(a,a==max(a));
Optional logical vector
describing a slice or
slices to be pulled out
of pie chart

22
MATLAB Graphics:U of M-Dearborn ECE DepartmentIntroduction to MATLAB and its Toolboxes
2D Graphics
Bar Graph Example
» x=[-2.9:0.2:2.9];
» y=exp(-x.*x);
» bar(x,y);
23
MATLAB Graphics:U of M-Dearborn ECE DepartmentIntroduction to MATLAB and its Toolboxes
2D Graphics
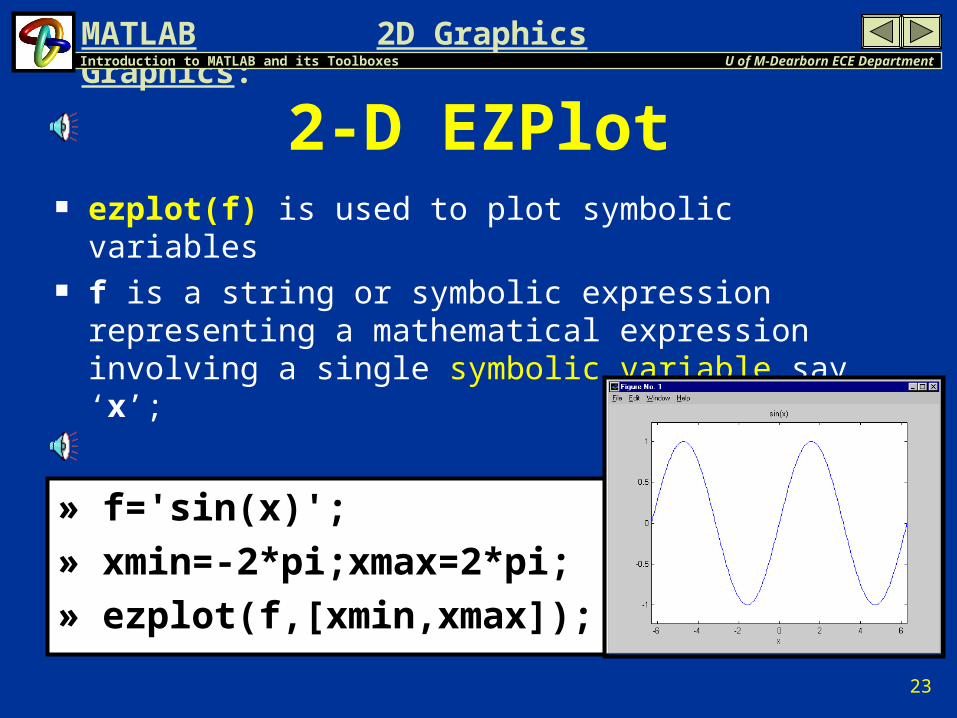
» f='sin(x)';
» xmin=-2*pi;xmax=2*pi;
» ezplot(f,[xmin,xmax]);
2-D EZPlot ezplot(f) is used to plot symbolic variables f is a string or symbolic expression representing
a mathematical expression involving a single symbolic variable say ‘x’;

24
MATLAB Graphics:U of M-Dearborn ECE DepartmentIntroduction to MATLAB and its Toolboxes
2D Graphics
EZPlot Sine Example» f='sin(2*x)*exp(-x)';xmin=0;xmax=2*pi;
» ezplot(f,[xmin,xmax]);

25
MATLAB Graphics:U of M-Dearborn ECE DepartmentIntroduction to MATLAB and its Toolboxes
2D Graphics
EZPlot X2 Example» ezplot('x^2',[0,5]),grid;
26
MATLAB Graphics:U of M-Dearborn ECE DepartmentIntroduction to MATLAB and its Toolboxes
2D Graphics
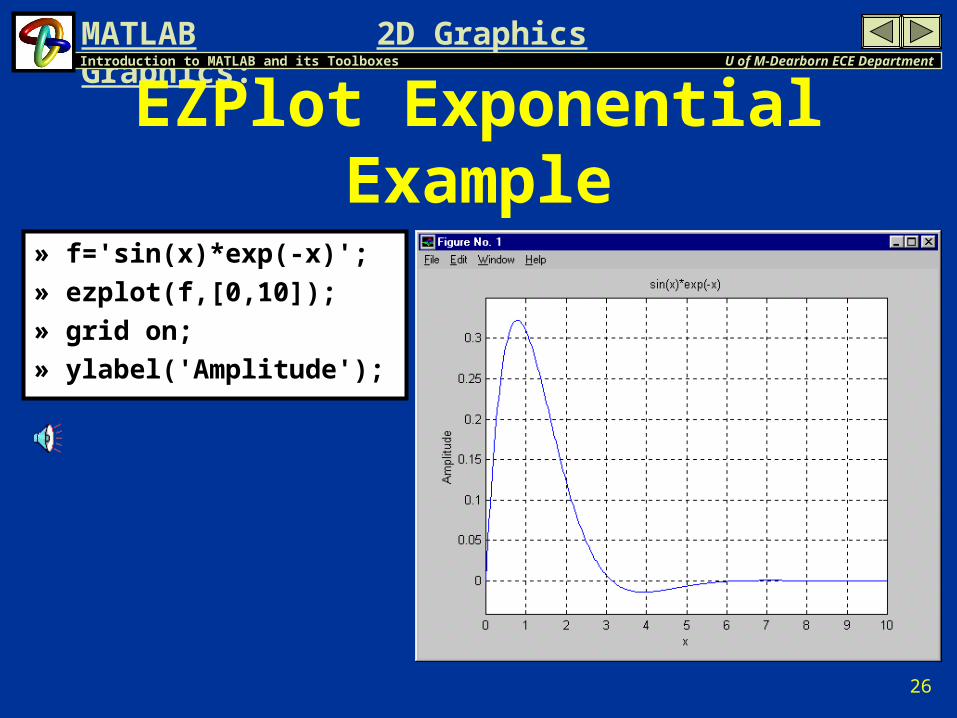
EZPlot Exponential Example
» f='sin(x)*exp(-x)';
» ezplot(f,[0,10]);
» grid on;
» ylabel('Amplitude');