Embed Size (px)
Citation preview
MATLAB®
Graphics Changes in R2014b
R2017b
How to Contact MathWorks
Latest news: www.mathworks.com
Sales and services: www.mathworks.com/sales_and_services
User community: www.mathworks.com/matlabcentral
Technical support: www.mathworks.com/support/contact_us
Phone: 508-647-7000
The MathWorks, Inc.3 Apple Hill DriveNatick, MA 01760-2098
MATLAB® Graphics Changes in R2014b© COPYRIGHT 2014–2017 by The MathWorks, Inc.The software described in this document is furnished under a license agreement. The software may beused or copied only under the terms of the license agreement. No part of this manual may be photocopiedor reproduced in any form without prior written consent from The MathWorks, Inc.FEDERAL ACQUISITION: This provision applies to all acquisitions of the Program and Documentationby, for, or through the federal government of the United States. By accepting delivery of the Program orDocumentation, the government hereby agrees that this software or documentation qualifies ascommercial computer software or commercial computer software documentation as such terms are used ordefined in FAR 12.212, DFARS Part 227.72, and DFARS 252.227-7014. Accordingly, the terms andconditions of this Agreement and only those rights specified in this Agreement, shall pertain to and governthe use, modification, reproduction, release, performance, display, and disclosure of the Program andDocumentation by the federal government (or other entity acquiring for or through the federalgovernment) and shall supersede any conflicting contractual terms or conditions. If this License fails tomeet the government's needs or is inconsistent in any respect with federal procurement law, thegovernment agrees to return the Program and Documentation, unused, to The MathWorks, Inc.Trademarks
MATLAB and Simulink are registered trademarks of The MathWorks, Inc. Seewww.mathworks.com/trademarks for a list of additional trademarks. Other product or brandnames may be trademarks or registered trademarks of their respective holders.Patents
MathWorks products are protected by one or more U.S. patents. Please seewww.mathworks.com/patents for more information.Revision HistoryOctober 2014 Online only New for MATLAB 8.4 (Release 2014b)March 2015 Online only Rereleased for MATLAB 8.5 (Release 2015a)September 2015 Online only Rereleased for MATLAB 8.6 (Release 2015b)March 2016 Online only Rereleased for MATLAB 9.0 (Release 2016a)September 2016 Online only Rereleased for MATLAB 9.1 (Release 2016b)March 2017 Online only Rereleased for MATLAB 9.2 (Release 2017a)September 2017 Online only Rereleased for MATLAB 9.3 (Release 2017b)

Updating Graphics Code1
Major Graphics Changes in R2014b . . . . . . . . . . . . . . . . . . . . . 1-2Graphics Handles Are Object Handles . . . . . . . . . . . . . . . . . . 1-2New Visual Look . . . . . . . . . . . . . . . . . . . . . . . . . . . . . . . . . . . 1-2New Default Graphics Engine . . . . . . . . . . . . . . . . . . . . . . . . . 1-3Compatibility Considerations . . . . . . . . . . . . . . . . . . . . . . . . . 1-3
Graphics Handles Are Now Objects, Not Doubles . . . . . . . . . . 1-5Graphics Handles Are Object Handles . . . . . . . . . . . . . . . . . . 1-5Accessing Properties of Graphics Objects . . . . . . . . . . . . . . . . 1-6Graphics Handle Arrays . . . . . . . . . . . . . . . . . . . . . . . . . . . . . 1-6Testing Validity of Graphics Handles . . . . . . . . . . . . . . . . . . . 1-7Referring to Figures by Integer Handles . . . . . . . . . . . . . . . . . 1-7Deleting Multiple Graphics Objects . . . . . . . . . . . . . . . . . . . . 1-7Logical Expressions with Graphics Handles . . . . . . . . . . . . . . 1-8Converting Cell Arrays of Graphics Handles . . . . . . . . . . . . . . 1-8Testing Equality of Graphics Handles . . . . . . . . . . . . . . . . . . . 1-9Returning Graphics Objects From cellfun and arrayfun
Functions . . . . . . . . . . . . . . . . . . . . . . . . . . . . . . . . . . . . . . 1-9Saving Graphics Objects . . . . . . . . . . . . . . . . . . . . . . . . . . . . 1-10Writing MEX-Files . . . . . . . . . . . . . . . . . . . . . . . . . . . . . . . . 1-10
Writing Code That Works in Multiple Releases . . . . . . . . . . . 1-11Branch on Small Segment of Code . . . . . . . . . . . . . . . . . . . . 1-11Branch on Large Segment of Code . . . . . . . . . . . . . . . . . . . . 1-11
Why Are Plot Lines Different Colors? . . . . . . . . . . . . . . . . . . . 1-13New Color Order . . . . . . . . . . . . . . . . . . . . . . . . . . . . . . . . . . 1-13The hold Command Cycles Through Colors . . . . . . . . . . . . . . 1-13Restart Color Order . . . . . . . . . . . . . . . . . . . . . . . . . . . . . . . 1-15
How Do I Make the Graph Title Smaller? . . . . . . . . . . . . . . . . 1-17
iii
Contents
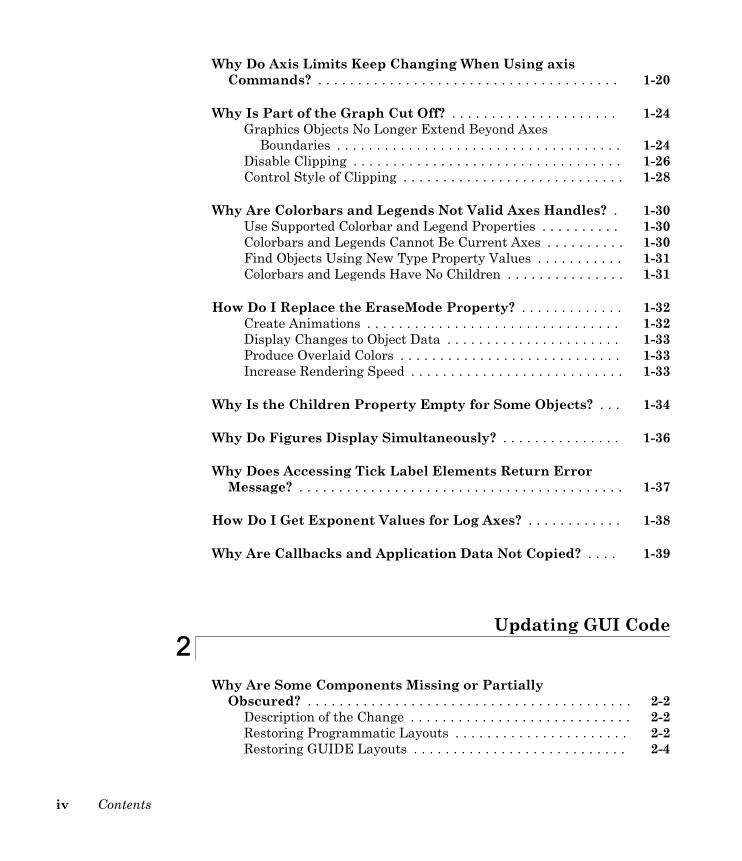
Why Do Axis Limits Keep Changing When Using axisCommands? . . . . . . . . . . . . . . . . . . . . . . . . . . . . . . . . . . . . . . 1-20
Why Is Part of the Graph Cut Off? . . . . . . . . . . . . . . . . . . . . . 1-24Graphics Objects No Longer Extend Beyond Axes
Boundaries . . . . . . . . . . . . . . . . . . . . . . . . . . . . . . . . . . . . 1-24Disable Clipping . . . . . . . . . . . . . . . . . . . . . . . . . . . . . . . . . . 1-26Control Style of Clipping . . . . . . . . . . . . . . . . . . . . . . . . . . . . 1-28
Why Are Colorbars and Legends Not Valid Axes Handles? . 1-30Use Supported Colorbar and Legend Properties . . . . . . . . . . 1-30Colorbars and Legends Cannot Be Current Axes . . . . . . . . . . 1-30Find Objects Using New Type Property Values . . . . . . . . . . . 1-31Colorbars and Legends Have No Children . . . . . . . . . . . . . . . 1-31
How Do I Replace the EraseMode Property? . . . . . . . . . . . . . 1-32Create Animations . . . . . . . . . . . . . . . . . . . . . . . . . . . . . . . . 1-32Display Changes to Object Data . . . . . . . . . . . . . . . . . . . . . . 1-33Produce Overlaid Colors . . . . . . . . . . . . . . . . . . . . . . . . . . . . 1-33Increase Rendering Speed . . . . . . . . . . . . . . . . . . . . . . . . . . . 1-33
Why Is the Children Property Empty for Some Objects? . . . 1-34
Why Do Figures Display Simultaneously? . . . . . . . . . . . . . . . 1-36
Why Does Accessing Tick Label Elements Return ErrorMessage? . . . . . . . . . . . . . . . . . . . . . . . . . . . . . . . . . . . . . . . . . 1-37
How Do I Get Exponent Values for Log Axes? . . . . . . . . . . . . 1-38
Why Are Callbacks and Application Data Not Copied? . . . . 1-39
Updating GUI Code2
Why Are Some Components Missing or PartiallyObscured? . . . . . . . . . . . . . . . . . . . . . . . . . . . . . . . . . . . . . . . . . 2-2
Description of the Change . . . . . . . . . . . . . . . . . . . . . . . . . . . . 2-2Restoring Programmatic Layouts . . . . . . . . . . . . . . . . . . . . . . 2-2Restoring GUIDE Layouts . . . . . . . . . . . . . . . . . . . . . . . . . . . 2-4
iv Contents
Why Has the Behavior of ResizeFcn Changed? . . . . . . . . . . . . 2-7ResizeFcn Returns Error After Program Launches . . . . . . . . . 2-7ResizeFcn Inactive for Invisible Components . . . . . . . . . . . . . 2-8Unexpected Behavior When Outer Bounds or Drawable Area
Changes . . . . . . . . . . . . . . . . . . . . . . . . . . . . . . . . . . . . . . . 2-9
Why Does handle.listener Return an Error? . . . . . . . . . . . . . 2-10
v

Updating Graphics Code
• “Major Graphics Changes in R2014b” on page 1-2• “Graphics Handles Are Now Objects, Not Doubles” on page 1-5• “Writing Code That Works in Multiple Releases” on page 1-11• “Why Are Plot Lines Different Colors?” on page 1-13• “How Do I Make the Graph Title Smaller?” on page 1-17• “Why Do Axis Limits Keep Changing When Using axis Commands?” on page 1-20• “Why Is Part of the Graph Cut Off?” on page 1-24• “Why Are Colorbars and Legends Not Valid Axes Handles?” on page 1-30• “How Do I Replace the EraseMode Property?” on page 1-32• “Why Is the Children Property Empty for Some Objects?” on page 1-34• “Why Do Figures Display Simultaneously?” on page 1-36• “Why Does Accessing Tick Label Elements Return Error Message?” on page 1-37• “How Do I Get Exponent Values for Log Axes?” on page 1-38• “Why Are Callbacks and Application Data Not Copied?” on page 1-39
1
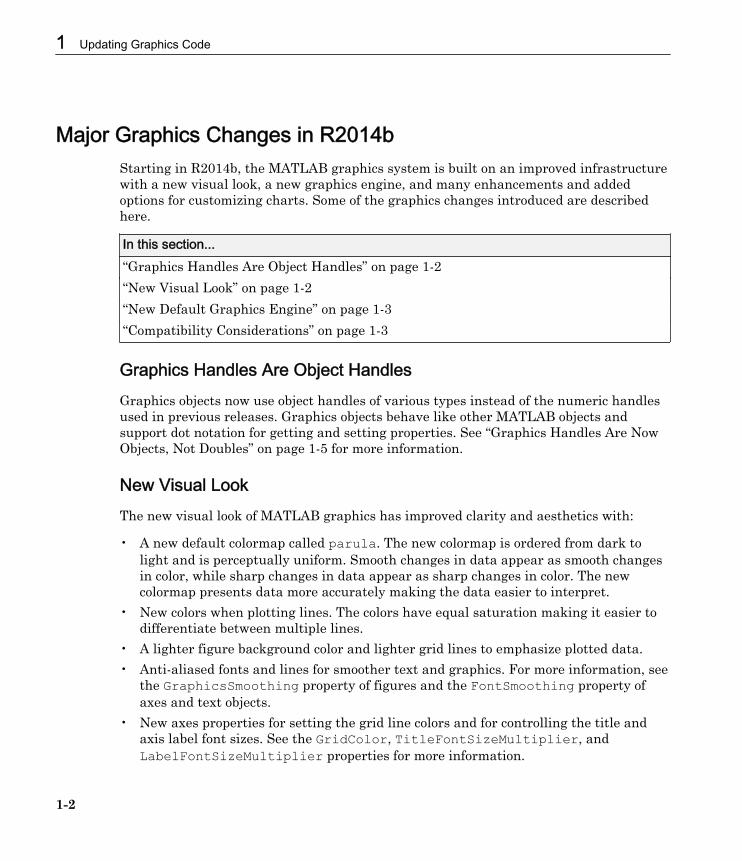
Major Graphics Changes in R2014bStarting in R2014b, the MATLAB graphics system is built on an improved infrastructurewith a new visual look, a new graphics engine, and many enhancements and addedoptions for customizing charts. Some of the graphics changes introduced are describedhere.
In this section...“Graphics Handles Are Object Handles” on page 1-2“New Visual Look” on page 1-2“New Default Graphics Engine” on page 1-3“Compatibility Considerations” on page 1-3
Graphics Handles Are Object HandlesGraphics objects now use object handles of various types instead of the numeric handlesused in previous releases. Graphics objects behave like other MATLAB objects andsupport dot notation for getting and setting properties. See “Graphics Handles Are NowObjects, Not Doubles” on page 1-5 for more information.
New Visual LookThe new visual look of MATLAB graphics has improved clarity and aesthetics with:
• A new default colormap called parula. The new colormap is ordered from dark tolight and is perceptually uniform. Smooth changes in data appear as smooth changesin color, while sharp changes in data appear as sharp changes in color. The newcolormap presents data more accurately making the data easier to interpret.
• New colors when plotting lines. The colors have equal saturation making it easier todifferentiate between multiple lines.
• A lighter figure background color and lighter grid lines to emphasize plotted data.• Anti-aliased fonts and lines for smoother text and graphics. For more information, see
the GraphicsSmoothing property of figures and the FontSmoothing property ofaxes and text objects.
• New axes properties for setting the grid line colors and for controlling the title andaxis label font sizes. See the GridColor, TitleFontSizeMultiplier, andLabelFontSizeMultiplier properties for more information.
1 Updating Graphics Code
1-2
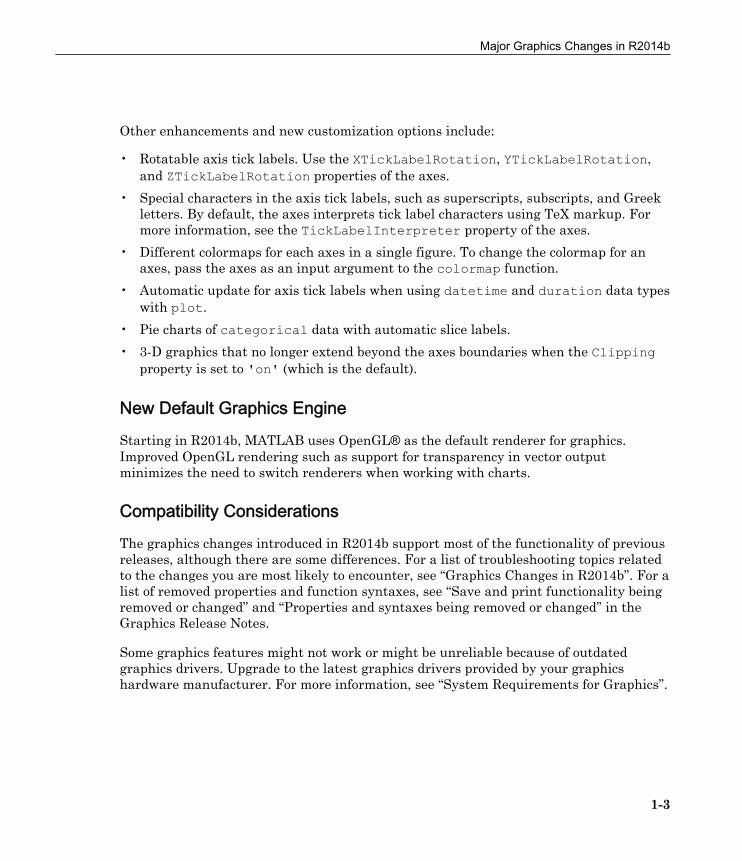
Other enhancements and new customization options include:
• Rotatable axis tick labels. Use the XTickLabelRotation, YTickLabelRotation,and ZTickLabelRotation properties of the axes.
• Special characters in the axis tick labels, such as superscripts, subscripts, and Greekletters. By default, the axes interprets tick label characters using TeX markup. Formore information, see the TickLabelInterpreter property of the axes.
• Different colormaps for each axes in a single figure. To change the colormap for anaxes, pass the axes as an input argument to the colormap function.
• Automatic update for axis tick labels when using datetime and duration data typeswith plot.
• Pie charts of categorical data with automatic slice labels.• 3-D graphics that no longer extend beyond the axes boundaries when the Clipping
property is set to 'on' (which is the default).
New Default Graphics Engine
Starting in R2014b, MATLAB uses OpenGL® as the default renderer for graphics.Improved OpenGL rendering such as support for transparency in vector outputminimizes the need to switch renderers when working with charts.
Compatibility Considerations
The graphics changes introduced in R2014b support most of the functionality of previousreleases, although there are some differences. For a list of troubleshooting topics relatedto the changes you are most likely to encounter, see “Graphics Changes in R2014b”. For alist of removed properties and function syntaxes, see “Save and print functionality beingremoved or changed” and “Properties and syntaxes being removed or changed” in theGraphics Release Notes.
Some graphics features might not work or might be unreliable because of outdatedgraphics drivers. Upgrade to the latest graphics drivers provided by your graphicshardware manufacturer. For more information, see “System Requirements for Graphics”.
Major Graphics Changes in R2014b
1-3
See Also
More About• “Why Are Plot Lines Different Colors?” on page 1-13
1 Updating Graphics Code
1-4
Graphics Handles Are Now Objects, Not Doubles
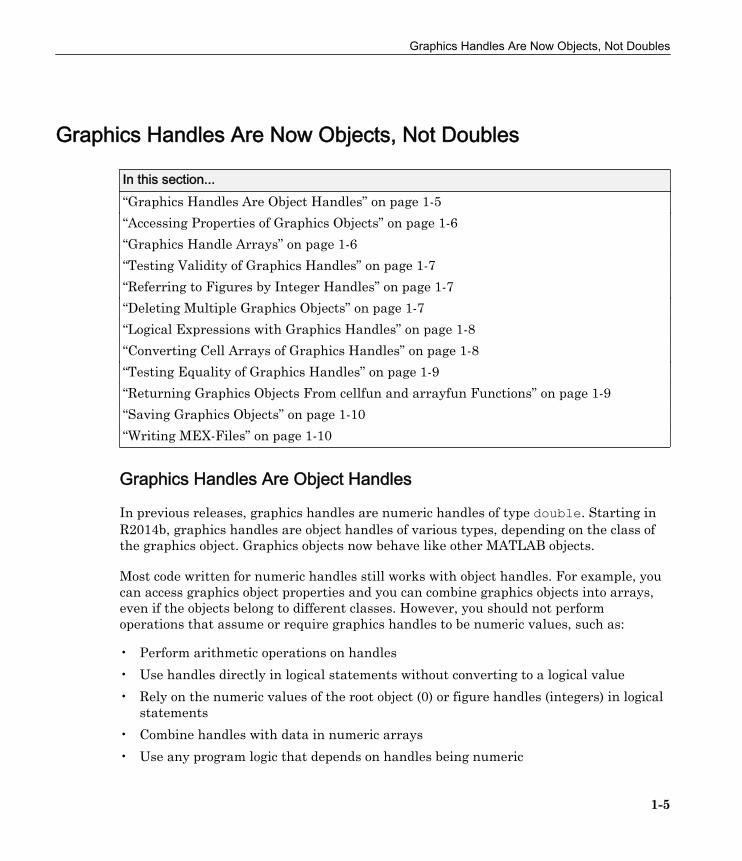
In this section...“Graphics Handles Are Object Handles” on page 1-5“Accessing Properties of Graphics Objects” on page 1-6“Graphics Handle Arrays” on page 1-6“Testing Validity of Graphics Handles” on page 1-7“Referring to Figures by Integer Handles” on page 1-7“Deleting Multiple Graphics Objects” on page 1-7“Logical Expressions with Graphics Handles” on page 1-8“Converting Cell Arrays of Graphics Handles” on page 1-8“Testing Equality of Graphics Handles” on page 1-9“Returning Graphics Objects From cellfun and arrayfun Functions” on page 1-9“Saving Graphics Objects” on page 1-10“Writing MEX-Files” on page 1-10
Graphics Handles Are Object Handles
In previous releases, graphics handles are numeric handles of type double. Starting inR2014b, graphics handles are object handles of various types, depending on the class ofthe graphics object. Graphics objects now behave like other MATLAB objects.
Most code written for numeric handles still works with object handles. For example, youcan access graphics object properties and you can combine graphics objects into arrays,even if the objects belong to different classes. However, you should not performoperations that assume or require graphics handles to be numeric values, such as:
• Perform arithmetic operations on handles• Use handles directly in logical statements without converting to a logical value• Rely on the numeric values of the root object (0) or figure handles (integers) in logical
statements• Combine handles with data in numeric arrays• Use any program logic that depends on handles being numeric
Graphics Handles Are Now Objects, Not Doubles
1-5
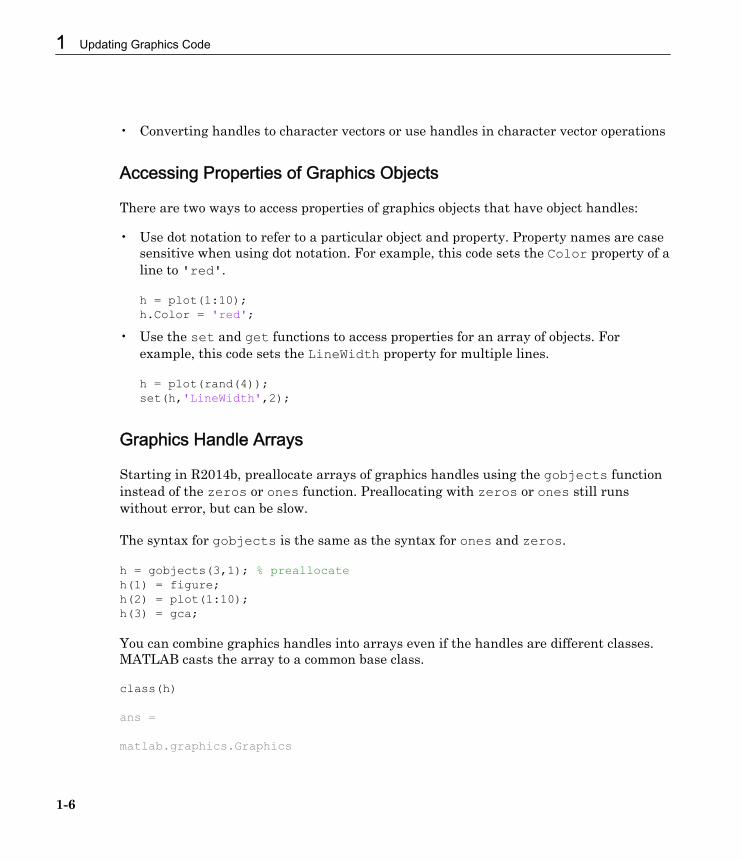
• Converting handles to character vectors or use handles in character vector operations
Accessing Properties of Graphics Objects
There are two ways to access properties of graphics objects that have object handles:
• Use dot notation to refer to a particular object and property. Property names are casesensitive when using dot notation. For example, this code sets the Color property of aline to 'red'.
h = plot(1:10);h.Color = 'red';
• Use the set and get functions to access properties for an array of objects. Forexample, this code sets the LineWidth property for multiple lines.
h = plot(rand(4));set(h,'LineWidth',2);
Graphics Handle Arrays
Starting in R2014b, preallocate arrays of graphics handles using the gobjects functioninstead of the zeros or ones function. Preallocating with zeros or ones still runswithout error, but can be slow.
The syntax for gobjects is the same as the syntax for ones and zeros.
h = gobjects(3,1); % preallocateh(1) = figure;h(2) = plot(1:10);h(3) = gca;
You can combine graphics handles into arrays even if the handles are different classes.MATLAB casts the array to a common base class.
class(h)
ans =
matlab.graphics.Graphics
1 Updating Graphics Code
1-6
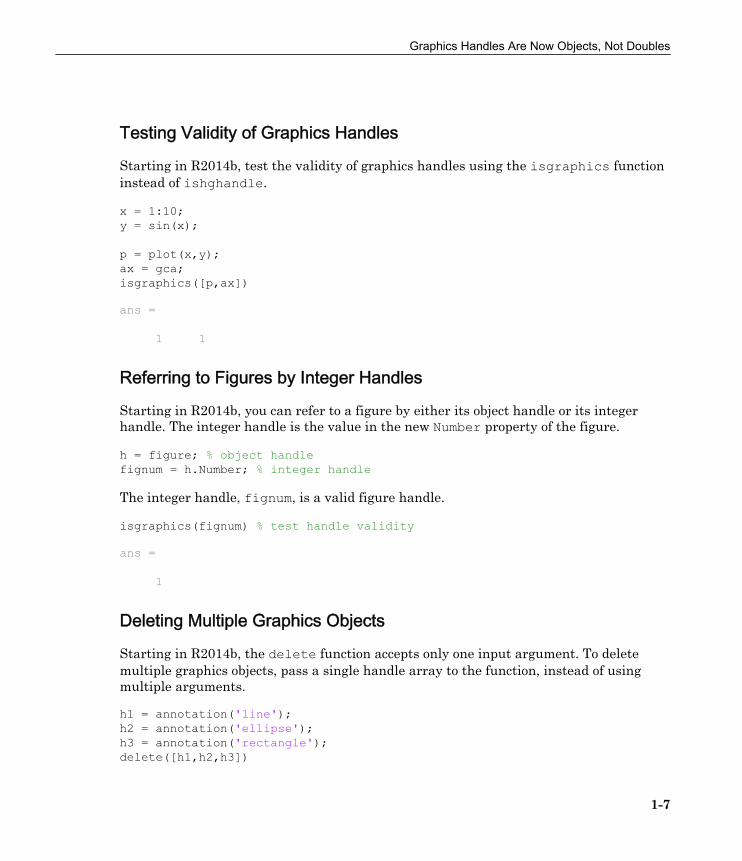
Testing Validity of Graphics Handles
Starting in R2014b, test the validity of graphics handles using the isgraphics functioninstead of ishghandle.
x = 1:10;y = sin(x);
p = plot(x,y);ax = gca;isgraphics([p,ax])
ans =
1 1
Referring to Figures by Integer Handles
Starting in R2014b, you can refer to a figure by either its object handle or its integerhandle. The integer handle is the value in the new Number property of the figure.
h = figure; % object handlefignum = h.Number; % integer handle
The integer handle, fignum, is a valid figure handle.
isgraphics(fignum) % test handle validity
ans =
1
Deleting Multiple Graphics Objects
Starting in R2014b, the delete function accepts only one input argument. To deletemultiple graphics objects, pass a single handle array to the function, instead of usingmultiple arguments.
h1 = annotation('line');h2 = annotation('ellipse');h3 = annotation('rectangle');delete([h1,h2,h3])
Graphics Handles Are Now Objects, Not Doubles
1-7
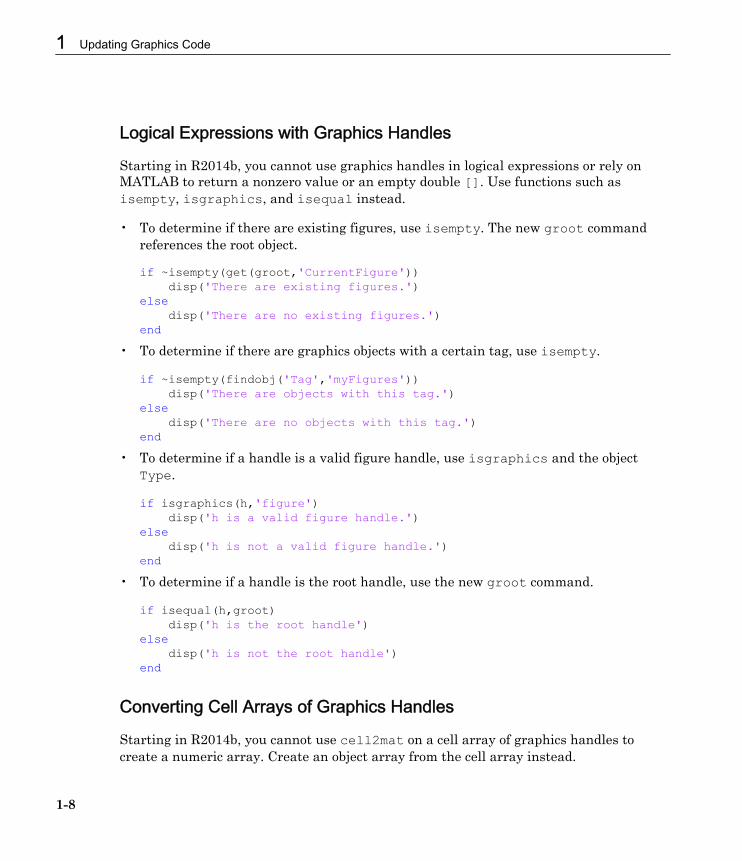
Logical Expressions with Graphics Handles
Starting in R2014b, you cannot use graphics handles in logical expressions or rely onMATLAB to return a nonzero value or an empty double []. Use functions such asisempty, isgraphics, and isequal instead.
• To determine if there are existing figures, use isempty. The new groot commandreferences the root object.
if ~isempty(get(groot,'CurrentFigure')) disp('There are existing figures.')else disp('There are no existing figures.')end
• To determine if there are graphics objects with a certain tag, use isempty.
if ~isempty(findobj('Tag','myFigures')) disp('There are objects with this tag.')else disp('There are no objects with this tag.')end
• To determine if a handle is a valid figure handle, use isgraphics and the objectType.
if isgraphics(h,'figure') disp('h is a valid figure handle.')else disp('h is not a valid figure handle.')end
• To determine if a handle is the root handle, use the new groot command.
if isequal(h,groot) disp('h is the root handle')else disp('h is not the root handle')end
Converting Cell Arrays of Graphics Handles
Starting in R2014b, you cannot use cell2mat on a cell array of graphics handles tocreate a numeric array. Create an object array from the cell array instead.
1 Updating Graphics Code
1-8
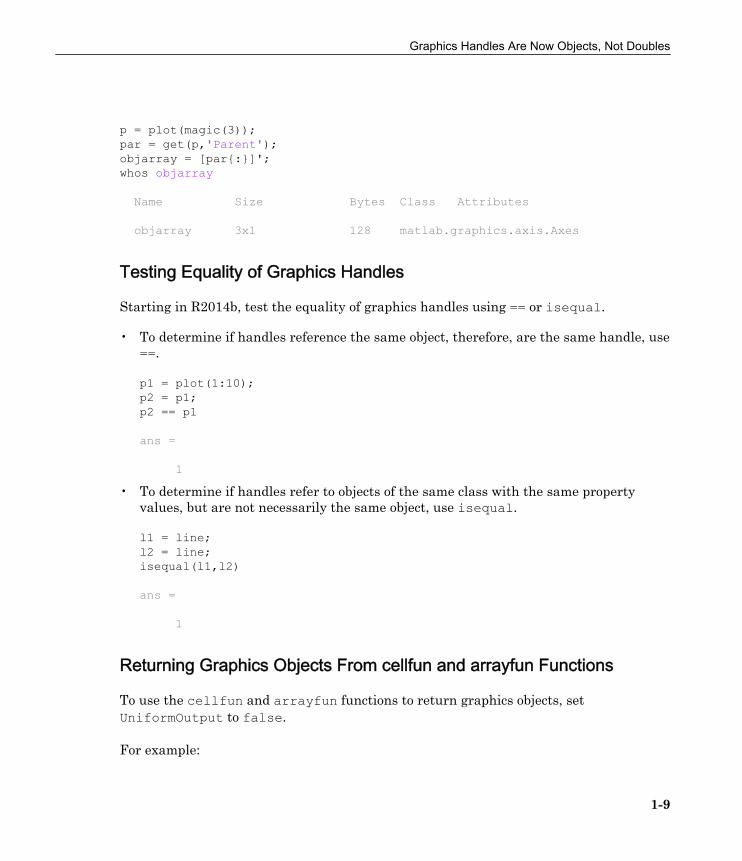
p = plot(magic(3));par = get(p,'Parent');objarray = [par{:}]';whos objarray
Name Size Bytes Class Attributes
objarray 3x1 128 matlab.graphics.axis.Axes
Testing Equality of Graphics Handles
Starting in R2014b, test the equality of graphics handles using == or isequal.
• To determine if handles reference the same object, therefore, are the same handle, use==.
p1 = plot(1:10);p2 = p1;p2 == p1
ans =
1• To determine if handles refer to objects of the same class with the same property
values, but are not necessarily the same object, use isequal.
l1 = line;l2 = line;isequal(l1,l2)
ans =
1
Returning Graphics Objects From cellfun and arrayfun Functions
To use the cellfun and arrayfun functions to return graphics objects, setUniformOutput to false.
For example:
Graphics Handles Are Now Objects, Not Doubles
1-9
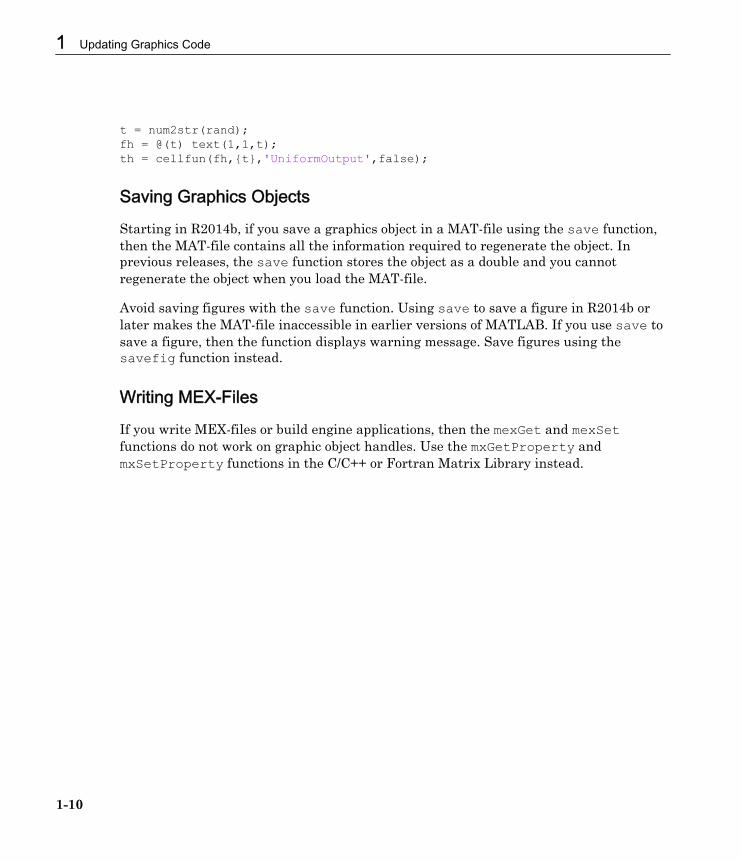
t = num2str(rand);fh = @(t) text(1,1,t);th = cellfun(fh,{t},'UniformOutput',false);
Saving Graphics Objects
Starting in R2014b, if you save a graphics object in a MAT-file using the save function,then the MAT-file contains all the information required to regenerate the object. Inprevious releases, the save function stores the object as a double and you cannotregenerate the object when you load the MAT-file.
Avoid saving figures with the save function. Using save to save a figure in R2014b orlater makes the MAT-file inaccessible in earlier versions of MATLAB. If you use save tosave a figure, then the function displays warning message. Save figures using thesavefig function instead.
Writing MEX-Files
If you write MEX-files or build engine applications, then the mexGet and mexSetfunctions do not work on graphic object handles. Use the mxGetProperty andmxSetProperty functions in the C/C++ or Fortran Matrix Library instead.
1 Updating Graphics Code
1-10
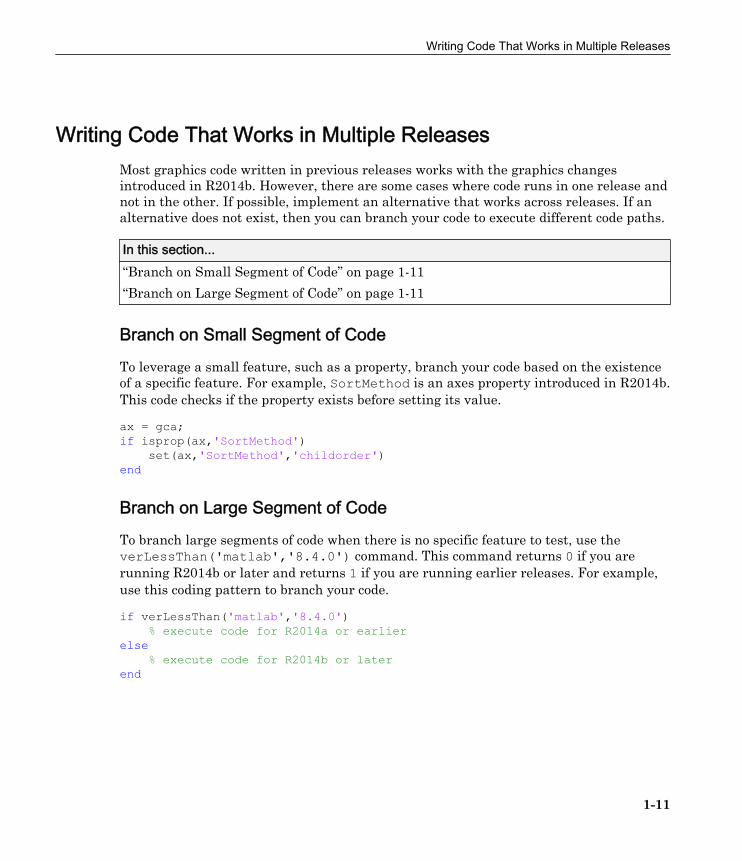
Writing Code That Works in Multiple ReleasesMost graphics code written in previous releases works with the graphics changesintroduced in R2014b. However, there are some cases where code runs in one release andnot in the other. If possible, implement an alternative that works across releases. If analternative does not exist, then you can branch your code to execute different code paths.
In this section...“Branch on Small Segment of Code” on page 1-11“Branch on Large Segment of Code” on page 1-11
Branch on Small Segment of Code
To leverage a small feature, such as a property, branch your code based on the existenceof a specific feature. For example, SortMethod is an axes property introduced in R2014b.This code checks if the property exists before setting its value.
ax = gca;if isprop(ax,'SortMethod') set(ax,'SortMethod','childorder')end
Branch on Large Segment of Code
To branch large segments of code when there is no specific feature to test, use theverLessThan('matlab','8.4.0') command. This command returns 0 if you arerunning R2014b or later and returns 1 if you are running earlier releases. For example,use this coding pattern to branch your code.
if verLessThan('matlab','8.4.0') % execute code for R2014a or earlierelse % execute code for R2014b or laterend
Writing Code That Works in Multiple Releases
1-11
See Alsoclass | iscell | ischar | ishghandle | ismethod | isprop | verLessThan |whos
1 Updating Graphics Code
1-12
Why Are Plot Lines Different Colors?In this section...“New Color Order” on page 1-13“The hold Command Cycles Through Colors” on page 1-13“Restart Color Order” on page 1-15
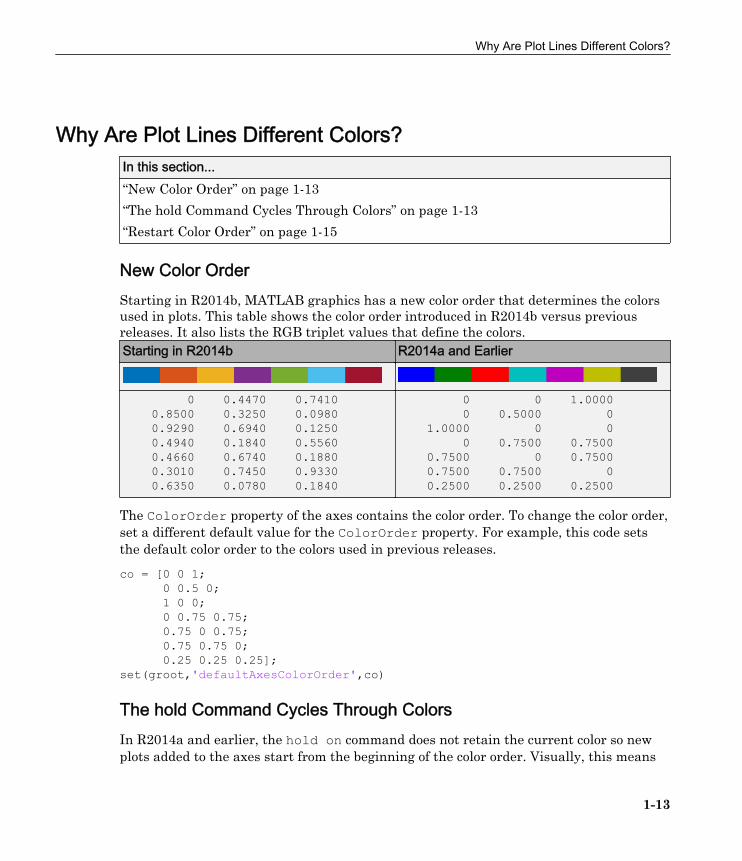
New Color OrderStarting in R2014b, MATLAB graphics has a new color order that determines the colorsused in plots. This table shows the color order introduced in R2014b versus previousreleases. It also lists the RGB triplet values that define the colors.Starting in R2014b R2014a and Earlier
0 0.4470 0.7410 0.8500 0.3250 0.0980 0.9290 0.6940 0.1250 0.4940 0.1840 0.5560 0.4660 0.6740 0.1880 0.3010 0.7450 0.9330 0.6350 0.0780 0.1840
0 0 1.0000 0 0.5000 0 1.0000 0 0 0 0.7500 0.7500 0.7500 0 0.7500 0.7500 0.7500 0 0.2500 0.2500 0.2500
The ColorOrder property of the axes contains the color order. To change the color order,set a different default value for the ColorOrder property. For example, this code setsthe default color order to the colors used in previous releases.co = [0 0 1; 0 0.5 0; 1 0 0; 0 0.75 0.75; 0.75 0 0.75; 0.75 0.75 0; 0.25 0.25 0.25];set(groot,'defaultAxesColorOrder',co)
The hold Command Cycles Through ColorsIn R2014a and earlier, the hold on command does not retain the current color so newplots added to the axes start from the beginning of the color order. Visually, this means
Why Are Plot Lines Different Colors?
1-13
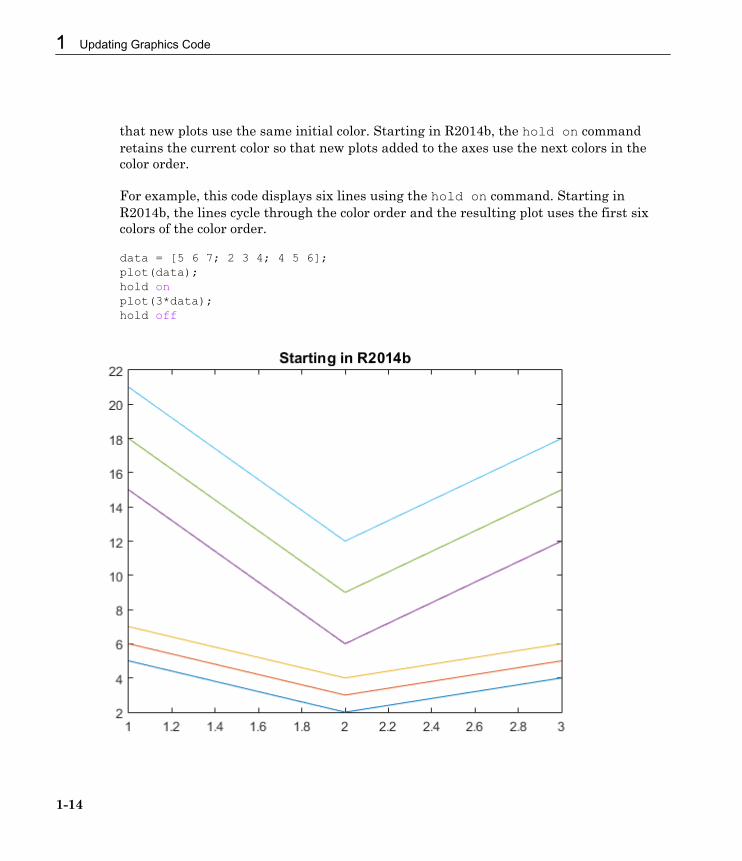
that new plots use the same initial color. Starting in R2014b, the hold on commandretains the current color so that new plots added to the axes use the next colors in thecolor order.
For example, this code displays six lines using the hold on command. Starting inR2014b, the lines cycle through the color order and the resulting plot uses the first sixcolors of the color order.
data = [5 6 7; 2 3 4; 4 5 6];plot(data);hold onplot(3*data);hold off
1 Updating Graphics Code
1-14
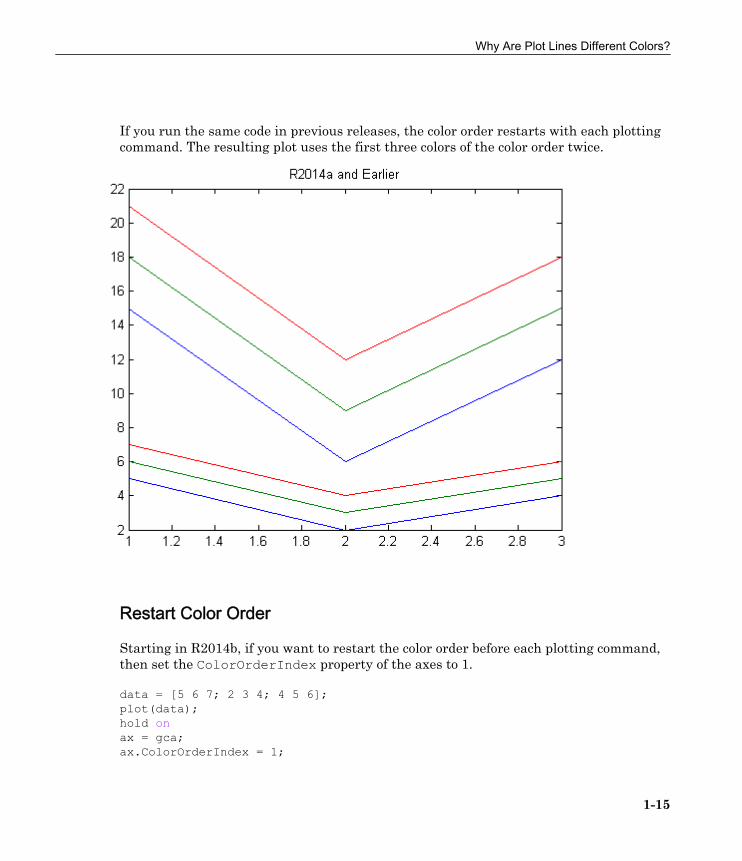
If you run the same code in previous releases, the color order restarts with each plottingcommand. The resulting plot uses the first three colors of the color order twice.
Restart Color Order
Starting in R2014b, if you want to restart the color order before each plotting command,then set the ColorOrderIndex property of the axes to 1.
data = [5 6 7; 2 3 4; 4 5 6];plot(data);hold onax = gca;ax.ColorOrderIndex = 1;
Why Are Plot Lines Different Colors?
1-15
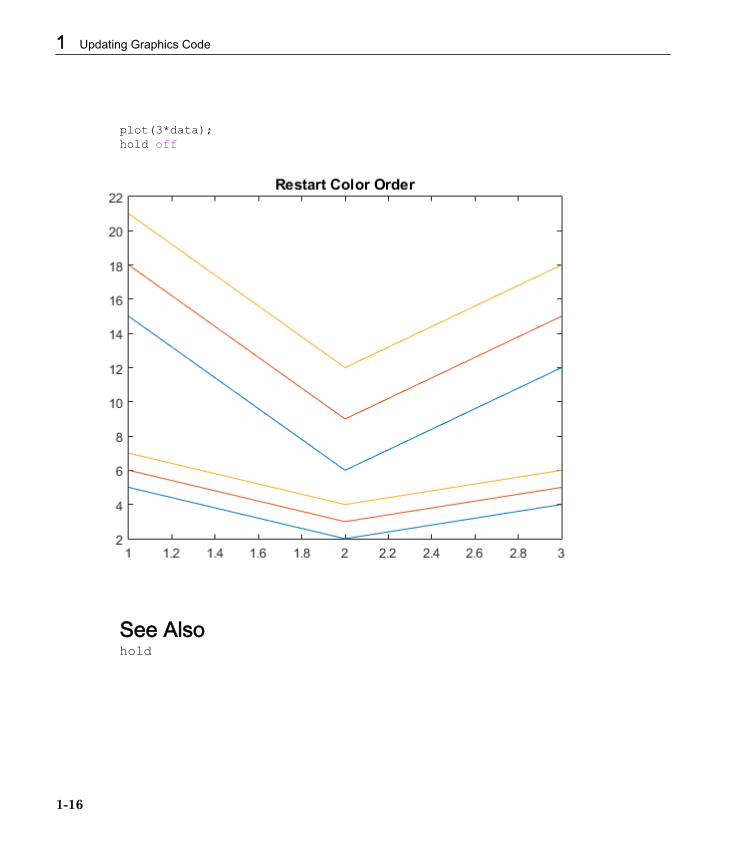
plot(3*data);hold off
See Alsohold
1 Updating Graphics Code
1-16
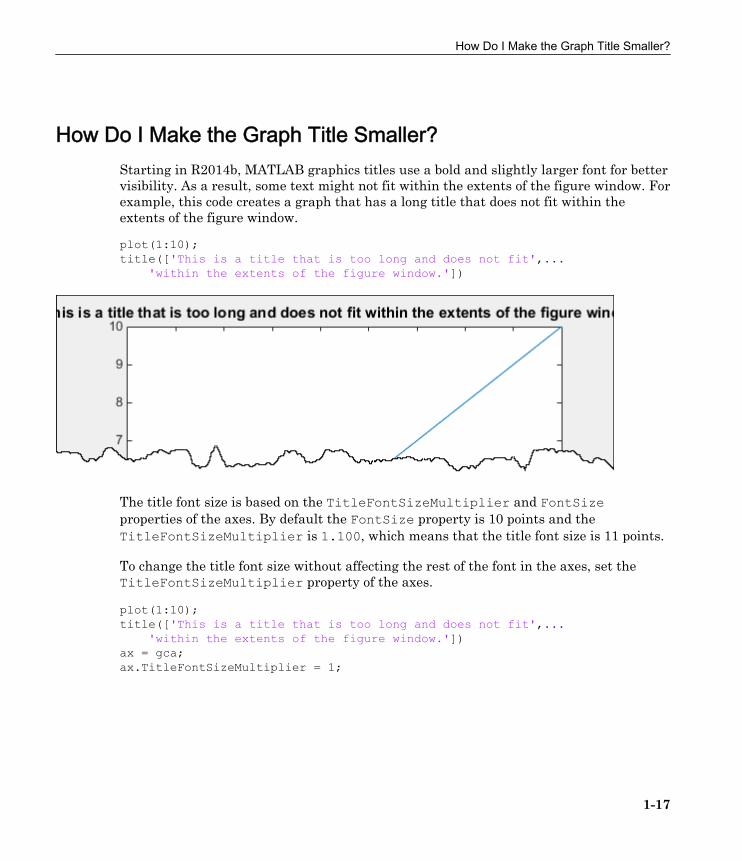
How Do I Make the Graph Title Smaller?Starting in R2014b, MATLAB graphics titles use a bold and slightly larger font for bettervisibility. As a result, some text might not fit within the extents of the figure window. Forexample, this code creates a graph that has a long title that does not fit within theextents of the figure window.
plot(1:10);title(['This is a title that is too long and does not fit',... 'within the extents of the figure window.'])
The title font size is based on the TitleFontSizeMultiplier and FontSizeproperties of the axes. By default the FontSize property is 10 points and theTitleFontSizeMultiplier is 1.100, which means that the title font size is 11 points.
To change the title font size without affecting the rest of the font in the axes, set theTitleFontSizeMultiplier property of the axes.
plot(1:10);title(['This is a title that is too long and does not fit',... 'within the extents of the figure window.'])ax = gca;ax.TitleFontSizeMultiplier = 1;
How Do I Make the Graph Title Smaller?
1-17
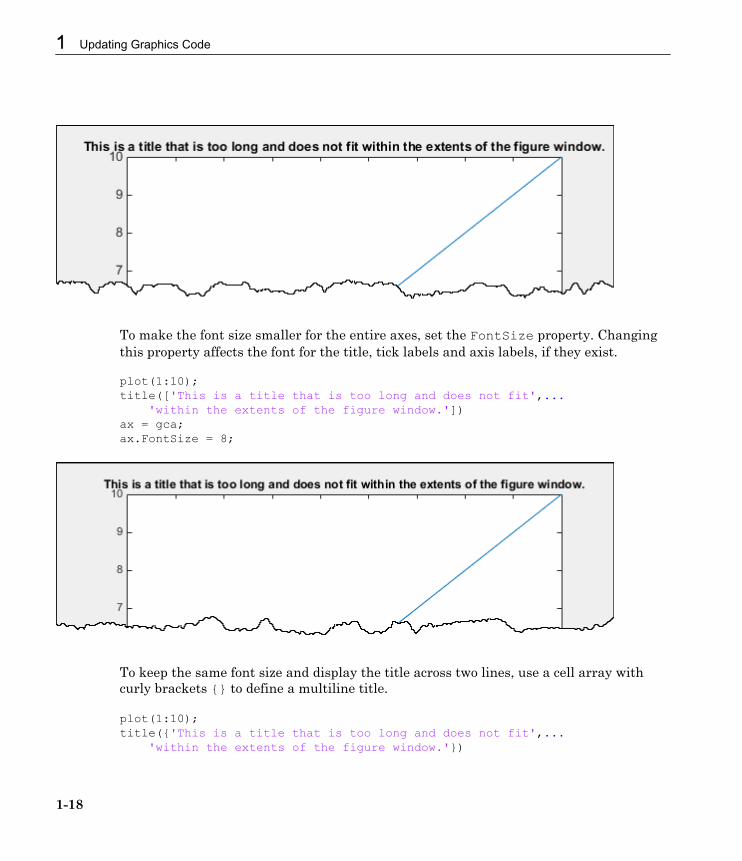
To make the font size smaller for the entire axes, set the FontSize property. Changingthis property affects the font for the title, tick labels and axis labels, if they exist.
plot(1:10);title(['This is a title that is too long and does not fit',... 'within the extents of the figure window.'])ax = gca;ax.FontSize = 8;
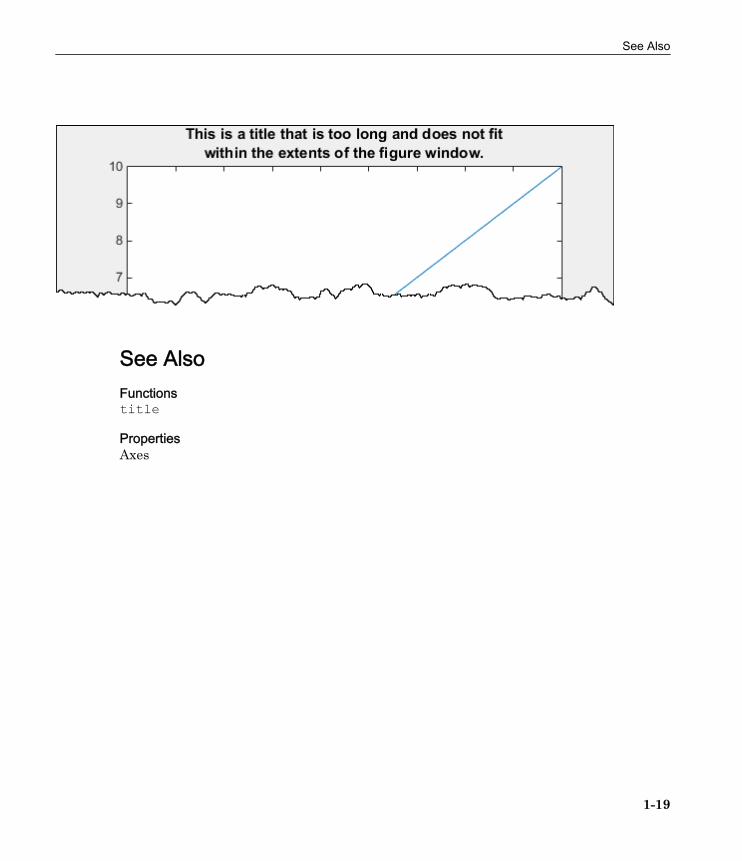
To keep the same font size and display the title across two lines, use a cell array withcurly brackets {} to define a multiline title.
plot(1:10);title({'This is a title that is too long and does not fit',... 'within the extents of the figure window.'})
1 Updating Graphics Code
1-18
See AlsoFunctionstitle
PropertiesAxes
See Also
1-19
Why Do Axis Limits Keep Changing When Using axisCommands?
In R2014a and earlier, if you set the axis limits using an axis tight or an axis imagecommand, then the calculated axis limits do not change. If you add new data to the axesoutside of the current axis limits, then the limits do not automatically update toencompass the data.
Starting in R2014b, if you use these commands and afterwards add new data to the axes,then the axis limits automatically update to encompass the new data.
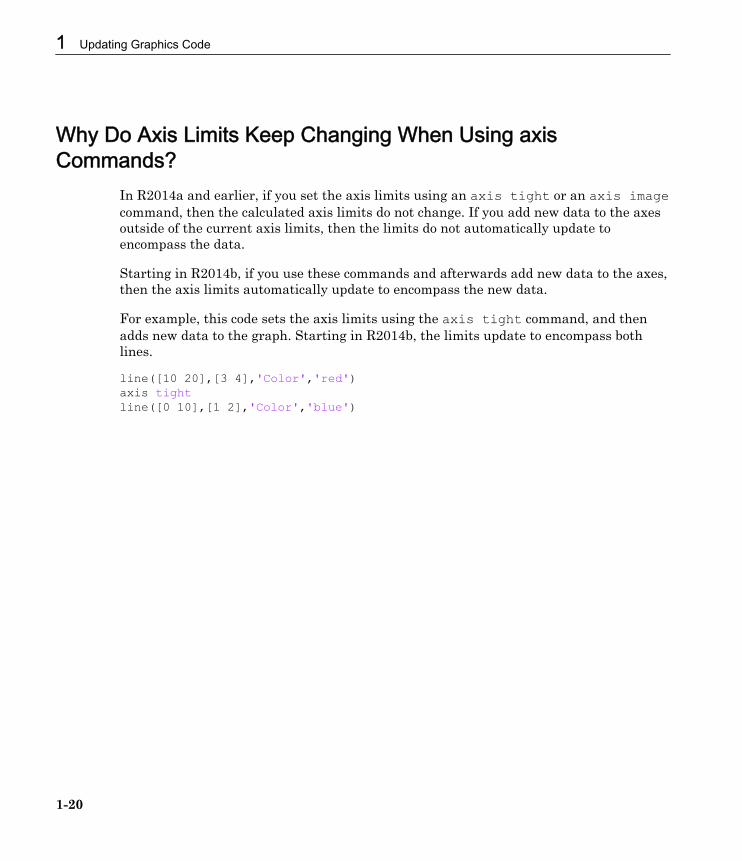
For example, this code sets the axis limits using the axis tight command, and thenadds new data to the graph. Starting in R2014b, the limits update to encompass bothlines.
line([10 20],[3 4],'Color','red')axis tightline([0 10],[1 2],'Color','blue')
1 Updating Graphics Code
1-20
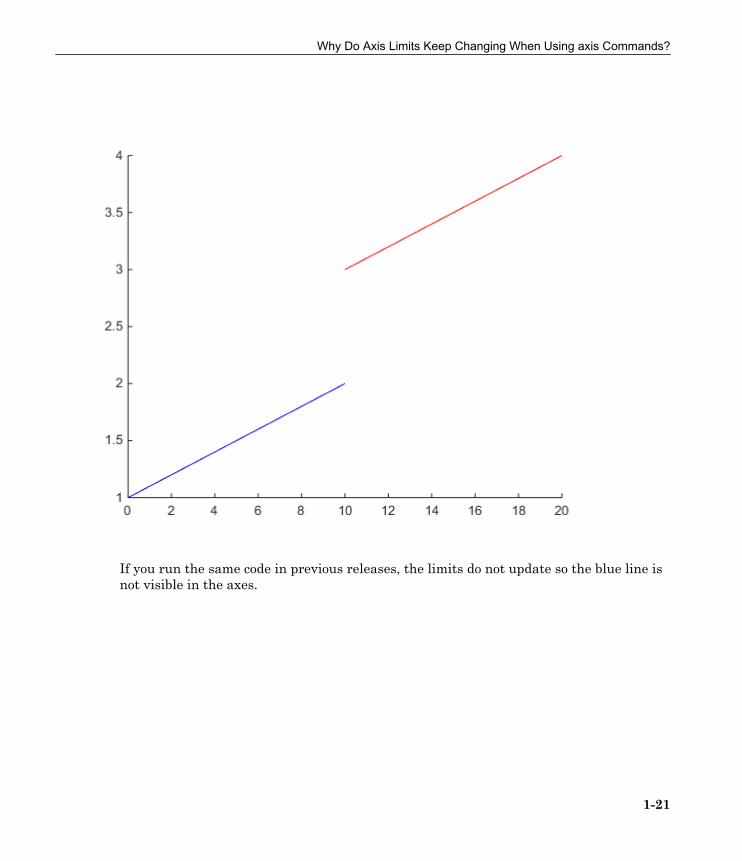
If you run the same code in previous releases, the limits do not update so the blue line isnot visible in the axes.
Why Do Axis Limits Keep Changing When Using axis Commands?
1-21
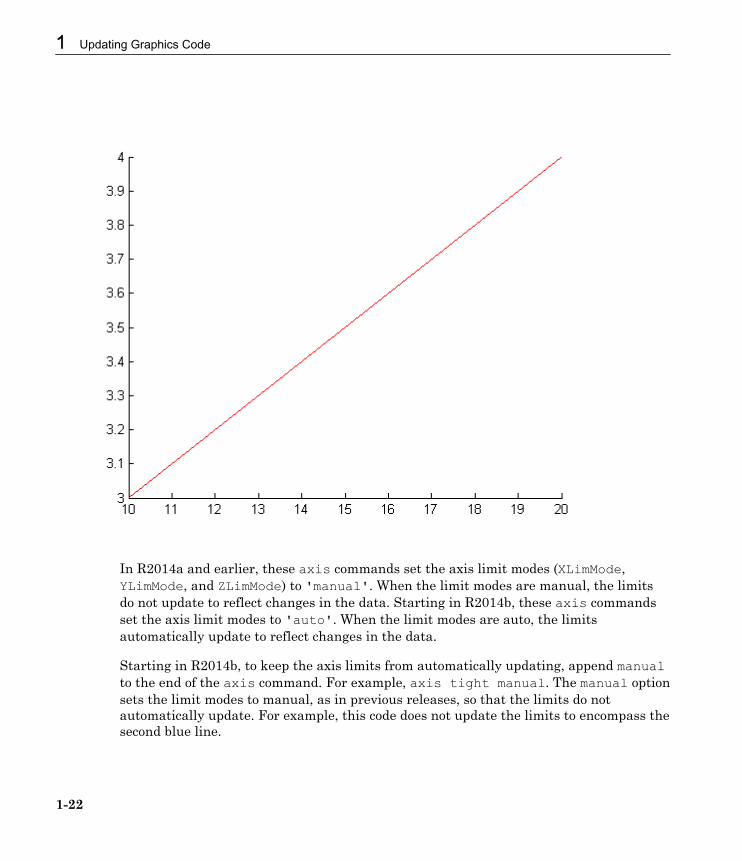
In R2014a and earlier, these axis commands set the axis limit modes (XLimMode,YLimMode, and ZLimMode) to 'manual'. When the limit modes are manual, the limitsdo not update to reflect changes in the data. Starting in R2014b, these axis commandsset the axis limit modes to 'auto'. When the limit modes are auto, the limitsautomatically update to reflect changes in the data.
Starting in R2014b, to keep the axis limits from automatically updating, append manualto the end of the axis command. For example, axis tight manual. The manual optionsets the limit modes to manual, as in previous releases, so that the limits do notautomatically update. For example, this code does not update the limits to encompass thesecond blue line.
1 Updating Graphics Code
1-22
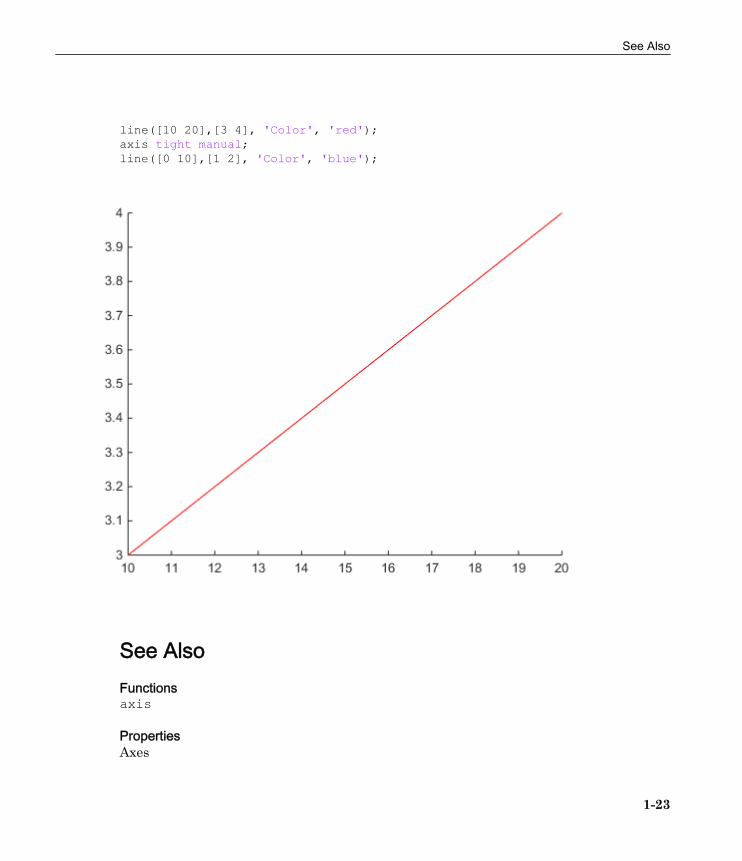
line([10 20],[3 4], 'Color', 'red');axis tight manual;line([0 10],[1 2], 'Color', 'blue');
See AlsoFunctionsaxis
PropertiesAxes
See Also
1-23
Why Is Part of the Graph Cut Off?In this section...“Graphics Objects No Longer Extend Beyond Axes Boundaries” on page 1-24“Disable Clipping” on page 1-26“Control Style of Clipping” on page 1-28
Graphics Objects No Longer Extend Beyond Axes Boundaries
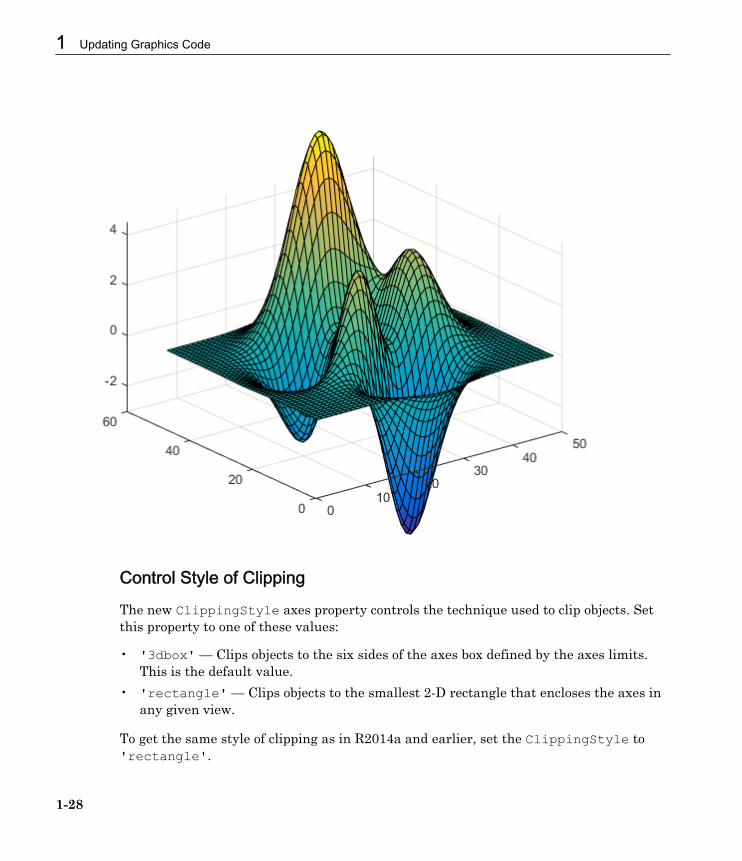
Starting in R2014b, graphics objects do not extend beyond the axes boundaries. Objectsare clipped to the six sides of the axes box defined by the axes limits. For example,MATLAB does not display the peaks of this surface that extend beyond the specified z-limits.
surf(peaks);zlim([-3,4.5]);
1 Updating Graphics Code
1-24
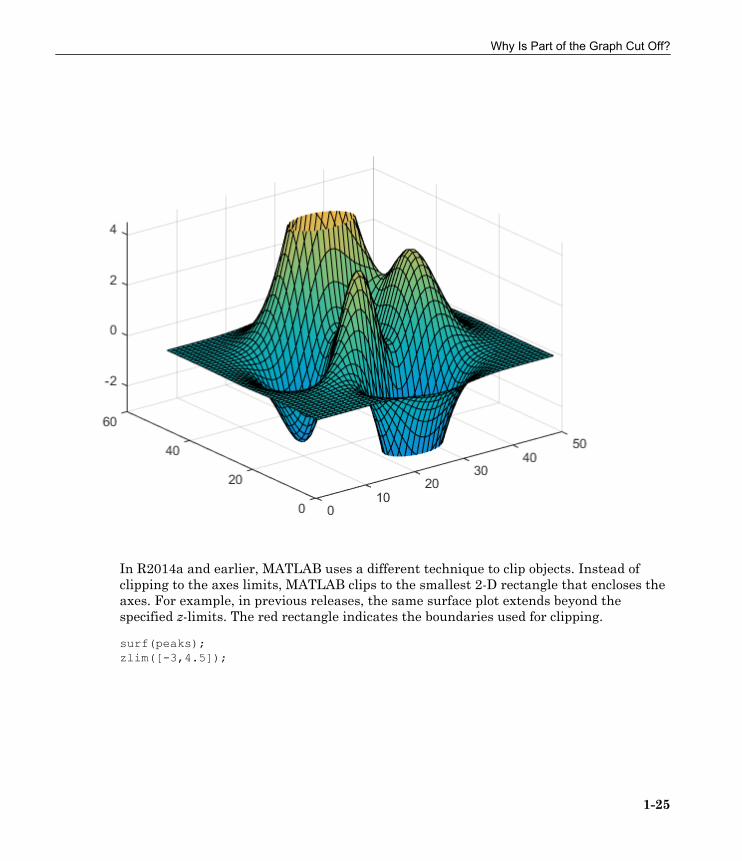
In R2014a and earlier, MATLAB uses a different technique to clip objects. Instead ofclipping to the axes limits, MATLAB clips to the smallest 2-D rectangle that encloses theaxes. For example, in previous releases, the same surface plot extends beyond thespecified z-limits. The red rectangle indicates the boundaries used for clipping.
surf(peaks);zlim([-3,4.5]);
Why Is Part of the Graph Cut Off?
1-25
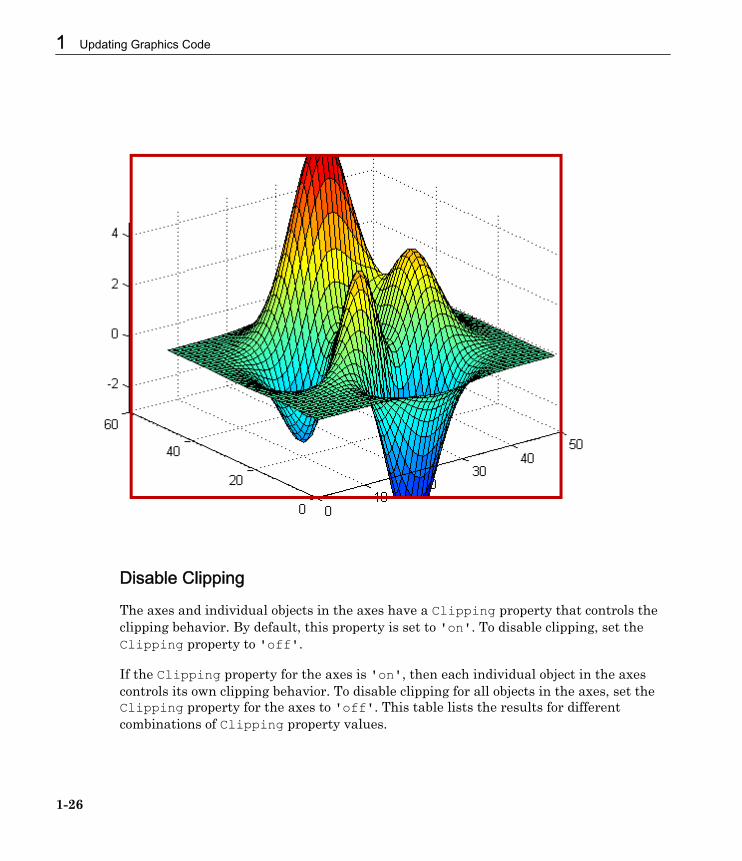
Disable Clipping
The axes and individual objects in the axes have a Clipping property that controls theclipping behavior. By default, this property is set to 'on'. To disable clipping, set theClipping property to 'off'.
If the Clipping property for the axes is 'on', then each individual object in the axescontrols its own clipping behavior. To disable clipping for all objects in the axes, set theClipping property for the axes to 'off'. This table lists the results for differentcombinations of Clipping property values.
1 Updating Graphics Code
1-26
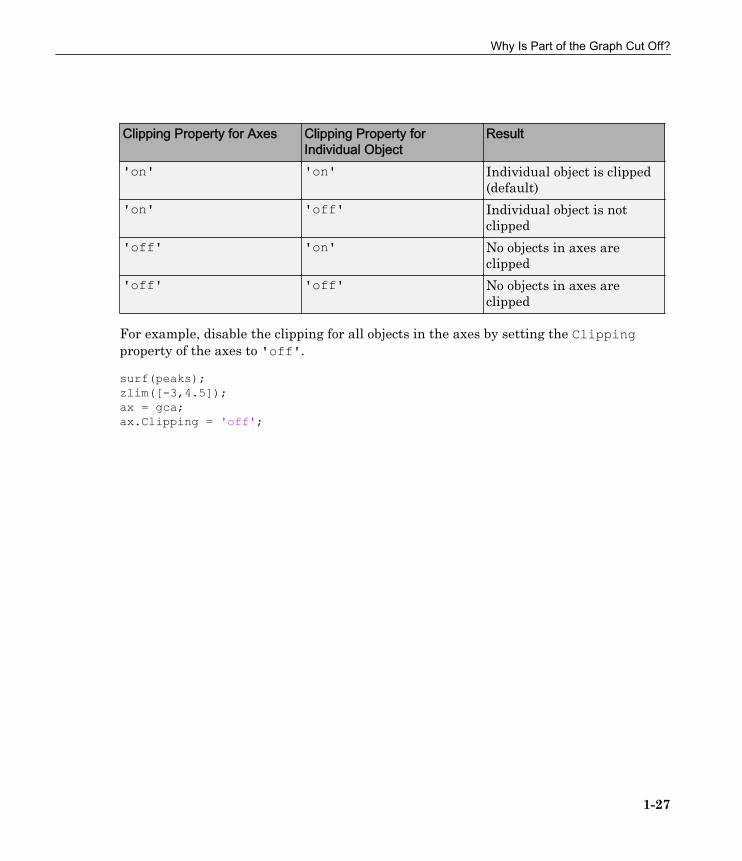
Clipping Property for Axes Clipping Property forIndividual Object
Result
'on' 'on' Individual object is clipped(default)
'on' 'off' Individual object is notclipped
'off' 'on' No objects in axes areclipped
'off' 'off' No objects in axes areclipped
For example, disable the clipping for all objects in the axes by setting the Clippingproperty of the axes to 'off'.
surf(peaks);zlim([-3,4.5]);ax = gca;ax.Clipping = 'off';
Why Is Part of the Graph Cut Off?
1-27
Control Style of Clipping
The new ClippingStyle axes property controls the technique used to clip objects. Setthis property to one of these values:
• '3dbox' — Clips objects to the six sides of the axes box defined by the axes limits.This is the default value.
• 'rectangle' — Clips objects to the smallest 2-D rectangle that encloses the axes inany given view.
To get the same style of clipping as in R2014a and earlier, set the ClippingStyle to'rectangle'.
1 Updating Graphics Code
1-28
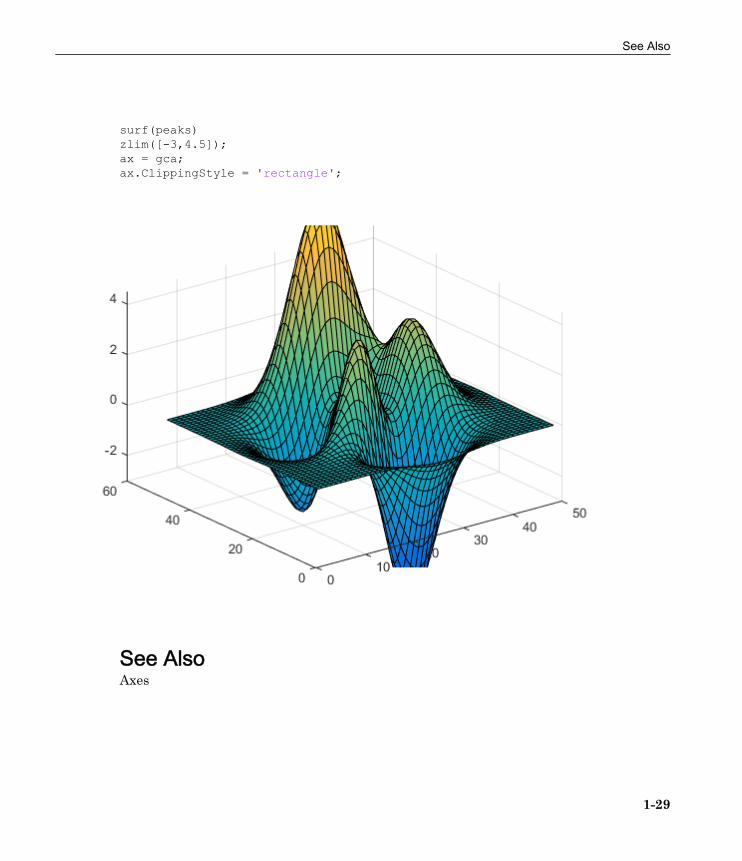
surf(peaks)zlim([-3,4.5]);ax = gca;ax.ClippingStyle = 'rectangle';
See AlsoAxes
See Also
1-29
Why Are Colorbars and Legends Not Valid Axes Handles?Starting in R2014b, colorbars and legends are no longer axes objects. They are new typesof objects that have their own sets of supported properties. In previous releases, they areaxes objects that you can modify using axes properties. However, many axes propertiesare not relevant to colorbars and legends.
You should not perform operations that assume or require colorbars and legends to beaxes objects.
Use Supported Colorbar and Legend Properties
Do not use axes properties to modify colorbars or legends. Use their supported properties.For a list, see Colorbar or Legend.
For example, to reverse the direction of the color scale along a colorbar use the newDirection property for the colorbar instead of setting the XDir or YDir axes property.
c = colorbar;c.Direction = 'reverse';
Colorbars and Legends Cannot Be Current Axes
Do not pass a colorbar object or a legend object to a function that expects an axes objectas an input argument.
For example, passing a legend object to the axes function to make it the current axesreturns an error message:
plot(1:10)l = legend('line plot');axes(l)
Error using axesHandles of type Legend cannot be made the current Axes.
Similarly, passing a colorbar object to the axes function returns an error message:
c = colorbar;axes(c)
1 Updating Graphics Code
1-30
Error using axesHandles of type ColorBar cannot be made the current Axes.
In previous releases, you might make a colorbar the current axes before giving it a title,Now, use the new Label property of the colorbar instead.
c = colorbar;c.Label.String = 'Colorbar Label';
Find Objects Using New Type Property Values
Colorbars and legends no longer have a Type property of 'axes'. Do not use findall orfindobj to find objects with a Type property of 'axes' and expect it to return colorbarsand legends.
To find legends, search for objects with a Type property of 'legend'.
findall(groot,'Type','legend')
To find colorbars, search for objects with a Type property of 'colorbar'.
findall(groot,'Type','colorbar')
Colorbars and Legends Have No Children
Colorbars and legends no longer contain handles to underlying objects in their Childrenproperty. Their Children properties contain an empty graphics placeholder array. For alegend, access these underlying objects using the output arguments from the legendfunction instead.
See AlsoFunctionscolorbar | legend
PropertiesColorbar | Legend
See Also
1-31
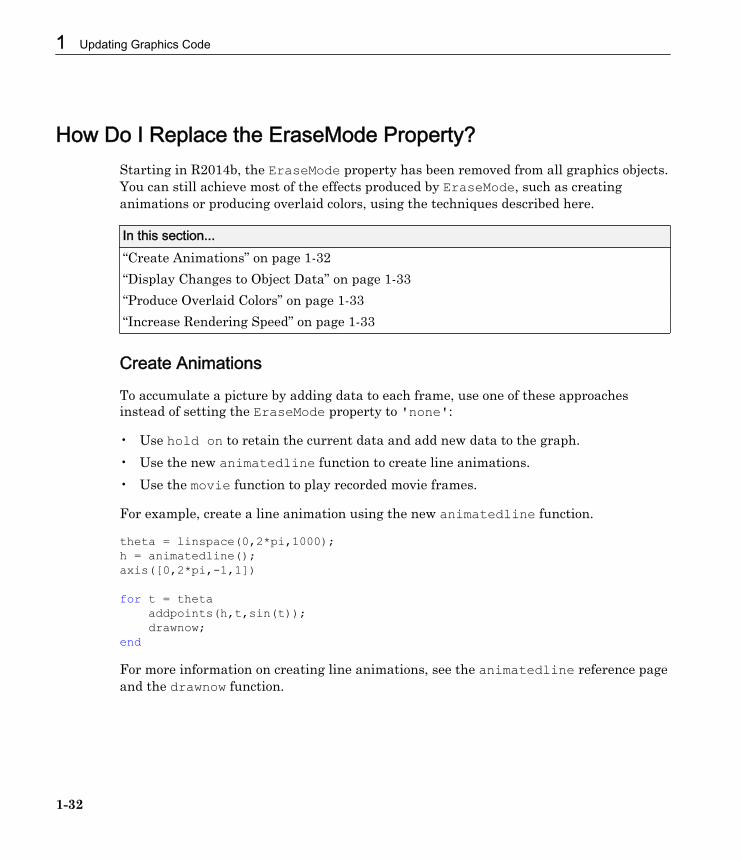
How Do I Replace the EraseMode Property?Starting in R2014b, the EraseMode property has been removed from all graphics objects.You can still achieve most of the effects produced by EraseMode, such as creatinganimations or producing overlaid colors, using the techniques described here.
In this section...“Create Animations” on page 1-32“Display Changes to Object Data” on page 1-33“Produce Overlaid Colors” on page 1-33“Increase Rendering Speed” on page 1-33
Create Animations
To accumulate a picture by adding data to each frame, use one of these approachesinstead of setting the EraseMode property to 'none':
• Use hold on to retain the current data and add new data to the graph.• Use the new animatedline function to create line animations.• Use the movie function to play recorded movie frames.
For example, create a line animation using the new animatedline function.
theta = linspace(0,2*pi,1000);h = animatedline();axis([0,2*pi,-1,1])
for t = theta addpoints(h,t,sin(t)); drawnow;end
For more information on creating line animations, see the animatedline reference pageand the drawnow function.
1 Updating Graphics Code
1-32
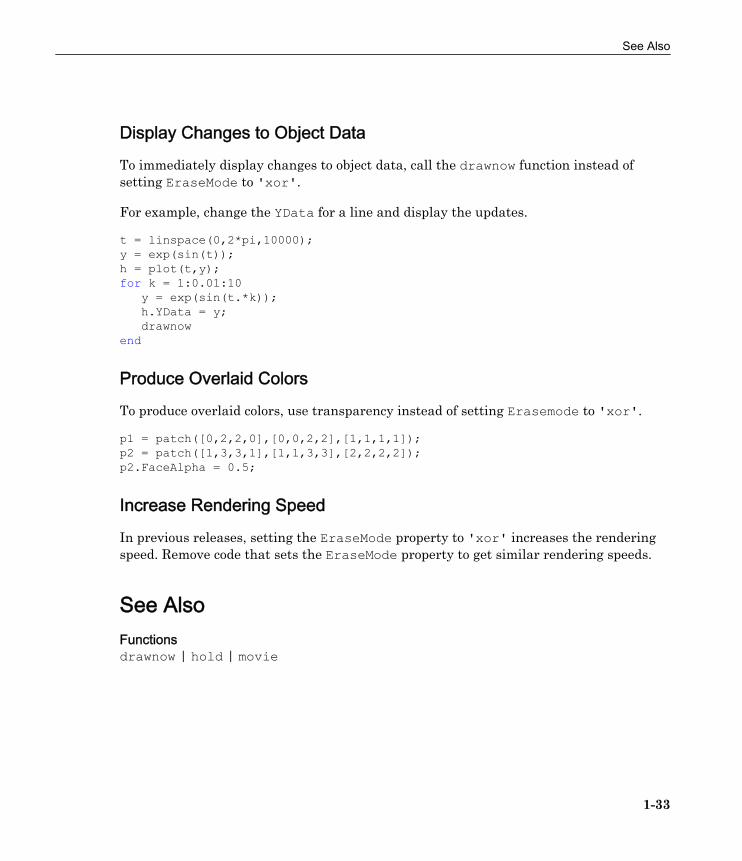
Display Changes to Object Data
To immediately display changes to object data, call the drawnow function instead ofsetting EraseMode to 'xor'.
For example, change the YData for a line and display the updates.
t = linspace(0,2*pi,10000);y = exp(sin(t));h = plot(t,y);for k = 1:0.01:10 y = exp(sin(t.*k)); h.YData = y; drawnowend
Produce Overlaid Colors
To produce overlaid colors, use transparency instead of setting Erasemode to 'xor'.
p1 = patch([0,2,2,0],[0,0,2,2],[1,1,1,1]);p2 = patch([1,3,3,1],[1,1,3,3],[2,2,2,2]);p2.FaceAlpha = 0.5;
Increase Rendering Speed
In previous releases, setting the EraseMode property to 'xor' increases the renderingspeed. Remove code that sets the EraseMode property to get similar rendering speeds.
See AlsoFunctionsdrawnow | hold | movie
See Also
1-33
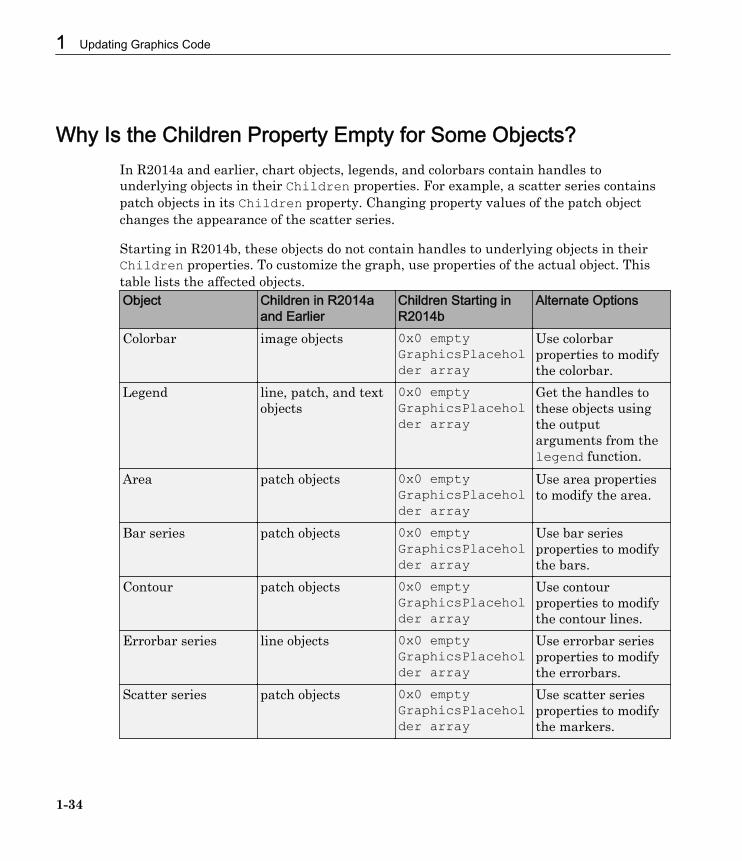
Why Is the Children Property Empty for Some Objects?In R2014a and earlier, chart objects, legends, and colorbars contain handles tounderlying objects in their Children properties. For example, a scatter series containspatch objects in its Children property. Changing property values of the patch objectchanges the appearance of the scatter series.
Starting in R2014b, these objects do not contain handles to underlying objects in theirChildren properties. To customize the graph, use properties of the actual object. Thistable lists the affected objects.Object Children in R2014a
and EarlierChildren Starting inR2014b
Alternate Options
Colorbar image objects 0x0 emptyGraphicsPlaceholder array
Use colorbarproperties to modifythe colorbar.
Legend line, patch, and textobjects
0x0 emptyGraphicsPlaceholder array
Get the handles tothese objects usingthe outputarguments from thelegend function.
Area patch objects 0x0 emptyGraphicsPlaceholder array
Use area propertiesto modify the area.
Bar series patch objects 0x0 emptyGraphicsPlaceholder array
Use bar seriesproperties to modifythe bars.
Contour patch objects 0x0 emptyGraphicsPlaceholder array
Use contourproperties to modifythe contour lines.
Errorbar series line objects 0x0 emptyGraphicsPlaceholder array
Use errorbar seriesproperties to modifythe errorbars.
Scatter series patch objects 0x0 emptyGraphicsPlaceholder array
Use scatter seriesproperties to modifythe markers.
1 Updating Graphics Code
1-34
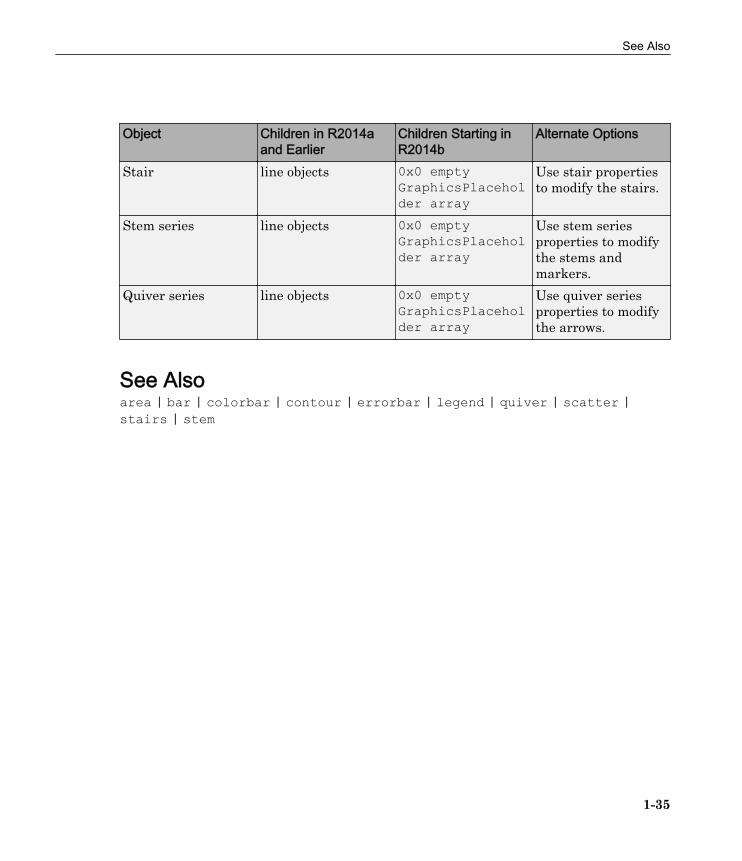
Object Children in R2014aand Earlier
Children Starting inR2014b
Alternate Options
Stair line objects 0x0 emptyGraphicsPlaceholder array
Use stair propertiesto modify the stairs.
Stem series line objects 0x0 emptyGraphicsPlaceholder array
Use stem seriesproperties to modifythe stems andmarkers.
Quiver series line objects 0x0 emptyGraphicsPlaceholder array
Use quiver seriesproperties to modifythe arrows.
See Alsoarea | bar | colorbar | contour | errorbar | legend | quiver | scatter |stairs | stem
See Also
1-35
Why Do Figures Display Simultaneously?If you create multiple figures in a script in R2014a and earlier, then MATLAB attemptsto wait for each figure to display on the screen before continuing to execute the script.Starting in R2014b, MATLAB does not wait for a figure to display before continuing toexecute the script. Thus, the script might run to completion before the figures aredisplayed. This change is most noticeable for scripts that create multiple figures andperform long computations.
To force figures to display as they are created, use drawnow.
figureplot(1:10);drawnow
See Alsodrawnow
1 Updating Graphics Code
1-36
Why Does Accessing Tick Label Elements Return ErrorMessage?
In R2014a and earlier, the XTickLabel, YTickLabel, and ZTickLabel properties ofthe axes contained the tick label values in either a character array or a cell array.Starting in R2014b, these properties always contain the tick labels in a cell array. Accesselements of the array using cell array indexing with curly braces {}.
Using matrix indexing to access the elements returns an error message:
plot(0:10,0:10);ax = gca;xticks = get(ax,'XTickLabel');xticks(1) = 'start';
Conversion to cell from char is not possible.
Use cell array indexing with curly braces {} to access tick label elements.
plot(0:10,0:10);ax = gca;xticks = get(ax,'XTickLabel');xticks{1} = 'start';set(ax,'XTickLabel',xticks) % set tick labels to updated values
See AlsoAxes
Why Does Accessing Tick Label Elements Return Error Message?
1-37
How Do I Get Exponent Values for Log Axes?Starting in R2014b, the XTickLabel, YTickLabel, or ZTickLabel properties for a logaxis contain cell arrays with the full TeX markup used for the tick labels. In R2014a andearlier, these properties contain a character array with only the exponent values for thetick marks.Starting in R2014b R2014a and Earliersemilogx(1:10000);ax = gca;ticks = ax.XTickLabelclass(ticks)
semilogx(1:10000);ax = gca;ticks = get(ax,'XTickLabel')class(ticks)
ticks =
'10^{0}' '10^{1}' '10^{2}' '10^{3}' '10^{4}'
ans =
cell
ticks =
01234
ans =
char
To extract just the exponent values from the tick label property, use the regexprepfunction.
expression = '\d*\^\{(\-?\d*)\}';replace = '$1';exponents = regexprep(ticks,expression,replace)
exponents =
'0' '1' '2' '3' '4'
See AlsoAxes
1 Updating Graphics Code
1-38
Why Are Callbacks and Application Data Not Copied?Starting in R2014b, copyobj does not copy callback properties or application dataassociated with graphics objects. The copied object has callbacks set to empty characterarrays and application data set to empty structure arrays. Copies of objects might notbehave as expected. For example, clicking a push button on the copy of a uicontrol has noeffect.
If you want to create a copy of an object that has callbacks, then rerun the code used tocreate the first object to create a second object.
If you have existing code that uses copyobj to copy callbacks, then you can use copyobjwith the 'legacy' option, for example, c = copyobj(h,p,'legacy'). The behavior ofthe 'legacy' option is consistent with versions of MATLAB before R2014b.
See Alsocopyobj
Why Are Callbacks and Application Data Not Copied?
1-39

Updating GUI Code
• “Why Are Some Components Missing or Partially Obscured?” on page 2-2• “Why Has the Behavior of ResizeFcn Changed?” on page 2-7• “Why Does handle.listener Return an Error?” on page 2-10
2
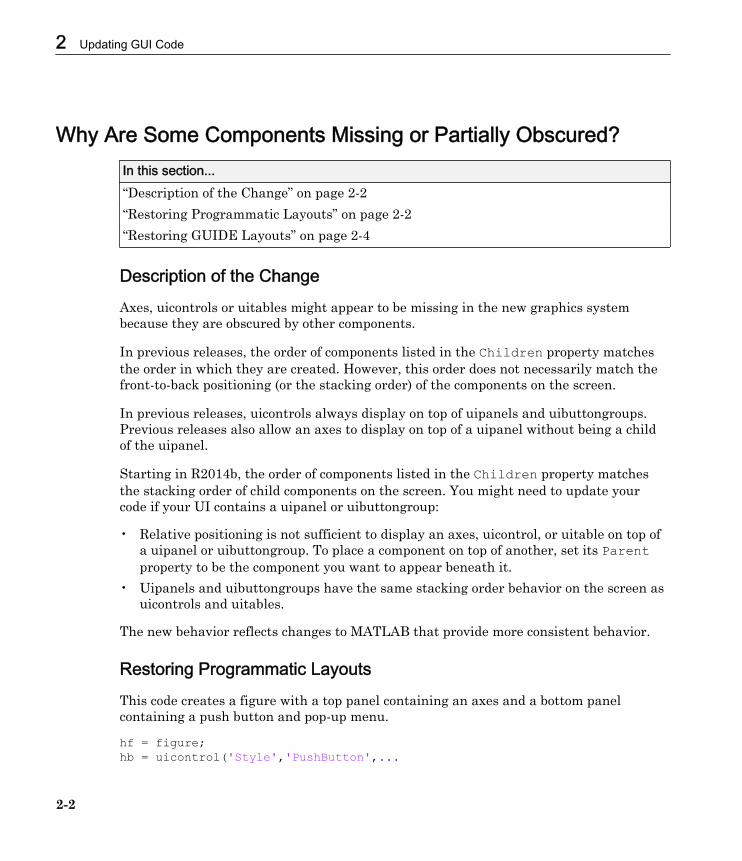
Why Are Some Components Missing or Partially Obscured?In this section...“Description of the Change” on page 2-2“Restoring Programmatic Layouts” on page 2-2“Restoring GUIDE Layouts” on page 2-4
Description of the ChangeAxes, uicontrols or uitables might appear to be missing in the new graphics systembecause they are obscured by other components.
In previous releases, the order of components listed in the Children property matchesthe order in which they are created. However, this order does not necessarily match thefront-to-back positioning (or the stacking order) of the components on the screen.
In previous releases, uicontrols always display on top of uipanels and uibuttongroups.Previous releases also allow an axes to display on top of a uipanel without being a childof the uipanel.
Starting in R2014b, the order of components listed in the Children property matchesthe stacking order of child components on the screen. You might need to update yourcode if your UI contains a uipanel or uibuttongroup:
• Relative positioning is not sufficient to display an axes, uicontrol, or uitable on top ofa uipanel or uibuttongroup. To place a component on top of another, set its Parentproperty to be the component you want to appear beneath it.
• Uipanels and uibuttongroups have the same stacking order behavior on the screen asuicontrols and uitables.
The new behavior reflects changes to MATLAB that provide more consistent behavior.
Restoring Programmatic LayoutsThis code creates a figure with a top panel containing an axes and a bottom panelcontaining a push button and pop-up menu.
hf = figure;hb = uicontrol('Style','PushButton',...
2 Updating GUI Code
2-2
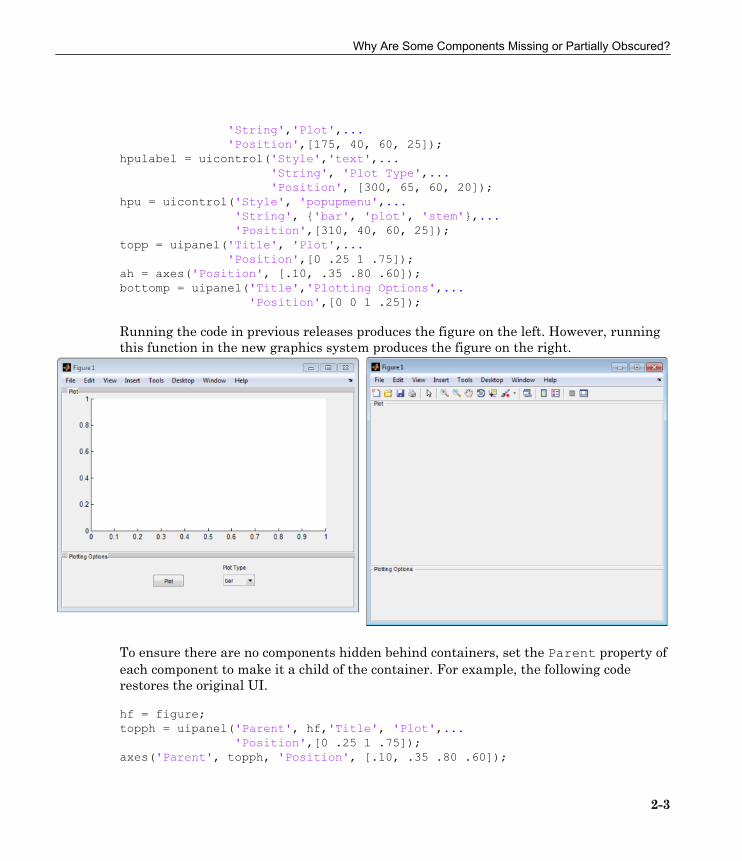
'String','Plot',... 'Position',[175, 40, 60, 25]);hpulabel = uicontrol('Style','text',... 'String', 'Plot Type',... 'Position', [300, 65, 60, 20]);hpu = uicontrol('Style', 'popupmenu',... 'String', {'bar', 'plot', 'stem'},... 'Position',[310, 40, 60, 25]);topp = uipanel('Title', 'Plot',... 'Position',[0 .25 1 .75]);ah = axes('Position', [.10, .35 .80 .60]);bottomp = uipanel('Title','Plotting Options',... 'Position',[0 0 1 .25]);
Running the code in previous releases produces the figure on the left. However, runningthis function in the new graphics system produces the figure on the right.
To ensure there are no components hidden behind containers, set the Parent property ofeach component to make it a child of the container. For example, the following coderestores the original UI.
hf = figure;topph = uipanel('Parent', hf,'Title', 'Plot',... 'Position',[0 .25 1 .75]);axes('Parent', topph, 'Position', [.10, .35 .80 .60]);
Why Are Some Components Missing or Partially Obscured?
2-3
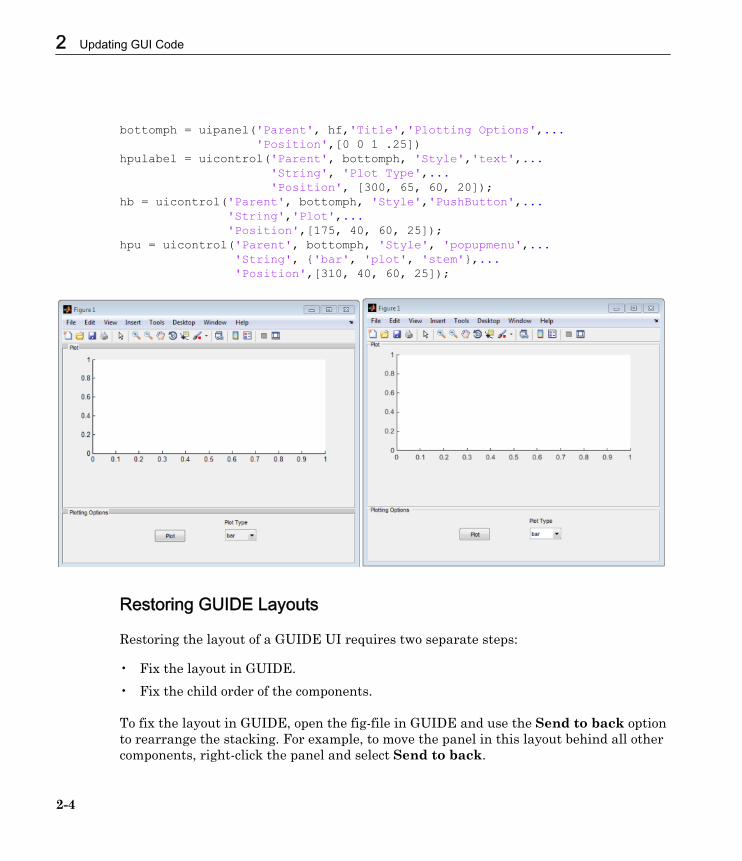
bottomph = uipanel('Parent', hf,'Title','Plotting Options',... 'Position',[0 0 1 .25])hpulabel = uicontrol('Parent', bottomph, 'Style','text',... 'String', 'Plot Type',... 'Position', [300, 65, 60, 20]);hb = uicontrol('Parent', bottomph, 'Style','PushButton',... 'String','Plot',... 'Position',[175, 40, 60, 25]);hpu = uicontrol('Parent', bottomph, 'Style', 'popupmenu',... 'String', {'bar', 'plot', 'stem'},... 'Position',[310, 40, 60, 25]);
Restoring GUIDE Layouts
Restoring the layout of a GUIDE UI requires two separate steps:
• Fix the layout in GUIDE.• Fix the child order of the components.
To fix the layout in GUIDE, open the fig-file in GUIDE and use the Send to back optionto rearrange the stacking. For example, to move the panel in this layout behind all othercomponents, right-click the panel and select Send to back.
2 Updating GUI Code
2-4
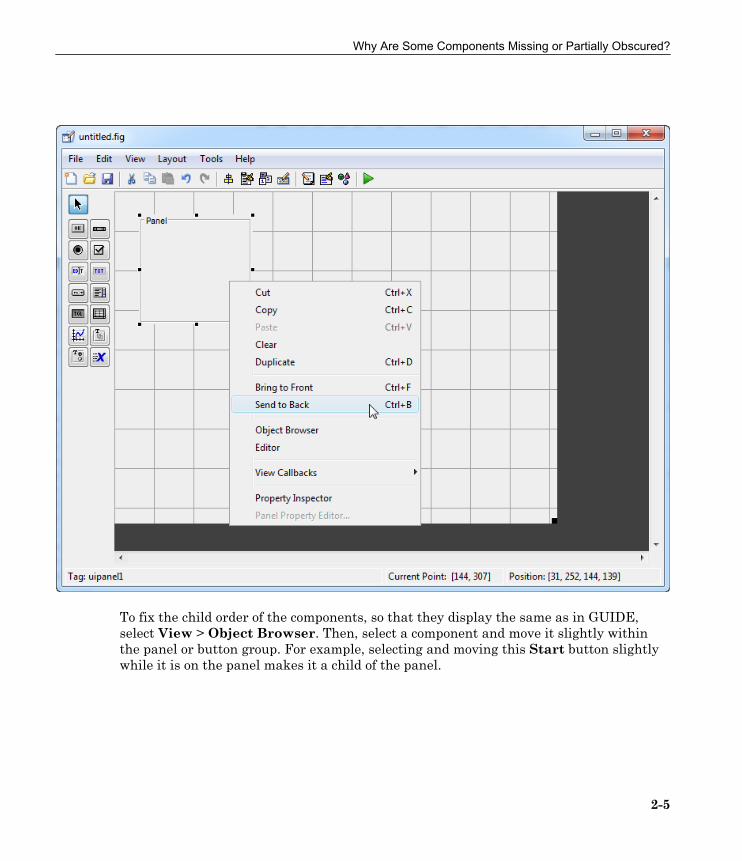
To fix the child order of the components, so that they display the same as in GUIDE,select View > Object Browser. Then, select a component and move it slightly withinthe panel or button group. For example, selecting and moving this Start button slightlywhile it is on the panel makes it a child of the panel.
Why Are Some Components Missing or Partially Obscured?
2-5
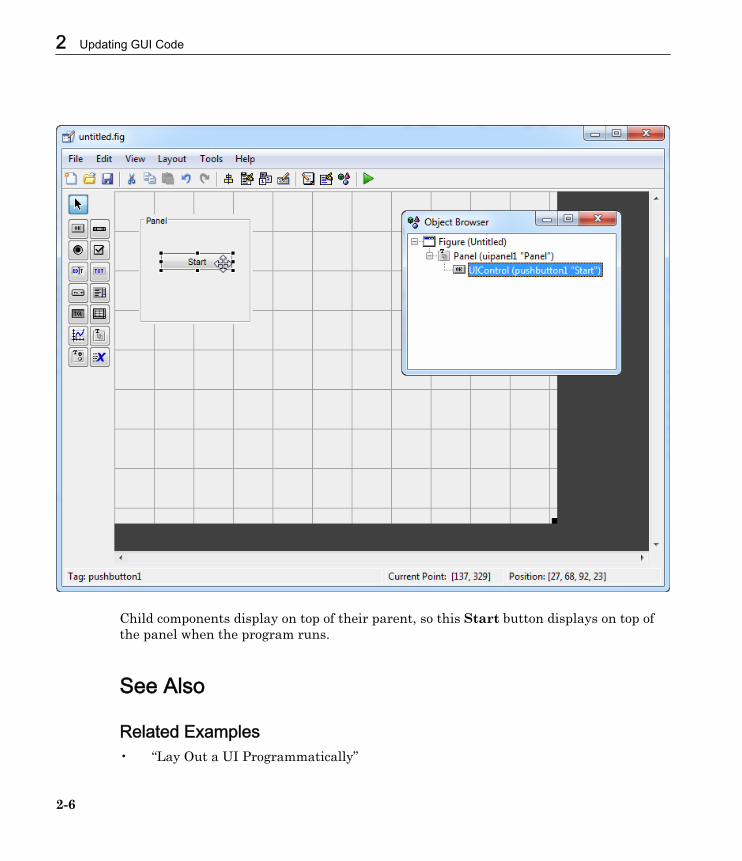
Child components display on top of their parent, so this Start button displays on top ofthe panel when the program runs.
See Also
Related Examples• “Lay Out a UI Programmatically”
2 Updating GUI Code
2-6
Why Has the Behavior of ResizeFcn Changed?Changes in the behavior of the ResizeFcn callback reflect changes to the positioningand layout of figures and containers to make their behavior more consistent with oneanother and across all platforms.
In this section...“ResizeFcn Returns Error After Program Launches” on page 2-7“ResizeFcn Inactive for Invisible Components” on page 2-8“Unexpected Behavior When Outer Bounds or Drawable Area Changes” on page 2-9
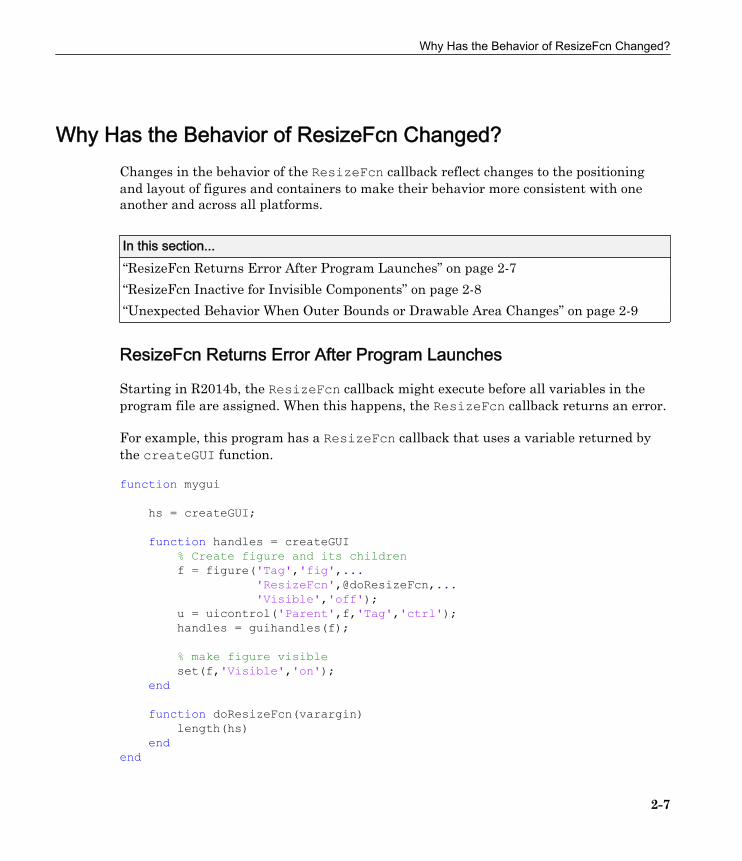
ResizeFcn Returns Error After Program Launches
Starting in R2014b, the ResizeFcn callback might execute before all variables in theprogram file are assigned. When this happens, the ResizeFcn callback returns an error.
For example, this program has a ResizeFcn callback that uses a variable returned bythe createGUI function.
function mygui hs = createGUI; function handles = createGUI % Create figure and its children f = figure('Tag','fig',... 'ResizeFcn',@doResizeFcn,... 'Visible','off'); u = uicontrol('Parent',f,'Tag','ctrl'); handles = guihandles(f); % make figure visible set(f,'Visible','on'); end function doResizeFcn(varargin) length(hs) endend
Why Has the Behavior of ResizeFcn Changed?
2-7
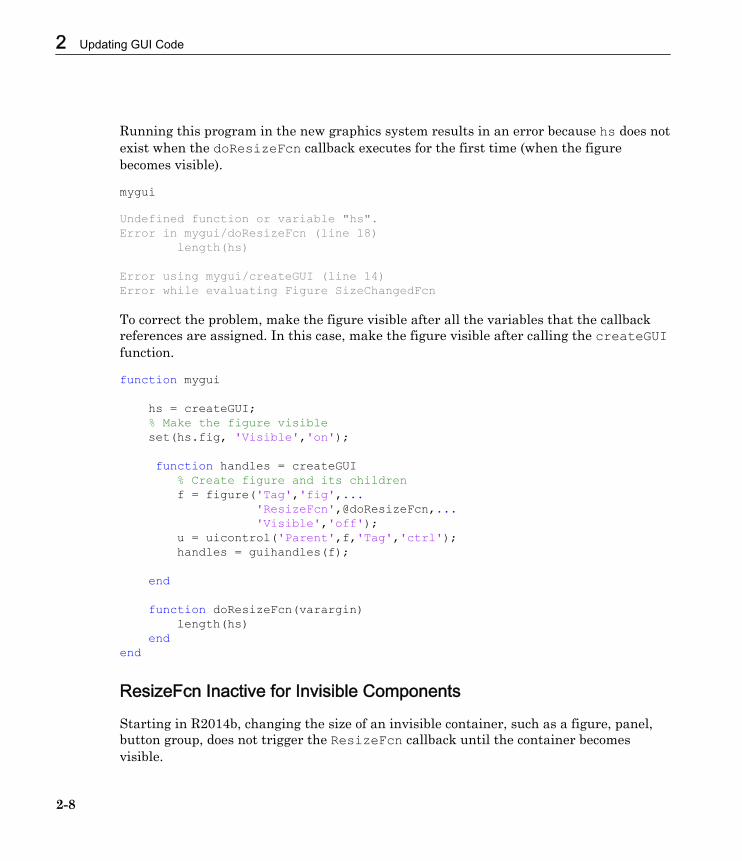
Running this program in the new graphics system results in an error because hs does notexist when the doResizeFcn callback executes for the first time (when the figurebecomes visible).
mygui
Undefined function or variable "hs".Error in mygui/doResizeFcn (line 18) length(hs)
Error using mygui/createGUI (line 14)Error while evaluating Figure SizeChangedFcn
To correct the problem, make the figure visible after all the variables that the callbackreferences are assigned. In this case, make the figure visible after calling the createGUIfunction.
function mygui hs = createGUI; % Make the figure visible set(hs.fig, 'Visible','on'); function handles = createGUI % Create figure and its children f = figure('Tag','fig',... 'ResizeFcn',@doResizeFcn,... 'Visible','off'); u = uicontrol('Parent',f,'Tag','ctrl'); handles = guihandles(f); end function doResizeFcn(varargin) length(hs) endend
ResizeFcn Inactive for Invisible Components
Starting in R2014b, changing the size of an invisible container, such as a figure, panel,button group, does not trigger the ResizeFcn callback until the container becomesvisible.
2 Updating GUI Code
2-8
In previous releases of MATLAB, the ResizeFcn callback executes when the size of thecontainer changes, regardless of whether it is visible.
You can control the visibility of figures and containers using the Visible property:
• A figure is visible if its Visible property is set to 'on'.• A uipanel or uibuttongroup is visible if its Visible property, and that of its
ancestors, is set to 'on'. For example, a uibuttongroup whose parent is a uipanel isvisible when the 'Visible' property of the uibuttongroup, uipanel, and the figureare all set to 'on'.
Unexpected Behavior When Outer Bounds or Drawable Area Changes
Starting in R2014b, changing the outer bounds of a figure or container does not triggerthe ResizeFcn callback.
For example, this figure ResizeFcn callback does not execute in the new graphicssystem when you change the OuterPosition (by removing the menu bar) on the secondline of this code. However, the callback does execute in previous releases of MATLAB.
f = figure('ResizeFcn','display resized');set(f,'Menubar','none');
Starting in R2014b, the ResizeFcn callback executes only when the container’sdrawable area (the inner area) changes. Previous releases of MATLAB might not executethe ResizeFcn callback when the drawable area changes.
For example, this uipanel ResizeFcn callback executes in the new graphics systemwhen you change the uipanel’s drawable area by increasing the border width. Thecallback does not execute when your run this code in previous releases.
p = uipanel('ResizeFcn','display resized');set(p,'BorderWidth',3);
See Also
Related Examples• “Lay Out a UI Programmatically”
See Also
2-9
Why Does handle.listener Return an Error?The new graphics system is based on MATLAB objects, which do not support the use ofhandle.listener to create event listeners. To create listeners for graphics objects, useaddlistener .
Note Release 2010b and later support addlistener, so your code can run in multiplereleases after you update it.
2 Updating GUI Code
2-10