Embed Size (px)
DESCRIPTION
Designing Effective Graphics Using MATLAB. The Cain Project in Engineering and Professional Communication Linda Driskill, [email protected] Gang Cheng, [email protected]. The Purpose of Using Graphs. In problem solving As part of design As analysis of operating data - PowerPoint PPT Presentation
Citation preview

Designing Effective Graphics Using MATLAB
The Cain Project in Engineering and Professional Communication
Linda Driskill, [email protected]
Gang Cheng, [email protected]
2
The Purpose of Using Graphs
• In problem solving As part of design
As analysis of operating data
• For persuasion and interpretation Dramatize relationships
Promote identification
Make complex information accessible
3
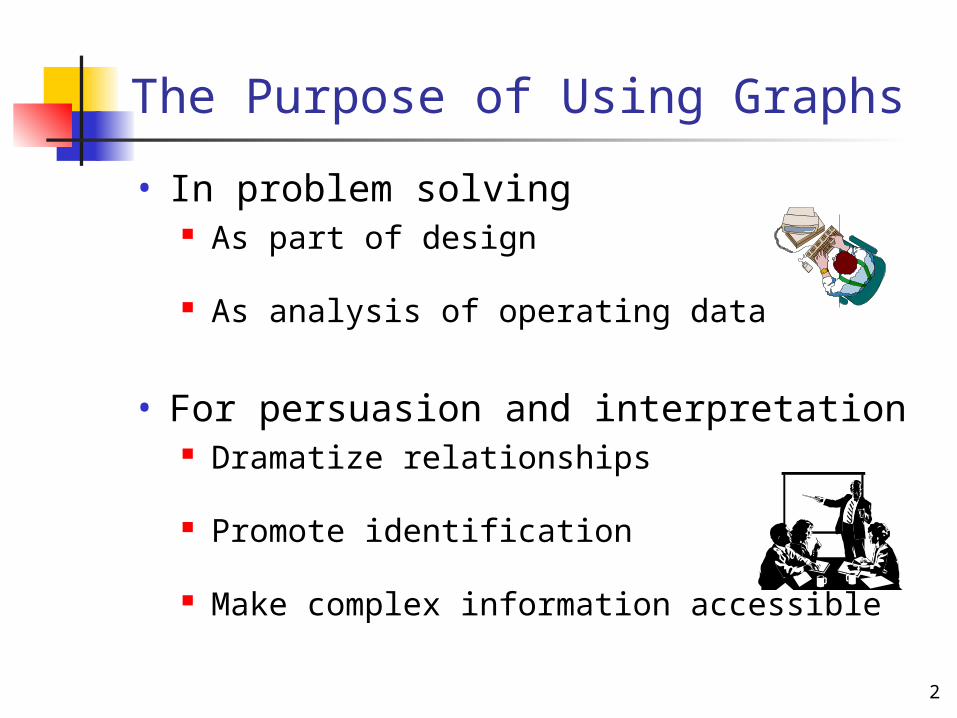
Checklist for Good Graphics
• Purpose clear?
• Critical components defined?
• Pattern and arrangement lead eye without distraction?
• Graphic hierarchy consistent?
• Fonts legible?
• Presenter’s expertise shown?
4
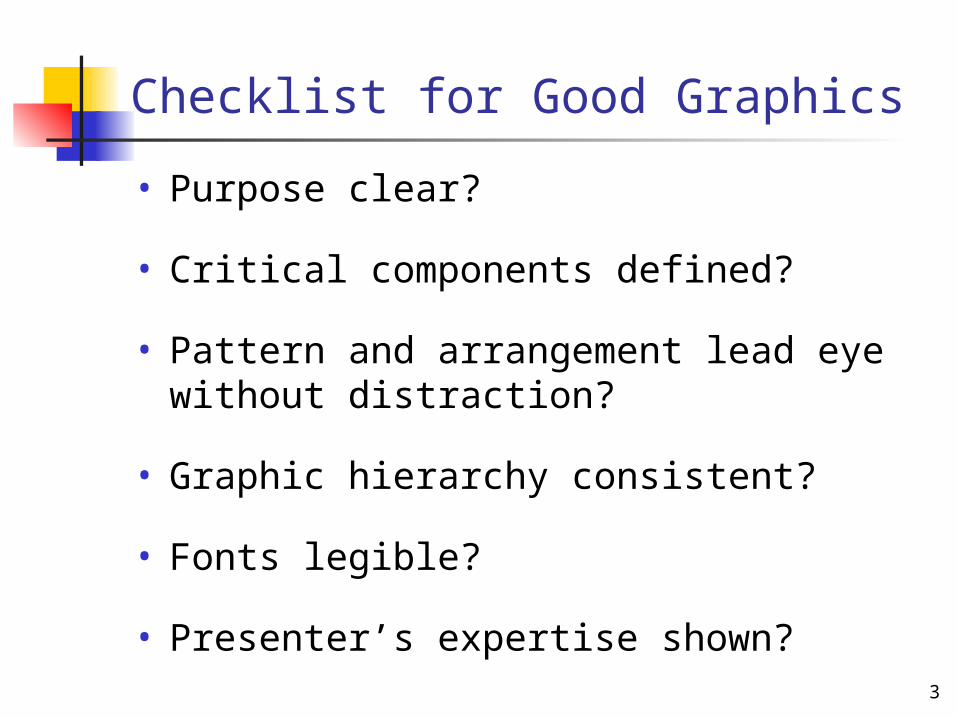
Types of Graph in Matlab
• Line graph 2D 3D
• Bar graph
• Pie graph
• Ribbon graph
5
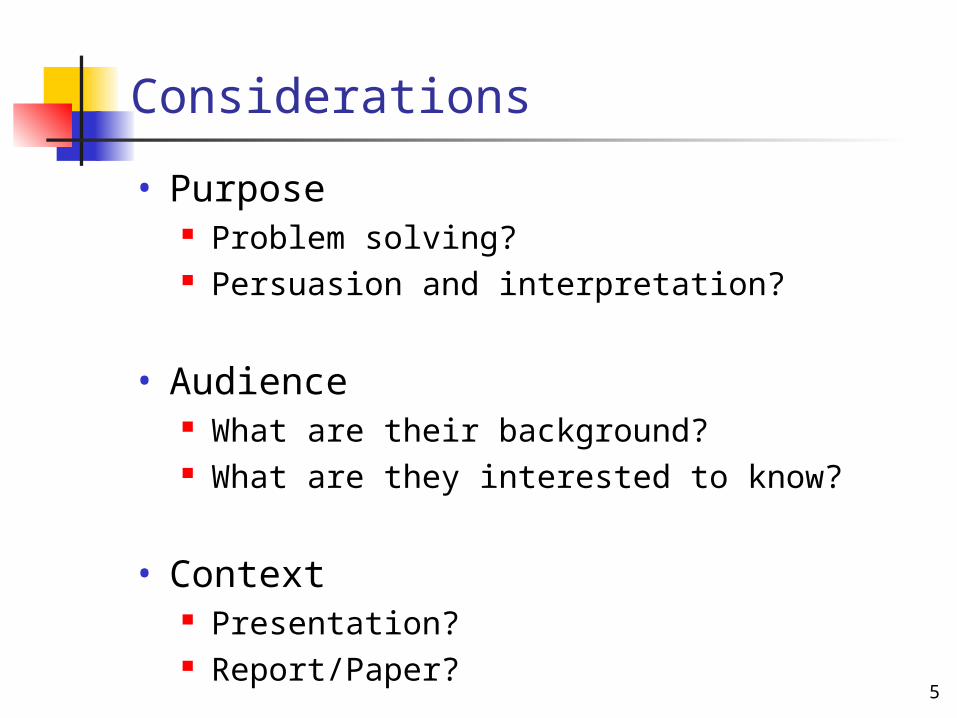
Considerations
• Purpose Problem solving? Persuasion and interpretation?
• Audience What are their background? What are they interested to know?
• Context Presentation? Report/Paper?
6
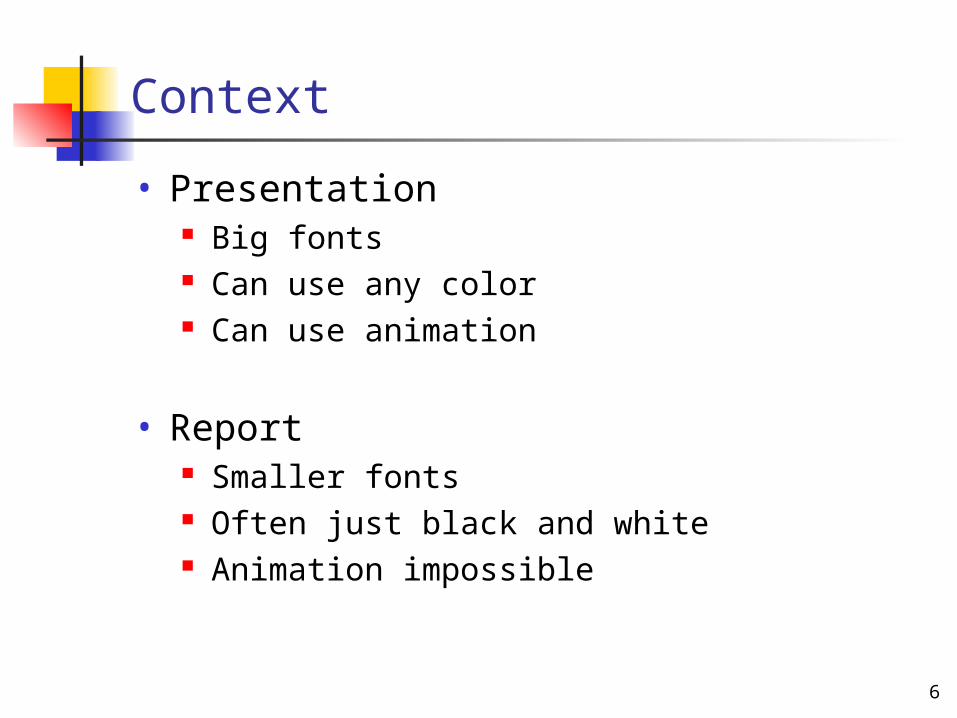
Context
• Presentation Big fonts Can use any color Can use animation
• Report Smaller fonts Often just black and white Animation impossible
7
An Example
• You have: Vector 1: x[0:0.2:10]; Vector 2: sin(x); Vector 3: cos(x);
• You are asked to: Plot sin(x) vs. x and cos(x) vs. x in the same
figure; Customize the figure so that it becomes
suitable for being used in a presentation. Customize the figure so that it becomes
suitable for being used in a report/paper.

8
A Simple Matlab Program
%startclear all; %clear the memoryX=[0:0.2:10]; %define the x
vectorsinx=sin(x); %calculate sin(x)cosx=cos(x); %calculate sin(x)plot(x,sinx,x,cosx); %plot the linesxlabel('x'); %add x labelylabel('y'); %add y labeltitle([‘sin and cos Functions']); %add title%end
9
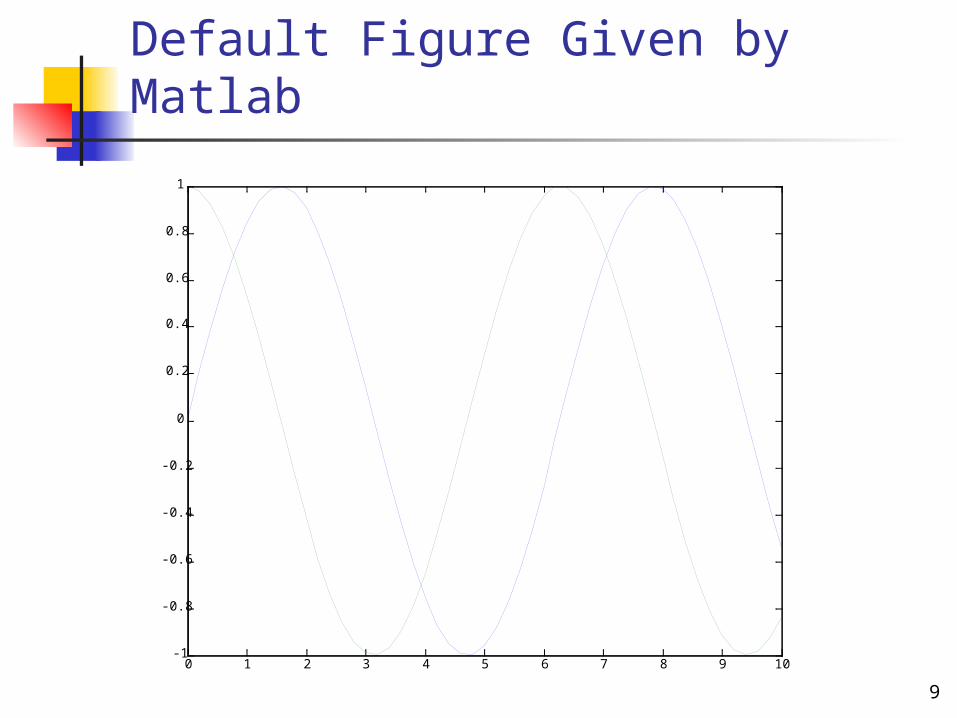
Default Figure Given by Matlab
0 1 2 3 4 5 6 7 8 9 10-1
-0.8
-0.6
-0.4
-0.2
0
0.2
0.4
0.6
0.8
1
x
y
sin and cos Functions
10
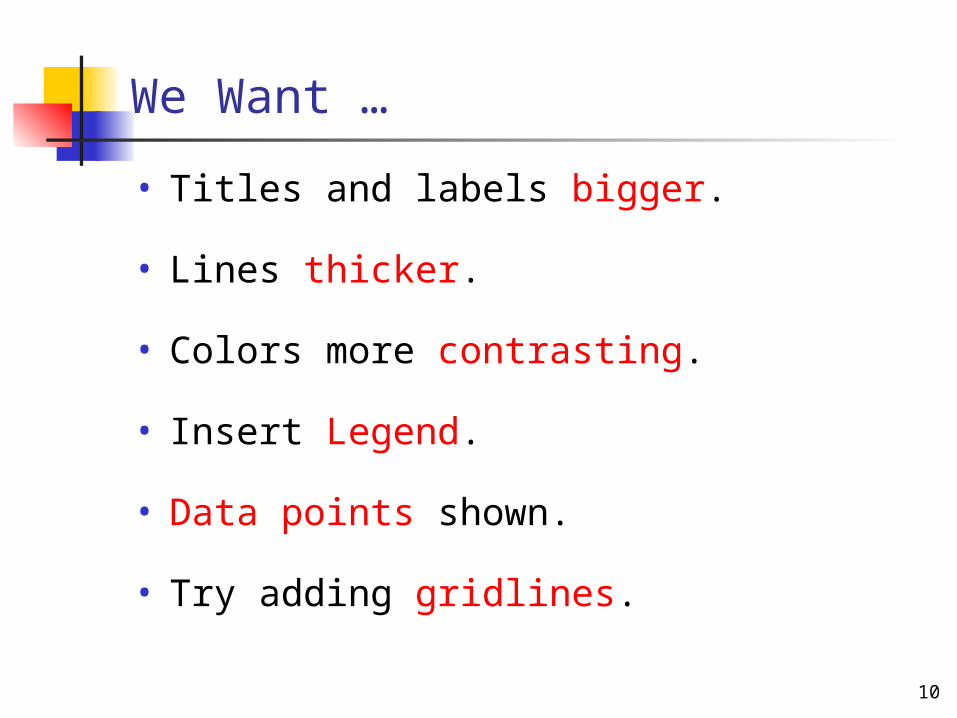
We Want …
• Titles and labels bigger.
• Lines thicker.
• Colors more contrasting.
• Insert Legend.
• Data points shown.
• Try adding gridlines.

11
Anatomy of a Matlab Figure
0 1 2 3 4 5 6 7 8 9 10-1
-0.8
-0.6
-0.4
-0.2
0
0.2
0.4
0.6
0.8
1
x
y
sin and cos Functionstitle
Y label
X label
Tick and tick label
lines
Axes
12
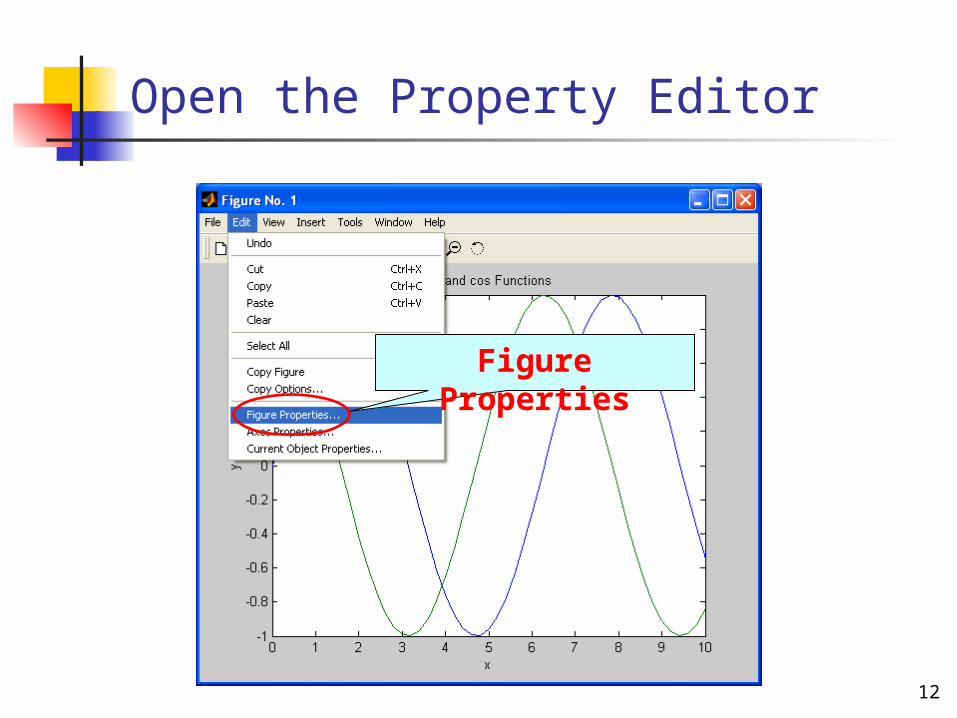
Open the Property Editor
Figure Properties
13
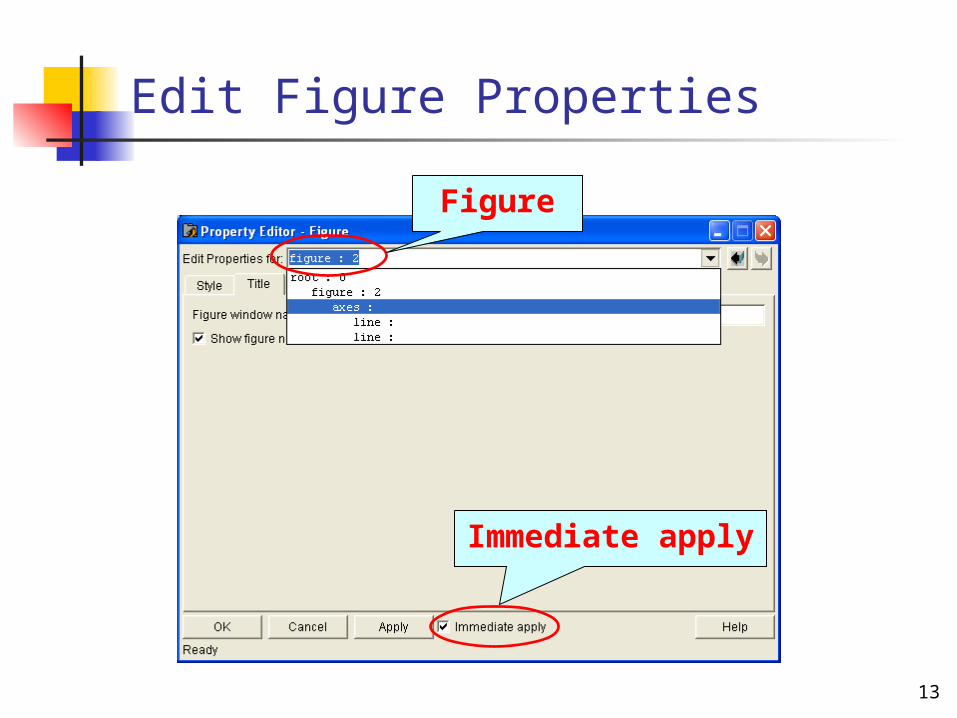
Edit Figure Properties
Figure
Immediate apply
14
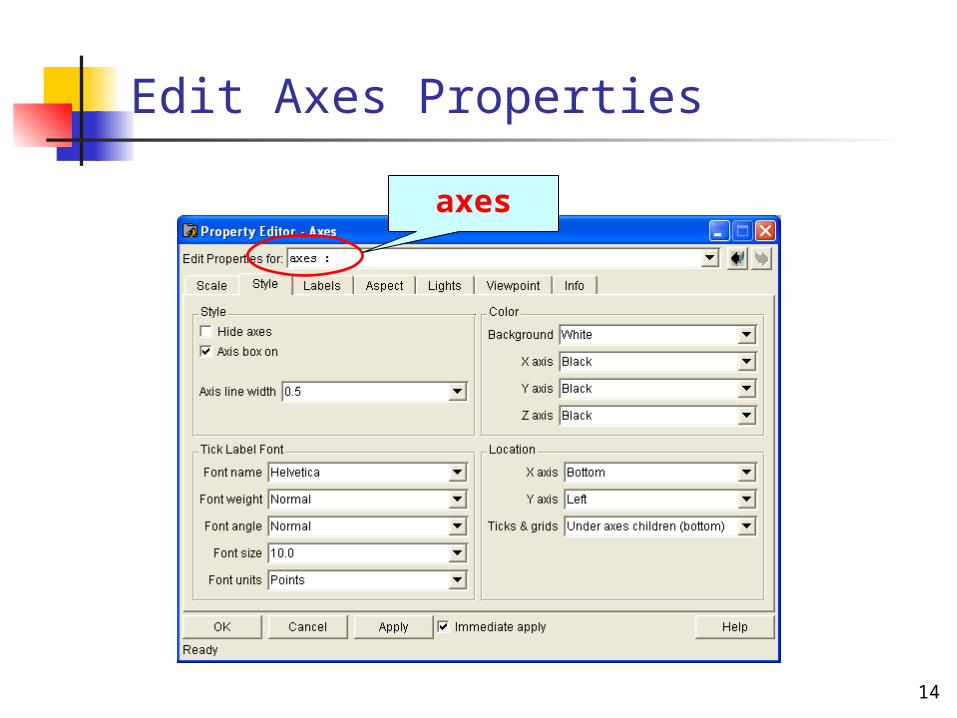
Edit Axes Properties
axes
15
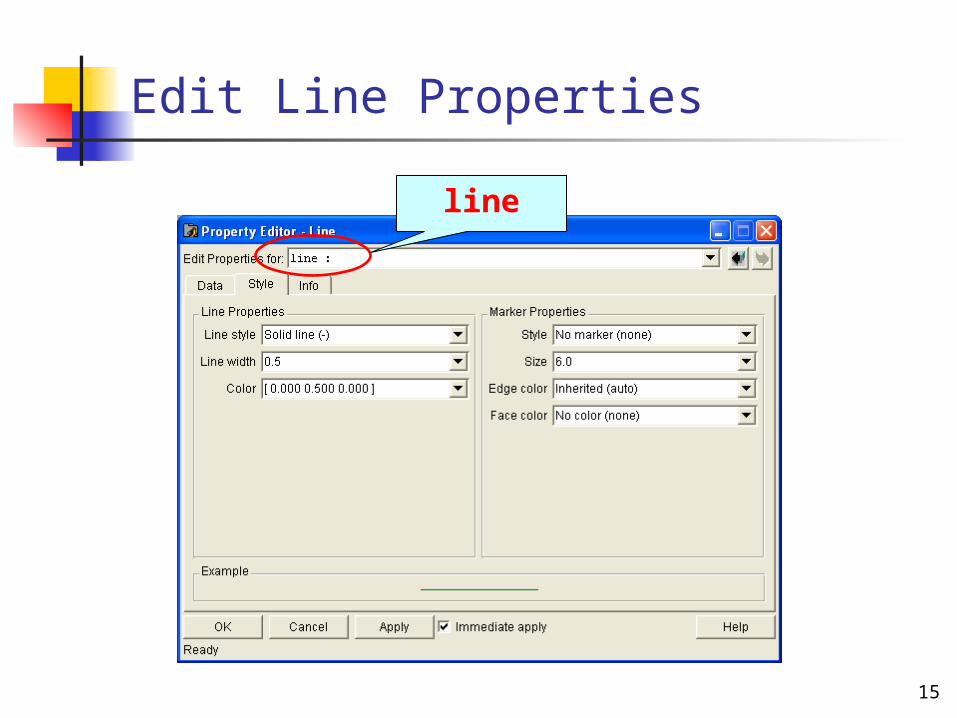
Edit Line Properties
line
16
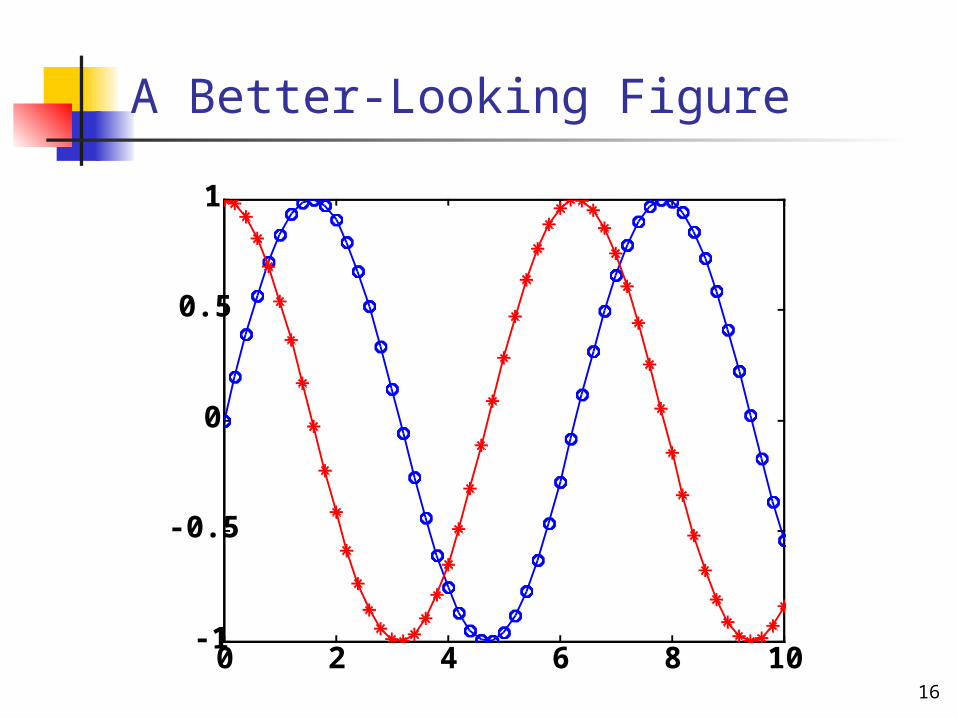
A Better-Looking Figure
0 2 4 6 8 10-1
-0.5
0
0.5
1
x
y
sin and cos Functions
17
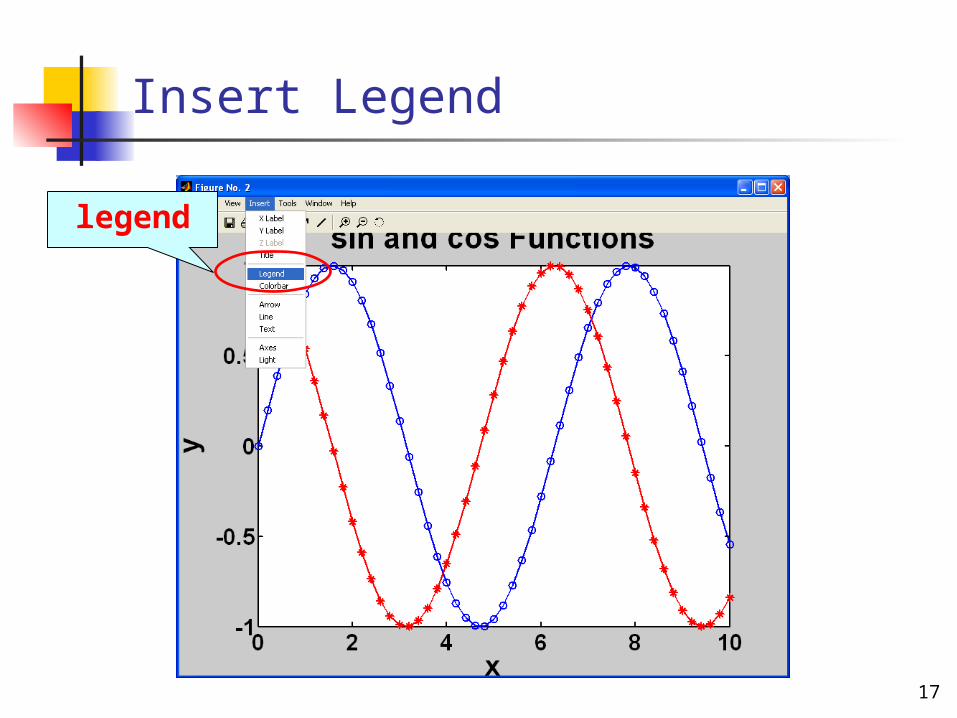
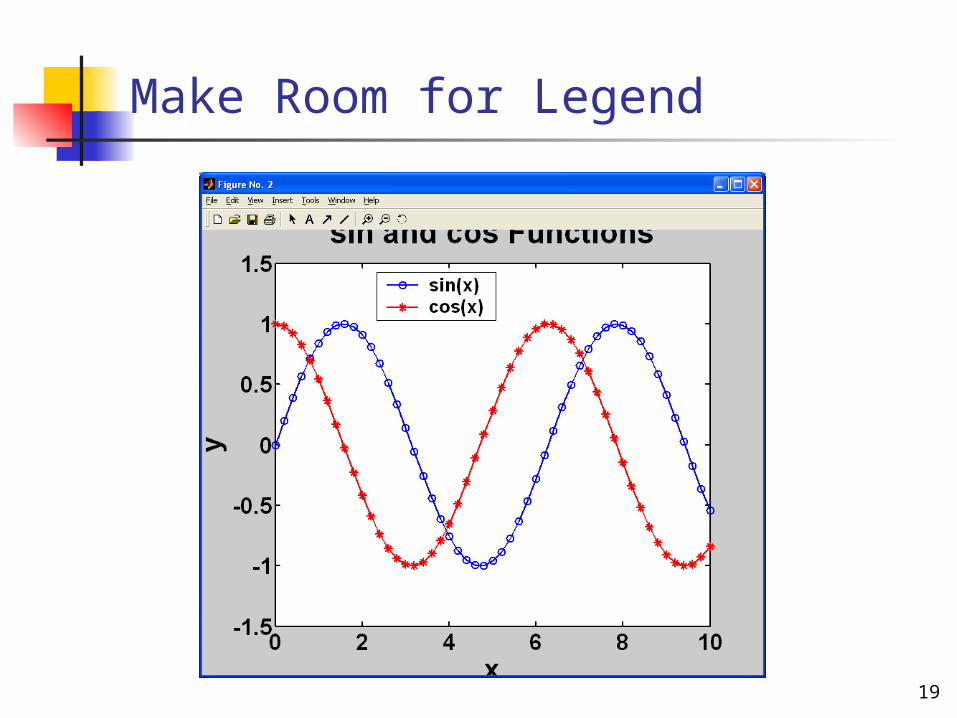
Insert Legend
legend
18
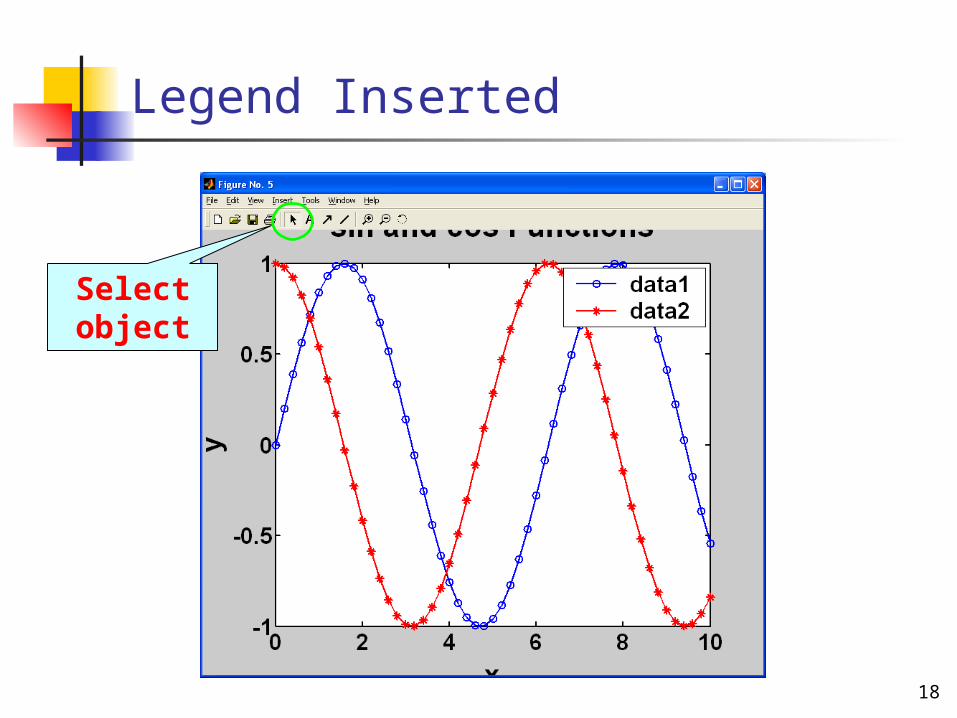
Legend Inserted
Select object
19
Make Room for Legend
20
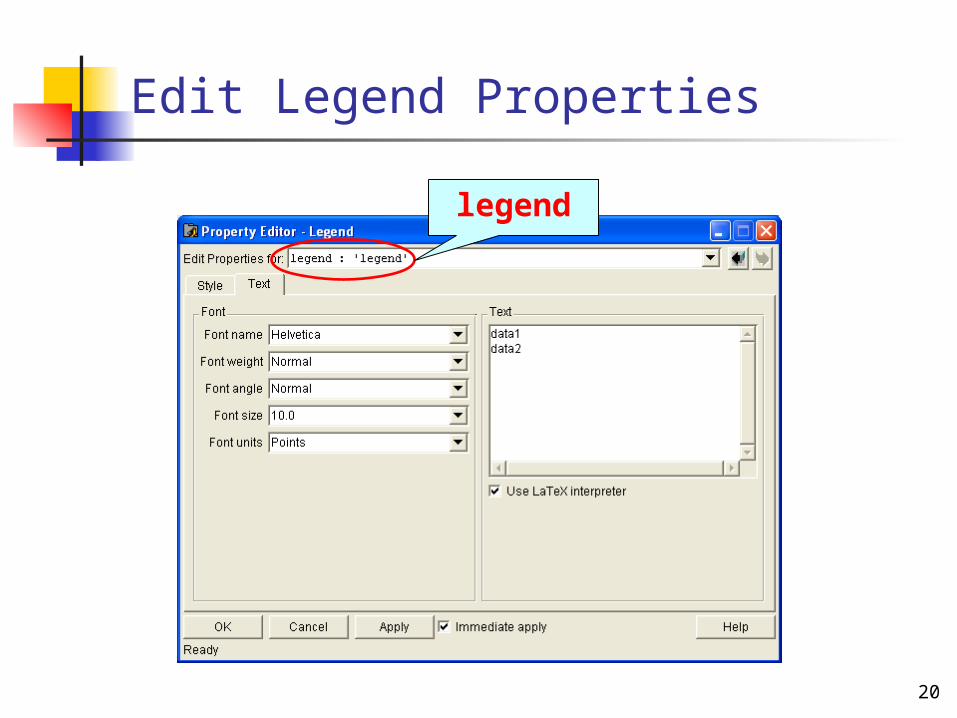
Edit Legend Properties
legend
21
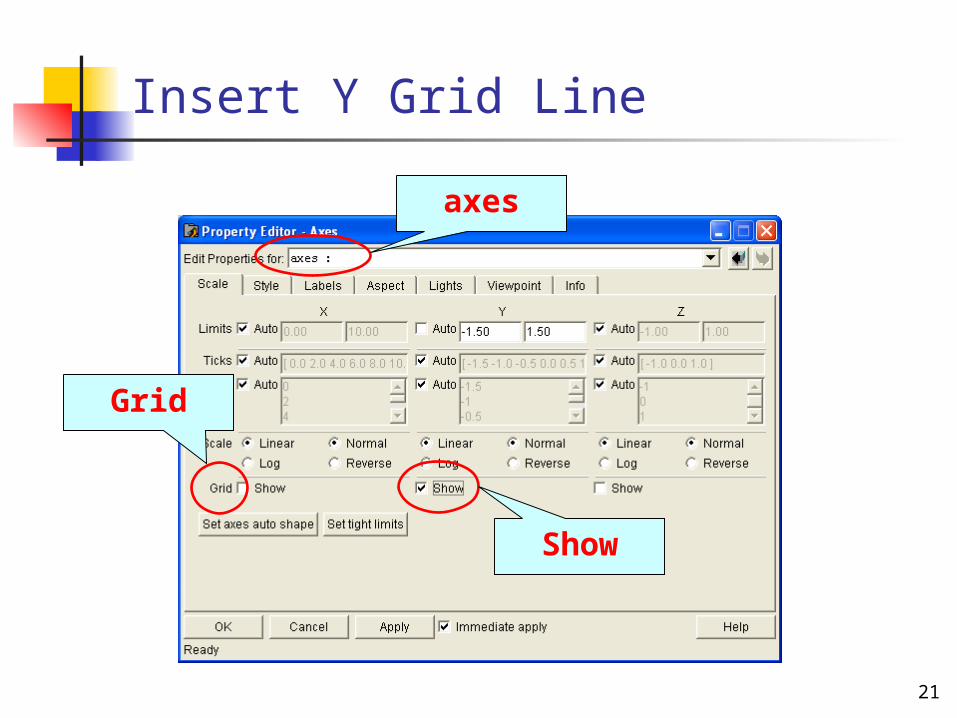
Insert Y Grid Line
axes
Grid
Show
22
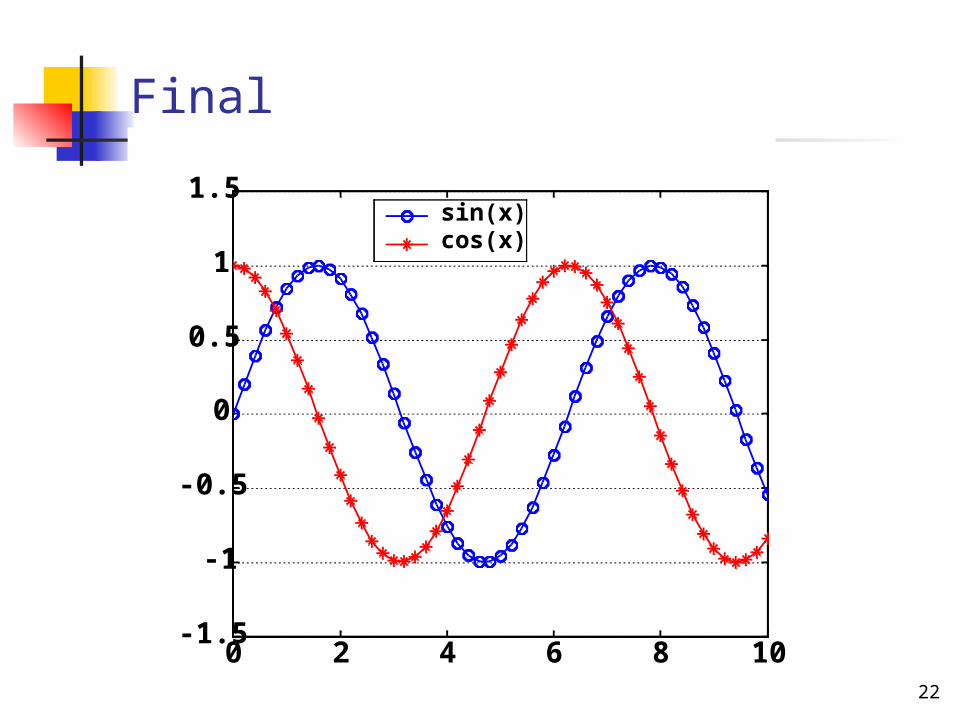
Final
0 2 4 6 8 10-1.5
-1
-0.5
0
0.5
1
1.5
x
y
sin and cos Functions
sin(x)cos(x)
23
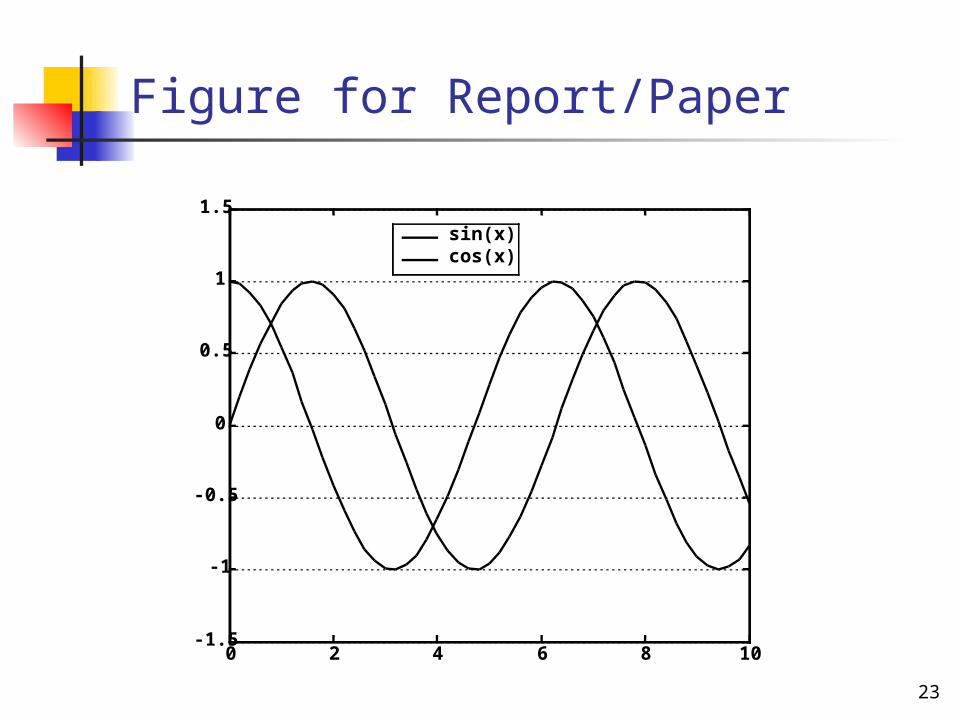
Figure for Report/Paper
0 2 4 6 8 10-1.5
-1
-0.5
0
0.5
1
1.5
x
y
sin and cos Functions
sin(x)cos(x)
24
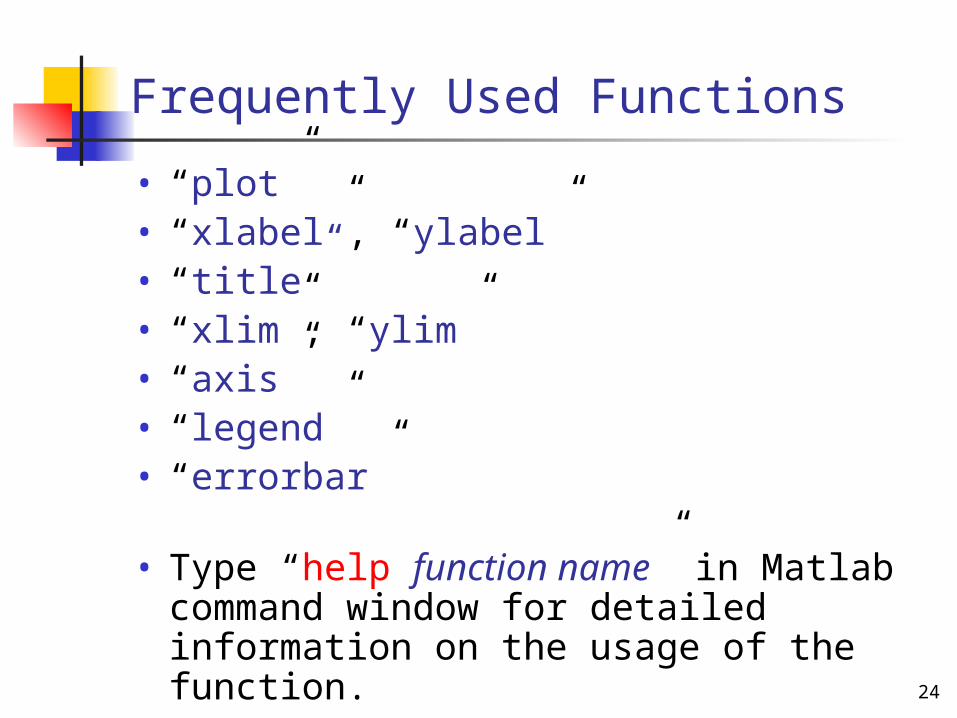
Frequently Used Functions
• “plot”• “xlabel”, “ylabel”• “title”• “xlim”, “ylim”• “axis”• “legend”• “errorbar”
• Type “help function name” in Matlab command window for detailed information on the usage of the function.
25
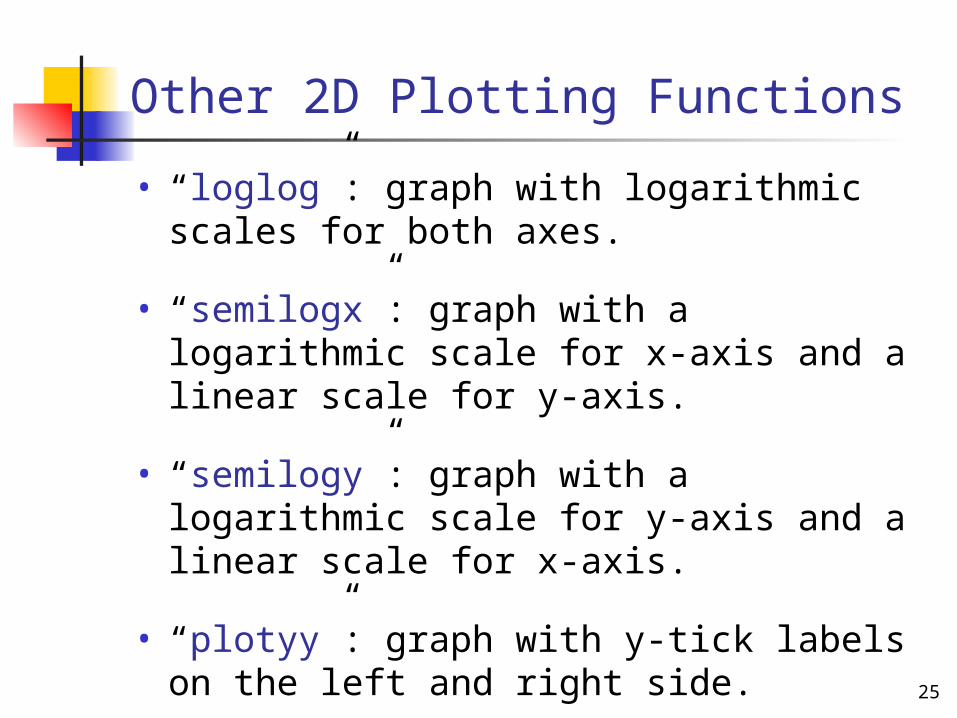
Other 2D Plotting Functions
• “loglog”: graph with logarithmic scales for both axes.
• “semilogx”: graph with a logarithmic scale for x-axis and a linear scale for y-axis.
• “semilogy”: graph with a logarithmic scale for y-axis and a linear scale for x-axis.
• “plotyy”: graph with y-tick labels on the left and right side.

26
A Whole Lot More …
• 2D contour “contour” “contourslice”
• 3D plots “plot3” “mesh” “surf”
• Movie “getframe” “movie”
27
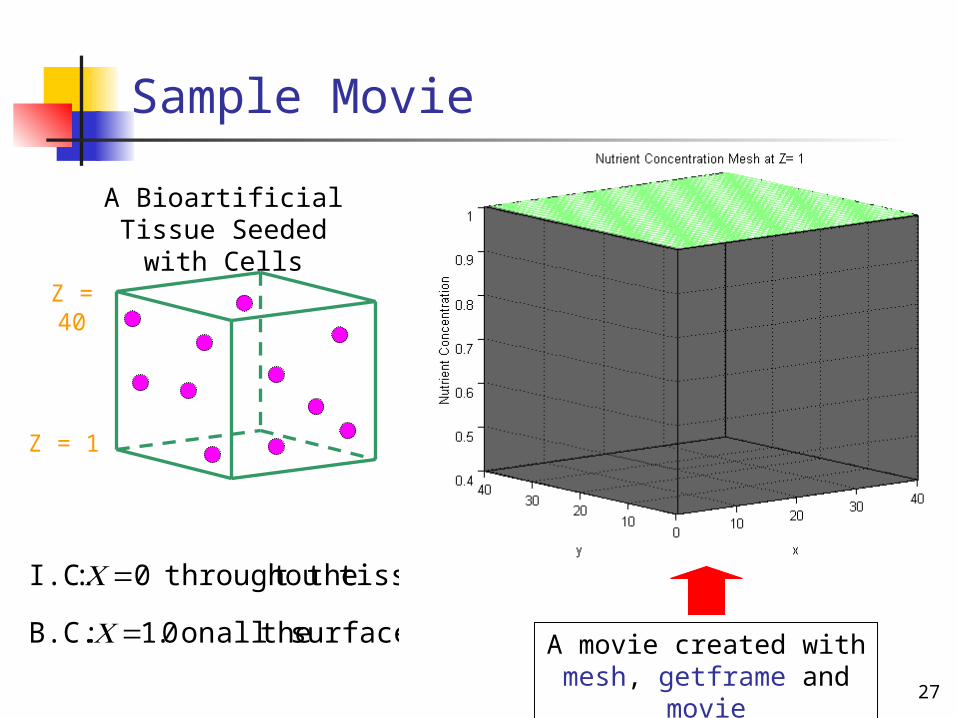
Sample Movie
surfaces theallon 0.1 : B.C.
tissuet the throughou0 :I.C.
=
=
C
C
A Bioartificial Tissue Seeded
with CellsZ = 40
Z = 1
A movie created with mesh, getframe and
movie