Embed Size (px)
Citation preview
M. Noelle Ridlehuber, Cecilia King, Jacob Bailey, Carson Haack, Jeremiah Webb
AEM 451
Due: 4/22/2015
Group Lab Assignment: Design Analysis of Stiffened Panel
Values calculated from the Boeing method were the basis of a stiffened panel design that
was built to withstand a compressive load in the experiment. The stiffened panel was then
tested and compared to the theoretical data from finite element simulations. The panel
withstood the compressive load required however, failed prior to the load at a 1.2 factor of
safety.
I. Introduction
This experiment tested the ability to design a stiffened panel that could withstand a 7500
lb compressive load with a safety factor of 1.2. The Boeing method was used for crippling stress
analysis of the panel. From this approximation method an optimal design was chosen considering
which design could first handle the load required and then with the lowest weight possible.
Design constraints were mandated such that the minimum aluminum sheet thickness was
.04 in, the minimum stiffener height was .5 in, and maximum sheet length of 6 in. Other
constraints included that the panel and stiffeners would be made from 2024-T3 aluminum, and
the rivets would be 1/8 in. aluminum. The panel and stiffeners were then designed and tested in
the lab. Finally a finite element analysis was completed using Solidworks. The FEA simulations
allow the comparison of the theoretical and experimental data.
II. Test Description
To begin the design process a z-stiffener was chosen for the panel because of its strength
and light weight. This decision was used to numerically solve the Gerard, Needham, and Boeing
methods. The data from the Boeing method was used because it is historically accurate.
The Gerard Method is an approximation method for determining the crippling strength of
a stiffener with the base unit being a flat plate. For a z-stiffener the equation derived from the
method is Equation 1 below.
(1)
To determine the force allowed the crippling stress was multiplied by the area of the
stiffener. This is the load that can be carried by one stiffener. Adding stiffeners multiplies the
allowable load to be carried.
The Needham Method is another design approximation for the crippling stress of a
stiffener. The base unit for the Needham method is an angle. For a z-stiffener the number of
angles needed will equal two.
(2)
(3)
Where a, b are the lengths of the top and bottom flanges of the stiffener. The value for Ce
is determine based on the boundary conditions for the angle section being considered. When
dealing with the multiple angles the crippling strengths are summed together and divided by the
sum of the areas.
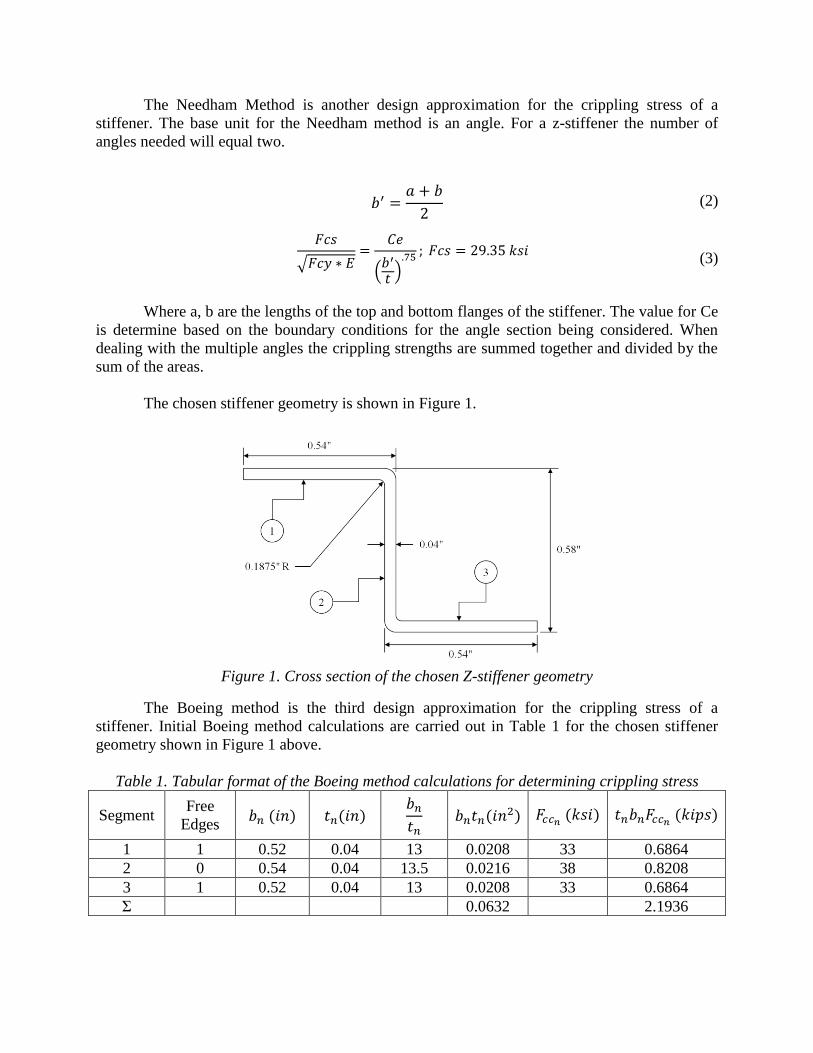
The chosen stiffener geometry is shown in Figure 1.
Figure 1. Cross section of the chosen Z-stiffener geometry
The Boeing method is the third design approximation for the crippling stress of a
stiffener. Initial Boeing method calculations are carried out in Table 1 for the chosen stiffener
geometry shown in Figure 1 above.
Table 1. Tabular format of the Boeing method calculations for determining crippling stress
Segment Free
Edges
1 1 0.52 0.04 13 0.0208 33 0.6864
2 0 0.54 0.04 13.5 0.0216 38 0.8208
3 1 0.52 0.04 13 0.0208 33 0.6864
Σ 0.0632 2.1936

The crippling stress is calculated with the following equation using values determined in
Table 1.
(4)
Two stiffeners large enough to support the load of 7500 lbs with a safety factor of 0.2
would weigh more than three stiffeners at this size. To minimize weight, three stiffeners were
chosen for the final design. The stiffener area was calculated with the following equation:
(5)
The total effective width of the sheet was calculated with the following equations:
(6)
(7)
(8)
Where is the effective width of the sheet where it is continuous and is the effective
width at the sheet ends. The effective sheet area and total effective area are calculated
with the following equations:
(9)
(10)
Based on this total effective area, the crippling load with safety factor of 20% is
calculated with the following equation:
(11)
This load is much greater than the assigned load of 7.5 kips, so in the final design some
sheet end width was given up. The actual effective width available in the design was 3.2605 in,
resulting in an actual crippling load of 8.886 kips.
From the equations above, Figure 2 was made for the machine shop.

Figure 2. Panel Dimensions
In order to design an optimal stiffened panel, it is necessary to evaluate the optimal
spacing between the rivets used to fasten the stiffeners to the skin. If the rivets are too far apart,
the skin and stiffener material will buckle between the rivet. If the rivets are too close, there is
danger of cracking due to a higher stress concentration near the rivets. Equation 12 was used to
determine the inter-rivet spacing using concepts related to the buckling of a column.
(12)
In Equation 12, σIR represents the inter-rivet stress, which is outlined in Equation 13. Et is
the tangent modulus, which for this particular alloy, was found to be about 15 ksi for the given
loading conditions[1]
. ρ is the radius of gyration of a single stiffener and the portion of skin
attached to it, and L is the space between the rivets. The radius of gyration was found using
Equation 14, where I, the moment of inertia of the cross section of a single riveted stiffener, was
calculated to be 0.0044507 in4 and the area A to be .0740619 in
4.
(13)
(14)
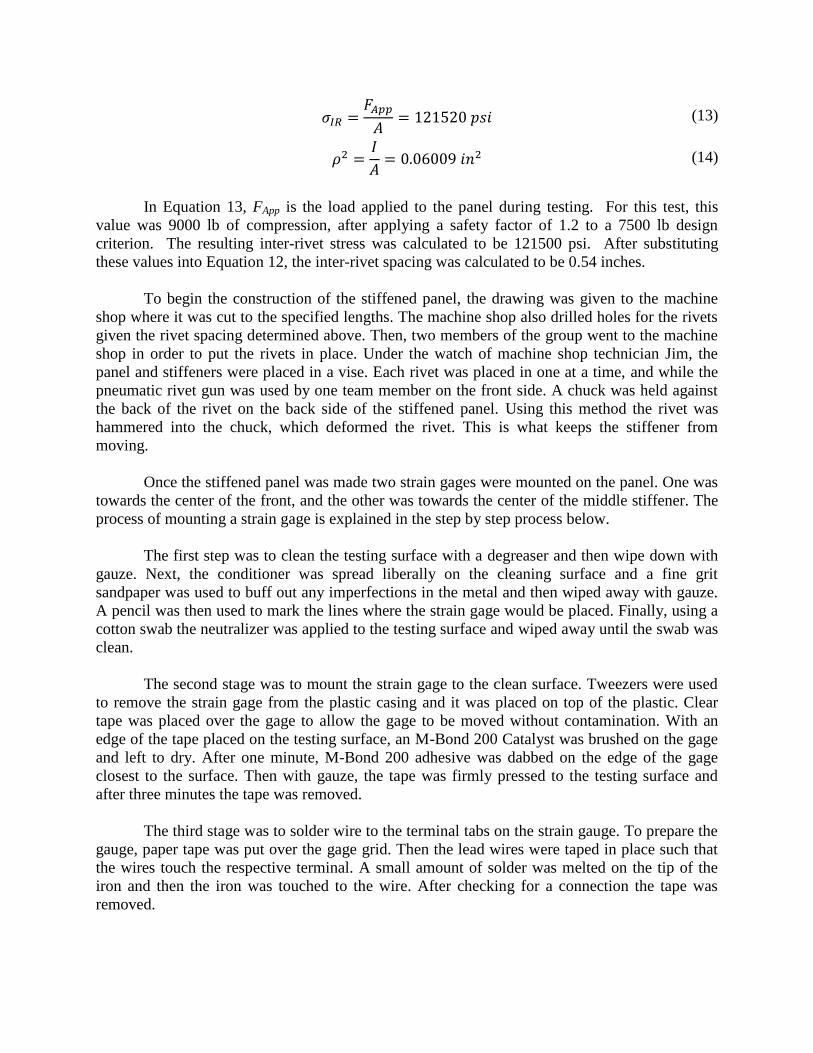
In Equation 13, FApp is the load applied to the panel during testing. For this test, this
value was 9000 lb of compression, after applying a safety factor of 1.2 to a 7500 lb design
criterion. The resulting inter-rivet stress was calculated to be 121500 psi. After substituting
these values into Equation 12, the inter-rivet spacing was calculated to be 0.54 inches.
To begin the construction of the stiffened panel, the drawing was given to the machine
shop where it was cut to the specified lengths. The machine shop also drilled holes for the rivets
given the rivet spacing determined above. Then, two members of the group went to the machine
shop in order to put the rivets in place. Under the watch of machine shop technician Jim, the
panel and stiffeners were placed in a vise. Each rivet was placed in one at a time, and while the
pneumatic rivet gun was used by one team member on the front side. A chuck was held against
the back of the rivet on the back side of the stiffened panel. Using this method the rivet was
hammered into the chuck, which deformed the rivet. This is what keeps the stiffener from
moving.
Once the stiffened panel was made two strain gages were mounted on the panel. One was
towards the center of the front, and the other was towards the center of the middle stiffener. The
process of mounting a strain gage is explained in the step by step process below.
The first step was to clean the testing surface with a degreaser and then wipe down with
gauze. Next, the conditioner was spread liberally on the cleaning surface and a fine grit
sandpaper was used to buff out any imperfections in the metal and then wiped away with gauze.
A pencil was then used to mark the lines where the strain gage would be placed. Finally, using a
cotton swab the neutralizer was applied to the testing surface and wiped away until the swab was
clean.
The second stage was to mount the strain gage to the clean surface. Tweezers were used
to remove the strain gage from the plastic casing and it was placed on top of the plastic. Clear
tape was placed over the gage to allow the gage to be moved without contamination. With an
edge of the tape placed on the testing surface, an M-Bond 200 Catalyst was brushed on the gage
and left to dry. After one minute, M-Bond 200 adhesive was dabbed on the edge of the gage
closest to the surface. Then with gauze, the tape was firmly pressed to the testing surface and
after three minutes the tape was removed.
The third stage was to solder wire to the terminal tabs on the strain gauge. To prepare the
gauge, paper tape was put over the gage grid. Then the lead wires were taped in place such that
the wires touch the respective terminal. A small amount of solder was melted on the tip of the
iron and then the iron was touched to the wire. After checking for a connection the tape was
removed.

Once both strain gages were mounted it was placed in a machine that measures the
compressive load, and then lowers the load once the panel has yielded. Figure 3 shows the
stiffened panel prior to the compressive load being applied. Figure 4 and Figure 5 show the
wrinkling of the panel after the compressive load was applied.
Figure 3. Compression Load Experiment

Figure 4. Aft Wrinkling from Compression Experiment
Figure 5. Stiffener Deformation due to Compressive Loading
III. Discussion of Results
Once the experiment was completed, finite element analysis (FEA) was completed on the
panel using Solidworks. This was to allow a comparison of expected versus actual data for key
parameters. Figure 6 and Figure 7 is the Solidworks model of the stiffened panel prior to a
compressive load being added.
Figure 6. Solidworks model of Stiffened Panel- Top View
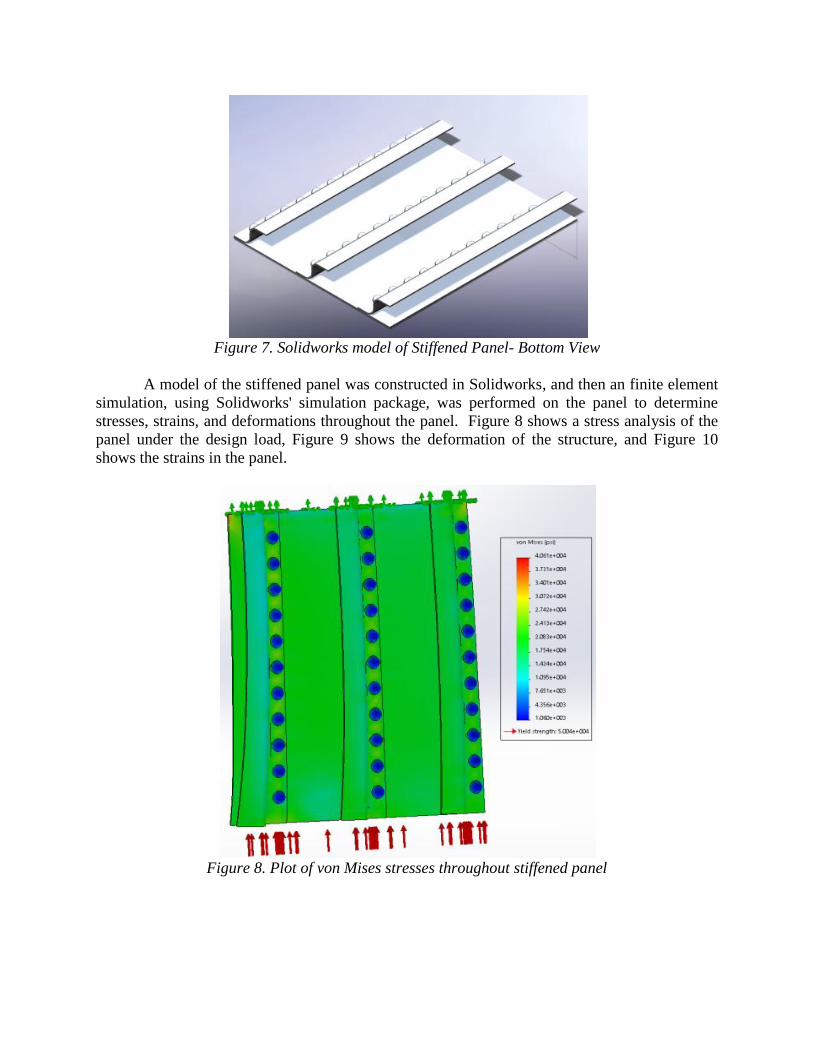
Figure 7. Solidworks model of Stiffened Panel- Bottom View
A model of the stiffened panel was constructed in Solidworks, and then an finite element
simulation, using Solidworks' simulation package, was performed on the panel to determine
stresses, strains, and deformations throughout the panel. Figure 8 shows a stress analysis of the
panel under the design load, Figure 9 shows the deformation of the structure, and Figure 10
shows the strains in the panel.
Figure 8. Plot of von Mises stresses throughout stiffened panel
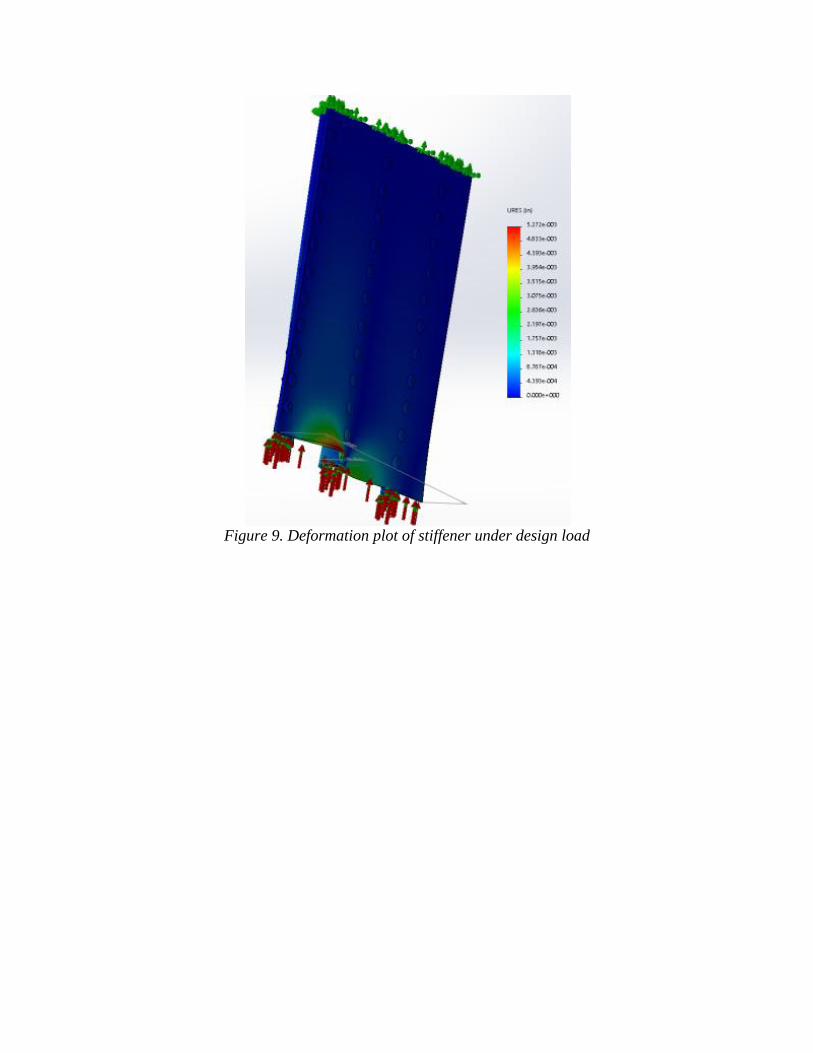
Figure 9. Deformation plot of stiffener under design load

Figure 10. Plot of second principal strain throughout the panel
From these figures above, it can be determined that the stress in the deformed areas of the
panel is on the order of 20000 psi. The deformation plot gives a resultant displacement of only
about .005 inches, which is rather small of a displacement for this design load, considering
buckling is expected to occur; however, the deformation nature appears to match the physical
panel after testing. The deformation is concentrated near the bottom on the side where the rivets
are closer to the boundary of the panel. From Figure 10, the highest second principal strains
occur both in that same spot of notable deformation and the between the rivets on that side, with
a magnitude of about 761µ.
From the figure below, the experimental maximum load is determined to be
approximately 8600 lbs. Also at this max value of the load, the compressive value of the strain is
6061με.

Figure 11. Load Deflection Diagram
As explained with the Gerard Method, for a two-corner section z-section, Equation 1
applies within ten percent limits. Given the inputs of the designed stiffener and experimental
outputs, the crippling stress is 10.7 ksi. Additionally, the total crippling load is given by the
equation below.
(15)
In a riveted sheet-stiffener pane with relatively large rivet spacing, the sheet will buckle
between rivets. If it is assumed that the sheet acts as a wide column clamped at its ends and
length is equal to the spacing, the inter-rivet buckling stress equation is listed below. The end
fixity coefficient is denoted by c. The sheet buckling does not deform the flange of the stiffener
to which the sheet is attached. In general, the inter-rivet buckling stress equation is listed below.
(16)
However, if the rivet is such as to prevent inter-rivet buckling of the sheet, then failure
often occurs by a larger wrinkling of the sheet. The larger wrinkle shape subjects the flange of
the stiffener to which the sheet is attached to lateral forces. Because of this, the stiffener flange
is likely to deform with the sheet wrinkly shape. Wrinkling failure is a combination of sheet and
stiffener failure. In general, the equation for wrinkling failing stress is listed below.
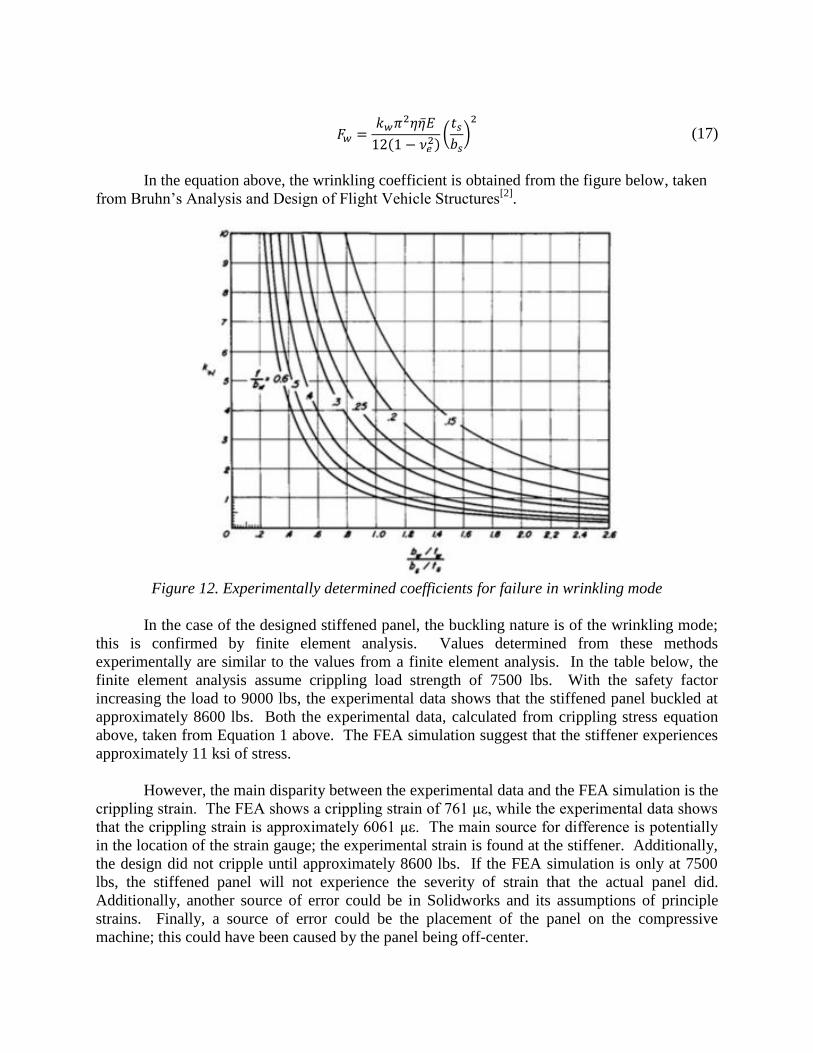
(17)
In the equation above, the wrinkling coefficient is obtained from the figure below, taken
from Bruhn’s Analysis and Design of Flight Vehicle Structures[2]
.
Figure 12. Experimentally determined coefficients for failure in wrinkling mode
In the case of the designed stiffened panel, the buckling nature is of the wrinkling mode;
this is confirmed by finite element analysis. Values determined from these methods
experimentally are similar to the values from a finite element analysis. In the table below, the
finite element analysis assume crippling load strength of 7500 lbs. With the safety factor
increasing the load to 9000 lbs, the experimental data shows that the stiffened panel buckled at
approximately 8600 lbs. Both the experimental data, calculated from crippling stress equation
above, taken from Equation 1 above. The FEA simulation suggest that the stiffener experiences
approximately 11 ksi of stress.
However, the main disparity between the experimental data and the FEA simulation is the
crippling strain. The FEA shows a crippling strain of 761 με, while the experimental data shows
that the crippling strain is approximately 6061 με. The main source for difference is potentially
in the location of the strain gauge; the experimental strain is found at the stiffener. Additionally,
the design did not cripple until approximately 8600 lbs. If the FEA simulation is only at 7500
lbs, the stiffened panel will not experience the severity of strain that the actual panel did.
Additionally, another source of error could be in Solidworks and its assumptions of principle
strains. Finally, a source of error could be the placement of the panel on the compressive
machine; this could have been caused by the panel being off-center.
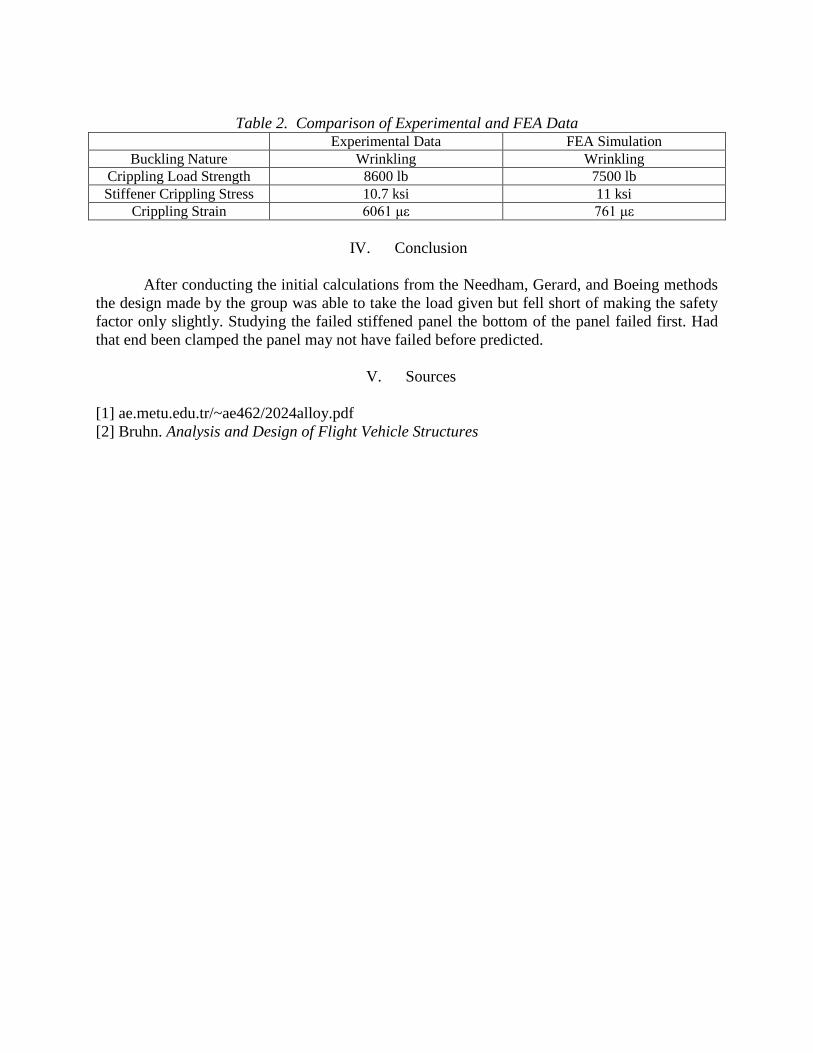
Table 2. Comparison of Experimental and FEA Data Experimental Data FEA Simulation
Buckling Nature Wrinkling Wrinkling
Crippling Load Strength 8600 lb 7500 lb
Stiffener Crippling Stress 10.7 ksi 11 ksi
Crippling Strain 6061 με 761 με
IV. Conclusion
After conducting the initial calculations from the Needham, Gerard, and Boeing methods
the design made by the group was able to take the load given but fell short of making the safety
factor only slightly. Studying the failed stiffened panel the bottom of the panel failed first. Had
that end been clamped the panel may not have failed before predicted.
V. Sources
[1] ae.metu.edu.tr/~ae462/2024alloy.pdf
[2] Bruhn. Analysis and Design of Flight Vehicle Structures