Embed Size (px)
Citation preview

Lyme Disease Surveillance in North
Carolina 2008-2014
Carl Williams DVM Megan Sanza MPH
Communicable Disease Branch Division of North Carolina Public Health

Lyme Disease Surveillance in North Carolina 2008-2014
• Wake AHEC requires all speakers to disclose any relevant financial conflicts of interest.
• Carl Williams and Megan Sanza have no relevant financial conflicts of interest to disclose.

Objectives 1. Review Lyme disease (LD) basics (brief) 2. Present surveillance findings, 2008-2014
3. Look at data completeness, accuracy, and reporting processes 4. Suggestions for improving Lyme Disease reporting

Overview • Tick-borne illness caused by Borrelia burgdorferi • Symptoms may vary significantly • Early manifestation 3-30 days following tick bite
o Fatigue, chills, fever, HA, muscle and joint aches o Erythema migrans (EM) rash
• Dissemination/late manifestation if not treated early o May affect heart, joints, nervous system
• Cases caught early enough can be treated successfully with antibiotics; however 10-20% of patients experience symptoms that persist after antibiotics (PTLDS)

Post-treatment Lyme Disease Syndrome (PTLDS)
• In 10-20% of treated patients, symptoms can linger months to years after treatment with antibiotics
• Symptoms may include muscle and joint pains, cognitive difficulties, sleep disturbances or fatigue
• The cause for these symptoms is unknown • Some evidence to suggest caused by autoimmune response
(infection cleared, but person’s immune system still responding)
• Studies show continuing antibiotic therapy is not helpful
http://www.cdc.gov/lyme/signs_symptoms/index.html

LD Case Definition • For most N.C. counties, case definition is met by having both
clinical and lab requirements met. • N.C. counties designated as endemic no longer need lab
requirements met if EM rash is present (Haywood, Wilkes, Guilford, Alleghany, Wake)
• Physician diagnosis of disease is acceptable if clinical criteria is not met (will still need lab criteria met).
If you feel you need assistance understanding LD case investigation, surveillance requirements or laboratory testing please contact Jodi Reber at (919) 715-5416.

Lyme Disease in North Carolina
2013 Incidence Rate per 100,000 = 0.4 (CDC) • Fairly low incidence, but significant public interest • Treatment for each case is not always timely
2004 2005 2006 2007 2008 2009 2010 2011 2012 2013 Pennsylvania 32.1 34.6 26.1 32.1 30.7 39.3 26 37.2 32.5 39
Maryland 16 22.1 22.2 45.8 31 25.7 20.1 16.1 18.9 13.5 Virginia 2.9 3.6 4.7 12.4 11.4 8.9 11.4 9.3 9.8 11.2
West Virginia 2.1 3.4 1.5 4.6 6.6 7.9 6.9 5.8 4.4 6.3 Georgia 0.1 0.1 0.1 0.1 0.4 0.4 0.1 0.3 0.3 0.1
South Carolina 0.5 0.4 0.5 0.7 0.3 0.5 0.4 0.5 0.7 0.7 North Carolina 1.4 0.6 0.4 0.6 0.2 0.2 0.2 0.2 0.3 0.4
Tennessee 0.3 0.1 0.2 0.5 0.1 0.2 0.1 0.1 0 0.2 U.S. Incidence 6.7 7.9 8.2 9.1 9.4 9.8 7.3 7.8 7 8.6

Surveillance Data Notes • Very broad range of clinical manifestations
o Large investigation effort with low yield of reporting (for 2014, 866 cases investigated in NC EDSS with only 172 reported ….20%)
o EM rash indicative of early disease o EM observed by HCP is most reliable indicator of true Lyme disease
• Source of illness identification dates vary o Symptom onset, laboratory testing, date of diagnosis by HCP, date of report to public
health
• Data presented for confirmed and probable cases where applicable, but only confirmed presumed to have true disease
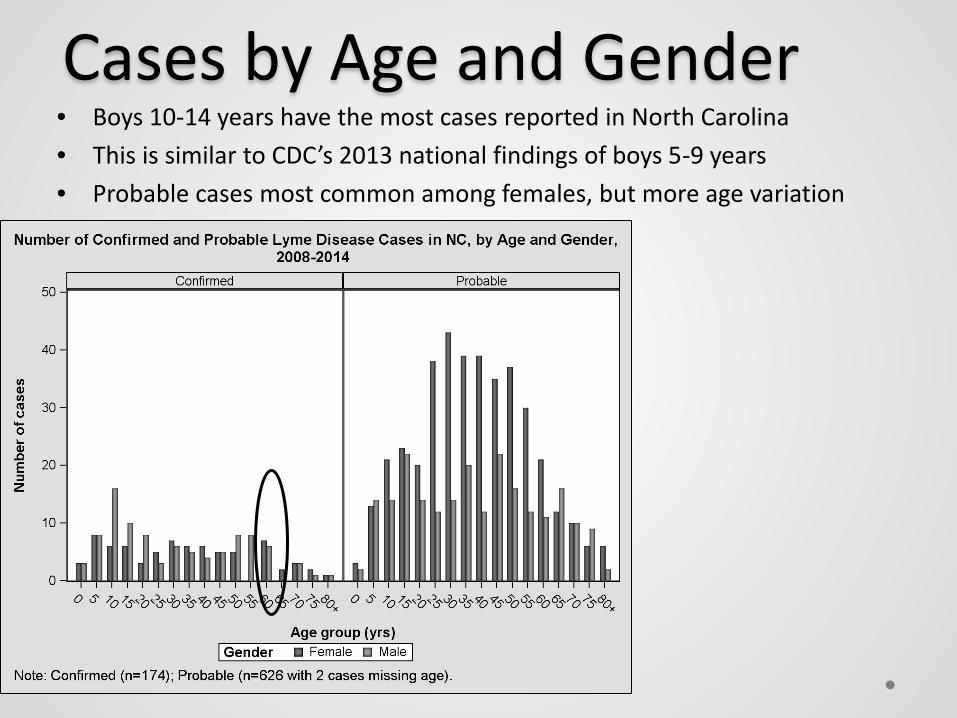
Cases by Age and Gender • Boys 10-14 years have the most cases reported in North Carolina • This is similar to CDC’s 2013 national findings of boys 5-9 years • Probable cases most common among females, but more age variation

Case Reporting Since 2008 • Probable case definition first introduced in 2008 • After 2009, fewer cases classified as Suspect
New case definition

Source of Initial Report to Public Health
• Lyme disease identified through a variety of sources in North Carolina • ELR feeds are by far the most common source - limited case information

Cases by Illness Identification Date Category
• Confirmed cases have a larger proportion symptom onset illness ID dates; more complete information

Cases Reported by Year • Steady increase among probable cases since 2008 • Confirmed case numbers fairly consistent 2008-2014, with
slight increases over the last 3 years

Cases Reported by Month • Most cases reported during summer months, May-September • Clear seasonality similar to national data, more notable
among confirmed cases
June/July illness identification

Cases by County • Endemic county = 2 or more confirmed cases with no known
travel during 32 days prior to onset • 5 counties: Alleghany, Guilford, Haywood, Wake, Wilkes

Reported Symptoms • EM rash most common, followed by musculoskeletal • Consistent with national CDC findings through 2013

Cases by Provider Diagnosis • Probable case definition added in 2008, requires provider
diagnosis (100% of cases beginning in 2012) • 80% of confirmed cases have a provider diagnosis

Cases by Onset and Year • Most cases are acute onset cases; more apparent 2008-2011 • 2012 is an exception with almost 80% of late manifestations
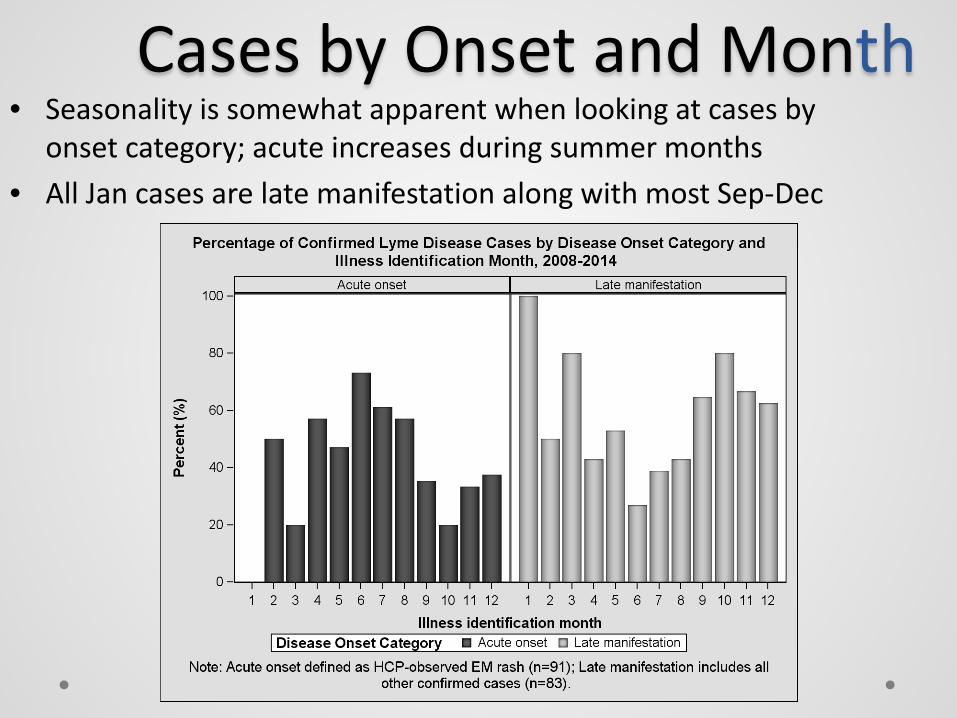
Cases by Onset and Month • Seasonality is somewhat apparent when looking at cases by
onset category; acute increases during summer months • All Jan cases are late manifestation along with most Sep-Dec

Data Reporting and Data Quality
• Most cases are initially reported through ELR feeds; patient information often sparse
• Provider communication is encouraged but always fruitful; patient interviews for LD are less common than other diseases
• Use 2008-2014 data to look more closely at data flow and entry for LD events in NC EDSS
• Analyze missing key fields and variation in how data have been entered
• Underlying goal to improve efficiency of data entry and completeness and quality of data

Data Completeness: Demographics
Number Missing (%) - PROBABLE
Number Missing (%) - CONFIRMED
AGE 2 (12) 0
GENDER 1 (2) 1 (.5)
RACE 19 (3) 2 (1)
• Confirmed case data more complete than probable, as might be expected
• Race is most common missing demographic

Why Cases Were Tested for Lyme Disease
*Of these 8, 5 had notes that indicated LD symptoms were present.
Reason Selected for Testing Number Tested (%)
No reason selected 30 (17%)
Symptomatic of disease 128 (74%)
Symptomatic of disease; Tick bite without symptoms of disease
9 (5%)
Tick bite without symptoms of disease 19 (3)
Other* 8 (5%)

Improvements to Data Collection
• Source of illness Identification date: o Best is illness onset date; if unknown, use lab testing date o Avoid using Date of Report to Public Heath
• Is patient symptomatic for disease? o If Lyme disease testing is for a general screen then the answer is no.
• EM rash must have a size to count and be diagnosed by the physician. o EM rash must be greater than 5cm
• Illness greater than 30 days should have a positive IgG Western Blot lab…or it may not be counted.
• Must answer the “Did Patient Survive” question in clinical package.

Improvement to Data Collection
• If a non-endemic county has a new case of locally acquired LD
(EM rash + Labs), DPH would like to confirm labs by having IgG Western Blot run if not already done.
• Free laboratory testing can be performed at CDC for these cases. o Locality can perform testing and send to CDC via NC SLPH. (Locality must decide if they
will perform venipuncture at no charge) o Results can take some time and are only used for surveillance purposes o A negative result will not change case classification from original lab results

Physician and Public Outreach
• DPH provides a yearly memos to provider to discuss LD and the other tick and mosquito illness present in N.C. Please distribute these to the providers in your community. These memos are available on our websites at: http://epi.publichealth.nc.gov/cd/arbo/providers.html and http://epi.publichealth.nc.gov/cd/ticks/lhds.html
• DPH has tickborne booklets available for provider use • Tickborne posters are also available that should be widely
utilized in physicians offices , parks, outdoor trails, etc. (Please see Jodi at the handouts booth)

Summary • Surveillance numbers appropriately reflect revised case
definition after 2008 • Confirmed cases static since 2008 • Late manifestation diagnoses have increased since 2008;
highest in 2012 • North Carolina case distribution mimics expected seasonality
of LD • Similar demographic and symptom distribution 2008-2014 to
national findings 2001-2010 • Challenges with regard to diagnosis and exposure information

Resources
• NC EDSS • http://www.cdc.gov/lyme/index.html • http://epi.publichealth.nc.gov/cd/ticks/lhds.html