Embed Size (px)
Citation preview

International Journal of Engineering Sciences &
Research Technology (A Peer Reviewed Online Journal)
Impact Factor: 5.164
IJESRT
Chief Editor Executive Editor
Dr. J.B. Helonde Mr. Somil Mayur Shah
Website:www.ijesrt.com Mail: [email protected] O
IJESRT: 8(2), February, 2019 ISSN: 2277-9655
I X
ISSN: 2277-9655
[BORO * et al., 8(2): February, 2019] Impact Factor: 5.164
IC™ Value: 3.00 CODEN: IJESS7
http: // www.ijesrt.com© International Journal of Engineering Sciences & Research Technology
[37]
IJESRT is licensed under a Creative Commons Attribution 4.0 International License.
IJESRT INTERNATIONAL JOURNAL OF ENGINEERING SCIENCES & RESEARCH
TECHNOLOGY STATISTICAL ANALYSIS OF WIND DATA AND ASSESSMENT OF WIND POTENTIAL
IN BURKINA FASO
Drissa BORO*1, Willy Magloire NKOUNGA2, Mouhamadou Falilou NDIAYE2, Mamadou
Lamine NDIAYE2, Florent P. KIENO1 & Joseph D. BATHIEBO1 *1Laboratoire d’Energies Thermiques Renouvelables(L.E.T.RE), Université Ouaga 1 Pr Joseph KI-
ZERBO 03 BP 7021 Ouagadougou 03, Burkina Faso. 2Centre International de Formation et de recherche en Energie Solaire (C.I.F.R.E.S), ESP BP: 5085
Dakar, Sénéga
DOI: Will get Assigned by IJESRT Team
ABSTRACT This paper reports the assessment of Burkina Faso wind potential. To achieve this, measurements were made
over a period of 11 years (2006-2016) by Burkina Faso National Meteorological Agency (ANAM) using an
anemometer established on a 10m mat above the ground. Weibull distribution was used to model the average
monthly and annual wind speed. A comparative study by Weibull on three parameter estimation methods (shape
and scale parameter) is presented in order to minimize errors in estimating the power and energy density
available on ten sites in Burkina Faso. These include the standard deviation method (empirical method), the
energy pattern factor and the maximum likelihood. The results of the study show that the average monthly wind
speed at 10 m above the ground varies from a minimum of 0.61 ms-1 at Dori (September) to a maximum of 3.57
m.s-1 in Bobo (May). The minimum and maximum annual average speeds are recorded at Dori, 1.06 m.s-1 and
Bobo-Dioulasso, 3.02 m.s-1, respectively. The standard deviation method and the maximum likelihood method
give the best overall adjustment of the actual wind data distribution. Weibull parameter estimation results show
that the shape parameter varies between 1.47 at Dédougou (June) and 5.11 in Bobo-Dioulasso (January) while
the scale parameter varies between 0.68 m.s-1 at Dori (October) and 3.90 m.s-1 (May) in Bobo-Dioulasso. The
average annual value of the scale parameter varies from 1.19 m.s-1 (Dori) to 3.34 m.s-1 (Bobo-Dioulasso) while
the average annual value of the shape parameter varies from 1.66 (Dori) to 3.77 (Bobo). The results of the
average monthly power density show that the minimum value of 0.3390 W / m2 is recorded at Dori (November)
while the maximum value of 34.5070 W / m2 is recorded in Bobo-Dioulasso (May). On an annual scale, the
results of the average annual power density vary from a minimum value of 1.794 W / m2 on the Boromo site to a
maximum value of 22.529 W/m2 for that of Bobo-Dioulasso. Statistical indicators show that the maximum
likelihood method and the standard deviation method best adjust the real wind data with a determination
coefficient (2R ) and an average squared error (RMSE) higher than 0.95 and less than 1.5, respectively for all
study sites.
KEYWORDS: Wind, wind potential, Weibull distribution, power density, standard deviation, maximum
likelihood.
1. INTRODUCTION The development of any human activity implies energy consumption[1]. The increasing demand for energy
coupled with the depletion of fossil fuels in the more or less long term together with the increase in
environmental pollution, lead countries throughout the world to gradually move towards new and renewable
energies. Least developed countries in the world, endowed with renewable resources, are the most affected by
the global energy crisis[2]. Burkina Faso is one of the countries the most affected by an acute energy crisis. It is
estimated that electricity demand increases by an average of 13 yearly while the average annual growth rate of
Burkina Faso National Electricity Company (SONABEL) is 10 [3]. Considering the energy deficit, it is
ISSN: 2277-9655
[BORO * et al., 8(2): February, 2019] Impact Factor: 5.164
IC™ Value: 3.00 CODEN: IJESS7
http: // www.ijesrt.com© International Journal of Engineering Sciences & Research Technology
[38]
IJESRT is licensed under a Creative Commons Attribution 4.0 International License.
necessary and even urgent that Burkina Faso find alternate solutions to cover energy demand with a clean source
of energy. One of the possibilities that we review through this study consists in assessing the wind resource for
decision-making on a possible implementation of wind power generation systems. With the stochastic nature of
the wind resource, engineers in the field rely most often on mathematical models to predict the energy available
in the wind [4]. To do so, it is important to find an appropriate statistical model of wind speed distribution
frequency to predict the resource. Wind turbine manufacturers use information obtained from speed distribution
to optimize their design and minimize power generation costs [5]. However, investors need this information to
plan wind farm productivity. Over these recent years, several distribution functions are developed and tested by
several researchers around the world. Among these, Weibull distribution function with two parameters (shape
parameter and scale parameter) developed in 1951 by Waloddi Weibull [2] is one of the most widely used
functions [6]. Several studies have assessed and analyzed the performance of various probability distribution
functions to identify those best suited to wind energy applications. To compare theses distribution functions,
several statistical indicators of model performance are used in literature, such as the coefficient of determination
(2R ), the root mean square error (RMSE), the relative error percentage, etc. Yilmaz et al (2008) [7] conducted a
comparative study of ten probability density functions (beta, Erlang, exponential, gamma, log-logistic, normal
log, Pearson V, Pearson VI, uniform and Weibull). They found that Weibull is better fit to wind speed in the
study area in Turkey. We also mention Carta et al. (2009) [8] who examined the use of various probability
distribution functions of wind speed at four stations on the Canary Islands. Their results showed that Weibull's
function offers advantages over several other distribution functions. However, its disadvantage is that it cannot
accurately estimate the distribution of wind speed in places with high percentages of zero wind speeds. Sohoni
et al. (2016) [9] also compared the distribution of Rayleigh, Gamma, Weibull, log-normal and inverse Gaussian
in India. They reported that Weibull has minimal errors. Wais (2017) [10] conducted a study on the applicability
of the Weibull distribution to two and three parameters (shape, scale and location) in wind energy analysis and
also on the comparison of different probability density functions. The results show that for the higher rate of
wind speed equal to zero or less than 2 m.s-1,the three-parameter Weibull model is more advantageous compared
to the two-parameter Weibull distribution that can be proposed as an alternative to the wind energy estimate
technique. In a similar study, Tizgui et al (2018) [11] model the distribution of wind speed in Agadir, Morocco,
using four distribution functions (Weibull, Rayleigh, Gamma, and normal log). Adjustment quality tests show
that Weibull bear minimum errors. In addition, several researchers have proved that Weibull distribution
accurately matches most of wind distributions around the world [12], [13], [14]. The brief review of the
literature on distribution functions shows that the use of the Weibull function has some limits in the modeling of
some wind regimes; but it is widely used and recommended by several studies because of its simplicity and
offers high performance for many sites. As part of our work, the Weibull distribution will be used to model wind
speed on the ten sites in Burkina Faso.
To minimize uncertainties in wind speed modeling, some researchers have proposed several methods for
estimating distribution parameters, notably those of Weibull, such as the graphical method (GM), the maximum
likelihood method (MLM) , the Modified Maximum Likelihood Method (MMLM), the Energy Pattern Factor
Method (EPFM), the Moment Method (MoM), the Justus Empirical Method, the power density method (PDM)
[5] .To compare these methods, different statistical analysis tests are used in literature [15]. In different studies,
for specific sites and climatic conditions, researchers tried to compare the different methods in order to select
the best one. Usta et al. (2016) [16] added the method of weighted probability moments based on the power
density method (PWMBP) to the previous methods. The author compared the proposed method with six other
methods, namely maximum likelihood, modified maximum likelihood, graphical, moments, power density and
weighted moments. Quality criteria proved that the proposed method gave better results than the others. Kidmo
et al. (2015) [17] compared seven numerical methods to provide the most accurate method for determining
Weibull parameters in Garoua, Cameroon. It appears that the energy pattern factor method (EPFM) ranked first.
Tizgui et al. (2017) [5] studied the performance of the graphical method, the maximum likelihood, the energy
configuration factor method and the method of moments (MoM) and reported that the maximum likelihood
method (MLM) gives the best results. Katinas et al (2018) [4] reviewed methods for estimating Weibull
parameters adapted to different wind conditions (high and low winds) and proposed a more precise estimate of
Weibull parameters in order to reduce the uncertainties to forecast wind energy production. Weibull distribution
was used to model the average monthly wind speed, using four methods, namely the maximum likelihood
ISSN: 2277-9655
[BORO * et al., 8(2): February, 2019] Impact Factor: 5.164
IC™ Value: 3.00 CODEN: IJESS7
http: // www.ijesrt.com© International Journal of Engineering Sciences & Research Technology
[39]
IJESRT is licensed under a Creative Commons Attribution 4.0 International License.
method, the modified maximum likelihood method, the WAsP method and the Rayleigh distribution. The
maximum likelihood method and the WAsP method were the most reliable for estimating Weibull parameters at
these places.Usta et al (2018)[18]have developed a new approach to estimate Weibull parameters which might
be use to estimate wind energy. This new approach, called the Multi-Objective Moment Method (MUOM) is
compared with well-known estimation methods such as Maximum Likelihood Method (MLM), Modified
Maximum Likelihood (MLM), Power Density Method (PDM). Results obtained show that the new method
provides more accurate estimates than other well-known methods of estimating wind energy based on the
Weibull distribution. Shoaib et al (2017) [2] estimated using four statistical methods, namely the Maximum
Likelihood Method (MLM), the Method of Moment (MoM), the Energy Factor Method (EPFM) and the Power
Density Method (PDM) of Weibull distribution. The test results shows that the method of moments (MoM) and
power density Method (PDM) are more reliable in estimating Weibull distribution parameters. A literary review
of methods to estimate Weibull parameters in wind energy studies shows that several studies have focused on
estimating Weibull parameters. However, there is no consent on the choice of the best estimation method
because it depends on the climatic conditions of the studied site. Yet, it is noticed that the maximum likelihood
method, the Justus moment method (standard deviation method) and the power density method are part of most
studies conducted worldwide in first, second or third position in terms of details. These three methods are
therefore used in the context of our study to review Weibull parameters.
The work by Landry and al (2011) [19] presents Burkina Faso wind atlas, consisting of three maps of the wind
resource at 30, 50 and 80 m above ground level, as well as the topography and soil roughness for the whole
country, using the Anemoscope commercial software. The results showed that the wind resource at 80 m above
the ground is fairly good in the northeastern regions of the country (9.01 m.s-1 and above), as well as in the
North and West of the country. However, the work presented in [19] gives the vertical wind profiles at the meso
level and a micro-level profile determination is required using in situ data. In addition, the previous work by
Landry and al on the establishment of wind atlases does not address the power density, which is an essential
indicator of the assessment of the wind resource on a site. Considering the deficit of studies on wind resource in
Burkina Faso, the general objective of this paper is to assess the wind potential on 10 sites distributed
throughout the country while the specific objectives include the following:
- Identify the most accurate method of modeling wind distribution in Burkina Faso using the Weibull
model (standard deviation method, energy pattern factor and maximum likelihood);
- Estimate the monthly and annual power and energy density on the site under study. This paper is
divided into 4 parts: after reviewing the introduction in the first part, the second part presents the study
environment and data used. The third part is devoted to a description of the Weibull model, the
methods of parameter determination as well as the estimation of power density and energy. Then, the
fourth part presents the results of the calculations and discussions. The paper also include a conclusion.
We hope that this study will contribute to a better knowledge of the available wind energy density over
the whole country.
2. PRESENTATION OF THE STUDY AREAS AND DATA USED Burkina Faso, a vast country of 274,200 square kilometers, is located in the heart of West Africa, between
parallels 9°20' and 15°05' latitude north and meridians 2°20' longitude east and 5°30' longitude west at an
average altitude of 300m above sea level. Landlocked country, Burkina Faso is surrounded by six (06) other
countries: Mali in the West and the North, the Niger in the East, and in the South by Benin, Togo, Ghana and
Cote d'Ivoire. Climate division reveals 03 major climate zones depending on rainfall and temperature in Burkina
Faso:
- The Sahelian climate zone, located in the North of the 14th parallel, characterized by an annual rainfall
of less than 650 mm.
- The Sudano-Sahelian climate zone, located between the parallels 11°30 and 14° latitude north
characterized by an annual rainfall ranging between 650 and 1,000 mm.
- The Sudanese climate zone in the South of 11°30' latitude north characterized by the annual rainfall
exceeding 1,000 mm [20]. In these three climate zones, the average wind speeds were collected in ten
synoptic stations throughout the country and provided by the Burkina Faso National Meteorological
Agency thanks to wind sensors (anemovane). Measuring intervals such as 60 minutes or daily intervals
ISSN: 2277-9655
[BORO * et al., 8(2): February, 2019] Impact Factor: 5.164
IC™ Value: 3.00 CODEN: IJESS7
http: // www.ijesrt.com© International Journal of Engineering Sciences & Research Technology
[40]
IJESRT is licensed under a Creative Commons Attribution 4.0 International License.
are used only to obtain a reliable estimate of the wind potential, an interval of 10 minutes is
recommended in literature [2]. In this paper, gross data are collected every three hours, i.e. eight (8)
measurements (00h-03h-06h-09h-12h-15h-18h-21h) per day to obtain a daily average at 10 m from the
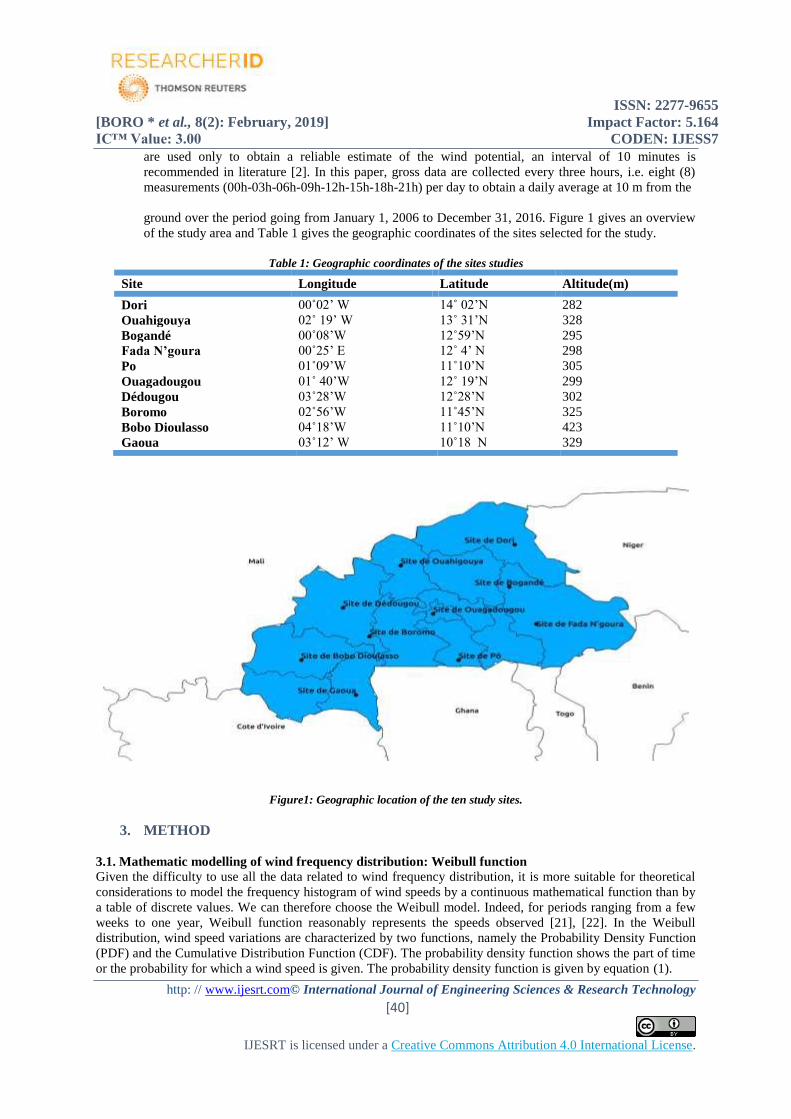
ground over the period going from January 1, 2006 to December 31, 2016. Figure 1 gives an overview
of the study area and Table 1 gives the geographic coordinates of the sites selected for the study.
Table 1: Geographic coordinates of the sites studies
Site Longitude Latitude Altitude(m)
Dori 00˚02’ W 14˚ 02’N 282
Ouahigouya 02˚ 19’ W 13˚ 31’N 328
Bogandé 00˚08’W 12˚59’N 295
Fada N’goura 00˚25’ E 12˚ 4’ N 298
Po 01˚09’W 11˚10’N 305
Ouagadougou 01˚ 40’W 12˚ 19’N 299
Dédougou 03˚28’W 12˚28’N 302
Boromo 02˚56’W 11˚45’N 325
Bobo Dioulasso 04˚18’W 11˚10’N 423
Gaoua 03˚12’ W 10˚18 N 329
Figure1: Geographic location of the ten study sites.
3. METHOD
3.1. Mathematic modelling of wind frequency distribution: Weibull function
Given the difficulty to use all the data related to wind frequency distribution, it is more suitable for theoretical
considerations to model the frequency histogram of wind speeds by a continuous mathematical function than by
a table of discrete values. We can therefore choose the Weibull model. Indeed, for periods ranging from a few
weeks to one year, Weibull function reasonably represents the speeds observed [21], [22]. In the Weibull
distribution, wind speed variations are characterized by two functions, namely the Probability Density Function
(PDF) and the Cumulative Distribution Function (CDF). The probability density function shows the part of time
or the probability for which a wind speed is given. The probability density function is given by equation (1).
ISSN: 2277-9655
[BORO * et al., 8(2): February, 2019] Impact Factor: 5.164
IC™ Value: 3.00 CODEN: IJESS7
http: // www.ijesrt.com© International Journal of Engineering Sciences & Research Technology
[41]
IJESRT is licensed under a Creative Commons Attribution 4.0 International License.
1
exp
k kk v v
f vc c c
1
Where f v is the probability density of the speed v ; k is the shape parameter of the curve (dimensionless) and
c the scale parameters of the curve in m.s-1. The distribution function or the speed cumulative distribution
function gives the fraction of time or the probability for a wind less than or equal to v ; therefore, the dividing
distribution function is the primitive of the density function of distribution given in the equation (2).
, , , , 1 exp0
kv
F v k c f v k c dvc
2
The average wind speed may be calculated by integrating the probability density function, or the formula (1):
.0
v v f v dv
3
Thus, Weibull distribution can facilitate several calculations made necessary by the analysis of wind data.
3.2 Calculation of Weibull parameters.
There are several methods to calculate k and c from a given wind distribution. We used three commonly used
methods: standard deviation, power density and maximum likelihood.
3.2.1 Standard Deviation Method (empirical method)
This method is suggested by Justus et al [23], [24]. If the average speed and the standard deviation are available,
the estimation of parameters is done using formulas (3) and (4).
1,086
kv
4
11
vc
k
5
With the standard deviation of the random variable, x Gamma Function defined by:
1
0
exp . xx t t dt
; 1 x x x , where t is a real variable on which makes the integration.
3.2.2. Energy pattern Factor Method.
The energyfactor was defined by Golding [22], [25] as the ratio of the total value of available wind energy and
the energy calculated from the curve of the mean wind speed.
The cubic wind speed is: 3 3 31 1v c k 6
The average cubic wind speed is: 3 31 3v c k 7
The energy model factor is defined by:
ISSN: 2277-9655
[BORO * et al., 8(2): February, 2019] Impact Factor: 5.164
IC™ Value: 3.00 CODEN: IJESS7
http: // www.ijesrt.com© International Journal of Engineering Sciences & Research Technology
[42]
IJESRT is licensed under a Creative Commons Attribution 4.0 International License.
3 1 3
3 31 1
kvk
Ev k
8
In addition, based on observations, the energy factor may be calculated with the (9). 3
3
1 1
1 1n n
E i i
i i
k v vn n
9
The equation (8) is fairly given by the relation (10).
269,3
1
Ekk 10
3.2.3 Maximum likelihood method.
Weibull distribution can adjust a series of wind data using the maximum likelihood method suggested by
Stevens and Smulders [26]. The shape parameter k and scale parameter c are estimated using equations (11) and
(12).
-1n kV lnVi i n1i=1k= - lnVin k i=1nVi
i=1
11
11
1
kn kc Vi
in
12
Where iv is the wind speed at time i and n is the non-zero wind speed observation number. Equation (11) can be
solved using an iterative procedure (k = 2 is the appropriate initial conjecture), then equation (12) can be solved
explicitly. Equation (11) must be only used to non-zero wind speed data points. In order to try the various
methods, the calculation of the statistical analysis parameters of equation (13) and (14) is used [23]:
- The determination coefficient: 2 22
1 1
1n n
i i i
i i
R y x y y
13
-the root mean square error:
12
2
1
1 n
i i
i
RMSE y xn
14
Where n is the total number of intervals, yi is the frequency of the values observed, xi is the frequency of the
values obtained with Weibull distribution and y̅ is the average value of yi . A model is considered as the ideal, if
it is characterized by a null value for RMSE and 1 for the parameter R2.
3.3. Available wind energy density.
The power density of wind energy is the most important feature of wind. It represents the amount of energy
produced by wind. Assuming that S is the cross-section through which the wind rotates perpendicularly, the
wind power density is given by equation (15) [27]:
0P P v f v dv
15
ISSN: 2277-9655
[BORO * et al., 8(2): February, 2019] Impact Factor: 5.164
IC™ Value: 3.00 CODEN: IJESS7
http: // www.ijesrt.com© International Journal of Engineering Sciences & Research Technology
[43]
IJESRT is licensed under a Creative Commons Attribution 4.0 International License.
Where 1 3
2P v Sv
By integrating the equation (15), we obtain the expression of the average available energy density given by
equation (16).
1 33
2
kP c
k
16
Where is the density of the air according to the altitude. In this study, we will use the density of the constant
air because its variation is insignificant so that it does not influence the calculation of the wind resource [28].
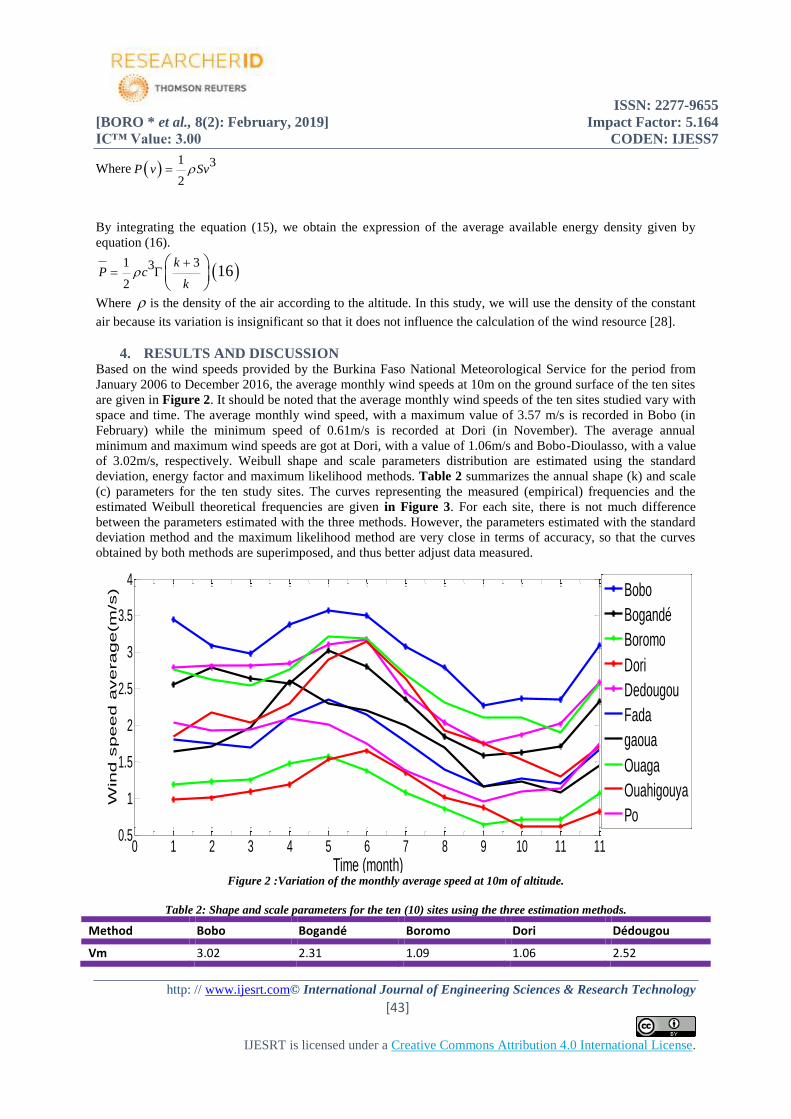
4. RESULTS AND DISCUSSION Based on the wind speeds provided by the Burkina Faso National Meteorological Service for the period from
January 2006 to December 2016, the average monthly wind speeds at 10m on the ground surface of the ten sites
are given in Figure 2. It should be noted that the average monthly wind speeds of the ten sites studied vary with
space and time. The average monthly wind speed, with a maximum value of 3.57 m/s is recorded in Bobo (in
February) while the minimum speed of 0.61m/s is recorded at Dori (in November). The average annual
minimum and maximum wind speeds are got at Dori, with a value of 1.06m/s and Bobo-Dioulasso, with a value
of 3.02m/s, respectively. Weibull shape and scale parameters distribution are estimated using the standard
deviation, energy factor and maximum likelihood methods. Table 2 summarizes the annual shape (k) and scale
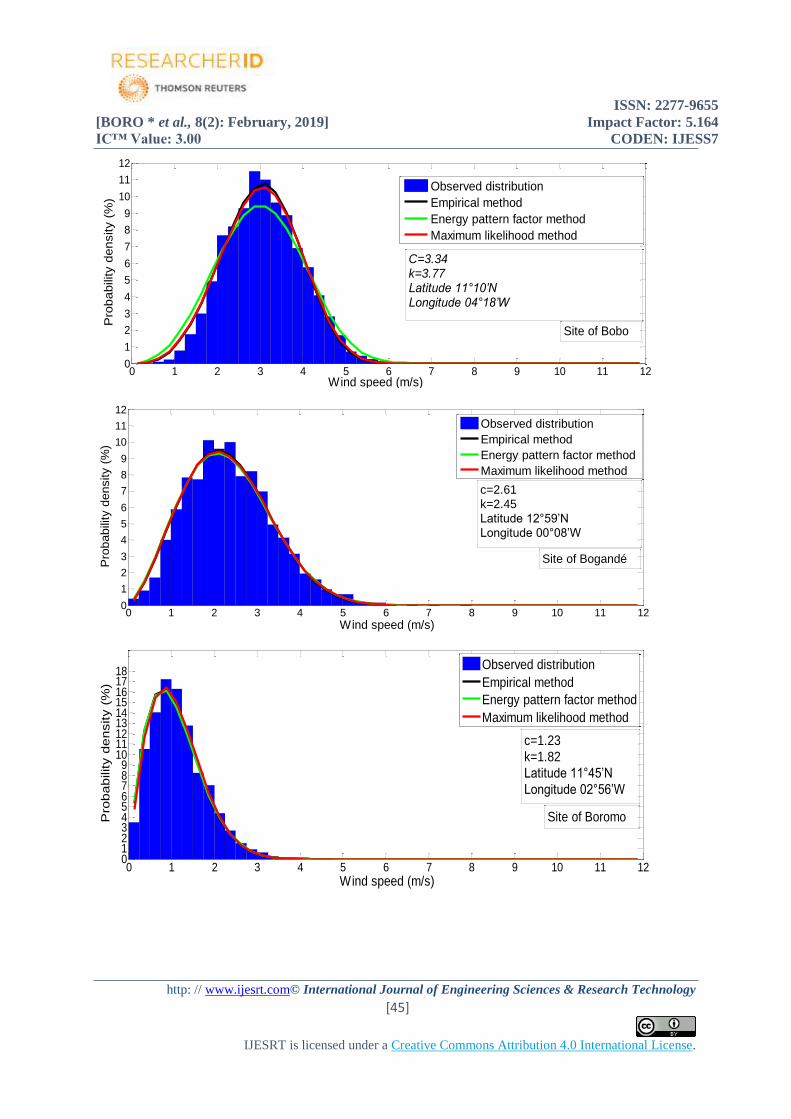
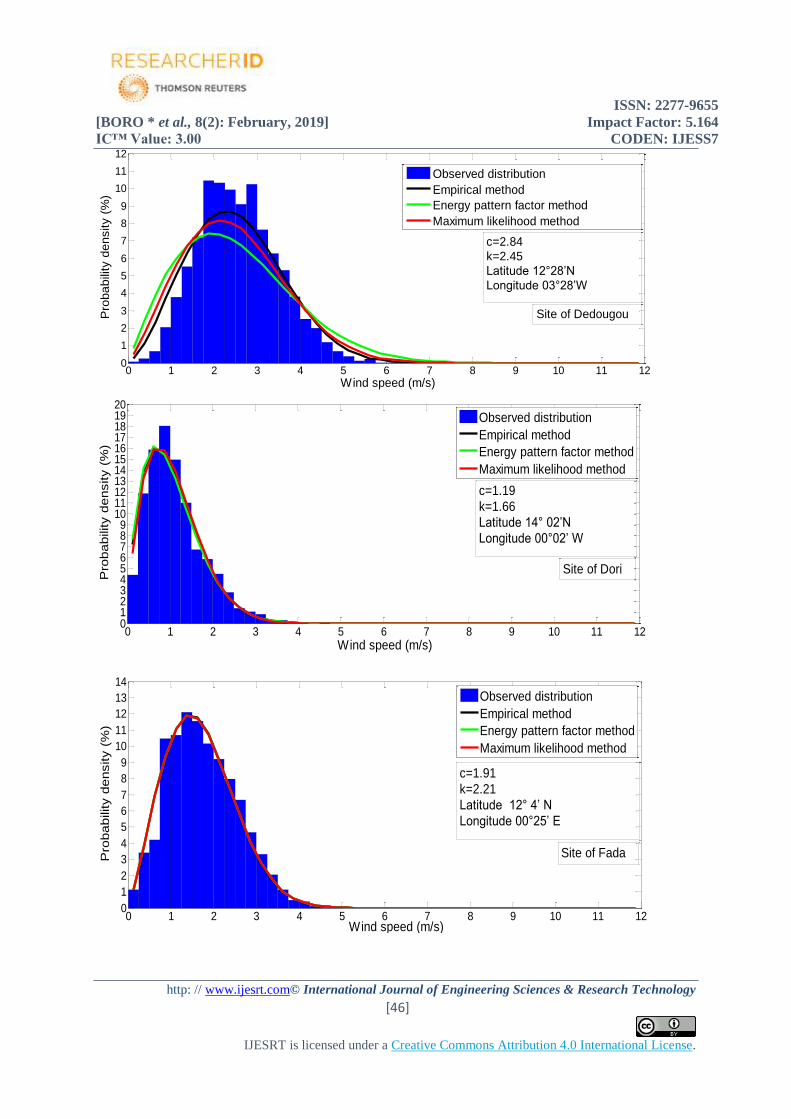
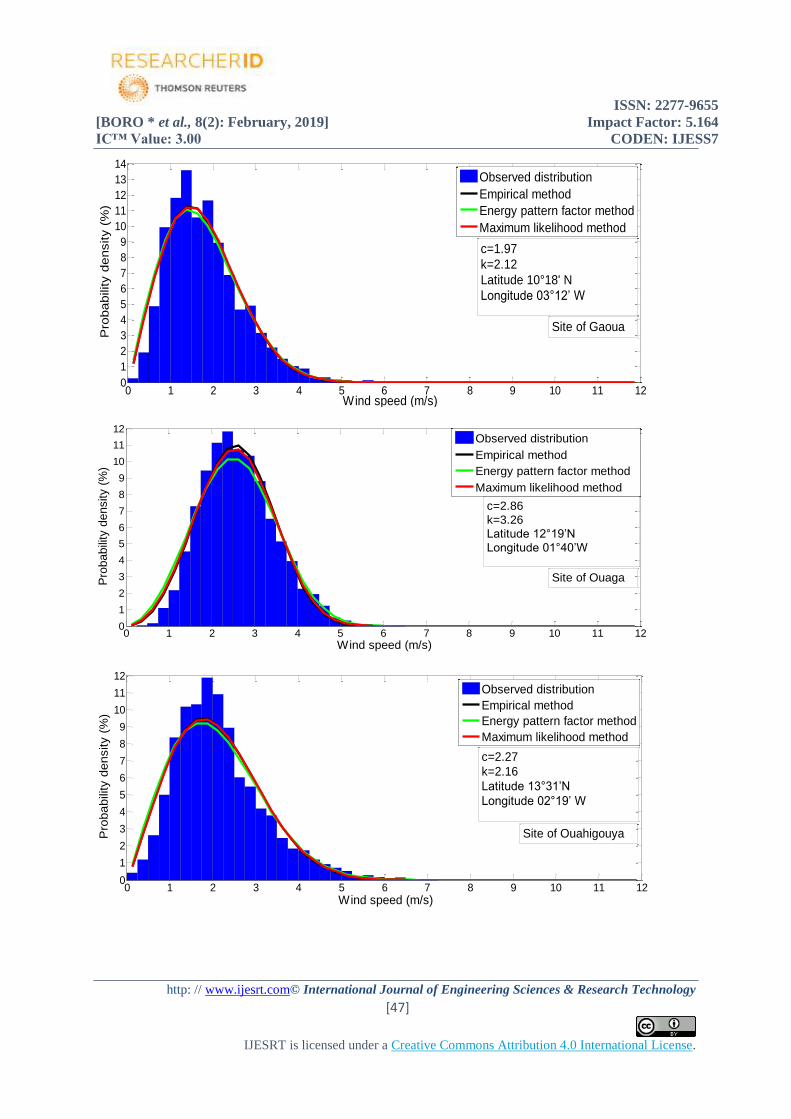
(c) parameters for the ten study sites. The curves representing the measured (empirical) frequencies and the
estimated Weibull theoretical frequencies are given in Figure 3. For each site, there is not much difference
between the parameters estimated with the three methods. However, the parameters estimated with the standard
deviation method and the maximum likelihood method are very close in terms of accuracy, so that the curves
obtained by both methods are superimposed, and thus better adjust data measured.
Figure 2 :Variation of the monthly average speed at 10m of altitude.
Table 2: Shape and scale parameters for the ten (10) sites using the three estimation methods.
Method Bobo Bogandé Boromo Dori Dédougou
Vm 3.02 2.31 1.09 1.06 2.52
0 1 2 3 4 5 6 7 8 9 10 11 110.5
1
1.5
2
2.5
3
3.5
4
Time (month)
Win
d s
peed a
verage(m
/s)
Bobo
Bogandé
Boromo
Dori
Dedougou
Fada
gaoua
Ouaga
Ouahigouya
Po
ISSN: 2277-9655
[BORO * et al., 8(2): February, 2019] Impact Factor: 5.164
IC™ Value: 3.00 CODEN: IJESS7
http: // www.ijesrt.com© International Journal of Engineering Sciences & Research Technology
[44]
IJESRT is licensed under a Creative Commons Attribution 4.0 International License.
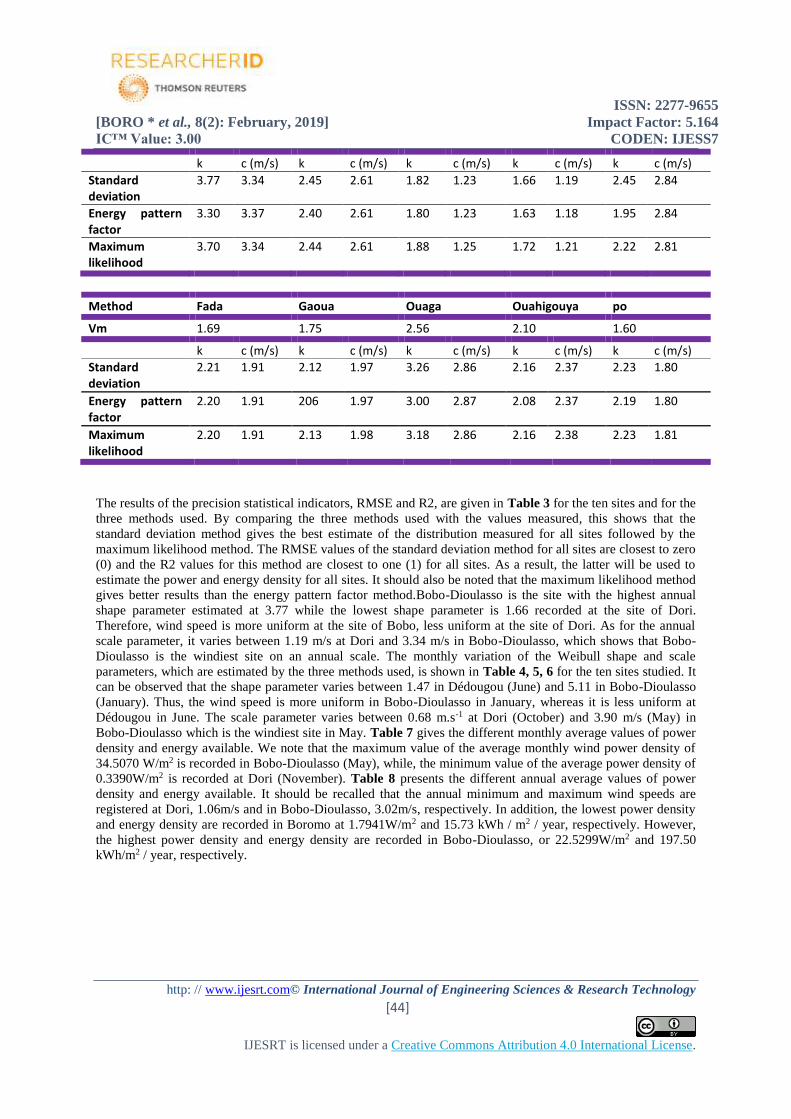
k c (m/s) k c (m/s) k c (m/s) k c (m/s) k c (m/s)
Standard deviation
3.77 3.34 2.45 2.61 1.82 1.23 1.66 1.19 2.45 2.84
Energy pattern factor
3.30 3.37 2.40 2.61 1.80 1.23 1.63 1.18 1.95 2.84
Maximum likelihood
3.70 3.34 2.44 2.61 1.88 1.25 1.72 1.21 2.22 2.81
Method Fada Gaoua Ouaga Ouahigouya po
Vm 1.69 1.75 2.56 2.10 1.60
k c (m/s) k c (m/s) k c (m/s) k c (m/s) k c (m/s)
Standard deviation
2.21 1.91 2.12 1.97 3.26 2.86 2.16 2.37 2.23 1.80
Energy pattern factor
2.20 1.91 206 1.97 3.00 2.87 2.08 2.37 2.19 1.80
Maximum likelihood
2.20 1.91 2.13 1.98 3.18 2.86 2.16 2.38 2.23 1.81
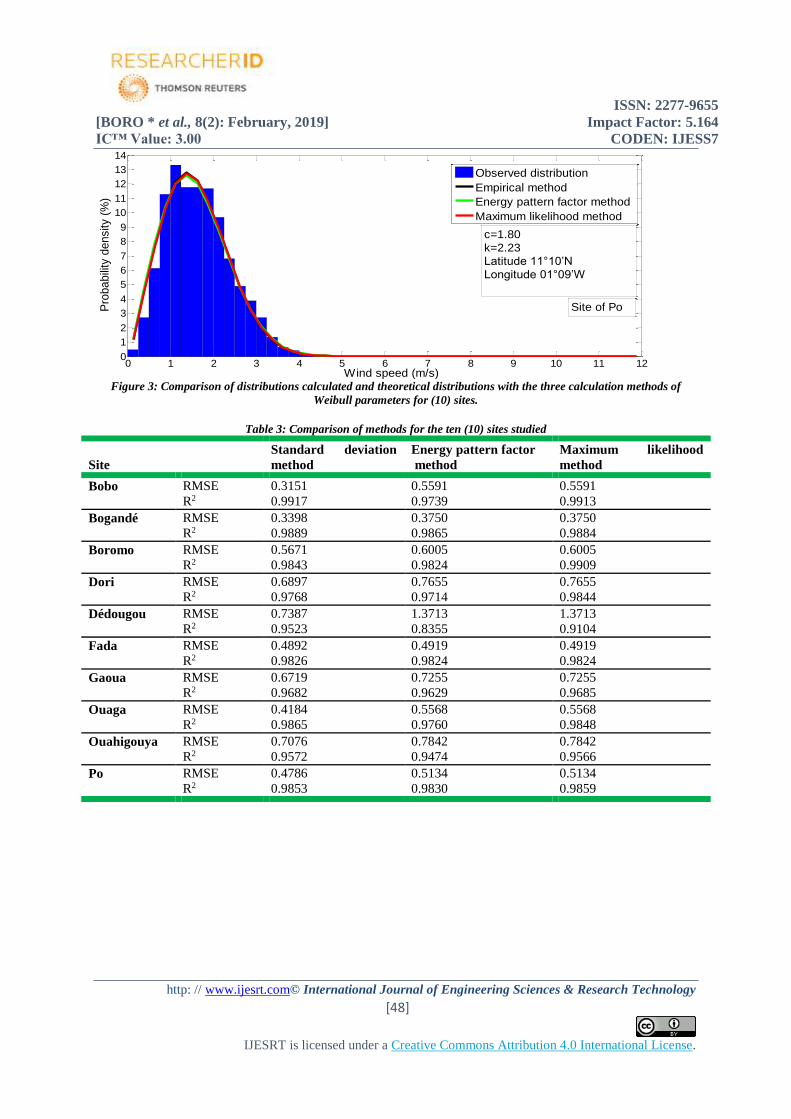
The results of the precision statistical indicators, RMSE and R2, are given in Table 3 for the ten sites and for the
three methods used. By comparing the three methods used with the values measured, this shows that the
standard deviation method gives the best estimate of the distribution measured for all sites followed by the
maximum likelihood method. The RMSE values of the standard deviation method for all sites are closest to zero
(0) and the R2 values for this method are closest to one (1) for all sites. As a result, the latter will be used to
estimate the power and energy density for all sites. It should also be noted that the maximum likelihood method
gives better results than the energy pattern factor method.Bobo-Dioulasso is the site with the highest annual
shape parameter estimated at 3.77 while the lowest shape parameter is 1.66 recorded at the site of Dori.
Therefore, wind speed is more uniform at the site of Bobo, less uniform at the site of Dori. As for the annual
scale parameter, it varies between 1.19 m/s at Dori and 3.34 m/s in Bobo-Dioulasso, which shows that Bobo-
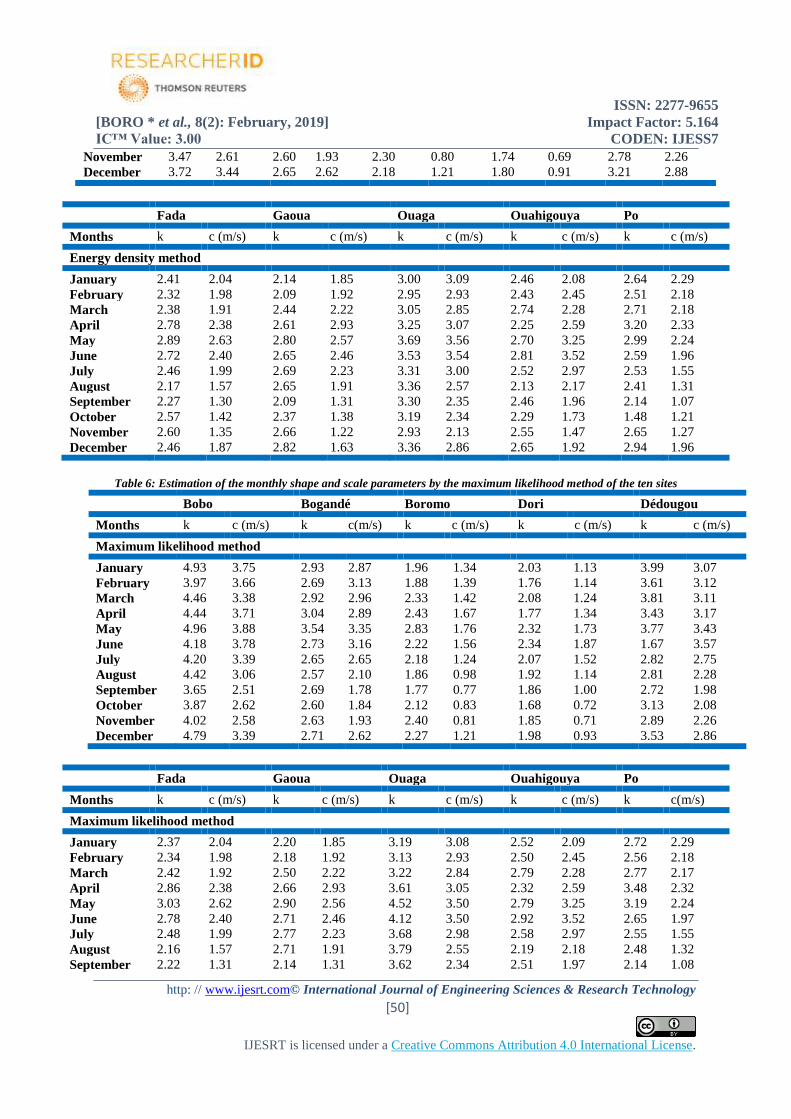
Dioulasso is the windiest site on an annual scale. The monthly variation of the Weibull shape and scale
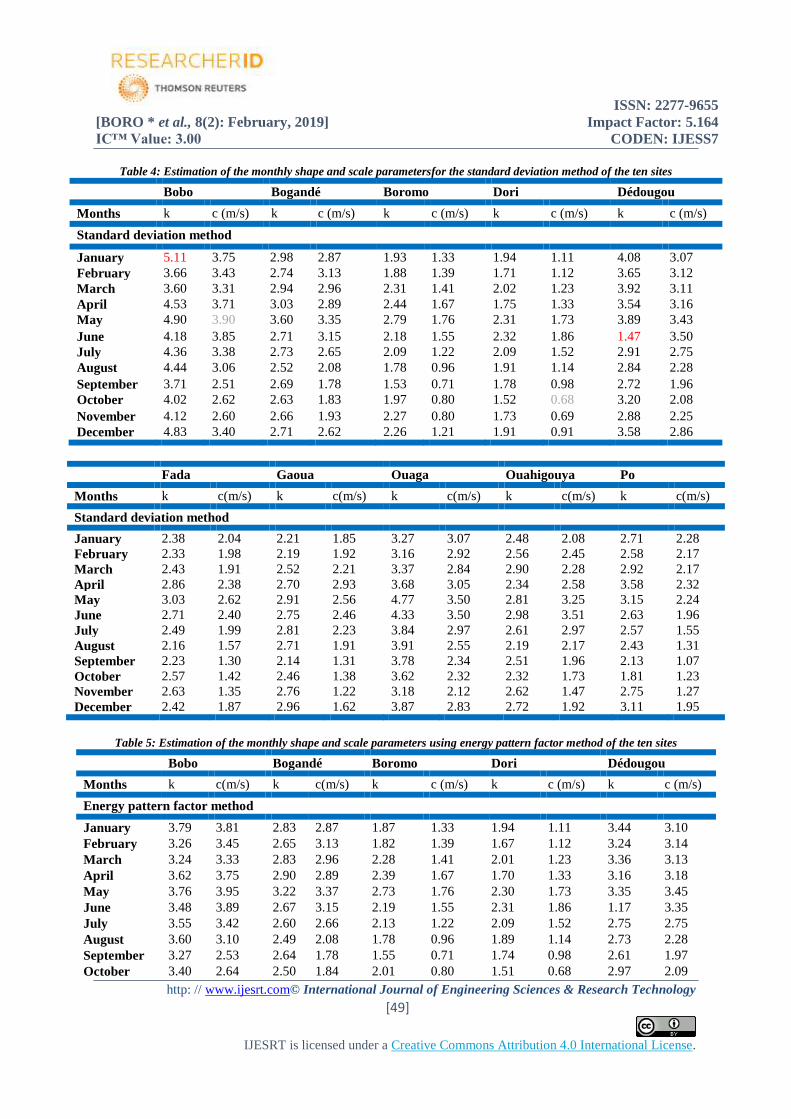
parameters, which are estimated by the three methods used, is shown in Table 4, 5, 6 for the ten sites studied. It
can be observed that the shape parameter varies between 1.47 in Dédougou (June) and 5.11 in Bobo-Dioulasso
(January). Thus, the wind speed is more uniform in Bobo-Dioulasso in January, whereas it is less uniform at
Dédougou in June. The scale parameter varies between 0.68 m.s-1 at Dori (October) and 3.90 m/s (May) in
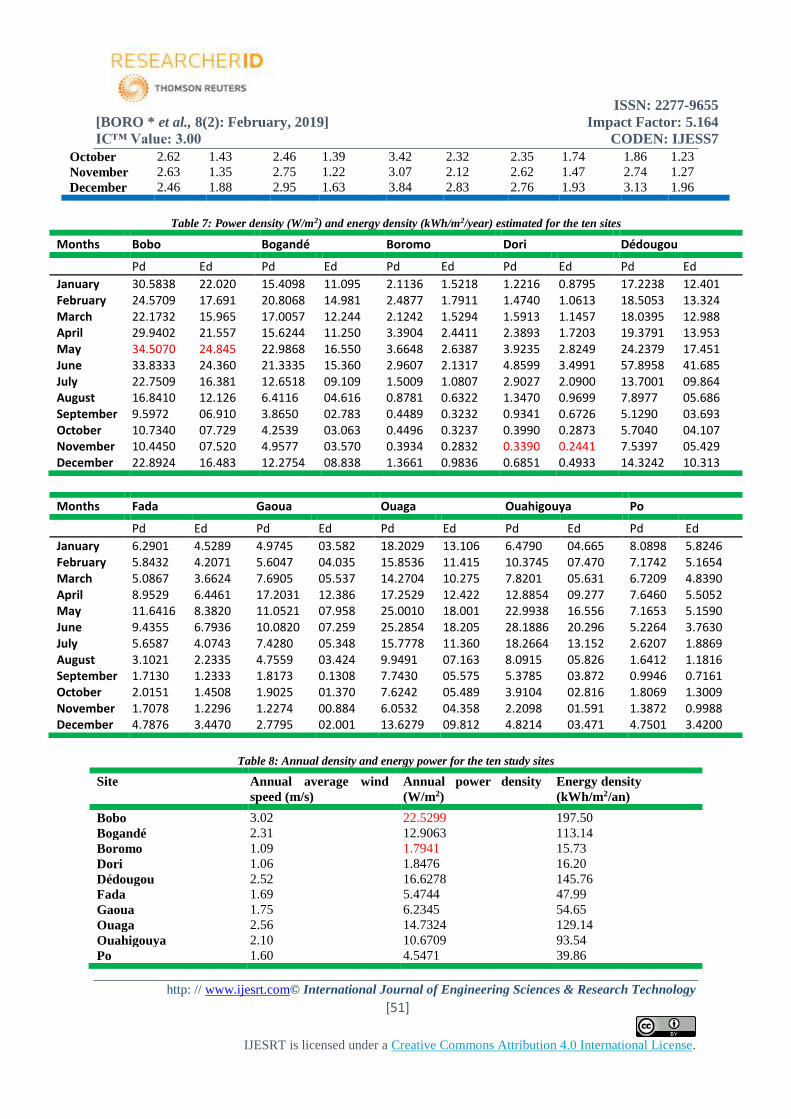
Bobo-Dioulasso which is the windiest site in May. Table 7 gives the different monthly average values of power
density and energy available. We note that the maximum value of the average monthly wind power density of
34.5070 W/m2 is recorded in Bobo-Dioulasso (May), while, the minimum value of the average power density of
0.3390W/m2 is recorded at Dori (November). Table 8 presents the different annual average values of power
density and energy available. It should be recalled that the annual minimum and maximum wind speeds are
registered at Dori, 1.06m/s and in Bobo-Dioulasso, 3.02m/s, respectively. In addition, the lowest power density
and energy density are recorded in Boromo at 1.7941W/m2 and 15.73 kWh / m2 / year, respectively. However,
the highest power density and energy density are recorded in Bobo-Dioulasso, or 22.5299W/m2 and 197.50
kWh/m2 / year, respectively.
ISSN: 2277-9655
[BORO * et al., 8(2): February, 2019] Impact Factor: 5.164
IC™ Value: 3.00 CODEN: IJESS7
http: // www.ijesrt.com© International Journal of Engineering Sciences & Research Technology
[45]
IJESRT is licensed under a Creative Commons Attribution 4.0 International License.
0 1 2 3 4 5 6 7 8 9 10 11 120
1
2
3
4
5
6
7
8
9
10
11
12
Wind speed (m/s)
Pro
bability d
en
sity (
%)
Observed distribution
Empirical method
Energy pattern factor method
Maximum likelihood method
Site of Bobo
C=3.34k=3.77Latitude 11°10’NLongitude 04°18’W
0 1 2 3 4 5 6 7 8 9 10 11 120
1
2
3
4
5
6
7
8
9
10
11
12
Wind speed (m/s)
Pro
babili
ty d
ensity (
%)
Observed distribution
Empirical method
Energy pattern factor method
Maximum likelihood method
c=2.61
k=2.45
Latitude 12°59’N
Longitude 00°08’W
Site of Bogandé
0 1 2 3 4 5 6 7 8 9 10 11 120123456789
101112131415161718
Wind speed (m/s)
Pro
bability d
ensity (
%)
Observed distribution
Empirical method
Energy pattern factor method
Maximum likelihood method
c=1.23
k=1.82
Latitude 11°45’N
Longitude 02°56’W
Site of Boromo
ISSN: 2277-9655
[BORO * et al., 8(2): February, 2019] Impact Factor: 5.164
IC™ Value: 3.00 CODEN: IJESS7
http: // www.ijesrt.com© International Journal of Engineering Sciences & Research Technology
[46]
IJESRT is licensed under a Creative Commons Attribution 4.0 International License.
0 1 2 3 4 5 6 7 8 9 10 11 120
1
2
3
4
5
6
7
8
9
10
11
12
Wind speed (m/s)
Pro
ba
bili
ty d
ensity (
%)
Observed distribution
Empirical method
Energy pattern factor method
Maximum likelihood method
c=2.84
k=2.45
Latitude 12°28’N
Longitude 03°28’W
Site of Dedougou
0 1 2 3 4 5 6 7 8 9 10 11 120123456789
1011121314151617181920
Wind speed (m/s)
Pro
bability d
ensity (
%)
Observed distribution
Empirical method
Energy pattern factor method
Maximum likelihood method
c=1.19
k=1.66
Latitude 14° 02’N
Longitude 00°02’ W
Site of Dori
0 1 2 3 4 5 6 7 8 9 10 11 120
1
2
3
4
5
6
7
8
9
10
11
12
13
14
Wind speed (m/s)
Pro
ba
bility d
ensity (
%)
Observed distribution
Empirical method
Energy pattern factor method
Maximum likelihood method
c=1.91
k=2.21
Latitude 12° 4’ N
Longitude 00°25’ E
Site of Fada
ISSN: 2277-9655
[BORO * et al., 8(2): February, 2019] Impact Factor: 5.164
IC™ Value: 3.00 CODEN: IJESS7
http: // www.ijesrt.com© International Journal of Engineering Sciences & Research Technology
[47]
IJESRT is licensed under a Creative Commons Attribution 4.0 International License.
0 1 2 3 4 5 6 7 8 9 10 11 120
1
2
3
4
5
6
7
8
9
10
11
12
13
14
Wind speed (m/s)
Pro
bability d
ensity (
%)
Observed distribution
Empirical method
Energy pattern factor method
Maximum likelihood method
c=1.97
k=2.12
Latitude 10°18' N
Longitude 03°12’ W
Site of Gaoua
0 1 2 3 4 5 6 7 8 9 10 11 120
1
2
3
4
5
6
7
8
9
10
11
12
Wind speed (m/s)
Pro
babili
ty d
ensity (
%)
Observed distribution
Empirical method
Energy pattern factor method
Maximum likelihood method
c=2.86
k=3.26
Latitude 12°19’N
Longitude 01°40’W
Site of Ouaga
0 1 2 3 4 5 6 7 8 9 10 11 120
1
2
3
4
5
6
7
8
9
10
11
12
Wind speed (m/s)
Pro
ba
bili
ty d
ensity (
%)
Observed distribution
Empirical method
Energy pattern factor method
Maximum likelihood method
c=2.27
k=2.16
Latitude 13°31’N
Longitude 02°19’ W
Site of Ouahigouya
ISSN: 2277-9655
[BORO * et al., 8(2): February, 2019] Impact Factor: 5.164
IC™ Value: 3.00 CODEN: IJESS7
http: // www.ijesrt.com© International Journal of Engineering Sciences & Research Technology
[48]
IJESRT is licensed under a Creative Commons Attribution 4.0 International License.
Figure 3: Comparison of distributions calculated and theoretical distributions with the three calculation methods of
Weibull parameters for (10) sites.
Table 3: Comparison of methods for the ten (10) sites studied
Site
Standard deviation
method
Energy pattern factor
method
Maximum likelihood
method
Bobo RMSE 0.3151 0.5591 0.5591
R2 0.9917 0.9739 0.9913
Bogandé RMSE 0.3398 0.3750 0.3750
R2 0.9889 0.9865 0.9884
Boromo RMSE 0.5671 0.6005 0.6005
R2 0.9843 0.9824 0.9909
Dori RMSE 0.6897 0.7655 0.7655
R2 0.9768 0.9714 0.9844
Dédougou RMSE 0.7387 1.3713 1.3713
R2 0.9523 0.8355 0.9104
Fada RMSE 0.4892 0.4919 0.4919
R2 0.9826 0.9824 0.9824
Gaoua RMSE 0.6719 0.7255 0.7255
R2 0.9682 0.9629 0.9685
Ouaga RMSE 0.4184 0.5568 0.5568
R2 0.9865 0.9760 0.9848
Ouahigouya RMSE 0.7076 0.7842 0.7842
R2 0.9572 0.9474 0.9566
Po RMSE 0.4786 0.5134 0.5134
R2 0.9853 0.9830 0.9859
0 1 2 3 4 5 6 7 8 9 10 11 120
1
2
3
4
5
6
7
8
9
10
11
12
13
14
Wind speed (m/s)
Pro
babili
ty d
ensity (
%)
Observed distribution
Empirical method
Energy pattern factor method
Maximum likelihood method
c=1.80
k=2.23
Latitude 11°10’N
Longitude 01°09’W
Site of Po
ISSN: 2277-9655
[BORO * et al., 8(2): February, 2019] Impact Factor: 5.164
IC™ Value: 3.00 CODEN: IJESS7
http: // www.ijesrt.com© International Journal of Engineering Sciences & Research Technology
[49]
IJESRT is licensed under a Creative Commons Attribution 4.0 International License.
Table 4: Estimation of the monthly shape and scale parametersfor the standard deviation method of the ten sites
Bobo Bogandé Boromo Dori Dédougou
Months k c (m/s) k c (m/s) k c (m/s) k c (m/s) k c (m/s)
Standard deviation method
January 5.11 3.75 2.98 2.87 1.93 1.33 1.94 1.11 4.08 3.07
February 3.66 3.43 2.74 3.13 1.88 1.39 1.71 1.12 3.65 3.12
March 3.60 3.31 2.94 2.96 2.31 1.41 2.02 1.23 3.92 3.11
April 4.53 3.71 3.03 2.89 2.44 1.67 1.75 1.33 3.54 3.16
May 4.90 3.90 3.60 3.35 2.79 1.76 2.31 1.73 3.89 3.43
June 4.18 3.85 2.71 3.15 2.18 1.55 2.32 1.86 1.47 3.50
July 4.36 3.38 2.73 2.65 2.09 1.22 2.09 1.52 2.91 2.75
August 4.44 3.06 2.52 2.08 1.78 0.96 1.91 1.14 2.84 2.28
September 3.71 2.51 2.69 1.78 1.53 0.71 1.78 0.98 2.72 1.96
October 4.02 2.62 2.63 1.83 1.97 0.80 1.52 0.68 3.20 2.08
November 4.12 2.60 2.66 1.93 2.27 0.80 1.73 0.69 2.88 2.25
December 4.83 3.40 2.71 2.62 2.26 1.21 1.91 0.91 3.58 2.86
Fada Gaoua Ouaga Ouahigouya Po
Months k c(m/s) k c(m/s) k c(m/s) k c(m/s) k c(m/s)
Standard deviation method
January 2.38 2.04 2.21 1.85 3.27 3.07 2.48 2.08 2.71 2.28
February 2.33 1.98 2.19 1.92 3.16 2.92 2.56 2.45 2.58 2.17
March 2.43 1.91 2.52 2.21 3.37 2.84 2.90 2.28 2.92 2.17
April 2.86 2.38 2.70 2.93 3.68 3.05 2.34 2.58 3.58 2.32
May 3.03 2.62 2.91 2.56 4.77 3.50 2.81 3.25 3.15 2.24
June 2.71 2.40 2.75 2.46 4.33 3.50 2.98 3.51 2.63 1.96
July 2.49 1.99 2.81 2.23 3.84 2.97 2.61 2.97 2.57 1.55
August 2.16 1.57 2.71 1.91 3.91 2.55 2.19 2.17 2.43 1.31
September 2.23 1.30 2.14 1.31 3.78 2.34 2.51 1.96 2.13 1.07
October 2.57 1.42 2.46 1.38 3.62 2.32 2.32 1.73 1.81 1.23
November 2.63 1.35 2.76 1.22 3.18 2.12 2.62 1.47 2.75 1.27
December 2.42 1.87 2.96 1.62 3.87 2.83 2.72 1.92 3.11 1.95
Table 5: Estimation of the monthly shape and scale parameters using energy pattern factor method of the ten sites
Bobo Bogandé Boromo Dori Dédougou
Months k c(m/s) k c(m/s) k c (m/s) k c (m/s) k c (m/s)
Energy pattern factor method
January 3.79 3.81 2.83 2.87 1.87 1.33 1.94 1.11 3.44 3.10
February 3.26 3.45 2.65 3.13 1.82 1.39 1.67 1.12 3.24 3.14
March 3.24 3.33 2.83 2.96 2.28 1.41 2.01 1.23 3.36 3.13
April 3.62 3.75 2.90 2.89 2.39 1.67 1.70 1.33 3.16 3.18
May 3.76 3.95 3.22 3.37 2.73 1.76 2.30 1.73 3.35 3.45
June 3.48 3.89 2.67 3.15 2.19 1.55 2.31 1.86 1.17 3.35
July 3.55 3.42 2.60 2.66 2.13 1.22 2.09 1.52 2.75 2.75
August 3.60 3.10 2.49 2.08 1.78 0.96 1.89 1.14 2.73 2.28
September 3.27 2.53 2.64 1.78 1.55 0.71 1.74 0.98 2.61 1.97
October 3.40 2.64 2.50 1.84 2.01 0.80 1.51 0.68 2.97 2.09
ISSN: 2277-9655
[BORO * et al., 8(2): February, 2019] Impact Factor: 5.164
IC™ Value: 3.00 CODEN: IJESS7
http: // www.ijesrt.com© International Journal of Engineering Sciences & Research Technology
[50]
IJESRT is licensed under a Creative Commons Attribution 4.0 International License.
November 3.47 2.61 2.60 1.93 2.30 0.80 1.74 0.69 2.78 2.26
December 3.72 3.44 2.65 2.62 2.18 1.21 1.80 0.91 3.21 2.88
Fada Gaoua Ouaga Ouahigouya Po
Months k c (m/s) k c (m/s) k c (m/s) k c (m/s) k c (m/s)
Energy density method
January 2.41 2.04 2.14 1.85 3.00 3.09 2.46 2.08 2.64 2.29
February 2.32 1.98 2.09 1.92 2.95 2.93 2.43 2.45 2.51 2.18
March 2.38 1.91 2.44 2.22 3.05 2.85 2.74 2.28 2.71 2.18
April 2.78 2.38 2.61 2.93 3.25 3.07 2.25 2.59 3.20 2.33
May 2.89 2.63 2.80 2.57 3.69 3.56 2.70 3.25 2.99 2.24
June 2.72 2.40 2.65 2.46 3.53 3.54 2.81 3.52 2.59 1.96
July 2.46 1.99 2.69 2.23 3.31 3.00 2.52 2.97 2.53 1.55
August 2.17 1.57 2.65 1.91 3.36 2.57 2.13 2.17 2.41 1.31
September 2.27 1.30 2.09 1.31 3.30 2.35 2.46 1.96 2.14 1.07
October 2.57 1.42 2.37 1.38 3.19 2.34 2.29 1.73 1.48 1.21
November 2.60 1.35 2.66 1.22 2.93 2.13 2.55 1.47 2.65 1.27
December 2.46 1.87 2.82 1.63 3.36 2.86 2.65 1.92 2.94 1.96
Table 6: Estimation of the monthly shape and scale parameters by the maximum likelihood method of the ten sites
Bobo Bogandé Boromo Dori Dédougou
Months k c (m/s) k c(m/s) k c (m/s) k c (m/s) k c (m/s)
Maximum likelihood method
January 4.93 3.75 2.93 2.87 1.96 1.34 2.03 1.13 3.99 3.07
February 3.97 3.66 2.69 3.13 1.88 1.39 1.76 1.14 3.61 3.12
March 4.46 3.38 2.92 2.96 2.33 1.42 2.08 1.24 3.81 3.11
April 4.44 3.71 3.04 2.89 2.43 1.67 1.77 1.34 3.43 3.17
May 4.96 3.88 3.54 3.35 2.83 1.76 2.32 1.73 3.77 3.43
June 4.18 3.78 2.73 3.16 2.22 1.56 2.34 1.87 1.67 3.57
July 4.20 3.39 2.65 2.65 2.18 1.24 2.07 1.52 2.82 2.75
August 4.42 3.06 2.57 2.10 1.86 0.98 1.92 1.14 2.81 2.28
September 3.65 2.51 2.69 1.78 1.77 0.77 1.86 1.00 2.72 1.98
October 3.87 2.62 2.60 1.84 2.12 0.83 1.68 0.72 3.13 2.08
November 4.02 2.58 2.63 1.93 2.40 0.81 1.85 0.71 2.89 2.26
December 4.79 3.39 2.71 2.62 2.27 1.21 1.98 0.93 3.53 2.86
Fada Gaoua Ouaga Ouahigouya Po
Months k c (m/s) k c (m/s) k c (m/s) k c (m/s) k c(m/s)
Maximum likelihood method
January 2.37 2.04 2.20 1.85 3.19 3.08 2.52 2.09 2.72 2.29
February 2.34 1.98 2.18 1.92 3.13 2.93 2.50 2.45 2.56 2.18
March 2.42 1.92 2.50 2.22 3.22 2.84 2.79 2.28 2.77 2.17
April 2.86 2.38 2.66 2.93 3.61 3.05 2.32 2.59 3.48 2.32
May 3.03 2.62 2.90 2.56 4.52 3.50 2.79 3.25 3.19 2.24
June 2.78 2.40 2.71 2.46 4.12 3.50 2.92 3.52 2.65 1.97
July 2.48 1.99 2.77 2.23 3.68 2.98 2.58 2.97 2.55 1.55
August 2.16 1.57 2.71 1.91 3.79 2.55 2.19 2.18 2.48 1.32
September 2.22 1.31 2.14 1.31 3.62 2.34 2.51 1.97 2.14 1.08
ISSN: 2277-9655
[BORO * et al., 8(2): February, 2019] Impact Factor: 5.164
IC™ Value: 3.00 CODEN: IJESS7
http: // www.ijesrt.com© International Journal of Engineering Sciences & Research Technology
[51]
IJESRT is licensed under a Creative Commons Attribution 4.0 International License.
October 2.62 1.43 2.46 1.39 3.42 2.32 2.35 1.74 1.86 1.23
November 2.63 1.35 2.75 1.22 3.07 2.12 2.62 1.47 2.74 1.27
December 2.46 1.88 2.95 1.63 3.84 2.83 2.76 1.93 3.13 1.96
Table 7: Power density (W/m2) and energy density (kWh/m2/year) estimated for the ten sites
Table 8: Annual density and energy power for the ten study sites
Site Annual average wind
speed (m/s)
Annual power density
(W/m2)
Energy density
(kWh/m2/an)
Bobo 3.02 22.5299 197.50
Bogandé 2.31 12.9063 113.14
Boromo 1.09 1.7941 15.73
Dori 1.06 1.8476 16.20
Dédougou 2.52 16.6278 145.76
Fada 1.69 5.4744 47.99
Gaoua 1.75 6.2345 54.65
Ouaga 2.56 14.7324 129.14
Ouahigouya 2.10 10.6709 93.54
Po 1.60 4.5471 39.86
Months Bobo Bogandé Boromo Dori Dédougou
Pd Ed Pd Ed Pd Ed Pd Ed Pd Ed
January 30.5838 22.020 15.4098 11.095 2.1136 1.5218 1.2216 0.8795 17.2238 12.401 February 24.5709 17.691 20.8068 14.981 2.4877 1.7911 1.4740 1.0613 18.5053 13.324 March 22.1732 15.965 17.0057 12.244 2.1242 1.5294 1.5913 1.1457 18.0395 12.988 April 29.9402 21.557 15.6244 11.250 3.3904 2.4411 2.3893 1.7203 19.3791 13.953 May 34.5070 24.845 22.9868 16.550 3.6648 2.6387 3.9235 2.8249 24.2379 17.451 June 33.8333 24.360 21.3335 15.360 2.9607 2.1317 4.8599 3.4991 57.8958 41.685 July 22.7509 16.381 12.6518 09.109 1.5009 1.0807 2.9027 2.0900 13.7001 09.864 August 16.8410 12.126 6.4116 04.616 0.8781 0.6322 1.3470 0.9699 7.8977 05.686 September 9.5972 06.910 3.8650 02.783 0.4489 0.3232 0.9341 0.6726 5.1290 03.693 October 10.7340 07.729 4.2539 03.063 0.4496 0.3237 0.3990 0.2873 5.7040 04.107 November 10.4450 07.520 4.9577 03.570 0.3934 0.2832 0.3390 0.2441 7.5397 05.429 December 22.8924 16.483 12.2754 08.838 1.3661 0.9836 0.6851 0.4933 14.3242 10.313
Months Fada Gaoua Ouaga Ouahigouya Po
Pd Ed Pd Ed Pd Ed Pd Ed Pd Ed
January 6.2901 4.5289 4.9745 03.582 18.2029 13.106 6.4790 04.665 8.0898 5.8246 February 5.8432 4.2071 5.6047 04.035 15.8536 11.415 10.3745 07.470 7.1742 5.1654 March 5.0867 3.6624 7.6905 05.537 14.2704 10.275 7.8201 05.631 6.7209 4.8390 April 8.9529 6.4461 17.2031 12.386 17.2529 12.422 12.8854 09.277 7.6460 5.5052 May 11.6416 8.3820 11.0521 07.958 25.0010 18.001 22.9938 16.556 7.1653 5.1590 June 9.4355 6.7936 10.0820 07.259 25.2854 18.205 28.1886 20.296 5.2264 3.7630 July 5.6587 4.0743 7.4280 05.348 15.7778 11.360 18.2664 13.152 2.6207 1.8869 August 3.1021 2.2335 4.7559 03.424 9.9491 07.163 8.0915 05.826 1.6412 1.1816 September 1.7130 1.2333 1.8173 0.1308 7.7430 05.575 5.3785 03.872 0.9946 0.7161 October 2.0151 1.4508 1.9025 01.370 7.6242 05.489 3.9104 02.816 1.8069 1.3009 November 1.7078 1.2296 1.2274 00.884 6.0532 04.358 2.2098 01.591 1.3872 0.9988 December 4.7876 3.4470 2.7795 02.001 13.6279 09.812 4.8214 03.471 4.7501 3.4200

ISSN: 2277-9655
[BORO * et al., 8(2): February, 2019] Impact Factor: 5.164
IC™ Value: 3.00 CODEN: IJESS7
http: // www.ijesrt.com© International Journal of Engineering Sciences & Research Technology
[52]
IJESRT is licensed under a Creative Commons Attribution 4.0 International License.
5. CONCLUSION In summary, no detailed study of this type has yet been conducted in this region to our knowledge. The
assessment of wind potential is an important issue worldwide in terms of renewable energy. This detailed study
can make major contributions to solve this issue. In this study, the monthly and annual distributions as well as
the power and energy density were assessed during 2006-2016 on ten sites located in Burkina Faso. The analysis
performed was based on Weibull distribution function with two-parameters. From the available statistical data
and calculations made, the following conclusions can be drawn:
The standard deviation method gives the best estimate of the distribution measured for all sites.
However, the maximum likelihood method gives performances close to that of the standard deviation.
The average monthly wind speed at a maximum value of 3.57m.s-1 is recorded in Bobo-Dioulasso
(February) while a minimum of 0.61m/s is registered at Dori (November). The average annual
minimum and maximum wind speeds are obtained at Dori, 1.06m.s-1 and Bobo-Dioulasso, 3.02m.s-1,
respectively.
The average annual value of the scale parameter varies from 1.19m/s (Dori) to 3.34m/s (Bobo-
Dioulasso) while the average annual value of the shape parameter varies from 1.66 (Dori) to 3.77
(Bobo-Dioulasso).
Power density estimate for all sites shows that the highest power density values are recorded during the
first months of the year (January to August) with a maximum in May and June. This corroborates the
results obtained from Weibull parameter estimates.
The sites of Bobo-Dioulasso, Ouagadougou and Dédougou are the best sites for Burkina Faso to
exploit wind energy using small wind turbines to produce electricity.
However, according to the Pacific Northwest Laboratory (PNL) classification, which is widely used to list sites
studied according to their wind potential, power density values on all these sites are considered as low; it is
therefore necessary to conduct a survey at higher altitudes to determine the hub heights that are of significant
energy interest by extrapolation. Moreover, the study recommends an analysis of wind speed data at no reduced
time for a better understanding of the energy potential and the design or selection of wind turbines adapted to
the sites studied. Nevertheless, the results obtained make it possible to come up with excellent recommendations
for projects that wish to establish small wind turbines in Burkina.
6. ACKNOWLEDGEMENTS We would like to thank Burkina Faso National Meteorological Agency (ANAM) managers as well as the staff in
charge of collecting and processing the meteorological data collected on these sites for having made available to
us data used in our database. They also thank Internet Service Provider of the University of Uppsala, Sweden,
for their support to the project BUF01.
REFERENCES [1] A. Totouom, « Les obstacles au développement industriel de l’Afrique », Université de
Dschang,[email protected]
[2] M. Shoaib, « Evaluation of wind power potential in Baburband (Pakistan) using Weibull distribution
function », Renew. Sustain. Energy Rev., vol.70, p.1343-1351, 2017.
[3] « Annuaire statistique 2015 du Ministère de l’Energie, des Mines et des Carrières.pdf »www.mines.bf
[4] V. Katinas, G. Gecevicius, et M. Marciukaitis, « An investigation of wind power density distribution at
location with low and high wind speeds using statistical model », Appl. Energy, vol. 218, p. 442‑451,
mai 2018.
[5] I. Tizgui, F. El Guezar, H. Bouzahir, et B. Benaid, « Comparison of methods in estimating Weibull
parameters for wind energy applications », Int. J. Energy Sect. Manag, vol. 11, no 4, p. 650‑663, nov.
2017.
[6] S. A. Akdağ et A. Dinler, « A new method to estimate Weibull parameters for wind energy applications
», Energy Convers. Manag, vol. 50, no 7, p. 1761‑1766, juill. 2009.
[7] Veysel YILMAZ, H.Eray « A statistical approach to estimate the wind speed distribution: the case of
Gelibolu region », Dergisi, vol9, p.122-132, (2008).
ISSN: 2277-9655
[BORO * et al., 8(2): February, 2019] Impact Factor: 5.164
IC™ Value: 3.00 CODEN: IJESS7
http: // www.ijesrt.com© International Journal of Engineering Sciences & Research Technology
[53]
IJESRT is licensed under a Creative Commons Attribution 4.0 International License.
[8] J. A. Carta, P. Ramírez, et S. Velázquez, « A review of wind speed probability distributions used in
wind energy analysis », Renew. Sustain. Energy Rev., vol. 13, no 5, p. 933‑955, juin 2009.
[9] V. Sohoni, S. Gupta, et R. Nema, « A comparative analysis of wind speed probability distributions for
wind power assessment of four sites », Turk. J. Electr. Eng. Comput. Sci., vol. 24, p. 4724‑4735, 2016.
[10] P. Wais, « A review of Weibull functions in wind sector », Renew. Sustain. Energy Rev., vol. 70, p.
1099‑1107, avr. 2017.
[11] I. Tizgui, F. El Guezar, H. Bouzahir, et B. Benaid, « Wind speed distribution modeling for wind power
estimation: Case of Agadir in Morocco », Wind Eng.juin 2018.
[12] I. Pobočíková, Z. Sedliačková, et M. Michalková, « Application of Four Probability Distributions for
Wind Speed Modeling », Procedia Eng., vol. 192, p. 713‑718, 2017.
[13] S. H. Pishgar-Komleh, A. Keyhani, et P. Sefeedpari, « Wind speed and power density analysis based on
Weibull and Rayleigh distributions (a case study: Firouzkooh county of Iran) », Renew. Sustain.
Energy Rev., vol. 42, p. 313‑322, févr. 2015.
[14] T. B. M. J. Ouarda et al. « Probability distributions of wind speed in the UAE », Energy Convers.
Manag., vol. 93, p. 414‑434, mars 2015.
[15] T. B. M. J. Ouarda, C. Charron, et F. Chebana, « Review of criteria for the selection of probability
distributions for wind speed data and introduction of the moment and L-moment ratio diagram
methods, with a case study », Energy Convers. Manag., vol. 124, p. 247‑265, sept. 2016.
[16] I. Usta, « An innovative estimation method regarding Weibull parameters for wind energy applications
», Energy, vol. 106, p. 301‑314, juill. 2016.
[17] D. K. Kidmo, R. Danwe, S. Y. Doka, et N. Djongyang, « Statistical analysis of wind speed distribution
based on six Weibull methods for wind power evaluation in Garoua,Cameroon», revue des Energies
Renouvelables vol.18,N1,p.105-125,(2015).
[18] I. Usta, I. Arik, I. Yenilmez, et Y. M. Kantar, « A new estimation approach based on moments for
estimating Weibull parameters in wind power applications », Energy Convers. Manag., vol. 164, p.
570‑578, mai 2018.
[19] M. Landry, Y. Ouedraogo, Y. Gagnon, et A. Ouedraogo, « Atlas éolien du Burkina Faso », 17ème
Conference des parties(COP17) de la convention-cadre des Nations Unies sur les changements
climatiques (UNFCCC) 2011, Durban, Afrique du sud.
[20] Septieme Reunion du Sous-Comite Ouest and Centre Africain de Correlation des Sols pour la Mise en
Valeur des Terres, Ouagadougou, 1985. Food & Agriculture Org., 1986.
[21] H. Faida, J. Saadi, M. Khaider, et S. E. Alami, « Etude et analyse des données du vent en vue de
dimensionner un système de production d’énergie éolienne Cas d’un site au nord du Maroc »Revue des
energies renouvelables vol.13 N3, p.477-483, (2010).
[22] Indhumathy.D « Estimation of weibull paramater for wind speed calculation at Kanyakumari in india
».IJIRSET, vol.3, Issue 1, January 2014.
[23] G. A. Zohbi et P. Hendrick, « Evaluation du potentiel d’énergie éolienne au Liban »revue des Energies
Renouvelables, vol.17 N1, p.83-96, (2014).
[24] T. R. Ayodele, A. A. Jimoh, et J. L. Munda, « Statistical analysis of wind speed and wind power
potential of Port Elizabeth using Weibull parameters », J. Energy South. Afr., vol. 23, no 2, p. 9, 2012.
[25] K. S. P. Kumar et S. Gaddada, « Statistical scrutiny of Weibull parameters for wind energy potential
appraisal in the area of northern Ethiopia », Renew. Wind Water Sol., vol. 2, no 1, déc. 2015.
[26] G. D. Nage, « Analysis of Wind Speed Distribution: Comparative Study of Weibull to Rayleigh
Probability Density Function; A Case of Two Sites in Ethiopia »American journal of modern Energy,
vol.2, Issue 3, p.10-16, June 2016.
[27] V. Rasouli, S. Allahkaram, et M. R. Tavakoli, « Application of adaptability coefficient in power
production evaluation of a wind farm », in 2015 Modern Electric Power Systems (MEPS), Wroclaw,
Poland, 2015.
[28] P. Ramírez et J. A. Carta, « Influence of the data sampling interval in the estimation of the parameters
of the Weibull wind speed probability density distribution: a case study », Energy Convers. Manag.,
vol. 46, no 15‑16, p. 2419‑2438, sept. 20058.

![JESRT: 7(12), December, 2018 ISSN: 2277-9655 I International … /Archive-2018/December-2018... · 2018. 12. 15. · ISSN: 2277-9655 [DEGBEGNON * et al., 7(12): December, 2018] Impact](https://img.dokumen.tips/doc/110x75/5fec535839884410451b9530/jesrt-712-december-2018-issn-2277-9655-i-international-archive-2018december-2018.jpg)


![JESRT: 8(5), May, 2019 ISSN: 2277-9655 I International ... /Archive-2019/May-2019/10.pdf · ISSN: 2277-9655 [Akerele * et al., 8(5): May, 2019] Impact Factor: 5.164 IC™ Value: 3.00](https://img.dokumen.tips/doc/110x75/602ef9457133010f020b0a34/jesrt-85-may-2019-issn-2277-9655-i-international-archive-2019may-201910pdf.jpg)


![JESRT: 8(2), February, 2019 ISSN: 2277-9655 I ...ijesrt.com/issues /Archive-2019/February-2019/10.pdfISSN: 2277-9655 [Benti * et al., 8(2): February, 2019] Impact Factor: 5.164 IC™](https://img.dokumen.tips/doc/110x75/60644a4e76320a514046a979/jesrt-82-february-2019-issn-2277-9655-i-archive-2019february-201910pdf.jpg)