Embed Size (px)
Citation preview
Information on economic trends
November 2020


3CNB • INFORMATION ON ECONOMIC TRENDS • NOVEMBER 2020
Summary
According to the available monthly indicators, the third quarter of the year is expected to see a growth in economic activity on a quarterly level, following a sharp decline in the second quarter caused by the pandemic of the new coronavirus and restrictive measures introduced to combat it. Employment continued to grow and the number of unemployed persons continued to fall in September. Despite favourable developments in the labour market, the number of employed and unemployed persons continued to be considerably more unfavourable than in the period before the outbreak of the pandemic. The epidemiological situation deteriorated substantially towards the end of October, which could, should such a situation continue, have a negative impact on the pace of recovery. The overall consumer price inflation rose slightly, from –0.1% in August to 0.0% in September. By contrast, core inflation fell from 1.2% to 0.7%, influenced by a fall in the annual rate of change in the prices of individual food products, clothing and footwear, and catering and accommodation services. The highly expansionary monetary policy continued into October with the banks’ free reserves reaching a historical high, supported by a fall in currency in circulation and government kuna deposits with the CNB. The annual growth in total placements of banks accelerated to 3.7% in September, with the growth in placements to non-financial corporations accelerating as a result of the base effect, while the annual growth in household placements slowed down slightly. Following a considerable deficit in the general government budget of HRK 13.2bn in the first half of the year, the monthly data of the Ministry of Finance point to more favourable budgetary developments in the third quarter. The relative indicator of general government debt at the end of July stood at 82.5% of GDP, up 9.7 percentage points from the end of 2019, reflecting among other things the considerable increase in the need to finance the deficit in the same period.
The GDP nowcasting model suggests an increase in econom-ic activity in the third quarter from the previous three months, but this growth will not be sufficient to compensate for the previ-ous month’s fall (Figure 1). In the third quarter of 2020, indus-trial production was up 7.9% from the previous three months, thus returning to its beginning-of-year level. Observed by MIG categories, on a quarterly level. the manufacture of durable consumer goods rose the most, although production rose in all other main industrial groupings. Observed on a monthly level, industrial production in September rose by 1.7% from August (Figures 3 and 4). Real retail trade turnover rose by 1.8% on a monthly level in September, with the average turnover in the July to September period being up 7.4% from the previous three months, although it was still below the level of the beginning of the year (Figure 7). After a considerable recovery in June and a small contraction in July, construction activity held steady at the July level (–0.1%) in August. As a result, the average activity in July and August was up 4.6% from that in the previous three months. Data suggest that the volume of construction works on buildings and civil engineering works rose on a quarterly level. Despite this recovery, the volume of construction works in July and August was on the level of the average volume in the last quarter of 2019 (Figures 5 and 6).
The consumer confidence index improved slightly in October from September, but was below its third quarter average and much below the beginning-of-year level. The monthly growth in consumer optimism in September was the result of better ex-pectations regarding the overall economic situation in Croatia for 12 months compared to the present situation and better ex-pectations regarding the consumption of durable goods over the next year. By contrast, the expectations regarding the financial situation of households for 12 months compared unfavourably with the current situation. Business expectations on a monthly level improved in construction and services, held steady at Sep-tember level in industry and deteriorated in trade. October busi-ness optimism was higher in all activities than that of the previ-ous three-month average but was still much below the levels re-corded at the beginning of the year. Optimism declined the most in trade and services (Figure 8).
The dynamics of employment growth in September was equal to that in August, with the number of employed persons rising in most activities, with the exception of accommodation and food service activities. On a quarterly level, employment in
the third quarter was on average 0.9% higher than in the second quarter when it fell by 3.6% (Figure 15). The number of em-ployees for whom employers were paid job preservation support in activities hit by the coronavirus pandemic, fell in the June to August period (more recent data are not unavailable) to 4% of the total number of employed persons (compared to 30% in the March to May period), thus reducing the negative risk of the potential source of newly unemployed persons. The number of employed persons in September was down 2.3% on an annual level. An increased outflow from the register due to employment led to a fall in the number of unemployed persons in September too, with the result that the number of unemployed persons in the third quarter was on average 1.8% lower than the second quarter average. The fall in the number of unemployed persons affected the registered unemployment rate, which fell from 9.9% in August to 9.5% in September (Figure 16). Despite a fall in the number of unemployed persons, unemployment in September was still one-third higher than in the same period of the previous year. As regards wages, the average nominal gross wage grew in September at a similar intensity as in August, with wage growth being widely distributed. The average nominal gross wage in the third quarter was 2% higher than that in the second quarter (Figure 17). On an annual level, the average nominal gross wage in the third quarter was 2.4% higher than in the same period of the previous year, with wages in the public sector rising by 7.5% and those in the private sector by 0.5%. During the same pe-riod, owing to an almost complete absence of payments of non-taxable compensations across all activities, net wages increased by non-taxable compensations were almost equal to the average net wage paid.
Consumer prices rose by 0.8% in September from the month before (Table 1). This was mostly due to the seasonal increase in the prices of clothing and footwear, which was less pronounced than in the year before. The rise in consumer prices in Septem-ber was mitigated the most by a fall in the prices of meat and accommodation services. In addition, the retail prices of refined petroleum products fell slightly in September, mirroring the fall in crude oil prices on the global market driven by the concerns of market participants regarding the negative impacts of epidemio-logical measures to contain the pandemic on global economic activity. As a result, the average price of a barrel of Brent crude oil stood at USD 41 in September, down by USD 3 from Au-gust (Figure 20). The annual rate of change in consumer prices

4 CNB • INFORMATION ON ECONOMIC TRENDS • NOVEMBER 2020
rose slightly from –0.1% in August to 0.0% in September (Fig-ure 19), mostly as a result of an increase in the annual rate of change in the prices of schoolbooks and some unprocessed food products (fruit and vegetables). By contrast, September saw a smaller contribution of the prices of some food products (meat, bread and milk), clothing and footwear and restaurants and ho-tels to developments in annual inflation. As a result, the annual rate of core inflation, excluding the prices of agricultural prod-ucts, energy and administered prices, slowed down from 1.2% in August to 0.7% in September. The annual fall of producer prices in the domestic market accelerated from –2.7% in August to –3.2% in September.
After falling sharply in the second quarter of 2020 (goods ex-ports by 18.0% and goods imports by 24.4% from the previous quarter), foreign trade in goods recorded a noticeable growth in the early third quarter. This is true primarily of goods exports, which rose by 16.7% in July from the previous three months’ average (Figure 10), owing to bigger exports of textile indus-try products, energy products (most notably oil and refined pe-troleum products) and chemical products. Total goods imports in July were somewhat smaller than goods exports and stood at 12.7% (Figure 11). This can mostly be attributed to the growth in imports of road vehicles (Figure 12), capital goods (particu-larly telecommunications and sound-recording and reproducing apparatus) and metal and wood industry products. By contrast, the imports of energy products declined due to a noticeable fall in the imports of oil and refined petroleum products. As a result, the foreign trade deficit rose by 5.3% in July from the previous quarter average (Figure 13). If the first available data for Au-gust are included, total developments in goods trade in July and August were nevertheless more unfavourable than those in July only, with the growth in goods exports slowing down (10.7%) and that in goods imports accelerating (15.6%) from the pre-vious quarter average. The recovery in foreign trade in goods is also visible if annual rates of change are observed. Following a sharp fall in total goods exports and imports of 15.7% and 15.9%, respectively, in July, from the same period of the previ-ous year, August witnessed a noticeable slowdown in the fall in the goods trade with the exports falling by 3.2% and imports by 9.2% from August 2019.
October saw a further seasonal weakening of the kuna against the euro, fuelled also by the uncertainty regarding the coronavirus pandemic. The daily nominal exchange rate moved within a narrow range of –0.3% to +0.1% around the average exchange rate of EUR/HRK 7.57 (Figure 22). At the end of Oc-tober, the exchange rate stood at EUR/HRK 7.57, having risen by 0.3% from end-September or by 1.6% from the same period last year. In addition to weakening against the euro, the kuna also weakened against the yuan renminbi, which resulted in a depreciation of the daily nominal effective exchange rate of the kuna of 0.2% in October from the end of the previous month. A more pronounced depreciation was partly mitigated by the strengthening of the kuna against the Turkish lira, reflecting the strengthening of the euro against that currency in the global for-eign exchange market.
The overnight interest rate on the euro area banking mar-ket, EONIA, rose slightly in October and stood at –0.47% at the end of the month, while the six-month EURIBOR continued to decline and stood at –0,52% (Figure 25). The risk premi-ums for European emerging market economies were stable in October (Figure 26). The risk premium for Croatia remained al-most unchanged at the level of 76 basis points and continued to record slightly higher values than the peer countries of Central and Eastern Europe, with the exception of Romania, which con-tinued to stand out in terms of the risk premium level.
The highly expansionary monetary policy continued into Oc-tober with the banks’ free reserves reaching a historical high, fuelled by a fall in currency in circulation and government ku-na deposits with the CNB. Thus the average daily surplus ku-na liquidity of the domestic banking market in October stood at HRK 42.6bn (Figure 55). Amid ample kuna liquidity, there had been no turnover in the domestic interbank overnight mar-ket since April, while the turnover in other segments of the mon-ey market in October continued to be modest, despite a small increase from the previous month. The overnight interest rates on interbank demand deposit trading and repo transactions fell slightly in October to 0.01% and –0.05%, respectively, while the implicit interest rate on foreign exchange swap trading remained almost unchanged at –0.19% (Figure 28).
Banks’ interest rates on new corporate and household loans, which include pure new loans and renegotiated loans, mostly fell or remained almost unchanged in September, while the interest rates on long-term housing loans to households with a currency clause rose slightly as a result of an increase in interest rates on renegotiated loans (Figures 29 and 30). The interest rates on pure new loans mostly show the same developments (Figures 31 to 34), with the interest rate on corporate kuna loans for work-ing capital standing out, having fallen the most. As for deposits, the interest rate on household time deposits in September re-mained almost the same as in the month before, while the inter-est rate on corporate time deposits continued to fall slightly and reached its lowest level ever (Figures 35 and 36). In line with the described developments, the spread between the interest rates on new loans and deposits fell to 4.8 percentage points in September, mostly as a result of a fall in interest rates on loans, while the spread between interest rates on loan and deposit bal-ances stood at 4.0 percentage points (Figure 38).
Monetary developments in September were marked by a fall in total liquid assets (M4) of HRK 1.2bn (transaction-based), brought about by a fall in net foreign assets (NFA) of mone-tary institutions, while net domestic assets (NDA) of the mon-etary system remained unchanged. The annual growth in M4 in September slowed down from August (Figure 50). As regards the components of total liquid assets, money (M1) fell by HRK 1.6bn from August (Figure 49), mostly as a result of a fall in demand deposits of non-financial corporations but also in cur-rency outside banks, which typically falls in September follow-ing the end of the main part of the summer tourist season. At the same time, quasi-money rose by HRK 0.4bn, mostly due to an increase in household foreign currency deposits (Figure 53).
Total placements of monetary institutions to domestic sec-tors (except the central government) held steady in September relative to August (transaction-based), with placements to non-financial corporations falling and placements to households ris-ing slightly (Figures 42 and 43). Housing loans again accounted for the bulk of placements to the household sector, while gener-al-purpose cash loans held steady, following their predominantly downward trend in the previous few months. If analysed on an annual basis, the growth in total placements and placements to non-financial corporations accelerated slightly to 3.7% (Figure 41) and 4.9%, respectively in September as a result of the base effect, i.e. a somewhat sharper fall in lending to that sector in the same period of the previous year. The annual growth in house-hold loans slowed down slightly to 3.6% in September, driven by a further slowdown in the growth of general-purpose cash loans (from 2.0% to 0.9%), while the growth of housing loans contin-ued to accelerate (from 8.3% to 8.4%), although at a slower pace than in the previous several months. In terms of currency struc-ture, the share of kuna placements in total household placements continued to grow, reaching 55.2% in September (Figure 48).

5CNB • INFORMATION ON ECONOMIC TRENDS • NOVEMBER 2020
Gross international reserves did not change much in October and stood at EUR 18.2bn at the end of the month (Figure 57), having dropped by EUR 0.4bn or 2.2% from the end of the pre-vious year. During the same period, net usable reserves shrank by EUR 1.0bn or 5.7% and stood at EUR 16.4bn at the end of October.
The net external debt fell by a sharp EUR 1.9bn in July and August 2020 (Figure 61), driven mostly by government delev-eraging following July repayment by the government of USD 1.25bn international bond issued in 2010 and the usual seasonal improvement in the foreign position of banks owing to the for-eign exchange inflow during the peak tourist season. However, the improvement in the net foreign position of banks was notice-ably smaller than in the same period of the year before, which may be associated with a fall in revenues from tourism this sum-mer. By contrast, the net foreign position of the central bank deteriorated only slightly, driven by withdrawals of the govern-ment’s and other domestic sectors’ foreign currency deposits. At the end of August, gross external debt stood at EUR 41.1bn (Figure 63), having fallen by EUR 0.4bn from the end of the second quarter, the result of domestic sectors deleveraging and, to a lesser extent, the favourable effect of cross-currency chang-es and other adjustments.
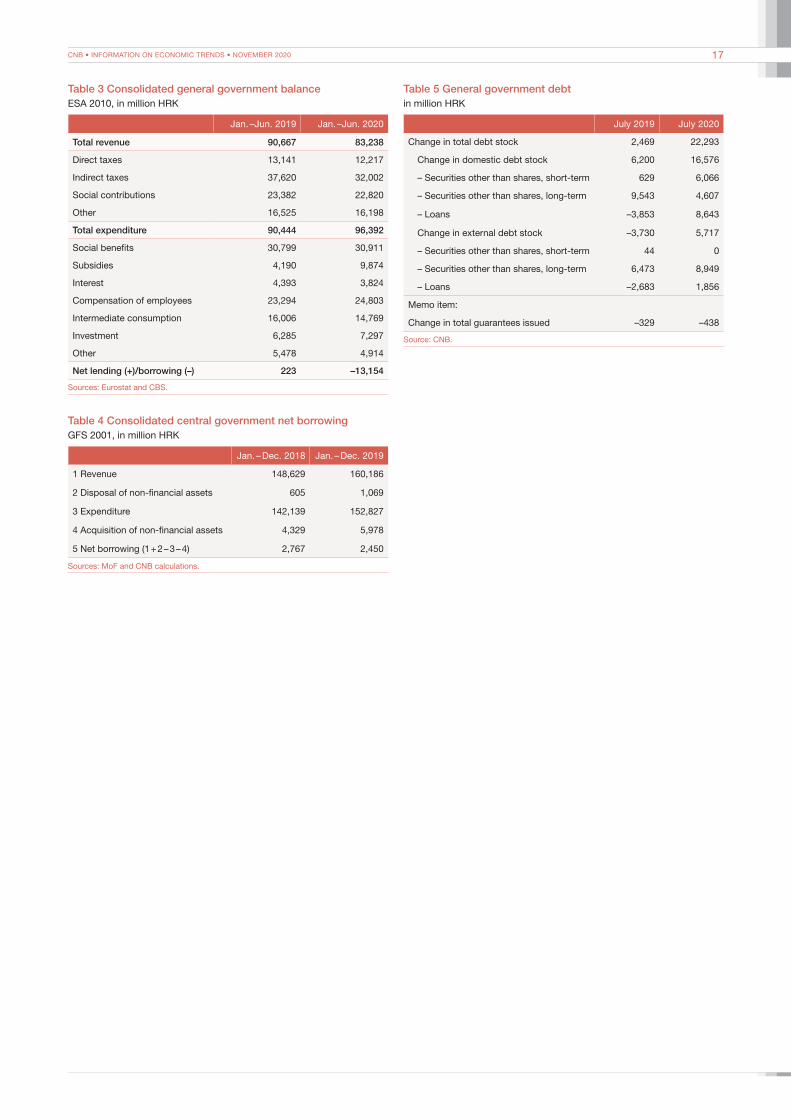
A considerable budget deficit of HRK 13.2bn recorded in the first half of 2020 mirrors primarily the unfavourable outturn in the second quarter when the budget ran a deficit of HRK 9.9bn (in contrast with the surplus of HRK 2.5bn recorded in the same period of the previous year). Such an outturn reflects a sharp fall in revenues and a rise in expenditures in the second quarter from the same period of the previous year. The analysis of cu-mulative developments in budget revenues in the first half of the year shows that the fall in total revenues of 8.2% was mostly due to revenues from indirect taxes, which fell by 14.9% mostly due to a fall in personal consumption and the implementation of the VAT-related tax cuts. The revenues from the sale of goods and services also made a negative contribution to the fall in total rev-enues, which is the result of the limited provision of most pub-lic services and other government services due to the restrictive epidemiological measures introduced. The fall in revenues from direct taxes was less pronounced (7.0%), largely reflecting the implementation of the measures for alleviating the negative im-pacts of epidemiological measures on developments in the num-ber of employed persons. Revenues from direct taxes were also
affected by tax write-offs and tax cuts under the fourth round of tax reform. As in the case of taxes, social contributions also witnessed a somewhat smaller effect of the crisis on revenues, which fell by 2.4%, while other revenues, connected with a fur-ther relatively successful absorption of EU funds and withdrawal of a part of unused funds from the current financial envelope and their rechannelling to the prevention of the negative effects of the pandemic, fell the least (2.0%). The first half of the year saw a significant annual increase in total expenditures (6.6%). The growth in total expenditures was mostly fuelled by a sharp rise in expenditures for subsidies of 135.7%, reflecting subsidies paid to employers for job preservation. General government in-vestments, employee compensations and social benefits grew at a much slower rate (16.1%, 6.5% and 0.4%, respectively). While the increase in investments reflects the mentioned better absorp-tion of EU funds, the growth in employee compensations is the result of a previously agreed wage increase in health care and education and the 2% increase in the wage base in the public sector from 1 January 2020. The fall in expenditures for interest (12.9%) had the opposite effect on the developments in total ex-penditures as a result of favourable refinancing of the previously maturing debt, and so did the fall in intermediate consumption (7.7%), as a result of a reallocation of a part of these expendi-tures under budget review to other expenditure items, and the fall in other expenditures (10.3%).
According to the Ministry of Finance1 data for the third quar-ter of this year, owing to favourable developments in August, the central government generated a surplus of HRK 1.4bn. Al-though this is a decline of HRK 6.0bn from the same period of 2019, reflecting a fall in revenues paired with an increase in expenditures, there is a visible recovery from the second quarter when the budget outturn was HRK 15.6bn lower than in the same period the year before.
Towards the end of July, the consolidated general govern-ment debt stood at HRK 320.3bn, an increase of HRK 27.3bn from the end of 2019. A sharp rise in the debt mirrors the in-creased need of the government for budget deficit financing in 2020 as a result of the unfavourable impact of the crisis caused by the pandemic and the measures implemented to combat the crisis.2 The government met the increased need for budget defi-cit financing mostly on the domestic market, at favourable bor-rowing conditions.
1 Monthly data for central government, state government and social security sub-sectors, which, pursuant to Council Directive 2011/85/EU, have to be published before the end of the following calendar month. The published data refer to general government units according to the scope of the ESA 2010 statistical method-ology, except for data for the local government, which are published on a quarterly basis.
2 In addition, data revision due to the reclassification of a series of units from the sector of non-financial corporations into central and local government raised the level of debt from January 2001, with a more considerable spike in the period from 2007 to 2014 being a consequence of the reclassification of the company HŽ Putnički prijevoz.

6 CNB • INFORMATION ON ECONOMIC TRENDS • NOVEMBER 2020
–16
–12
–8
–4
0
4
8
68
76
84
92
100
108
116
Figure 1 Quarterly gross domestic productseasonally adjusted real values
%
2015
= 1
00
Year-on-year rate of change of GDPLevel of GDP (seasonally adjusted values) – right
Note: Data for the third quarter of 2020 are estimated using the CNB's monthly indicator of real economic activity, based on data published until 31 October 2020.Sources: CBS data seasonally adjusted by the CNB and CNB calculations.
202020182013 2014 2015 2016 2017 2019
–6
–4
–2
8
6
–6
–4
–2
8
6
%
0
2
4
0
2
4
Figure 2 GDP rate of changecontributions by components
perc
enta
ge p
oint
s
Imports of goods and services Gross fixed capital formationExports of goods and services Government consumptionChanges in inventories Household consumptionGross domestic product – right
Source: CBS.
2012 2013 2014 2015 201920182016 2017
%
–9
–6
–3
0
3
12
9
6
88
92
96
100
104
108
116
112
Figure 3 Industrial production
Note: Data for the third quarter of 2020 refers to July and August.Source: CBS data seasonally adjusted by the CNB.
2015
= 1
00
Quarterly rate of change of seasonally adjusted indexTrend-cycle – right
2018 20202013 2014 2015 2016 2017 2019
30
40
50
60
70
80
90
100
110
120
130
Figure 4 Industrial production by main industrial groupingsseasonally adjusted indices
Note: Quarterly data are calculated as the average of monthly data.Source: CBS data seasonally adjusted by the CNB.
Intermediate goodsCapital goods
Non-durable consumer goodsDurable consumer goods
2015
= 1
00
Energy
202020182013 2014 2015 2016 2017 2019
%
50
60
70
80
90
100
110
120
130
140
–10
–8
–6
–4
–2
0
2
4
6
8
Figure 5 Total volume of construction works
Note: Data for the third quarter of 2020 refers to July and August.Source: CBS data seasonally adjusted by the CNB.
Trend-cycle – rightQuarterly rate of change of seasonally adjusted index
2015
= 1
00
2020201920182013 2014 2015 2016 2017
%
–12
–8
–4
0
4
8
12
16
40
60
80
100
120
140
160
180
Figure 6 Buildings and civil engineering works
Source: CBS data seasonally adjusted by the CNB.
2015
= 1
00
Buildings (trend-cycle)Civil engineering works (trend-cycle)
Buildings (quarterly rate of change) – rightCivil engineering works (quarterly rate of change) – right
202020192013 2014 20182015 2016 2017

7CNB • INFORMATION ON ECONOMIC TRENDS • NOVEMBER 2020
%
55
70
85
100
115
130
–30
–20
–10
0
10
20
Figure 7 Real retail trade turnover
Source: CBS data seasonally adjusted by the CNB.
Trend-cycle – rightQuarterly rate of change of seasonally adjusted index
2015
= 1
00
20202013 2014 20182015 2016 2017 2019
50
130
60
70
80
90
100
110
120
Figure 8 Consumer and business confidence indicatorsstandardised and seasonally adjusted values
Construction business confidence indicatorRetail trade business confidence indicator
Industry business confidence indicatorLong-run average = 100
Sources: Ipsos and CNB data seasonally adjusted by the CNB.
Services business confidence indicator CCI consumer confidence index
2019 20202018201720152013 2014 2016
60
120
–40
–30
–20
–10
0
20
10
70
88
100
110
90
Figure 9 EU confidence indicesseasonally adjusted series
Note: Data are up to September 2020.Source: Eurostat.
Industrial confidence indexConsumer confidence indexEconomic Sentiment Index (ESI) – right
long
-run
ave
rage
= 1
00
in %
, bal
ance
of r
espo
nses
20202013 20182014 2015 2016 2017 2019
–20
–10
0
10
20
Note: Data for the third quarter of 2020 refer to July.Source: CBS data seasonally adjusted by the CNB.
Figure 10 Goods exports (f.o.b.)
billi
on E
UR
in %
, sea
sona
lly a
djus
ted
Total exports (quarterly rate of change) – rightExports excl. energy (quarterly rate of change) – right
Total exports (trend-cycle)Exports excl. energy (trend-cycle)
2019 202020152013 2014 20182016 20170.6
0.8
1.0
1.2
1.4
–30
–20
–10
0
10
20
Note: Data for the third quarter of 2020 refer to July.Source: CBS data seasonally adjusted by the CNB.
Figure 11 Goods imports (c.i.f.)bi
llion
EUR
in %
, sea
sona
lly a
djus
ted
Total imports (quarterly rate of change) – rightImports excl. energy (quarterly rate of change) – right
Total imports (trend-cycle)Imports excl. energy (trend-cycle)
20202013 2014 2015 20182016 2017 20190.9
1.2
1.5
1.8
2.1
2.4
–55
80
–40
–25
–10
5
20
35
50
65
Notes: Imports of capital equipment (SITC divisions 71 – 77). Data for the third quarter of 2020 refer to July.Source: CBS data seasonally adjusted by the CNB.
Figure 12 Imports of capital equipment and roadvehicles (c.i.f.)
billi
on E
UR
in %
, sea
sona
lly a
djus
ted
Imports of road vehicles (quarterly rate of change) – rightImports of capital equipment (quarterly rate of change) – right
Imports of road vehicles (trend-cycle)Imports of capital equipment (trend-cycle)
20202013 2014 2015 20182016 2017 2019–0.05
0.00
0.05
0.10
0.15
0.20
0.25
0.30
0.35
0.40

8 CNB • INFORMATION ON ECONOMIC TRENDS • NOVEMBER 2020
–50
–40
–30
–20
–10
0
10
20
30
40
Note: Data for the third quarter of 2020 refer to July.Source: CBS data seasonally adjusted by the CNB.
Figure 13 Trade of goods balancebi
llion
EUR
% s
easo
nally
adj
uste
d
20202013 2014 2015 20182016 2017 2019
Total balance (quarterly rate of change) – right Balance excl. energy products (quarterly rate of change) – right
Total balance (trend-cycle) Balance excl. energy products (trend-cycle)
–0.9
–0.8
–0.7
–0.6
–0.5
–0.4
–0.3
–0.2
–0.1
0.0
Figure 14 Trade in goods balance by product groups
Notes: Series are shown as three-member moving averages of monthly data. Data are up to July 2020.Source: CBS.
billi
on E
UR
Energy sources Capital goods ShipsRoad vehicles Other
TotalRaw materials excl. food and energyFood
–1.2
–0.8
–0.6
–0.4
–0.2
0.0
0.2
2013 2014 2015 2016 2019 20202017 2018
–1.0
Source: CPII data seasonally adjusted by the CNB.
perc
enta
ge p
oint
s
Figure 15 Employment by NCA activities seasonally adjusted data, contributions to the quarterly rate of change
in th
ousa
nd
Public sector (O, P, Q) Other Industry (B, C, D, E)Construction (F)IT sector and business activities (J, M, N)
Service activities (G, H, I)Employment – right
20202018201720162013 2014 2015 20191,350
1,400
1,450
1,500
1,550
1,600
1,650
1,700
1,750
1,800
1,850
1,900
–3.0
–3.5
–4.0
1.5
–2.5
–2.0
–1.5
–1.0
–0.5
0.0
0.5
1.0
6
10
12
14
16
18
20
22%
8
Registered unemployment rate Adjusted unemployment rateILO unemployment rate
Figure 16 Unemployment ratesseasonally adjusted data
Notes: Since January 2015, the calculation of the registered unemployed rate has used the data on employed persons from the JOPPD form. Data on the number of employed persons have been revised backwards for the period from January 2016 to December 2019. The adjusted unemployment rate is the CNB estimate and is calculated as the share of the number of registered unemployed persons in the working age population (unemployed persons and persons insured with the CPII). Sources: CBS and CNB calculations (seasonally adjusted by the CNB).
%
2020201920182013 2014 2015 20172016
–4–3–2–1
01234%
1000200030004000500060007000
90008000
HRK
Figure 17 Average nominal gross wage by NCA activitiesseasonally adjusted data, quarterly rate of change
Notes: Data on the average nominal gross wage by activity refer to data from the RAD-1 form, and from January 2016 to data from the JOPPD form. Data on average wages paid in February 2020 were reported in full-time equivalent, in contrast with the previous periods, when average wages were calculated by dividing total disbursements by the number of employees who received these disbursements, excluding all those who worked fewer than 80 hours per month. Data on wages in 2019 reported in full-time equivalent were released for analytical purposes. Data on disbursements paid before 2016 are CNB estimates. Sources: CBS and CNB calculations (seasonally adjusted by the CNB).
202020182013 2014 2015 20172016 2019
Nominal net wage – rightNominal net wage increased by compensation – right
Industry (B, C, D, E) Public sector (O, P, Q) Nominal gross wage
Private sector
%
–8
–4
0
4
8
Figure 18 Consumer price index and core inflationannualised month-on-month rate of changea
a The month-on-month rate of change is calculated based on the quarterly moving average of seasonally adjusted consumer price indices.Sources: CBS and CNB calculations.
Consumer price index Core inflation
2018 20202013 20172014 2015 2016 2019

9CNB • INFORMATION ON ECONOMIC TRENDS • NOVEMBER 2020
Figure 19 Year-on-year inflation rate and contributions ofcomponents to consumer price inflation
a Core inflation does not include agricultural product prices, energy prices and administered prices.Sources: CBS and CNB calculations.
perc
enta
ge p
oint
s
Energy Unprocessed food Processed foodNon-food industrial goods without energy ServicesCore inflation (%)a Consumer price index (%)
2017 2020201920182015 2016–2.5
–1.5
–0.5
0.5
1.5
2.5
3.5
10
20
70
80
90
100
110
120
130
60
50
40
30
100
200
300
400
500
600
700
800
Figure 20 Crude oil prices (Brent)
Sources: Bloomberg and CNB calculations.
Brent (USD/barrel) Brent (HRK/barrel) – right
USD/
barr
el
HRK/
barr
el
2018 20202013 20172014 2015 2016 2019
80
90
100
110
120
130
140
150
160
170
Figure 21 HWWI index (excl. energy)
Sources: HWWI and CNB calculations.
2015
= 1
00
HWWI index (USD) HWWI index (HRK)
2018 20202013 20172014 2015 2016 2019
Table 1 Price indicatorsyear-on-year and month-on-month rates of change
Year-on-year rates
Month-on-month rates
8/20 9/20 919 9/20
Consumer price index and its components
Total index –0.1 0.0 0.8 0.8
Energy –5.9 –5.8 –0.5 –0.4
Unprocessed food 0.1 0.7 –1.4 –0.8
Processed food 2.7 2.1 0.2 –0.4
Non-food industrial goods without energy
–0.2 0.0 4.3 4.5
Services 1.5 1.4 –0.2 –0.3
Other price indicators
Core inflation 1.2 0.7 1.6 1.1
Index of industrial producer prices on the domestic market
–2.7 –3.2 0.5 0.0
Brent crude oil price (USD) –25.3 –34.1 5.2 –7.2
HWWI index (excl. energy, USD) 13.5 19.2 0.5 5.5
Note: Processed food includes alcoholic beverages and tobacco.Sources: CBS, Bloomberg and HWWI.
Figure 22 Daily nominal exchange rate – HRK vs. EUR, USD and CHFCNB midpoint exchange rate
Source: CNB.
6.0
6.5
7.0
7.5
8.0
8.5
9.0
9.5
EUR/HRK USD/HRK – right CHF/HRK – right
4.5
5.0
5.5
6.0
6.5
7.0
8.0
7.5
201820142013 202020192015 2016 2017
90
100
110
120
130
140
150
160
170
Figure 23 Nominal and real effective exchange ratesof the kuna
Notes: The real effective exchange rate of the kuna deflated by producer prices includes the Croatian index of industrial producer prices on the total market. The unit labour cost is calculated as the ratio between compensation per employee and labour productivity (defined as GDP per person employed), while the real effective exchange rate of the kuna deflated by unit labour costs is the result of the interpolation of quarterly values. A fall in the index indicates an effective appreciation of the kuna.Source: CNB.
NominalReal (CPI)Real (PPI)
Real (ULC total economy)
inde
x, 2
010
= 1
00
Real (ULC manufacturing)
2002
2003
2004
2005
2006
2007
2008
2009
2010
2011
2012
2017
2014
2013
2015
2016
2001
2020
2019
2018

10 CNB • INFORMATION ON ECONOMIC TRENDS • NOVEMBER 2020
Figure 24 Contributionsa of individual currencies to the monthly rate of change of the average index of the nominal effective kuna exchange rate (INEER)
a Negative values indicate contributions to the appreciation of the INEER.Source: CNB.
perc
enta
ge p
oint
s
EUR USD CHF Other currencies INEERmom
–2.0
–1.0
–0.5
0.0
0.5
1.0
1.5
–1.5
2020201720142013 2015 2016 20192018
%
–200
–100
0
100
200
300
Figure 25 Interest rates on the euro and the average yield spread on bonds of European emerging market countries
Note: EMBI, or the Emerging Market Bond Index, shows the spread between yieldson government securities of emerging market economies, Croatia included, andrisk-free securities issued by developed countries.Sources: ECB, Bloomberg and J.P. Morgan.
basi
s po
ints
ECB benchmark rate EONIA 6M EURIBOREMBI spreads for European emerging market countries – right
–1.0
0.0
0.5
1.0
1.5
2019 20202013 2014 2015 20172016 2018
–0.5
0
50
100
150
200
250
300
350
400
450
Figure 26 CDS spreads for 5-year government bonds of selected countries
Note: Credit default swaps (CDS) spread is an annual premium that a CDS buyer pays for protection against credit risk associated with the issuer of an instrument.Source: S&P Capital IQ.
basi
s po
ints
CroatiaPoland
Czech R.BulgariaRomania Slovenia
HungarySlovak R.
ItalyGermany
2019 20202013 2014 20172015 2016 2018
0
100
200
300
400
500
Unicredit S.p.A. Erste Group Bank AGIntesa Sanpaolo S.p.A.Raiffeisen Bank International AG
Figure 27 CDS spreads for selected parent banks of domestic banks
basi
s po
ints
Source: S&P Capital IQ.
2019 20202013 2014 2015 2016 2017 2018
%
0
20
40
60
80
Figure 28 Overnight interest rates and turnovers
Source: CNB.
–0.4
0.4
–0.3
–0.2
–0.1
0.1
0.2
0.3
0.0
turn
over,
in b
illion
HRK
20202019
Bank repo operations – right Bank deposit trading – right
Interbank trading – right
Interbank interest rateInterest rate on interbank demand deposit trading
Interest rate on bank repo operationsImplied interest rate on interbank fx swap trading
Bank fx swap trading – right
%
0
2
4
6
8
10
12
Figure 29 Short-term financing costs in kuna without a currency clause
Sources: MoF and CNB.
364-day T-bills (HRK)Short-term kuna corporate loans without a currency clauseShort-term kuna household loans without a currency clause
20202013 2014 2015 2016 2017 2018 2019

11CNB • INFORMATION ON ECONOMIC TRENDS • NOVEMBER 2020
%
0
2
4
6
8
10
Figure 30 Long-term financing costs in kuna with a currency clause and in foreign currency
Note: EMBI, or the Emerging Market Bond Index, issued by developed countries, shows the spread between yields on government securities of emerging market economies, Croatia included, and risk-free securities of developed countries. Sources: MoF, Bloomberg and CNB.
Long-term corporate loans with a currency clause
546/547-day T-bills (EUR, indexed to f/c) 455-day T-bills (EUR, indexed to f/c)
Long-term housing loans to households with a currency clauseYield on generic 10-year German bond + EMBI CroatiaLong-term household loans with a currency clause, excl. housing loans
20202013 2014 2015 2016 2017 2018 2019
0
2
4
6
8
1
3
5
7
NIR
on n
ew lo
ans,
in %
Figure 31 Bank interest rates on loans to non-financialcorporations by volume
Source: CNB.
Interest rate spread between loans up to HRK 7.5m and loans over HRK 7.5m
Loans up to HRK 7.5m Loans over HRK 7.5m
2013 2014 2015 2018 202020172016 2019
%
0
4
6
8
10
2
Figure 32 Interest rates on pure new loans to non-financial corporations
Source: CNB.
Working capital loans in kunaWorking capital loans in kuna indexed to f/cInvestment loans in kuna indexed to f/c Revolving loans, overdrafts and credit card credit in kuna
2015 2020201820172016 2019
%
Figure 33 Interest rates on pure new housing loans to households
Source: CNB.
Housing loans in kuna Housing loans in f/cTotal housing loans
2.5
3.0
3.5
4.0
4.5
5.0
5.5
2015 2020201820172016 2019
%
3
4
6
7
8
9
10
5
Consumer loans in kuna Consumer loans in f/cTotal consumer loans Other loans
Figure 34 Interest rates on pure new consumer loans and other loans to households
Note: Consumer loans include total loans to households excl. housing and other loans. Other loans to households (denominated almost exclusively in kuna) include credit card loans, overdrafts, revolving loans and receivables on charge cards.Source: CNB.
2015 2020201820172016 2019
%
0
1
2
3
4
5
Figure 35 Interest rates on household time deposits
Source: CNB.
Short-term household time deposits in kunaLong-term household time deposits in kuna
Short-term household time deposits in f/cLong-term household time deposits in f/c
Total household time deposits
2013 2014 2015 2020201820172016 2019

12 CNB • INFORMATION ON ECONOMIC TRENDS • NOVEMBER 2020
%
0
1
2
3
4
5
6
7
8
Figure 36 Interest rates on corporate time deposits
Source: CNB.
Short-term corporate time deposits in kunaLong-term corporate time deposits in kuna
Short-term corporate time deposits in f/cLong-term corporate time deposits in f/c
Total corporate time deposits
2013 2014 2015 2020201820172016 2019
%
0
2
4
6
8
10
Figure 37 Average interest rates on loans (excl. revolving loans) and deposits
a For time deposits, interest rates on newly received deposits are weighted by their balances.Source: CNB.
Loans – balances Loans – newDeposits – balances Deposits – newa
2013 2014 2015 2020201820172016 2019
%
2
9
3
4
5
6
7
8
Figure 38 Spread between interest rates on loans (excl. revolving loans) and interest rates on deposits
Note: Spread between average interest rates on loans and average interest rates on deposits should be differentiated from net interest margin (the ratio of the difference between interest income and interest expenses to total assets of credit institutions).Source: CNB.
Kuna loans without a currency clause – kuna deposits without a currency clauseKuna loans with a currency clause – deposits in f/cTotal – new Total – balances
2013 2014 2015 2018 202020172016 2019
–25
–15
–5
5
15
25
35
Source: CNB.
Figure 39 Net foreign assets, net domestic assets and totalliquid assets (M4)absolute change in the last 12 months
billi
on H
RK
Net foreign assets Net domestic assets M4
2018 20202013 201720152014 2016 2019
–25
–15
–5
5
15
35
25
Source: CNB.
Figure 40 Net domestic assets, structureabsolute change in the last 12 months
billi
on H
RK
Net placements to the government Placements
Other net assets Net domestic assets
2018 20202013 201720152014 2016 2019
2
3
1
–10
0
5
–5
15
10
–1
0
%
–2
Figure 41 Placements
billi
on H
RK
Year-on-year rate of change (transaction-based) – right
Transactions in total placementsYear-on-year rate of change (balance-based) – right
Source: CNB.
2018 20202013 201720152014 2016 2019

13CNB • INFORMATION ON ECONOMIC TRENDS • NOVEMBER 2020
–2
–1
0
1
3 %
–12
18
–6
0
6
122
Figure 42 Placements to corporatesbi
llion
HRK
Source: CNB.
Year-on-year rate of change (transaction-based) – right
Transactions in corporate placementsYear-on-year rate of change (balance-based) – right
2018 20202013 201720152014 2016 2019
%
–10
10
–5
0
5
Figure 43 Placements to households
billi
on H
RK
Source: CNB.
Year-on-year rate of change (transaction-based) – right
Transactions in household placementsYear-on-year rate of change (balance-based) – right
–1.6
–0.8
0.0
0.8
1.6
2018 20202013 201720152014 2016 2019
–15
–10
–5
0
5
10
15
20
25
30%
Figure 44 Annual rate of change in household placementstransaction-based
Source: CNB.
Kuna household placement F/c household placementsTotal household placements
2013 20202018201720152014 2016 2019
–10
–5
0
5
10
15%
Figure 45 Annual rate of change in corporate placements transaction-based
Source: CNB.
Kuna corporate placement F/c corporate placementsTotal corporate placements
2013 20202018201720152014 2016 2019
0
50
100
150
200
250
300
350
Figure 46 Structure of placements of monetary financial institution
Source: CNB.
billi
on H
RK
Placements to other sectors Placements to the central governmentPlacements to households Placements to corporates
2013 2014 2015 2017 20182016 2019 2020
%
0
10
20
30
40
50
–20
–10
10
115
25
40
55
70
85
100
Figure 47 Placements of monetary financial institutions to the central government
Source: CNB.
billi
on H
RK
Year-on-year rate of change – rightPlacements to the central government (balance)
202020182013 201720152014 2016 2019

14 CNB • INFORMATION ON ECONOMIC TRENDS • NOVEMBER 2020
20
25
30
35
40
60
55
50
45
%
Figure 48 Share of kuna placements in total sector placements
Source: CNB.
Placements to non-financial corporations Placements to householdsPlacements to other sectors (incl. the government sector)
2013 20202018201720152014 2016 2019
%
15
165
–5
0
5
10
15
20
45
40
30
25
35
30
45
60
75
90
105
120
135
150
Figure 49 Money (M1)
Note: From March 2019, the growth rate (transaction-based) excludes the effect of the reclassification of money market funds.Source: CNB.
billi
on H
RK
Year-on-year rate of change (balance-based) – rightM1 (balance)Year-on-year rate of change (transaction-based) – right
202020182013 201720152014 2016 2019
%
–4
0
4
8
12
16
220
370
250
280
310
340
Source: CNB.
Figure 50 Total liquid assets (M4)
billi
on H
RK
Year-on-year rate of change (balance-based) – rightYear-on-year rate of change (transaction-based) – right
M4 (balance)
202020182013 201720152014 2016 2019
0
400
40
80
120
160
200
240
280
320
360
Figure 51 Structure of M4 monetary aggregate
Source: CNB.
billi
on H
RK
M1 Kuna deposits Foreign currency depositsBonds, money market instruments and MMFs shares/units
2012 2014 2015 2017 20182016 2019 20202013
%
25
31
34
37
28
–20
–10
0
10
20
Figure 52 Kuna savings and time deposits
Source: CNB.
billi
on H
RK
Year-on-year rate of change – rightKuna deposits (balance)
202020182013 201720152014 2016 2019
%
–4
0
4
8
12
16
130
140
150
160
170
180
Source: CNB.
Figure 53 Foreign currency deposits
billi
on H
RK
Year-on-year rate of change (balance-based) – rightYear-on-year rate of change (transaction-based) – right
Foreign currency deposits (balance)
2013 202020182017201620152014 2019

15CNB • INFORMATION ON ECONOMIC TRENDS • NOVEMBER 2020
%
10
15
20
25
30
35
50
45
40
Figure 54 Share of kuna sources
Source: CNB.
Share of kuna sources in total sources of other monetary financial institutionsShare of kuna sources in total sources of other monetary financial institutions (excl. demand deposits)
2010
2011
2012
2013
2014
2015
2016
2017
2018
2020
2019
%
0
45
40
35
30
5
10
15
20
25
Figure 55 Bank liquidity and overnight interest rate on bank demand deposit trading
Notes: Liquidity surplus is the difference between the balance in bank settlementaccounts with the CNB and the amount that banks are required to hold in theiraccounts after the calculation of reserve requirements.The overnight interest rate until the end of 2015 refers to the overnight interbank interest rate and as of the beginning of 2016 to the overnight interest rate on bank demand deposit trading. Source: CNB.
billi
on H
RK
Liquidity surplus (incl. overnight deposits with the CNB) – rightOvernight interbank interest rate
201920182017201520142013 202020160.0
0.2
1.6
1.4
0.4
0.6
0.8
1.0
1.2
–5
–2
–1
0
1
3
2
–3
–4
Figure 56 Spot transactions in the foreign exchange market (net turnover)
billi
on E
UR
Bank transactions with legal persons Bank transactions with natural personsBank transactions with foreign banks Bank transactions with the CNB
CNB transactions with government and the ECTotal bank transactions
Notes: Positive values indicate net purchases and negative values indicate net sales. Legal persons include the government. Data for the fourth quarter of 2020 refer to October.Source: CNB.
2013 20202018201720152014 2016 2019
Table 2 Balance of paymentspreliminary data, in million EUR
2019 Q2/2020a
Indices
2019/ 2018
Q2/2020a/ 2019
Current account 1,482.8 1,807.0 156.3 121.9
Capital account 1,114.8 1,108.0 154.0 99.4
Financial account (excl. reserves)
1,423.8 5,020.1 798.9 352.6
International reserves 989.4 –2,572.3 64.0 –260.0
Net errors and omissions
–184.5 –467.2 –368.7 253.2
a Refers to the sum of the last four quarters.Source: CNB.
9
11
13
23
19
17
15
21
Figure 57 International reserves of the CNBat current rate of exchange
billi
on E
UR
a NUIR = international reserves – foreign liabilities – reserve requirements in f/c – foreign currency government deposits.Source: CNB.
International reserves Net usable international reservesa
2013 20202018201720152014 2016 2019
–4
–2
0
2
4
8
–4
–2
0
2
4
6
8
6
Figure 58 Current and capital account flows
a Sum of the last four quarters.Note: One-off effects include conversion of CHF-linked loans in 2015 and bank provisions for loans to the Agrokor Group in 2017 and 2018.Source: CNB.
billi
on E
UR
as %
of G
DP
Secondary income ServicesPrimary incomeGoods
20202013 20192018201720162014 2015
Current and capital accounta – rightCurrent and capital account excl. one-off effectsa – right
Capital transactions Current and capital account

16 CNB • INFORMATION ON ECONOMIC TRENDS • NOVEMBER 2020
–4
–3
–2
0
1
3
2
–1
Figure 62 Gross external debt transactions
Notes: Transactions refer to the change in debt excl. cross-currency changes and other adjustments. Data for the third quarter of 2020 refer to July and August.Source: CNB.
billi
on E
UR
General government Croatian National Bank Other MFIsOther sectors Direct investment Total
20182016 2020201920152013 2014 2017
–2
0
1
2
3
–1
–5
–4
–3
Figure 61 Net external debt transactions
billi
on E
UR
General government Croatian National Bank Other MFIsOther sectors Direct investment Total
Notes: Transactions refer to the change in debt excl. cross-currency changes and other adjustments. Net external debt is calculated as the gross external debt stock net of foreign debt claims. Data for the third quarter of 2020 refer to July and August.Source: CNB.
2020201920182017201620152013 2014
0
10
20
30
40
60
50
Figure 63 Gross external debtend of period
Note: Data are up to August 2020.Source: CNB.
billi
on E
UR
General government Croatian National Bank Other MFIsOther sectors Direct investment
2013 2015 2016 201820172014 2019 2020
0
10
20
30
40
50
60
70
80
90
100
0
10
20
30
40
50
60
70
80
90
100
as %
of G
DP
shar
e in
gen
eral
gov
ernm
ent d
ebt,
in %
External general government debtDomestic general government debtGeneral government debt – rightSGP reference value (60%) – right
Note: Nominal GDP for the last four available quarters was used for the calculation of the relative indicator.Source: CNB.
Figure 64 General government debt
7/20202013 2014 2016 2015 20192017 2018
81.084.7 84.3
80.877.5
74.2 72.8
82.5
–8
–6
–4
–2
0
4
10
8
6
2
–4
–3
–2
–1
0
1
2
5
4
3
Figure 59 Financial account flows by type of investment
a Sum of the last four quarters.Note: A positive value indicates net outflow of equity abroad (including on the basis of the growth in international reserves). Source: CNB.
billi
on E
UR
as %
of G
DP
Change in gross international reservesOther investmentPortfolio investmentDirect investment
Total net flowsa – right
20202013 20192018201720162014 2015
Financial derivatives
–3
–2
–1
0
1
2
5
4
3
–9
–6
–3
0
3
6
9
15
12
Figure 60 Financial account flows by equity to debt ratio
a The change in gross international reserves is reported net of foreign liabilities of the CNB. b Sum of the last four quarters.Notes: A positive value indicates net outflow of equity abroad. Net flows represent the difference between the change in assets and the change in liabilities.Source: CNB.
billi
on E
UR
as %
of G
DP
20202013 20192018201720162014 2015
Change in international reservesa
Debt liabilities, net excl. reserves Financial derivativesEquity liabilities, net
Total net capital flows excl. reservesa,b – rightTotal net capital flowsb – rightTotal net capital flows excl. reservesa
17CNB • INFORMATION ON ECONOMIC TRENDS • NOVEMBER 2020
Table 3 Consolidated general government balanceESA 2010, in million HRK
Jan. –Jun. 2019 Jan. –Jun. 2020
Total revenue 90,667 83,238
Direct taxes 13,141 12,217
Indirect taxes 37,620 32,002
Social contributions 23,382 22,820
Other 16,525 16,198
Total expenditure 90,444 96,392
Social benefits 30,799 30,911
Subsidies 4,190 9,874
Interest 4,393 3,824
Compensation of employees 23,294 24,803
Intermediate consumption 16,006 14,769
Investment 6,285 7,297
Other 5,478 4,914
Net lending (+)/borrowing (–) 223 –13,154
Sources: Eurostat and CBS.
Table 4 Consolidated central government net borrowingGFS 2001, in million HRK
Jan. – Dec. 2018 Jan. – Dec. 2019
1 Revenue 148,629 160,186
2 Disposal of non-financial assets 605 1,069
3 Expenditure 142,139 152,827
4 Acquisition of non-financial assets 4,329 5,978
5 Net borrowing (1 + 2 – 3 – 4) 2,767 2,450
Sources: MoF and CNB calculations.
Table 5 General government debtin million HRK
July 2019 July 2020
Change in total debt stock 2,469 22,293
Change in domestic debt stock 6,200 16,576
– Securities other than shares, short-term 629 6,066
– Securities other than shares, long-term 9,543 4,607
– Loans –3,853 8,643
Change in external debt stock –3,730 5,717
– Securities other than shares, short-term 44 0
– Securities other than shares, long-term 6,473 8,949
– Loans –2,683 1,856
Memo item:
Change in total guarantees issued –329 –438
Source: CNB.
–8
–6
–4
–2
0
4
10
8
6
2
–4
–3
–2
–1
0
1
2
5
4
3
Figure 59 Financial account flows by type of investment
a Sum of the last four quarters.Note: A positive value indicates net outflow of equity abroad (including on the basis of the growth in international reserves). Source: CNB.
billi
on E
UR
as %
of G
DP
Change in gross international reservesOther investmentPortfolio investmentDirect investment
Total net flowsa – right
20202013 20192018201720162014 2015
Financial derivatives
–3
–2
–1
0
1
2
5
4
3
–9
–6
–3
0
3
6
9
15
12
Figure 60 Financial account flows by equity to debt ratio
a The change in gross international reserves is reported net of foreign liabilities of the CNB. b Sum of the last four quarters.Notes: A positive value indicates net outflow of equity abroad. Net flows represent the difference between the change in assets and the change in liabilities.Source: CNB.
billi
on E
UR
as %
of G
DP
20202013 20192018201720162014 2015
Change in international reservesa
Debt liabilities, net excl. reserves Financial derivativesEquity liabilities, net
Total net capital flows excl. reservesa,b – rightTotal net capital flowsb – rightTotal net capital flows excl. reservesa

Abbreviations and symbols
Abbreviations
BIS – Bank for International Settlementsbn – billionb.p. – basis pointsBOP – balance of paymentsc.i.f. – cost, insurance and freightCBRD – Croatian Bank for Reconstruction and DevelopmentCBS – Croatian Bureau of Statistics CCI – consumer confidence indexCDCC – Central Depository and Clearing Company Inc.CDS – credit default swapCEE – Central and Eastern EuropeanCEFTA – Central European Free Trade AgreementCEI – consumer expectations indexCES – Croatian Employment ServiceCHIF – Croatian Health Insurance FundCLVPS – Croatian Large Value Payment SystemCM – Croatian MotorwaysCNB – Croatian National BankCPF – Croatian Privatisation FundCPI – consumer price indexCPII – Croatian Pension Insurance InstituteCR – Croatian RoadsCSI – consumer sentiment indexDAB – State Agency for Deposit Insurance and Bank Reso-
lutiondep. – depositDVP – delivery versus paymentEC – European CommissionECB – European Central BankEFTA – European Free Trade AssociationEMU – Economic and Monetary UnionESI – economic sentiment indexEU – European Unionexcl. – excludingf/c – foreign currency FDI – foreign direct investmentFed – Federal Reserve SystemFINA – Financial AgencyFISIM – financial intermediation services indirectly measuredf.o.b. – free on boardGDP – gross domestic productGVA – gross value addedHANFA – Croatian Financial Services Supervisory AgencyHICP – harmonised index of consumer pricesILO – International Labour OrganizationIMF – International Monetary Fundincl. – includingIPO – initial public offeringm – millionMIGs – main industrial groupingsMM – monthly maturityMoF – Ministry of FinanceNCA – National Classification of ActivitiesNCB – national central bankNCS – National Clearing System
n.e.c. – not elsewhere classifiedOECD – Organisation for Economic Co-Operation and De-
velopment OG – Official GazetteR – Republico/w – of whichPPI – producer price indexRTGS – Real-Time Gross SettlementQ – quarterlyRR – reserve requirementSDR – special drawing rightsSITC – Standard International Trade ClassificationSGP – Stability and Growth PactVAT – value added taxWTO – World Trade OrganizationZMM – Zagreb Money MarketZSE – Zagreb Stock Exchange
Three-letter currency codes
ATS – Austrian schillingCHF – Swiss franc CNY – Yuan RenminbiDEM – German markEUR – euroFRF – French francGBP – pound sterlingHRK – Croatian kunaITL – Italian liraJPY – Japanese yenUSD – US dollar
Two-letter country codes
BG – BulgariaCZ – Czech R.EE – EstoniaHR – CroatiaHU – HungaryLV – LatviaLT – LithuaniaPL – PolandRO – RomaniaSK – Slovak R.SI – Slovenia
Symbols
– – no entry.... – data not available0 – value is less than 0.5 of the unit of measure being
used∅ – averagea, b, c,... – indicates a note beneath the table and figure* – corrected data( ) – incomplete or insufficiently verified data