Embed Size (px)
Citation preview

IMPROVING INFLUENZA VACCINE
COVERAGE IN HCP:
WHAT WORKS AND WHAT DOESN’T
David Jay Weber, MD, MPH
Professor of Medicine, Pediatrics and Epidemiology
Associate Chief Medical Officer, UNC Health Care
Medical Director, Hospital Epidemiology and Occupational Health
University of North Carolina at Chapel Hill

DISCLOSURES
Vaccine related
SHEA liaison to ACIP
Current ACIP working groups: General recommendations,
pertussis, hepatitis
Member of ACP vaccine group
Consultation and Speaker’s Bureau
Merck, Pfizer


RATIONALE FOR INFLUENZA
IMMUNIZATION OF HCP
Person-to-person transmission of influenza well documented in hospitals
Persons with influenza can transmit infection prior to developing symptoms
Persons with influenza can transmit infection with no or mild infection
Influenza immunization has been shown to decrease patient mortality in
extended care facilities
Influenza immunization of HCP has been shown to decrese sick days and
days lost from work
Benefits of influenza immunization to individual HCP protects the HCP
(especially if they are at high risk for complications), and their household and
personal contacts
Talbot T, et al. ICHE 2005;26:882-890

BARRIERS HCP IMMUNIZATION AND
RECOMMENDED SOLUTIONS
Talbot T, et al. ICHE 2005;26:882-890
Barrier to HCW Influenza Vaccination Recommended Component of HCW Influenza Vaccination Program
Access to vaccine, inconvenience Off-hours clinics
Use of mobile vaccination charts
Vaccination of staff and departmental meetings
Provision of adequate staff and resources
Cost Provision of vaccine free of charge to HCWs
Concerns for vaccine adverse events, perception of low risk for influenza,
opposition to the vaccine
Targeted education, including specific information to dispel vaccine myths
Fear of needles Use of live attenuated influenza vaccine for eligible HCWs
Other Strong and visible administrative leadership
Visible vaccination of key leaders
Active declination of HCWs who do not wish to be or cannot be vaccinated
Accurate tracking of individual and unit-based compliance of HCWs with
vaccination
Surveillance for healthcare-associated influenza

SAMPLE DECLINATION FORM

INTERVENTIONS TO IMPROVE HCP
INFLUENZA IMMUNIZATION
Survey of 468 healthcare facilities (rate of immunization = 41%-60%)
Polgreen PM, et al. CID 2008;46:14-19
No. (%) who answered
Does your hospital provide Yes No Pª
Vaccine free of charge to all HCWs with direct patient care? 410 (98) 10 (2)ª .017
Vaccine free of charge to all HCWs? 376 (91) 38 (9) <.001
Vaccine free of charge to all volunteers? 342 (86) 56 (14) .019
Adequate staff and resources for influenza vaccine campaigns 354 (85) 63 (15) .008
Vaccination in wards, clinics, and/or common areas (e.g. outside cafeteria)? 365 (87) 56 (13) .015
Off-hours vaccination clinics? 236 (57) 178 (43) .018
Vaccination at any staff and departmental meetings? 193 (47) 218 (53) .011
Visible vaccination of key personnel? 208 (51) 198 (49) .004
Tracking unit-based vaccine compliance for at least some units? 237 (59) 163 (41) <.001
Reporting vaccination rates to HCWs and administration? 285 (72) 111 (28) <.001
A mechanism for recording off-site vaccination? 115 (29) 280 (71) .001
A mandatory declination form to HCWs refusing vaccination? 93 (23) 310 (77) .004
Education to targeted groups of HCWs? 257 (84) 50 (16) <.001
Active surveillance for health care-associated influenza? 67 (22) 238 (78) .002
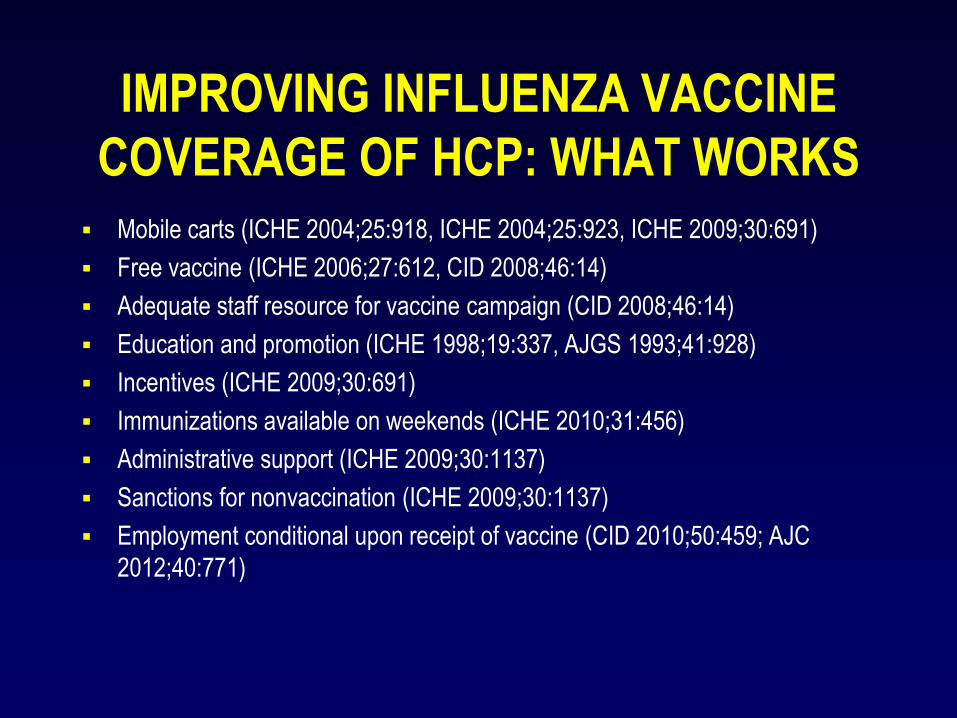
IMPROVING INFLUENZA VACCINE
COVERAGE OF HCP: WHAT WORKS
Mobile carts (ICHE 2004;25:918, ICHE 2004;25:923, ICHE 2009;30:691)
Free vaccine (ICHE 2006;27:612, CID 2008;46:14)
Adequate staff resource for vaccine campaign (CID 2008;46:14)
Education and promotion (ICHE 1998;19:337, AJGS 1993;41:928)
Incentives (ICHE 2009;30:691)
Immunizations available on weekends (ICHE 2010;31:456)
Administrative support (ICHE 2009;30:1137)
Sanctions for nonvaccination (ICHE 2009;30:1137)
Employment conditional upon receipt of vaccine (CID 2010;50:459; AJC
2012;40:771)

IMPROVING INFLUENZA VACCINE
COVERAGE OF HCP: WHAT DOESN’T
Declination forms {modest benefit, 10%-15%}(ICHE
2008;29:675, ICHE 2008;29:302, ICHE 2009;30:474)
Incentives; raffle (AJIC 2008;36:301)

IMPACT OF STRATEGIES TO IMPROVE
HCP INFLUENZA VACCINATION
Intervention and Study Preintervention
immunization rate, %
Postintervention
immunization rate, %
Overall change in
vaccination rate, %
Randomized, controlled
trial of intervention
Implemented with other
interventions
Declination
Polgren et al [23] 54 65 +11 No Yes
Bertin et al [25] 38 55 +17 No Yes
Ribner et al [27] 43 65 +22 No Yes
Intervention and Study Preintervention
immunization rate, %
Postintervention
immunization rate, %
Overall change in
vaccination rate, %
Randomized, controlled
trial of intervention
Implemented with other
interventions
Mandatory vaccination
Virginia Mason [23] 30 98 +68 No Yes
BJC HealthCare [39] 71 99 +28 No Yes

Intervention and Study Preintervention
immunization rate, %
Postintervention
immunization rate, %
Overall change in
vaccination rate, %
Randomized, controlled
trial of intervention
Implemented with other
interventions
Mobile cart
Sartor et al [29] 7 32 +25 No Yes
Cooper et al [30] 8 49 +41 No Yes
Incentives (raffle) [35] 38ª 42 NS Yes Yes
Educational letter from
leadership [35]
38ª 39 NS Yes Yes
On-site expert education
[33]
21ª 22 NS Yes Yes
Intervention and Study Preintervention
immunization rate, %
Postintervention
immunization rate, %
Overall change in
vaccination rate, %
Randomized, controlled
trial of intervention
Implemented with other
interventions
Education and promotion
Harbath et al [31] 13 37 +24 No Yes
Thomas et al [32] 8 46 +38 No Yes
Talbot T, et al. Cid 2009;49:773-779
IMPACT OF STRATEGIES TO IMPROVE
HCP INFLUENZA VACCINATION

FACTORS ASSOCIATED WITH HIGH
HCP VACCINATION RATES
Survey of 50 hospitals; median vaccination rate 55% (range, 25.6% to 80.6%)
Talbot T, et al. ICHE 2010;31:456
Vaccination rate, mean ± SD, %
Component No. (%) of facilities with
component (n = 47)
At facilities with component At facilities without component P
Provision of vaccination on
weekends
37 (97) 58.8 ± 12.0 58.8 ± 14.9 .01
Train-the-trainer programs 33 (70) 59.5 ± 12.5 59.5 ± 13.2 .005
Feedback of vaccination rates
provided to board of trustees
10 (21) 63.9 ± 9.7 53.4 ± 14.1 .01
Administration sends letter
emphasizing vaccine importance
33 (70) 59.3 ± 11.9 47.0 ± 15.0 .01


SHEA GUIDELINE: 2010 UPDATE
No endorsement of requiring unvaccinated persons to wear a mask
Use of declination forms should not be viewed as primary method for
increasing vaccination rates
Recommendations for coverage include ALL HCP (contract workers,
volunteers, students, product vendors, independent practitioners)
Exemptions to vaccine mandates should only be allowed for medical
contraindications
SHEA does not endorse religious exemptions or philosophical exemptions
SHEA endorses that influenza vaccination be a condition of employment

Variable present Variable absent
Variable No. of responses Vaccination rate, median %
(IQR)
No. of responses Vaccination rate, median %
(IQR)
Pª
Type of Hospital
Accredited by the Joint
Commission
58 72 (55-85) 59 60 (43-75) <.0375
Table 3: Variables Associated with a Significant Change in Vaccination Rates
Variable present Variable absent
Variable No. of responses Vaccination rate, median %
(IQR)
No. of responses Vaccination rate, median %
(IQR)
Pª
Type of care provided
Acute care 79 71 (57-85) 38 50 (42-71) .0028
Psychiatric 13 50 (37-60) 104 70 (50-85) .0022
Rehabilitation 10 48 (36-59) 107 70 (50-85) .0087
Variable present Variable absent
Variable No. of responses Vaccination rate, median %
(IQR)
No. of responses Vaccination rate, median %
(IQR)
Pª
Type of patient served
Children 72 70 (56-85) 44 52 (43-72) .0037
Oncology 20 75 (61-87) 96 65 (46-79) .0021
Pregnant women 42 73 (60-85) 74 58 (48-75) .0030
Intensive care 61 72 (60-85) 56 52 (39-75) .0004
Variable present Variable absent
Variable No. of responses Vaccination rate, median %
(IQR)
No. of responses Vaccination rate, median %
(IQR)
Pª
Type of program
Voluntary 41 50 (40-65) 75 72 (60-85 <.0001
Required declination 75 72 (60-85) 41 50 (40-65 <.0001

Variable present Variable absent
Availability of the vaccine No. of responses Vaccination rate, median %
(IQR)
No. of responses Vaccination rate, median %
(IQR)
Pª
mobile vaccination carts
Vaccination in wards,
clinics, and common areas
50 74 (60-85) 67 60 (41-75) .0011
72 72 (57-84) 75 72 (60-85 .0030
Vaccination on nights and
weekends
82 71 (51-85) 35 60 (40-71) .0213
Variable present Variable absent
Advertisement of the
program
No. of responses Vaccination rate, median %
(IQR)
No. of responses Vaccination rate, median %
(IQR)
Pª
Fliers 86 70 (52-85) 31 53 (37-75) ,0148
Emails 82 70 (55-85) 35 50 (37-73) .0003
Survey of 153 hospitals in Louisiana, 2011-2012 flu seasonFricke KL, et al. ICHE 2013;34:723-729
Variable present Variable absent
Consequences of no
vaccination
No. of responses Vaccination rate, median %
(IQR)
No. of responses Vaccination rate, median %
(IQR)
Pª
No consequences
Wear mask during patient
contact
86 60 (46-75) 25 85 (72-92) <.0001
20 86 (80-92) 97 60 (46-75) <.0001
Table 3: Variables Associated with a Significant Change in Vaccination Rates

IMPACT OF “MANDATORY”
INFLUENZA REQUIREMENTS
Miller BL, et al. Vaccine 2011;29:9398-9403
Characteristic Hospitals No. Pre-requirement season
Mean coverage (95% CI)
Post-requirement season
Mean coverage (95% CI)
Overall 228 62.0 (59.8-64.2) 76.6 (74.5-78.8)
Vaccination coverage, pre-requirement
season
<50% 44 37.8 (35.9-39.7) 62.4 (56.7-68.2)
50-64% 84 57.6 (56.7-58.4) 73.3 (70.2-76.4)
65-79% 67 71.8 (70.8-72.9) 83.0 (80.6-85.4)
80+% 33 88.4 (86.5-90.3) 91.8 (88.0-95.7)
Consequences imposed for vaccine
refusal
Hospitals No. Pre-requirement season
Mean coverage (95% CI)
Post-requirement season
Mean coverage (95% CI)
Yes, termination 18 72.1 (66.6-77.7) 95.4 (93.5-95.5)
Yes, otherb 105 63.5 (60.1-66.8) 81.9 (79.0-84.9)
No 105 58.8 (55.9-61.6) 68.3 (65.7-71.0)
Post-requirement season Hospitals No. Pre-requirement season
Mean coverage (95% CI)
Post-requirement season
Mean coverage (95% CI)
2007-2008, on or beforec 74 54.5 (50.8-58.2) 67.0 (64.1-69.8)
2008-2009 38 60.1 (54.4-65.9) 71.4 (66.2-76.7)
2009-2010 71 65.4 (61.9-68.8) 85.1 (81.8-88.3)
2010-2011 45 68.7 (63.1-74.2) 83.2 (79.3-87.0)
Locationd Hospitals No. Pre-requirement season
Mean coverage (95% CI)
Post-requirement season
Mean coverage (95% CI)
Urban 131 59.0 (56.2-61.7) 75.8 (72.9-78.8)
Rural 97 66.2 (62.5-69.9) 77.7 (74.5-81.0)
Reported institutional level seasonal influenza vaccination coverage of pre- and post-requirement influenza seasons among US hospitals.ª

INFLUENZA VACCINE COVERAGE, HCP,
2010-11, 2011-12, AND 2012-13
MMWR 2013;62:781-786

INFLUENZA VACCINE COVERAGE IN
SELECTED HCP Non-hospital personnel (53.9%) vs hospital personnel (74.3%) received novel
H1N1 vaccine (ICHE 2012;33:737)
Allied health students, 31.8% schools had policy to immunize, 2011 (J Allied
Health 2014;43:12)
Students, trainees, medical residents, 58% of facilities included these HCP in
2006 (ICHE 2009;30:1150)
VA community living centers, 59.6% vaccinated in 2007-8 (ICHE 2010;31:191)
2012 internet panel survey
Kennedy ED, CDC
www.cdc.gov/vaccines/ed/ciinc/
downloads/2013-01-
24/Kennedy-flu-2013-01-24.pdf

POSSIBLE REASONS FOR LOWER COVERAGE
AMONG NURSING HOME PERSONNEL
Resource constraints
Occupational health often off-site
Limited infection control presence (usually no physician and
often no IP)
High turnover among staff
Less administrative support

UNC INTERVENTIONS TO IMPROVE HCP COVERAGE Includes all HCP entering hospital (medical staff, students, contract workers,
volunteers, product vendors)
Flu fair (24 hour availability with multiple sites)
Mobile carts
After hours clinics
Vaccination at work site (e.g., meetings)
Free vaccine
Train-the-trainer (vaccines provided by nursing supervisors)
Administrative support
Education and promotion
Vaccination a condition of employment
Electronic registration (at both occupational health and remote sites)
Real time noncompliance feedback to managers
Influenza surveillance with weekly feedback to medical staff
Multiple vaccine choices (preferential purchase of quadrivalent vaccine)
Coverage of adverse events by Worker’s Compensation

INFLUENZA VACCINE,
UNC HEALTH CARE, 2012-13, 2013-14
Employment conditional on receipt of vaccine
9,614 employees; 10,133
9,610 compliant with policy (99.9%); 10,131 (99.9%)
9,129 vaccinated (95.0%); 9,790 (96.6%)
114 medical contra-indication (per ACIP)(1.2%); 125 (1.2%)
367 granted a religious objection (3.8%); 216 (2.1%)
Vaccine choices (9,640 – includes some medical staff)
IIV3 = ~8,600 (89.2%)
LAIV = ~460 (4.8%)
ID = ~580 (6.0%)


# Cumulative Positive Results
Virus TypeUNC McLendon
Laboratories
NC State Laboratory of
Public Health
A (not typed)
A/H1
A(H1N1) Pandemic
A/H3
B
70
0
497
6
93
3
0
186
9
14
Total 666 212
INFLUENZA SURVEILLANCE,
UNC HEALTH CARE, 22 May 2014

INFLUENZA SURVEILLANCE,
UNC HEALTH CARE
Deaths = 12; ages 5-17 (2), 25-49 (7), 50-64 (1), 65+ (2) – A/H1N1 (8), B (2) A/H3 (1), NT (1)

UNC HEALTH CARE EXPERIENCE
WITH REQUIRING Tdap FOR HCP
Policy notifications: April 2006, Tdap offered to all current HCP and required of all new HCP;
March 2010, letter sent to current HCP notifying them of Tdap requirement; Sept. 2010, letter
send to current UNC HCP notifying them that noncompliance by Nov. 2 would result in furlough
Weber DJ, et al. Infect Control Hosp Epidemiol 2012;33:81-83

INFLUENZA VACCINE COVERAGE,
UC IRVINE, 2006-2011
Quan K, et al. ICHE 2012;33:63

CHALLENGES/ISSUES FOR THE FUTURE IN PREVENTING
HEALTHCARE-ASSOCIATED INFLUENZA
Implementing vaccination as a condition of employment
Push back from unions and EEOC
Questions regarding effectiveness of HCP immunization (e.g., Cochrane review)
Achieving >90% coverage without “mandates”
Improving coverage of the following groups:
Students/trainees/volunteers
HCP in nursing homes and assisted living
Contract workers
Assessing HCP vaccine coverage outside of hospitals (e.g., nursing homes, students)
Should non-vaccinated HCP wear a mask while in clinical areas
Should HCP >65 years of age receive high titer vaccine
Should HCP preferentially receive quadrivalent vaccines

THANK YOU!!
Edward Jenner, 1749-1823