Embed Size (px)
Citation preview

* Associate Professor – Marketing, Symbiosis Institute of Telecom Management, Constituent of SymbiosisInternational University, Village Lavale, Pune, Maharashtra, 412115, India, E-mail: [email protected]
** Director, Delivery Cross Group, Amdocs, Cyber City Tower 2, Magarpatta City, Hadapsar, Pune,Maharashtra, India 411013, E-mail: [email protected]
*** Student Associate, Symbiosis Institute of Telecom Management, E-mail: [email protected]**** Student Associate , Symbiosis Institute of Telecom Management, E-mail :
IMPACT OF CUSTOMER-EXPERIENCE ON CUSTOMER-BEHAVIOR FOR CELLULAR SERVICES WITH REFERENCE
TO INDIAN TELECOMMUNICATION INDUSTRY
Joshi Sujata*, Bhatia Sanjay**, Roy Arindom*** andKumar Madhurendra****
Abstract: Purpose: This research paper primar ily attempts to identify the major determinantsof customer experience for cellular services, to study the impact of these determinants on customerbehavioural traits like advocacy, greater spending, reduced churn and to understand whetherthe impact of customer experience on customer behavior is differential for different customersegments. Research Methodology: Data was collected by means of a survey using a structuredquestionnaire which was conducted over 36 centers across all the demographics and geographiesof India for mobile subscribers. 5231 responses were recorded. Statistical techniques like factoranalysis and regression were used for data analysis. Findings: There are six main determinantsto Customer Experience for cellular services. There is a significant relationship between thesesix determinants and Customer Behavioral traits like advocacy, greater spending or reducedchurn. The impact of customer experience on customer behavior is differential to differentcustomer segments. Practical implications: This paper will be useful for the telecom providersto measure and enhance their customer-experience thereby differentiating themselves in amatured market like India. Telcos can use the insights of this study to understand customerbehavioral traits thereby increasing customer retention, loyalty, spending and reduce churn.Originality: This paper develops a customer experience measurement yardstick called AmdocsCustomer Experience Score (ACES) incorporating various determinants which define customerexperience holistically for cellular services.Keywords: Customer experience, Customer behaviour, ACES, Advocacy, Churn
1. INTRODUCTION
The Indian Telecom industry has shown an enormous growth in the recent years.As per the monthly Telecom Regulatory Authority of India (TRAI) report, thesubscriber base of the country has touched the 980 million mark (TRAI 2015). As a
I J A B E R, Vol. 14, No. 6, (2016): 4659-4679

4660 � Joshi Sujata, Bhatia Sanjay, Roy Arindom & Kumar Madhurendra
result of this growth and competition, telecom companies are facing major challengein customer retention and loyalty (Md. Mahmood UL Farid 2013). Even thechurning propensity ranges from 20% to 70% in the developing countries (ArthutMiddleton Hughes, 2008). So all telecom players being on same stage in providingservice to the customers, Customer Experience comes out to be one of the metricswhich can act as a differentiator for (W. Ruce Allen, 2012). An enhanced CustomerExperience provides customer advocacy, customer retention i.e. leading spendmore and reducing churn (Craig Bailey Kurt Jensen-2006).
There is a rising need to have a yardstick to measure Customer Experience atall stages of Customer Life Cycle. However there exists no such benchmarkcurrently for telecom industry. So this paper attempts to fill this void and providea reliable industry benchmark for reference named Amdocs Customer ExperienceScore (ACES) as the study was done in collaboration with Amdocs. Aggregatingcustomer experience across key touch points, both tangible and intangible, in asubscriber’s lifecycle, ACES captures its relative importance and experience, asperceived by the respondents across various segments.
Customer Experience varies across the different demographic and geographicprofile of customers and hence Customer Behavior is also influenced by thedifferent set of customer profiles. Resultantly, it becomes highly important for theTelecom Service Providers to understand the requirements of specific customersegment and devise customer experience plan accordingly in order to achieve bestand most favorable customer behavioral patterns.
The objective of this paper is to identify the major determinants to customerexperience in telecom industry, to establish the fact that customer experience issubjective and varies across customer segments and to understand the impact ofcustomer experience on customer behavioral intentions across various customersegments.
2. LITERATURE REVIEW
2.1 Customer Experience
Based on various studies conducted in the field of Customer experience there aredifferent definitions of the same given by different people. According to (Pine andGilmore 1999), customer experiences means “engage customers, connecting withthem in a personal, memorable way. As per (Shaw and Ivens, 2002), “Customerexperience is a combination of a company’s actual physical performance and thefeelings evoked, supposedly measured against customer prospection across all eventsof contact”. As per (Meyer and Schwager 2007), “Customer Experience is the internaland subjective response customers have to any direct or indirect contact with acompany.” (Vijay Narsipur, 2004) has linked customer experience with the feelings
Impact of Customer-Experience on Customer-Behavior for Cellular Services... � 4661
or sentiments of the customer towards a product. According to (Gentile et al., 2007),“The customer experience originates from a set of interactions between a customerand a product, a company, or a part of its organization, which provoke a reaction.”According to (Adam Richardson, 2010), “Customer experience is how customersengage with company and brand throughout the entire arc of being a customer. Inthat case, during this time frame a company can give positive customer experiencetowards their customers’ by providing a considerable pricing, distinctive network,flexible product variation, appropriate customer service and value added service”.
Customer experience is a journey and it includes many touch point and lifestages which are important to both customer and company (Leonard Kile, 2013). Itis not only about an interaction with service provider but also thinking and feelingstowards the brand and the strength of relationship with the brand (XU and Chan,2010; Berry and Carbne, 2007; Brakus et al., 2009). Customer experience is thereforedefined as the outcome of customers’ interactions with the firm, including theinteraction with the staff, self-service technologies, and the service environment(Juthamard Sirapracha and Gerard Tocquer, 2012). Customer Experience can bedefined as sum of all experiences at touch points to a customer a customer haswith the company over the duration of their relationship (Sebastian Barros JonBeguiristain, 2012). Also to generate a large impact for company, customerexperience should be for an enterprise-wide initiative which is closely inline to aservice provider’s business goal (Rahul Malviya Vyas Varma, 2012).
In this study we will be considering only those determinants which affect thetelecom service industry. Based on literature review six determinants have beenidentified which affect customer experience for the telecom industry, Brand Image,Service delivery, Network, Customer Care, Billing Experience, Store/GalleryExperience.
2.1.1. Brand Image
Brand Image plays an important role in creating customer satisfaction (Foxall andGoldsmith, 1994). The perception of the customer about products and services ismarked by the perception of brand and branding (Foxall and Goldsmith (1994).Building of the brand image is essentially important for the service firms as it isone of the powerful determinants. Most of the study determines brand image drivescustomer behavior. (Rahul Malviya, Vyas Varma, 2012) determines the significanceof a brand and how it can affect the customer behavior in positive or negativeway. Reduction in churn and new customer acquisition can be carved out ofimproved brand image.
2.1.2. Service Delivery
Service Delivery acts as one the main determinants in determining a better customerexperience (Suzana Dukic and Velida Kijevcanin, 2012) Customer support and

4662 � Joshi Sujata, Bhatia Sanjay, Roy Arindom & Kumar Madhurendra
service assurance are the pillars of telecommunication sector which resolves anytechnical issues (Sebastian Barros Jon Beguiristain, 2012). Service delivery mainlyfocuses on the quick and fast delivery of the services provided by the firm, whetherthe customer is clarified on various products and plans, and keeping the customervalue at top priority (Michael Treacy Fred Wiersema, 1993). Service delivery is thepart of post customer experience. Bridging the gap between perception andexpectation in service quality leads to better management of service delivery (Siew-PhaikLoke et al., 2011). A customer tends to be loyal if it gets better and qualityservice delivery (Balabanis et al., 2006).
2.1.3. Network
Network is the core element of all the services provided to the customers. Anyfault in the network provides a discontent to the user. A better call connectivity,call quality, data services usage, even the indoor and outdoor network coverageshould be good to give user a better network experience. (Joshi Sujata et al., 2015),Telecom companies thoroughly interact with customers through network. Mobilenetwork is the first touch point between user and operator which drives overallcustomer satisfaction with telecom operator (Dejan Radosavljevik et al., 2011). Faultynetwork is the factor of around 8% of customer churn (Booz Allen Hamilton, 2001).Lack of network coverage and poor signal quality leads to customer dissent (Satishet al., 2011). Network Experience forms an essential part of the customer experienceand hence continuous monitoring of network quality service should be done.Providing quality service can act as differentiator in the market (FabricoCarvalhode Gouveia and Thomas Magedanz 2002).
2.1.4. Customer Care
Post sales services are the key parameter for customer loyalty. Handling customercomplaints efficiently is an important aspect of increasing customer experience.Unresponsive and unmanaged handling of the issues raised lead to customerdiscontent (Graeme Ross and Chris McLaren, 2013). A better customer care responseleads high customer satisfaction and loyalty towards the operator (Rahul Malviyaand Vyas Varma, 2012). Enhancement of Customer Experience determines thatbetter customer care leads to customer acquisition and retention (Sebastian Barrosand Jon Beguiristain, 2012).
2.1.5. Billing Experience
Billing is an integrated approach to total customer management solution. Theautomated billing system provides a robust framework and minimizes the flaws inthe work flow and provides full view of customer’s relationship with the business.Transparent and fair billing system gives a better customer experience. A study onCustomer Experience for CSPs referred that an efficient and good billing experiencemakes a customer feel satisfied and secured leading to a higher loyalty among

Impact of Customer-Experience on Customer-Behavior for Cellular Services... � 4663
customers (Rahul Malviya and Vyas Varma, 2012). Enhancing customer experiencein telecommunications concluded that a better, safe and secured billing experiencelead to higher retention of the customers (Sebastian Barros Jon Beguiristain, 2012).
2.1.6. Store/Gallery Experience
Retailers need to understand the consumer behavior and how it has evolved. Thechanges occurred has its consequences on the consumer expectations, be it insideor outside retail stores. Studies have concluded that nearly 50% of consumerexperience is being driven by human emotions (Colin Shaw, 2013). Based on variousstudies a better store/gallery experience provides a key factor in enhancingcustomer experience. A more smooth and soothing retail environment is alwayspreferred by customers which enhances customer experience (Gene Reznik, 2011).Customer experience management provides telecom operator an opportunity interms of better store/gallery experience to have enhanced customer experienceleading to customer retention and less churn (Mika Uusitalo, 2012).
2.1.7. Self Service
The demonstration of self-service driven interaction in the telecom industry isillustrated by the increased adoption of the web based services with the traditionalenvironment system which provides an amalgam of modern and traditionalambience. The self-services provide critical information like user details, billinginformation etc. to the telecom operators of their customers. More stress is laid onthe increase use of the self-service technology by consumers (Peter C. et al., 2009).With introduction of web based self-service, it minimized the customermanagement cost but can be sustained only if exist with other channels too for abetter customer experience (Vijay Narsipur, 2004). A better self-service platformcan lead to greater customer experience.
2.2 Influence of Demographic Factors on Customer Experience
Customer Experience varies across Demographics and Geographies. Demographicfactors and geographies play an important role while determining the perceptiontowards service quality provided by a service provider. Demographicalcharacteristics are crucial elements for building loyalty and have impact oncustomer satisfaction. This impact has been defined across various sectors likeretail (Gagliano and Hathcoste, 1994), healthcare (Al-Khalil and Mahmoud, 2012),banking (Ramez, 2011; Gupta and Bansal, 2011), etc. However there have beenstudies which have proved that demographic factors are not crucial whiledetermining the perception towards service quality. (Ramez, 2011), in his studyconcluded that demographic factors do not play a significant role in influencingcustomer experience. Parasuram, Berry and Zeithaml (1991), found out that thecustomers with higher age tend to experience better service quality rather than

4664 � Joshi Sujata, Bhatia Sanjay, Roy Arindom & Kumar Madhurendra
younger customers. As Customer experience varies across the demographics andgeographies of target market and Customer experience is linked with customerbehavior, it can be said that demographic and geographic factors influence customerbehavior. Customer behavior varies across the various demographics andgeographies. Customer satisfaction, demographics and loyalty are inter-related.
2.3 Impact of Customer Experience on Customer Behavior
Customer Experience in telecom industry has a few determinants like Brandimage, Service Delivery Experience, Network Experience, Customer Careexperience, etc. as proven in past researches. Now it is important to understandthe impact that Customer Experience has on Customer Behavior. It has beenproved in past researches that satisfaction plays an influential role in determiningthe post-purchase behavior of the customers (Oliver, 1980; Oliver, 1993).According to Zeithaml, Berry and Parasuraman (1996), Customer Experiencedetermines whether customers are going to behave favorably or unfavorablytowards the brand. Lee, Richard and Murphy, Jamie (2005) explored determinantsthat cause customers transit from being loyal to switcher. According to Chen(2008), and Chen and Chen (2010), Quality, Perceived Value and satisfaction arethe antecedents for customer behavioral patterns. Zhao et al., (2012) stated thatcustomer experience plays a significant role in determining the continuanceintention (loyalty) of the customer. According to Santouridis & Trivellas (2010),as well, Customer Experience determines the level of loyalty a customer maintainswith the brand. Silva, K.A. (2009) determined that providing value to the customerby their service providers resulted in continuing the existing service providerswhich was followed by assurance and responsiveness. There are studies whichestablish a steady positive correlation between customer experience andbehavioral intentions like customer loyalty, word of mouth, up-sell or cross-sellopportunities, willingness to purchase other services while on the other hand,there exists a strong negative correlation with Customer experience and numberof complaints raised (Wang Y. and Hing-Po Lo. 2002). Pirc, M. (2006) stated thatTelecommunication services, even providing high service quality, is characterizeddynamic customer activities.
3. RESEARCH METHODOLOGY
A survey was conducted over 36 centers spreading across all the horizons of Indiansubcontinent to measure customer experience at a pan-India level across all thedemographics and geographies of India for mobile subscribers. Questionnaire wasused as the primary research instrument along with personal interviews with therespondents to get further insights into the data collected. Primary research wasconducted and 5231 responses were recorded. Market Research agency was hiredto collect primary data from the 36 finalized centers. Questionnaires were developed

Impact of Customer-Experience on Customer-Behavior for Cellular Services... � 4665
in various regional languages besides English and Hindi - Tamil, Kannada, Marathi,Bengali, Gujarati and Oriya.
22 parameters were chosen out of the originally extracted 110 parameters tomeasure customer experience at each touch point of customer interaction withtheir mobile operator. Importance and performance values for each parameter ismeasured and recorded. Responses were taken on a 7-point Likert scale for eachparameter.
Pilot survey was carried on a sample size of 166 respondents to confirm thestrength of the research instrument and to check the clarity of the measures used.Based on the responses given by the respondents, initial scale reliability and factoranalysis tests were carried out for ensuring construct validity.
3.1 Customer Experience Score (ACES)
Amdocs Customer Experience Score (ACES) was developed to measure the overallexperience customers have from their Cellular Service Providers calculated on ascale of 1 to 10. ACES is designed to be deployed across various lines of business,geographies and demographics. It is a theory developed through strong academicbacking and proven by statistical rigor to introduce an industry benchmark tomeasure customer experience at all possible touch points of customer interactionwith the operator. The primary research instrument attempts to measure theimportance and performance of key determinants of customer experience at variousphases of customer lifecycle. ACES takes into account the six core determinants toCustomer Experience, namely, Brand Image, Service delivery experience, Networkexperience, Customer care experience, Billing experience and store/ online self -service experience.(the six determinants consisted of 22 sum-parameters).
Descriptive analysis was done on the 5231 samples collected through survey.Importance and Performance values were taken through this survey for these 22parameters on an ordinary scale of 1 to 7. Mathematical calculation was used onthose 22 parameters to come up with a customer experience score for differentuser groups. Each and every user group had different sample distribution and thecustomer experience score was calculated on those different samples in order toget a customer experience of these user groups.
�
�
� ��
�1
1
( )nk k k
nk k
I PCE
I
The CE score achieved from above formula was extrapolated so as to becalculated out of 10.
CES = CE × 1.5 – 0.5

4666 � Joshi Sujata, Bhatia Sanjay, Roy Arindom & Kumar Madhurendra
Where,CE = Customer Experience Score (calculated out of 7)CES = Customer Experience Score (calculated out of 10)Ik = Importance ratings expressed by the users on the k attributePk = Experience ratings expressed by the users on the k attributes
4. HYPOTHESES
The following hypotheses have been proposed for this research:
H1: There are six main determinants to Customer Experience in Telecomindustry: Brand Image, Service Delivery Experience, Network Experience,Customer Care Experience, Billing Experience, Store/ Online Self ServiceExperience
H2: There is a significant relationship between the six Customer Experiencedeterminants and Customer Behavioral traits like advocacy, greaterspending or reduced churn.
H3: Impact of customer experience on customer behavior is differential todifferent customer segments
5. DATA ANALYSIS
5.1 Profile of Respondents
Table 1 represents the demographics and geographies of the survey sample forthis study. It shows an even distribution of all the population segments acrossgeographies and demographic constraints like service type, age, gender andcustomer spending. It can be noted that urban, prepaid and males form the majorityof the sample size in terms of region, service type and gender respectively.However, on a whole there is a good distribution of sample across all the segments.
5.2 Scale Reliability
In research context, reliability defines the overall consistency of the variousmeasures used in the research instrument. According to Gay, 1987, reliability canbe defined as the degree to which a test consistently measures an attribute.Cronbach’s Alpha (�) is considered as the basic and the most famous tool formeasuring scale reliability of a construct. Nunnally (1978) defined that a Cronbach’sAlpha of 0.7 as an acceptable reliability coefficient for undergoing scale reliabilityand is accepted as the cutoff or threshold value of scale reliability test henceforth.
In our case, survey questions use a 7-point rating scale. Reliability of theconstruct measures is checked with respect to the Cronbach’s Alpha value. Theoverall Cronbach’s Alpha of the Research Instrument is found to be as 0.901 asgiven in table 2.

Impact of Customer-Experience on Customer-Behavior for Cellular Services... � 4667
Table 1Profile of Respondents (sample distribution)
Variables Percentage
RegionRural 25%Urban 75%Service TypePrepaid 77%Postpaid 23%Age15-24 years 28%25-35 years 38%36-50 years 27%50+ years 7%GenderMale 78%Female 22%Customer SpendingLow Spend 55%Medium Spend 32%High Spend 13%
Thus it can be concluded that the instrument measures are having high levelof reliability and internal consistency with each other and finally it reflects thatthe questionnaire is clear and unambiguous.
Table 2Reliability Statistics
Cronbach’s Alpha Cronbach’s Alpha N of ItemsBased on StandardizedItems
.901 .934 22
5.3 Hypotheses Testing
5.3.1. Exploratory Factor Analysis
H1: There are six main determinants to Customer Experience in Telecom industry:Brand Image, Service Delivery Experience, Network Experience, CustomerCare Experience, Billing Experience, Store/ Online Self Service Experience.
4668 � Joshi Sujata, Bhatia Sanjay, Roy Arindom & Kumar Madhurendra
Both Exploratory and confirmatory factor analysis has been used in this studyfor data analysis and hypotheses testing.
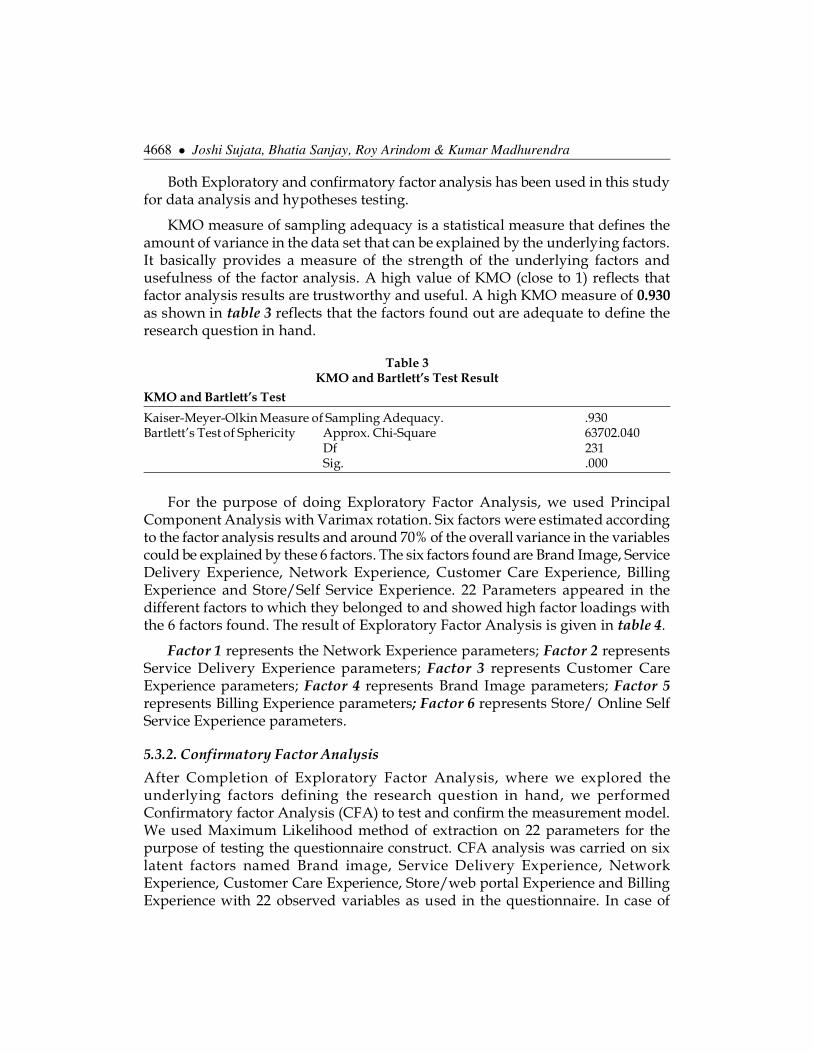
KMO measure of sampling adequacy is a statistical measure that defines theamount of variance in the data set that can be explained by the underlying factors.It basically provides a measure of the strength of the underlying factors andusefulness of the factor analysis. A high value of KMO (close to 1) reflects thatfactor analysis results are trustworthy and useful. A high KMO measure of 0.930as shown in table 3 reflects that the factors found out are adequate to define theresearch question in hand.
Table 3KMO and Bartlett’s Test Result
KMO and Bartlett’s Test
Kaiser-Meyer-Olkin Measure of Sampling Adequacy. .930Bartlett’s Test of Sphericity Approx. Chi-Square 63702.040
Df 231Sig. .000
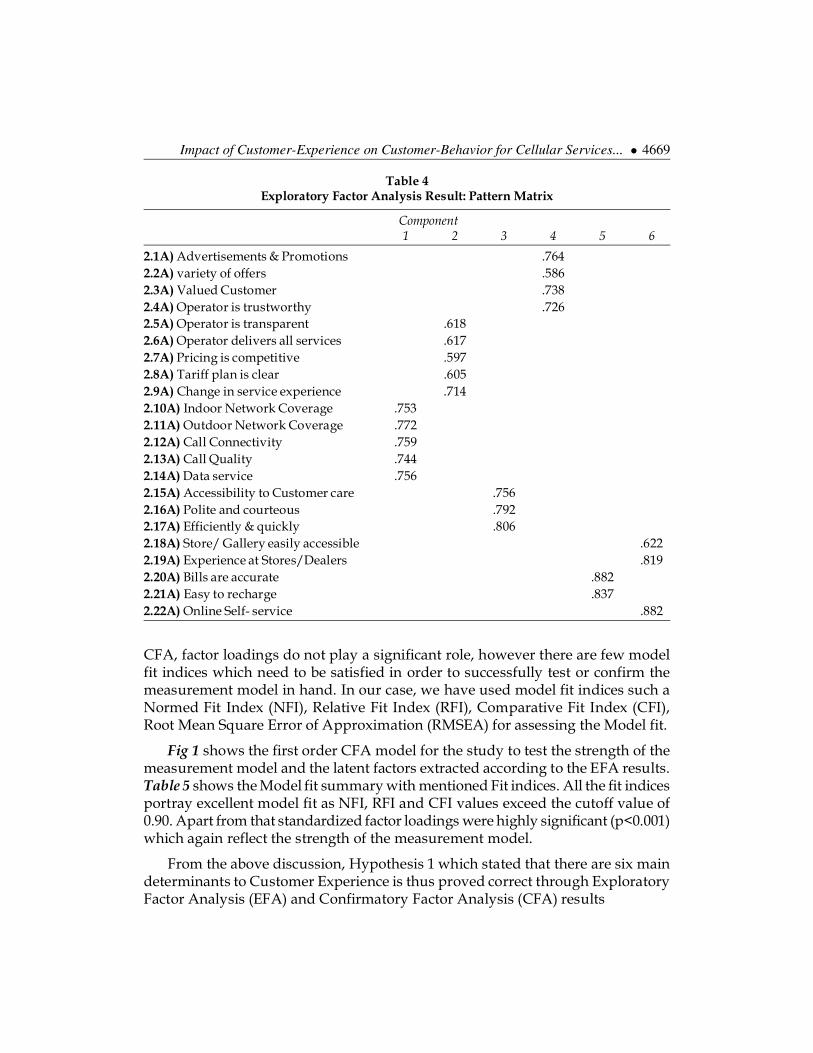
For the purpose of doing Exploratory Factor Analysis, we used PrincipalComponent Analysis with Varimax rotation. Six factors were estimated accordingto the factor analysis results and around 70% of the overall variance in the variablescould be explained by these 6 factors. The six factors found are Brand Image, ServiceDelivery Experience, Network Experience, Customer Care Experience, BillingExperience and Store/Self Service Experience. 22 Parameters appeared in thedifferent factors to which they belonged to and showed high factor loadings withthe 6 factors found. The result of Exploratory Factor Analysis is given in table 4.
Factor 1 represents the Network Experience parameters; Factor 2 representsService Delivery Experience parameters; Factor 3 represents Customer CareExperience parameters; Factor 4 represents Brand Image parameters; Factor 5represents Billing Experience parameters; Factor 6 represents Store/ Online SelfService Experience parameters.
5.3.2. Confirmatory Factor Analysis
After Completion of Exploratory Factor Analysis, where we explored theunderlying factors defining the research question in hand, we performedConfirmatory factor Analysis (CFA) to test and confirm the measurement model.We used Maximum Likelihood method of extraction on 22 parameters for thepurpose of testing the questionnaire construct. CFA analysis was carried on sixlatent factors named Brand image, Service Delivery Experience, NetworkExperience, Customer Care Experience, Store/web portal Experience and BillingExperience with 22 observed variables as used in the questionnaire. In case of
Impact of Customer-Experience on Customer-Behavior for Cellular Services... � 4669
Table 4Exploratory Factor Analysis Result: Pattern Matrix
Component1 2 3 4 5 6
2.1A) Advertisements & Promotions .7642.2A) variety of offers .5862.3A) Valued Customer .7382.4A) Operator is trustworthy .7262.5A) Operator is transparent .6182.6A) Operator delivers all services .6172.7A) Pricing is competitive .5972.8A) Tariff plan is clear .6052.9A) Change in service experience .7142.10A) Indoor Network Coverage .7532.11A) Outdoor Network Coverage .7722.12A) Call Connectivity .7592.13A) Call Quality .7442.14A) Data service .7562.15A) Accessibility to Customer care .7562.16A) Polite and courteous .7922.17A) Efficiently & quickly .8062.18A) Store/ Gallery easily accessible .6222.19A) Experience at Stores/Dealers .8192.20A) Bills are accurate .8822.21A) Easy to recharge .8372.22A) Online Self- service .882
CFA, factor loadings do not play a significant role, however there are few modelfit indices which need to be satisfied in order to successfully test or confirm themeasurement model in hand. In our case, we have used model fit indices such aNormed Fit Index (NFI), Relative Fit Index (RFI), Comparative Fit Index (CFI),Root Mean Square Error of Approximation (RMSEA) for assessing the Model fit.
Fig 1 shows the first order CFA model for the study to test the strength of themeasurement model and the latent factors extracted according to the EFA results.Table 5 shows the Model fit summary with mentioned Fit indices. All the fit indicesportray excellent model fit as NFI, RFI and CFI values exceed the cutoff value of0.90. Apart from that standardized factor loadings were highly significant (p<0.001)which again reflect the strength of the measurement model.
From the above discussion, Hypothesis 1 which stated that there are six maindeterminants to Customer Experience is thus proved correct through ExploratoryFactor Analysis (EFA) and Confirmatory Factor Analysis (CFA) results

4670 � Joshi Sujata, Bhatia Sanjay, Roy Arindom & Kumar Madhurendra
Table 5Model Fit results for ACES Customer Experience Management study
Model NFI RFI CFI RMSEA
Default Model .958 .946 .961 .054Benchmark ��0.90 � 0.90 � 0.90 � 0.08
5.3.3. 2nd Order Confirmatory Factor Analysis for determining the Impact ofDeterminants of Customer Experience on Customer Behavior
H2:There is a significant relationship between the six Customer Experiencedeterminants and Customer Behavioral traits like greater advocacy, greaterspending or reduced churn.
To establish the relationship between determinants of Customer Experienceon customer behavioral traits, 2nd order Confirmatory Factor Analysis test was
Figure 1: First Order Measurement Model for ACES Customer ExperienceManagement study

Impact of Customer-Experience on Customer-Behavior for Cellular Services... � 4671
used. After establishing a valid measurement model with confirmed determinantsto Customer Experience, next step is to establish a predictive structural model todefine the relationship between constructs of the proposed framework. We usedMaximum Likelihood method of extraction on 22 parameters for the purpose oftesting the research construct. 2nd order CFA analysis was carried to establishrelationship of six latent factors named Brand image, Service Delivery Experience,Network Experience, Customer Care Experience, Store/web portal Experience andBilling Experience with various customer behavior traits such as advocacy, greaterspending or reduced churn mentioned in the questionnaire. The goodness of fitindices of the final estimated structural model shown in fig.6 gives the ratio of thechi-square value to 17.16, GFI(0.934), AGFI (0.918), CFI (0.95), NFI (.931) and RMSEA(0.056) in Table 6, indicating that the structural model has a reasonable explanationof the observed covariance among the constructs of interest. Figure 2 depicts theresults of the estimated structural model, while Table 7 presents standardizedpath coefficients resulting from testing the proposed structural model. “***”indicates significance of less than 0.001 representing high significance in almostall the relationships presented in the measurement model. As is evident, NetworkExperience has the highest impact on Customer Experience and hence to customerbehavioral traits.
Table 6Structural Model Fit results for ACES Customer Experience Management study
Model GFI AGFI NFI CFI RMSEA
Default Model .934 .918 .931 .950 .056Benchmark ��0.90 � 0.90 � 0.90 � 0.90 � 0.08
Figure 2: Second Order Measurement Model for ACES study

4672 � Joshi Sujata, Bhatia Sanjay, Roy Arindom & Kumar Madhurendra
Table 7Model fit results
Estimate S.E. C.R. P Label
ACEI <—- Brand .360 .028 13.012 *** par_20ACEI <—- Service delivery .391 .028 14.140 *** par_21ACEI <—- Network .724 .055 13.047 *** par_22ACEI <—- cust_care .025 .003 9.975 *** par_23ACEI <—- Store -.004 .009 -.450 .653 par_24ACEI <—- Billing .264 .013 20.674 *** par_25behavioral intention <—- ACEI .010 .002 4.628 *** par_26B4 <—- Brand 1.000B3 <—- Brand 1.058 .018 57.238 *** par_1B2 <—- Brand .971 .018 54.565 *** par_2B1 <—- Brand .950 .019 51.031 *** par_3B9 <—- Service delivery 1.000B8 <—- Service delivery .892 .019 46.986 *** par_4B7 <—- Service delivery .910 .019 47.898 *** par_5B6 <—- Service delivery .903 .018 48.866 *** par_6B5 <—- Service delivery .908 .019 48.595 *** par_7B14 <—- Network 1.000B13 <—- Network 1.694 .126 13.394 *** par_8B12 <—- Network 1.769 .132 13.427 *** par_9B11 <—- Network 1.786 .133 13.410 *** par_10B10 <—- Network 1.744 .130 13.390 *** par_11B17 <—- cust_care 1.000B16 <—- cust_care 1.003 .009 117.102 *** par_12B15 <—- cust_care .971 .009 108.338 *** par_13B22 <—- Store 1.000B19 <—- Store 1.952 .125 15.634 *** par_14B18 <—- Store 2.255 .145 15.583 *** par_15B21 <—- Billing 1.000B20 <—- Billing .996 .020 50.650 *** par_16Ready to spend <—- behavioral intension 1.000moreRecommendation <—- behavioral intension 8.784 1.859 4.725 *** par_17to othersPurchase more <—- behavioral intension 7.286 1.536 4.742 *** par_18ServiceReady to change <—- behavioral intension -2.452 .522 -4.694 *** par_19operatorComplaint <—- behavioral intension -1.296 .423 -3.066 .002 par_42
5.3.4. Binary Logistic Regression for establishing impact of Customer Experienceon Customer Behavior
Past researches have shown that Customer Experience influence CustomerBehavior in a significant manner. Binary Logistic regression was used to understand

Impact of Customer-Experience on Customer-Behavior for Cellular Services... � 4673
the impact of customer experience on customer behavior on the ACEI survey data.Table 8 shows the impact of various ACES dimensions like Brand image, Servicedelivery, Network, Customer Care, Store and Billing have on Behavioral intentionslike Advocacy, Willingness to purchase more services and Churning tendency.From the Construct point of view, as per the Statistical test done on the surveyeddata, only Network Experience is seen to have a significant impact on the Customerbehavior aspects of advocacy, purchasing more and churn. Service delivery andCustomer Care Experience have no significant impact on the Customer Behavior.Billing does affect the Advocacy and Churn behavior aspects of the customer. Brandhas an impact on advocacy while Store/Gallery experience has a significant impacton willingness to purchasing more services and churn tendency.
Table 8Construct Wise Customer Behavior: Impact of ACES dimensions on Customer Behavior
Figure 3 depicts the impact that Customer Experience has on various customerbehavioral intentions like Willingness to Recommend, Willingness to purchaseother services offered by the operator and Propensity to Churn. The Relationshipfound between various levels of Customer experience Scores (X-axis) andBehavioral Intentions validate that ACES Score’s competency in judging the overallcustomer experience and the extent to which Customer Experience correlates toBehavioral patterns. Evident from the figure is the trend reflected and thus thekey take away from the Graph can be summarized as: At greater levels of CustomerExperience, willingness to recommend increases, willingness to purchase otherservices increases significantly and finally willingness to change operator reducesconsiderably. Thus higher Customer Experience (better ACES) indicates the essenceof better customer experience as a key driver to successful business.
From the above discussion we can conclude that Hypothesis 2 which statedthat there is a significant relationship between the six Customer Experience

4674 � Joshi Sujata, Bhatia Sanjay, Roy Arindom & Kumar Madhurendra
determinants and Customer Behavioral implications like advocacy, greaterspending or reduced churn is accepted.
5.3.5. Binary Logistic Regression for establishing impact of Customer behavioracross different customer segments
H3: Impact of customer experience on customer behavior is differential to differentcustomer segments
Table 9 shows a comprehensive analysis of the impact of customer experienceon various behavioral traits. It projects the variation in Behavioral intentions withone unit rise in Customer Experience. It is established that with an increase of 1unit in ACES, what will be the corresponding result on various business driverscharacterized through positive tangible implications like reduced churn, greateradvocacy, greater spending or reduced complaint levels.
Table 9Impact of one unit rise in Customer Experience on Customer Behavior across
demographics
Non- Smartphone users Not Sig. +42% +22% -58% Not Sig.
Table 8 also shows the role of demographic factors while assessing the impacton customer behavior. It can be clearly concluded that the change in behavioralpatterns with Experience differs across demographic segments.
From the table, it can be noted that postpaid customers have the highest sensitivitytowards Advocacy as they are the ones whose recommendation tendency will
Figure 3: Descriptive Statistics: Impact of ACES on Customer Behavioral Intentions

Impact of Customer-Experience on Customer-Behavior for Cellular Services... � 4675
increase the maximum if Experience increases by one unit. Also it is noted that forhigh spending customers, willingness to purchase other services, up-sell and cross-sell opportunities as well as customer loyalty will increase the maximum if customerexperience increases by one unit. It again reflects the essence of customer experienceto these “profitable” customers and how Telco’s can leverage on these customersto bring additional or incremental revenue with improvement in customerexperience. This table portrays the fact that different segments react differently toimprovement in customer experience and thus Telco’s need to understand thecustomer segment in question in order to gauge the possible behavior withimprovement in customer experience.
From the above discussion it can be concluded that the Hypothesis 3 whichstated that Impact of customer experience on customer behavior is differential todifferent customer segments.
6. MANAGERIAL IMPLICATIONS
As said earlier, Customer Experience is very difficult to quantify; however AmdocsCustomer experience score (ACES) attempts to provide a yardstick to quantifyCustomer Experience in Telecom Industry which can be implemented as anindustry benchmark to measure Customer Experience delivered by serviceproviders. This paper can be utilized by the telecom service providers in a maturedmarket like India where the prime discriminator between operators can be thequality of experience delivered to end customers. It provides a holistic view ofmeasuring customer experience across all the touch points of customer interactionsnarrowed down into six main dimensions. For a telecom operator to improvecustomer experience, these parameters need to be considered as the focus points.
Customer Experience has a direct impact on behavioral patterns. Betterexperience leads to favorable behavioral intentions and thus it becomes highlyimportant for the service providers to gauge the current level of satisfaction theyare providing to the customers and what will be the impact on key business driversif they focus on improving various experience parameters.
Perception towards Customer Experience varies across demographics. As aresult, customer behavior also varies across demographics. This research papermagnifies the fact that Telco’s cannot use same strategies across all the customersegments. Service providers need to understand the purposes for which differentsegments use mobile phones and how to leverage maximum benefits out of specificclusters with customized plans suited for these segments specifically.
7. SCOPE FOR FUTURE RESEARCH
Thus far, we have identified the various determinants to customer experience.However in succeeding research papers, we can specifically drill down into each
4676 � Joshi Sujata, Bhatia Sanjay, Roy Arindom & Kumar Madhurendra
of the major factors like Network Experience and conduct an in-depth study of thenetwork parameters, their impact on customer behavior. We can also conduct athorough gap analysis on the various determinants of Customer Experience tounderstand the difference in expectations and perceptions of service quality intelecom industry. This gap analysis will reflect the focus areas for the serviceproviders and the main discriminator towards business success in a competitivemarket like India.
8. CONCLUSION
Customer Experience is something that is very difficult to quantify. However ACEIScore attempts to quantify the experience provided by telecom service providersto its subscribers across all the stages of customer lifecycle. Factor analysis resultsprove that the determinants chosen to define ACEI score are adequate to determinecustomer experience holistically and cumulatively they provide a perfect measureof customer experience in telecom industry. Binary Logistic Regression resultsemphasize the fact that there is a significant impact of customer experience oncustomer behavioral intentions. Good customer experience leads to favorablecustomer behavior and this is applicable to various intentions like willingness torecommend, willingness to purchase other services, customer loyalty, up-sell orcross-sell willingness, etc.
Another important conclusion that this research paper emphasized on is aboutthe variation of customer behavior across demographics and geographies withsame level of improvement in customer experience. It was seen that differentcustomer segments behave differently and thus it becomes highly important forthe telecom service providers to understand the preferences of their target marketand devise the Customer Experience Engineering plan accordingly for getting bestresults as perception in service quality or customer experience varies acrossdemographics and geographies.
ReferencesAdam Richardson. “Understanding Customer Experience”. 2010. Retrieved from https://
hbr.org/2010/10/understanding-customer-experience.
Al-Khali, A., & Mahmoud, A. B. (2012). The Role of Demographics in Patients’ Perceptionstowards the Quality of Health Care Services Provided at Public Hospitals in Damascus.European Journal of Economics, Finance and Administrative Services, 48, 113–121.
Arthut Middleton Hughes- Churn Reduction in the telecom Industry- The Database Marketing
Institute, Ltd. http://www.dbmarketing.com/telecom/churnreduction.html
Balabanis, G., Reynolds, N., & Simintiras, A. (2006), “Bases of e-store loyalty: Perceived switchingbarriers and satisfaction”. Journal of Business Research, 2006, 59(2): 214-224
Berry, L.L. and Carbone, L.P. (2007), “Build loyalty through experience management”, QualityProgress, Vol. 40 No. 9, pp. 26-32.

Impact of Customer-Experience on Customer-Behavior for Cellular Services... � 4677
Booz Allen Hamilton 2001. “Merger Integration: Delivering on the promise”.Retrieved from“http://www.boozallen.com/media/file/76776.pdf”.
Brakus, J. Josko, Schmitt, Bernd H., & Zarantonello, Lia (2009), “Brand Experience: What Is It?How Is It Measured? Does It Affect Loyalty?” Journal of Marketing Vol. 73 (May 2009), 52–68.
Chen, C.-F. (2008). “Investigating structural relationships between service quality, perceivedvalue, satisfaction, and behavioral intentions for air passengers: Evidence from Taiwan.”Transportation Research Part A, 42, 709–717.
Chen, C.-F., & Chen, F.-S. (2010). “Experience quality, perceived value, satisfaction andbehavioral intentions for heritage tourists.” Tourism Management, 31, 29–35
Colin Shaw, (2013) “7 Steps to Improve Your Employee Engagement” https://www.linkedin.com/pulse/20130920101651-284615-7-steps-to-improve-your-employee-engagement, article retrieved on 23rd May 2015
Craig Bailey Kurt Jensen (2006), “Customer advocacy- Customer Centricity, Inc.”.
Dejan Radosavljevik, Kim Kyllesbech Larsen and Peter van der Putten (2011), “CustomerSatisfaction and Network Experience in Mobile Telecommunications”. Appearing inProceedings of the 20th Machine Learning conference of Belgium and The Netherlands.
Fabrico Carvalho de Gouveia and Thomas Magedanz, (2002), “Quality of Service intelecommunication network”, Telecommunication system and technologies – Vol II.
Foxall and Goldsmith (1994), “Consumer Psychology for marketing”- Routledge, 1994
Gagliano, K. B., & Hathcote, J. (1994). Customer Expectations and Perceptions of Service Qualityin Retail Apparel Specialty Stores. Journal of Services Marketing, 9(1), 60–69. http://dx.doi.org/10.1108/08876049410053311
Gay, L., (1987). “Educational research: competencies for analysis and application.” Merrill Pub.Co., Columbus.
Gene Reznik, (2012), Redefining the relationship with the digital Customer- copyright Accenture2011.Retrievedfrom http://www.accenture.com/SiteCollectionDocuments/PDF/Accenture-Communications-Research-Digital-Ecosystem.pdf”. 2011
Gentile, Chiara, Nicola Spiller and Giulano Noci, (2007), “How to Sustain the CustomerExperience: An Overview of Experience Components that Cocreate Value with theCustomer,” European Management Journal, 25 (5), 395–410
Graeme Ross & Chris McLaren, (2013), “In search of a better customer experience”- KPMGreport- KPMG International Cooperative (“KPMG International”).
Gupta, K. K., & Bansal, J. (2011). “Effect of Demographic Variables on Customer PerceivedInternet Banking Service Quality”. Paradigm, Vol XV (1&2), 83–92.
Joshi Sujata, Bhatia Sanjay, Raikar Kiran and Athnikar Rohan, (2015), “TowardsGreater Customer experience: Role of Network Parameters on Key Business Drivers”,ARPN Journal of Engineering and Applied Sciences, Vol 10, No. 3, March 2015, ISSN 1819-6608.
Juthamard Sirapracha and Gerard Tocquer (2012). “Branding and Customer Experience in theWireless Telecommunication Industry” International Journal of Trade, Economics and Finance,Vol. 3, No. 2.

4678 � Joshi Sujata, Bhatia Sanjay, Roy Arindom & Kumar Madhurendra
K. A. Silva (2009), “Customer Retention: With Special Reference to Telecommunication Industryin Sri Lanka”, Paper presented at International Conference on Business and Information,July 2009, Kuala Lumpur, Malaysia retrieved from http://dl.sjp.ac.lk/dspace/bitstream/123456789/1108/1/Customer%20Retention%20With%20Specia l%20Reference%20to%20Telecommunication.pdf on 23rd May 2015
Lee, Richard and Murphy, Jamie (2005) “From Loyalty to Switching: Exploring Determinantsin the Transition,” ANZMAC 2005, Perth, Australia, December
Leonard Kile, (2013), “The Customer Experience, Defined”, http://www.destinationcrm.com/Articles/CRM-News/CRM-Featured-News/The-Customer-Experience-Defined-90194.aspx posted on June 11, 2013, retrieved on 25th May 2015.
Md. Mahmood UL Farid (2013), “Customer Retention in Telecom: a Challenge”, InternationalJournal of Entrepreneurship & Business Environment Perspectives, Volume 2, Number 1.
Meyer C. and Schwager A. (2007), “Understanding Customer Experience”. Boston, MA: Harvard.Business, 2007. pp. 192-208
Michael Treacy Fred Wiersema, (1993)-Harvard Business Review January–February 1993 issue
Mika Uusitalo, (2012), “Customer experience management in telecom operator business”-acustomer service perspective. - Metropolia.
Nunnally, J.C. (1978). “Psychometric theory (1st ed.)” New York: McGraw-Hill.
Oliver, R. L. (1980). “A cognitive model of the antecedents and consequence of CustomerSatisfaction.” Journal of Marketing Research, 17, pp 460-469.
Oliver, R.L. (1993). “Cognitive, affective, and attribute bases of the satisfaction response”, Journalof Consumer Research. 20, pp. 418-30.
Parasuraman, A., Berry, L. L., & Zeithaml, V. (1991). “Understanding of Customer Expectationsof Service”. Sloan Management Review, Spring, 39–48.
Peter C. Verhoef , Katherine N. Lemon, A. Parasuraman , Anne Roggeveen , Michael Tsiros ,Leonard A. Schlesinger, (2009), “Customer Experience Creation: Determinants, Dynamicsand Management Strategies” Journal of retailing, volume 85, issue1, 32-33.
Pirc, M. (2006). “Mobile Service and Phone as Consumption System “ the Impact on CustomerSwitching,” Proceedings of the Helsinki Mobility Roundtable. Sprouts: Working Papers onInformation Systems, 6(33). http://sprouts.aisnet.org/6"33.
Rahul Malviya, Vyas Varma, (2012), “A value based approach to improve customer experience”.– Wipro Technologies 2012.
Ramez, W. S. (2011). Customers’ Socio-economic Characteristics and The Perception of ServiceQuality of Bahrain’s Commercial Banks. International Journal of Business and Management,6(8), 113–126.
Santouridis, I. & Trivellas, P. (2010). “Investigating the impact of service quality and customersatisfaction on customer loyalty in mobile telephony in Greece.” The TQM Journal, 22 (3),330-343.
Satish, K.Santosh Kumar, K.J.Naveen and V.Jeevanantham, (2011), “A Study on ConsumerSwitching Behaviour in Cellular Service Provider”, Far East Journal of Psychology and Business,Vol. 2 No 2.
Impact of Customer-Experience on Customer-Behavior for Cellular Services... � 4679
Sebastian Barros Jon Beguiristain, (2012), “Capitalizing on Customer Experience”. Ericsson report2012.
Shaw C., Ivens J. (2002), “Building a great Customer Experience”. New York: PalgraveMacmillan., 2002 revised in 2005.
Siew-PhaikLoke, Ayankunle Adegbite Taiwo, Hanisah Mat Salim, and Alan G. Downe, (2011)-”Service Quality and Customer Satisfaction in a Telecommunication Service Provider”-IPEDR (2011) IACSIT Press, Singapore.
Suzana Ðukiæ and Velida Kijevèanin, (2012), “Service Quality as Determinant of Customersatisfaction”. FACTA UNIVERSITATIS Series: Economics and Organization Vol. 9, No 3, 2012,pp. 311 – 325.
TRAI Report (Feb 2015): https://www.trai.gov.in/WriteReadData/WhatsNew/Documents/PR-TSD-Feb-10042015.pdf.
Vijay Narsipur, (2004), “All the right moves-Part III -enhancing right customer experience withthe right BPO model”, www.infosysbpo.com, 3-4, 2004.
Wang Y. & Hing-Po Lo. (2002). “Service quality, customer satisfaction and behavior intentions:Evidence from China’s telecom Industry”. Info 4, 6 pp. 50-60.MCB UP Ltd.
W. Ruce Allen, (2012), “India’s experience with mobile number Portability”- Neustar Inc. “https://www.neustar.biz/corporate/docs/india_experience_with_mobile_number_portability.pdf.
Xu, Jing Bill and Chan, Andrew, (2010). “A conceptual framework of hotel experience andcustomer-based brand equity: Some research questions and implications”, InternationalJournal of Contemporary Hospitality Management, Vol. 22 No. 2, 2010, pp. 174-193.
Zeithaml, V.A., Berry, L.L. & Parasuraman, A. (1996). “The behavioral consequences of servicequality”, Journal of Marketing, Vol. 60 No. 2, pp. 31-46.
Zhao, L., Lu, Y., Zhang, L., & Chau, P. Y. K. (2012).” Assessing the effects of service quality andjustice on customer satisfaction and the continuance intention of mobile value-addedservices: An empirical test of a multidimensional model.” Decision Support Systems, 52(3),645-656.


�����������������������������������������������������������������������������������������������������������������������������������������������������������������������������������������������������������������


![Forecasting Earth Quake Using Back Propagation Algorithm ...serialsjournals.com/serialjournalmanager/pdf/1483683448.pdf · successful implementation of predicting earthquakes. [1]](https://img.dokumen.tips/doc/110x75/5aaa47487f8b9a95188de25c/forecasting-earth-quake-using-back-propagation-algorithm-implementation-of-predicting.jpg)