Embed Size (px)
Citation preview
Demographic Differences & Shopping Behavior of Indian Middle Income... 267
* Assistant Professor, Department of Business Studies, Hindustan College of Science & Technology, Mathura,E-mail: [email protected], [email protected]
Asian-African Journal of Economics and Econometrics, Vol. 13, No. 2, 2013: 267-276
DEMOGRAPHIC DIFFERENCES & SHOPPING BEHAVIOROF INDIAN MIDDLE INCOME GROUP USERS WITH
DEBIT CARDS: AN EMPIRICAL ANALYSIS
Vivek kumar Tripathi* and Tanu Marwah*
ABSTRACT
With the advancement of technology and need towards better service provision plastic money inform of cards- debit or credit cards are becoming common now a days. These tools of purchasemanagement are reaching into wallet of nearly all. As a result companies are also eying toleverage the cards benefits as shopping / purchase facilitator. As with the emerging equalities ofmen and women and their equal and balanced role in shaping up the society, both the gendersestablish quite active response patterns with respect to debit/credit card spending and use.According to the survey of Reserve Bank of India (RBI) more card holders have reduced thenumber of cards in their wallet and consolidated spending with a single card in 2011.Theproportion of single card holders has grown most in India in 2011 at 90 per cent. The second wasthe Philippines with 84 per cent, followed by Malaysia (80 per cent). The use of cards is perceiveddifferently by various consumer classes. Women might be bigger spenders than men, but they usetheir debit cards less frequently, says a survey by the RBI published in business today. The presentstudy explores various behavioural aspects associated with two broad consumer classes Menand Women belonging to middle income group of tier II cities towards this tool.
Keywords: service provision, purchase facilitator, middle income group, tier II cities
INTRODUCTION
Shopping is now an integral activity of today’s individual. As market goes on progressing withthe development of various avenues- merchandise stores, hyper and supermarkets, shoppingMalls and moreover emergence of e shopping destinations shopping as a necessary activity hasbeen replaced with the concept of enjoyment. Todays generation is becoming more and moreexpense oriented as compared to the older concept of saving orientation of Indian consumers.To facilitate the purpose of shopping marketers are always eying on various offerings that canstimulate the purchase process, change the purchase orientation and facilitate purchase andshopping behaviour. This can range from – opening outlets near population, heavy salespromotion, customised service and products offerings and so on. One such major developmentis the development of plastic money Debit cards. A debit card provides electronic access to onesfinancial accounts any time and with much ease and convenience. Earlier model suggests use ofcash only if one wishes to purchase anything. Thus is a restricting condition and thus impulse
268 Vivek Kumar Tripathi and Tanu Marwah
purchasing was much reduced. Emergence of cards thus removes this barrier of cash balance atany point of shopping and offers more access to cash in electronic formats and thus purchaseand shopping intentions. Freedom of dispensing cash and access any time model provokesvarious shopping intentions. Here Debit cards came into existence as an suitable option toshoppers. To further lure the buyers of positive shopping intention various other tools were alsointroduced viz. credit card offering cash affordability even if actual cash balance is declining ornegative at a certain point.
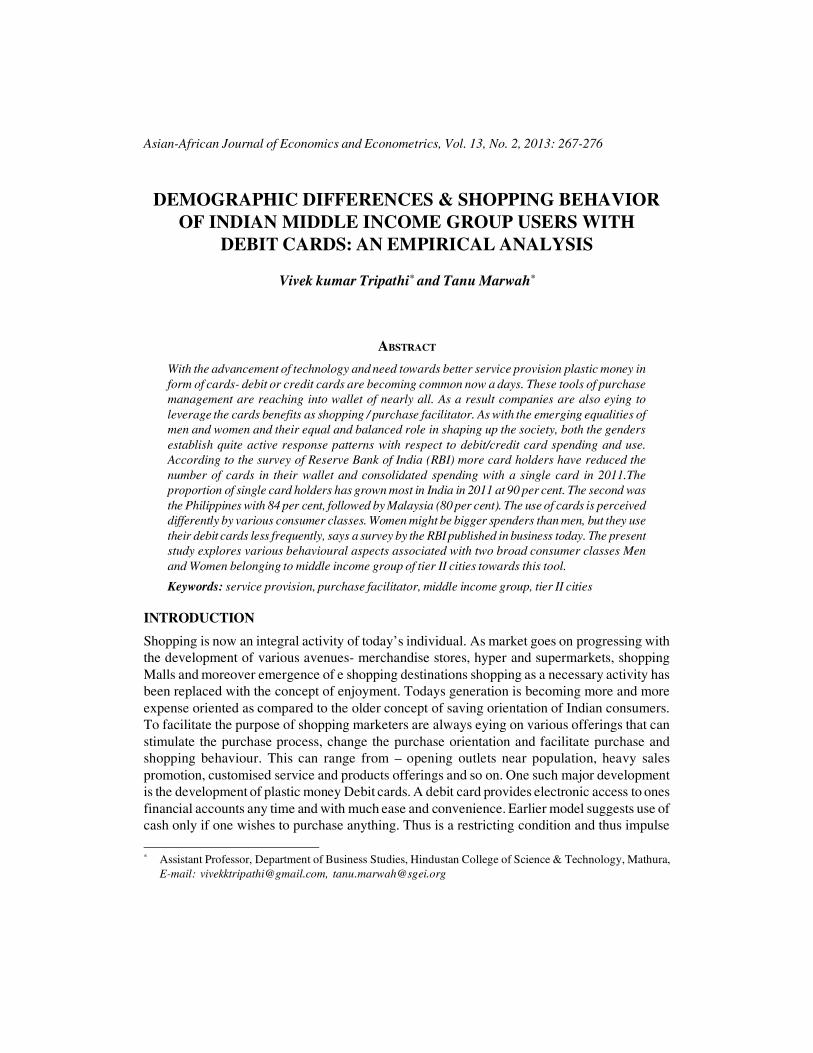
Statistics released by the Reserve Bank of India (RBI) in Jan2012 shows a clear shift in theuse of plastic money. Indians, especially those who are not big spenders, are increasinglyusing credit cards for debit cards. Data shows that the number of debit cards issued by bankswas ten times higher than credit cards. Over the past five years, debit card usage both in termsof number of transactions and growth in value has outstripped credit card spending by a hugemargin. According to new research report, “Indian Payment Card Market Forecast to 2012”,the number of payment cards, categorized as credit and debit cards, is increasing rapidly inIndia. The research found that credit card market have been showing tremendous growthperformance and emerged as a potential investment area for players of credit market. Accordingto the data of capital Mind, india has witnessed rapid and significant growth in terms of numberand volume of credit and Debit cards over a period of time. The graph below represents the useof debit and credit cards by Indian users. Debit card is more in use as compared to credit cardand there are various contributing factors towards the popularisation of debit card.
Source: Secondary, Capital Mind
Demographic Differences & Shopping Behavior of Indian Middle Income... 269
While analysing trends on the data furnished by RBI shows increasing trend towards useof debit card which can be attributed to various actors viz. Consumer demographics, lifestyleorientation of consumers, market development and encashing upon these factors banks alsoliberalised in provisions for getting a debit card as a value added service to there customersand hence facilitating sales through cards by increasing swapping machines and ATMinstallations at multiple merchandisers.
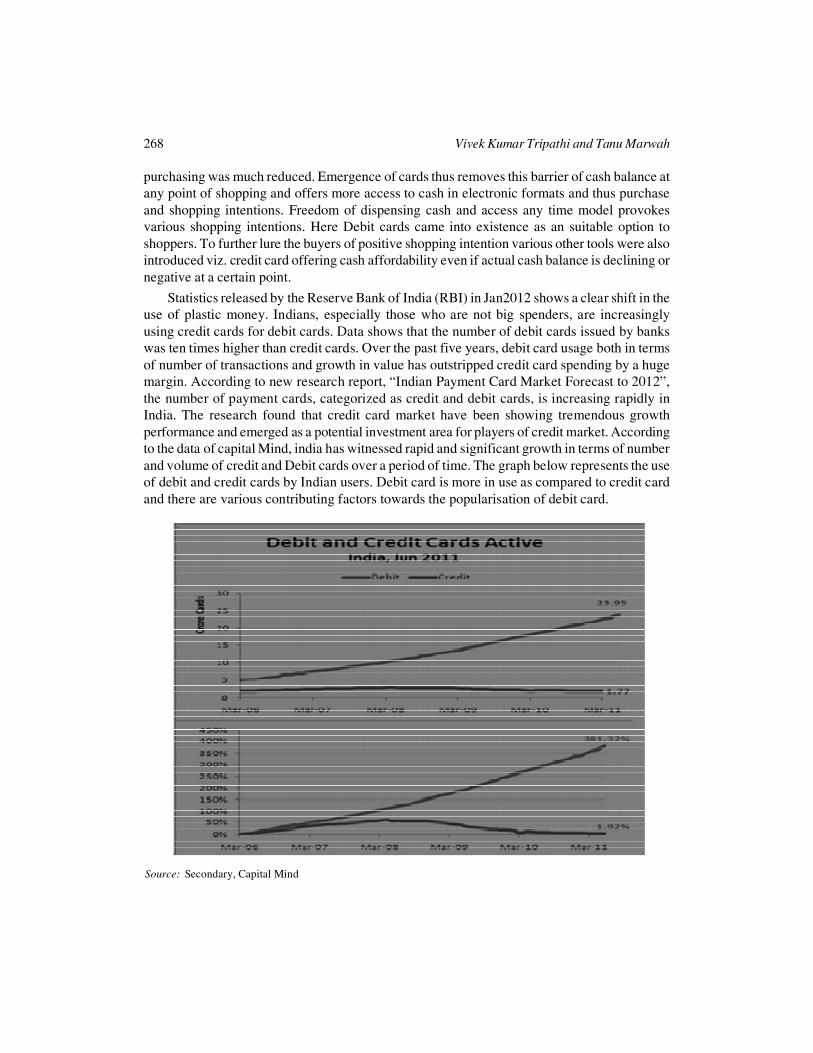
Usage of Debit Cards
CardPayments
Year/ Period No. of outstanding cards Number Amountmn. bn.
2003-04 — 37.76 48.74
2004-05 — 41.53 53.61
2005-06 49.76 45.69 58.97
2006-07 74.98 60.18 81.72
2007-08 102.44 88.31 125.21
2008-09 137.43 127.65 185.47
2009-10 181.97 170.17 264.18
2010-11 227.84 237.06 386.91
Total (up to Jan 2012) 268 268.8 443.89
# Card Payments figures pertain only to Point of Sale (POS) transactions.
* Debit Cards figures for 2003-04 and 2004-05 are estimated based on 2005-06 figures.
** Cards issued by banks (excluding those withdrawn/blocked).
(Source: Secondary, Reserve bank of India)
The present study tries to understand various variables / factors that influence the choiceof use of cards- credit and debit cards taking into consideration two prominent demographicfactors- Gender and income group which is restricted towards rising Middle Income Group.
LITERATURE REVIEW
The usage of any product is determined by various factors and personality variables are oneprominent factor in choice and selection and usage behaviour of a product/service. In Recentyears several changes in market has happened with emergence of new markets/ products andemerging role of females in personal and social decision making. Better education penetration,changing social orientation, rise of working and independent female segment has allowedfemales to be more independent in there choice of purchase decision making starting fromchoice of low investment product to expensive purchases. As a result it is imperative tounderstand purchase behaviour individually towards different product categories. Philip Kotlermentioned-”if you want to influence your customer you will have to understand your customerfirst”.
270 Vivek Kumar Tripathi and Tanu Marwah
Several studies have been undertaken at various parts of globe to understand demographicinfluences on purchase decisions. In line of this payment mode is also crucial in understandingbuyers choice. Today there are various payment options available to shoppers such as–cash,credit card, debit card, shopping cards. Plastic money is increasingly replacing cash aspayment option at Point of Sale (POS). But the use of these Modern payment tools is highlysubjective.
To understand demographic patterns in the adoption of payment methods, several studieshave been undertaken. Kennickell and Kwast (1997), Stavins (2001) and Zinman (2005) ûndthat newer technologies such as electronic banking and bill payment or debit cards are usedmost frequently by younger, better-educated individuals. Carow and Staten (1999) speciûcallyexamine debit card use early in its diffusion, while Rysman (2004) focuses on the role ofdemographics in consumers’ choice of credit card brands; Hayashi and Klee (2003) examineconsumer adoption of debit cards as well as direct deposit and electronic bill payment. Also,Jonker (2005) and Loix, Pepermans and Van Hove (2005) also worked on analysing adoptionprocess of payment methods.
Using cash is convenient because it is accepted almost everywhere (with the notableexception of online retailers), but carrying large amounts of cash entails both a substantialopportunity cost and a physical risk of being the target of crime. Credit cards, while costlyfrom the perspective of payees (as noted above), offer consumers many advantages. A substantialperiod of ûoat, limited liability in the case of theft or loss, dispute resolution assistance,consolidation of bill payment, itemized bills, and the ability to borrow are just Some of thestandard features of most bank issued debit cards. These cards are accepted at the same locationswhere credit cards are accepted. The major advantages of the debit card are that it normallydoubles as an ATM card, thus allowing the consumer to carry one less card, and it also allowsthe user to receive cash back after purchases are made when used in combination with a personalidentiûcation number.
Like credit cards, debit cards also offer consolidated billing/record keeping and ease oftelephone and Internet based transactions. Drawbacks to the debit card include limitedacceptance and the loss of all ûoat in the case of online debits and most ûoat in the case ofofûine debits. One branch of research has focused on the demographics of consumers whochoose to use electronic rather than more traditional methods of payment. Mantel (2000) ûndsthat use of electronic payments in general is positively related to income, wealth, and age.Kennickell and Kwast (1997) show that those who use debit cards are younger, have higherlevels of education. There are some key differences in the ûndings of Mantel (2000) and thoseof Kennickell and Kwast (1997). For example, Mantel’s (2000) education result differs fromthat of Kennickell and Kwast (1997). Mantel (2000) argues that the education variable in hisresults was insigniûcant because of the inclusion of other demographic variables that are closelyrelated to level of education. On the other hand, if one considers only debit cards, as in Kennickelland Kwast (1997), then it is reasonable to see more use among younger people since they tendto adopt newer technologies more quickly than older people.
Caskey and Sellon (1994) found that consumers do see debit cards as substitutes for cashand checks, implying that small enticements could convince consumers to choose debit cards
Demographic Differences & Shopping Behavior of Indian Middle Income... 271
over paper checks. They argue that the 30% growth in debit card usage between 1990 and 1993was most likely because of (1) the integration of the ATM networks that allow for the transferof funds and (2) the introduction of the VISA and MasterCard debit programs. They predictedthat, as the importance of network effects declined because of changes in technology and inthe way the banking industry did business, debit card usage would increase. Indeed, between1993 and 1997 debit card usage grew at an average annual rate of 53.3%. Credit card usagegrew at an annual rate of only 7.8% during the same time period (Weiner, 1999). This rapidincrease in debit card usage has been attributed to consumers substituting debit for cash andcheck purchases. It is clear why consumers might not see debit cards as a substitute for creditcards (borrowing capacity), but aren’t credit cards a very close substitute for debit cards? Ifthis were the case, consumers should have already switched from cash and checks to creditcards and we shouldn’t see such rapid growth in the use of debit cards. Studies have found thatdemographic attributes are important determinants of consumer payment adoption (Stavins2001, Mester 2003, Bertaut and Haliassos 2006, Klee 2006, Zinman (2009). However,demographics leave a substantial variation in payment behaviour unexplained. Schuh and Stavins(2010) found that payment characteristics are significant in explaining consumer payment use.The present study tries to further the understanding of consumer’s perception towards debitcards among particular category- young Middle Income Group Indian consumers and tries toinvestigate Demographic roles in selection of this payment method through use relatedbehaviours.
RESEARCH METHODOLOGY
The study was conducted on Primary and Secondary data. Primary data is collected throughtool of Structured Questionnaire. Secondary data is collected by exploring the credential financialdata from RBI and other banking portals. The sample size of the research is 50 respondentswhich consist of different age, income and of different occupation.
The research tool used for analysis:
1. factor Analysis
2. Mean standard deviation Analysis
3. ANOVA-Table
RELIABILITY TEST
The value of cronbach alpha is 0.842 which shows the significant reliability status.
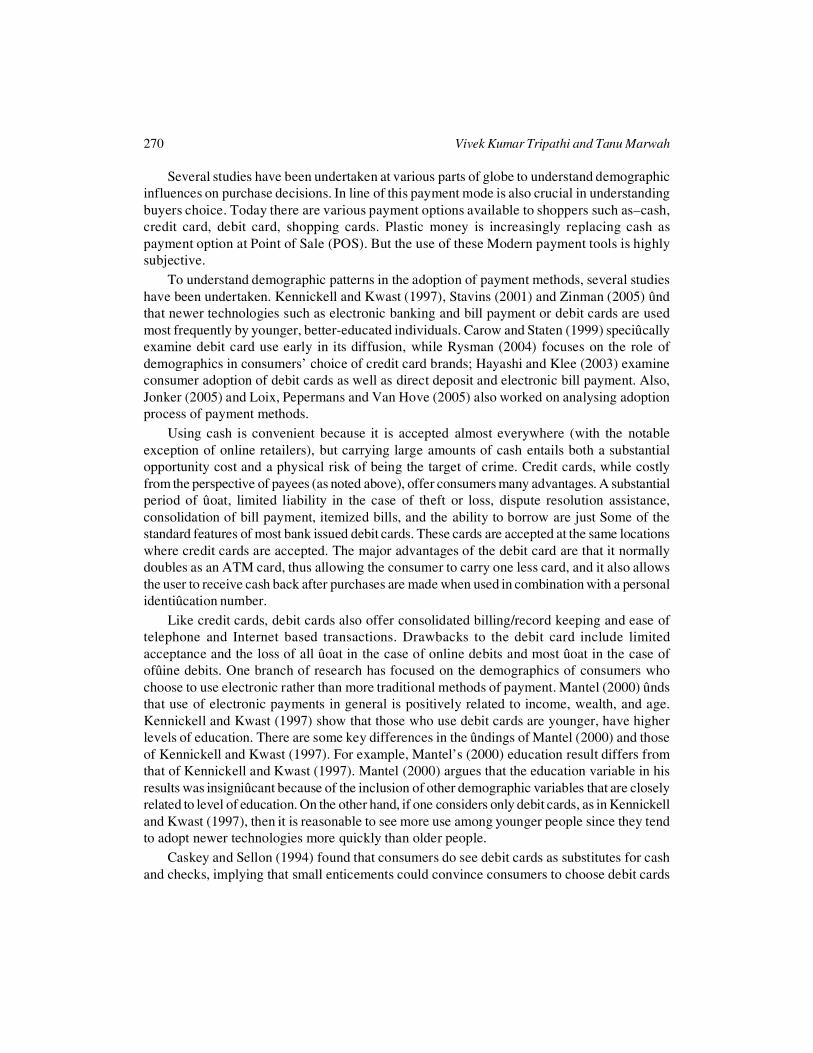
The complete set of interdependent relationship is examined by using factor analysis tool.A varimax rotation measure is used which yields results which make it as easy as possible toidentify each variable with a single factor. The value of extraction sum of squared loading is81.414 which limit the factors no. to 7 which reduces overlapping and makes the study morefocused. Certain factors related to association of a card user towards debit cards for considerationwhich can influence a particular prospective buyer or user towards use are identified. Furtherthese were common factors identified in past studies leading to diffusion of this tool of paymentin market.
272 Vivek Kumar Tripathi and Tanu Marwah
Factors Affecting Diffusion
• Ease of use against traditional payment methods
• Convenience in payment
• Time saving in transaction (retail payments)
• Safety in transaction
Factors to Assess Role on Individual’s Life
• Use is related to availability of outlets accepting cards as payment tool
• Carrying Card is used as status option
• Card is integrated into there lives as cell phones
• Confidence and Reliability factors associated with card shopping
Total% of
VarianceCumulative
% Total% of
VarianceCumulative
% Total% of
VarianceCumulative
%
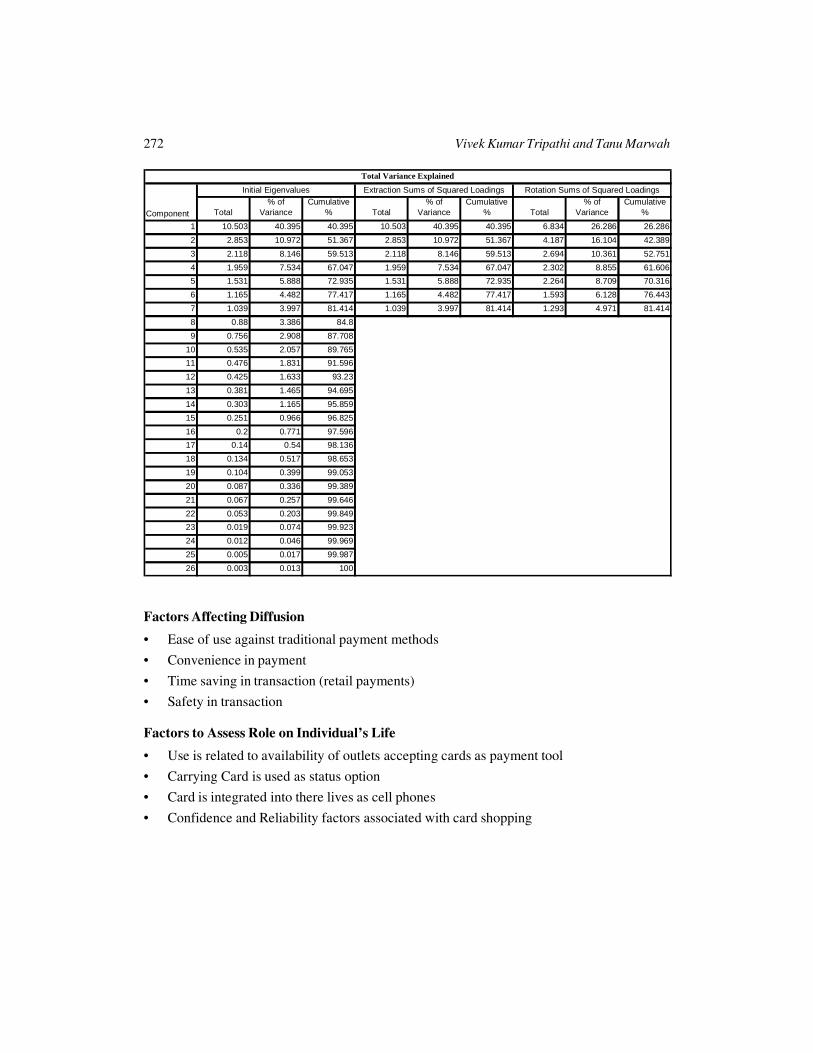
1 10.503 40.395 40.395 10.503 40.395 40.395 6.834 26.286 26.286
2 2.853 10.972 51.367 2.853 10.972 51.367 4.187 16.104 42.389
3 2.118 8.146 59.513 2.118 8.146 59.513 2.694 10.361 52.751
4 1.959 7.534 67.047 1.959 7.534 67.047 2.302 8.855 61.606
5 1.531 5.888 72.935 1.531 5.888 72.935 2.264 8.709 70.316
6 1.165 4.482 77.417 1.165 4.482 77.417 1.593 6.128 76.443
7 1.039 3.997 81.414 1.039 3.997 81.414 1.293 4.971 81.414
8 0.88 3.386 84.8
9 0.756 2.908 87.708
10 0.535 2.057 89.765
11 0.476 1.831 91.596
12 0.425 1.633 93.23
13 0.381 1.465 94.695
14 0.303 1.165 95.859
15 0.251 0.966 96.825
16 0.2 0.771 97.596
17 0.14 0.54 98.136
18 0.134 0.517 98.653
19 0.104 0.399 99.053
20 0.087 0.336 99.389
21 0.067 0.257 99.646
22 0.053 0.203 99.849
23 0.019 0.074 99.923
24 0.012 0.046 99.969
25 0.005 0.017 99.987
26 0.003 0.013 100
Total Variance Explained
Component
Initial Eigenvalues Extraction Sums of Squared Loadings Rotation Sums of Squared Loadings
Demographic Differences & Shopping Behavior of Indian Middle Income... 273
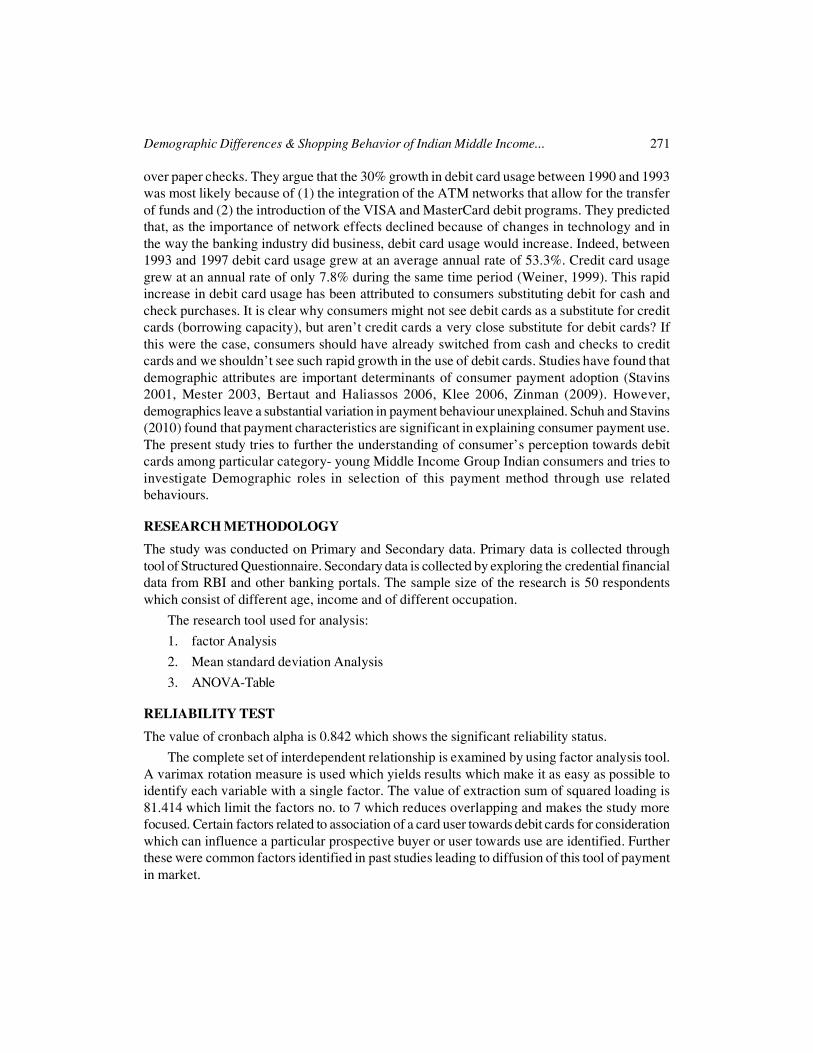
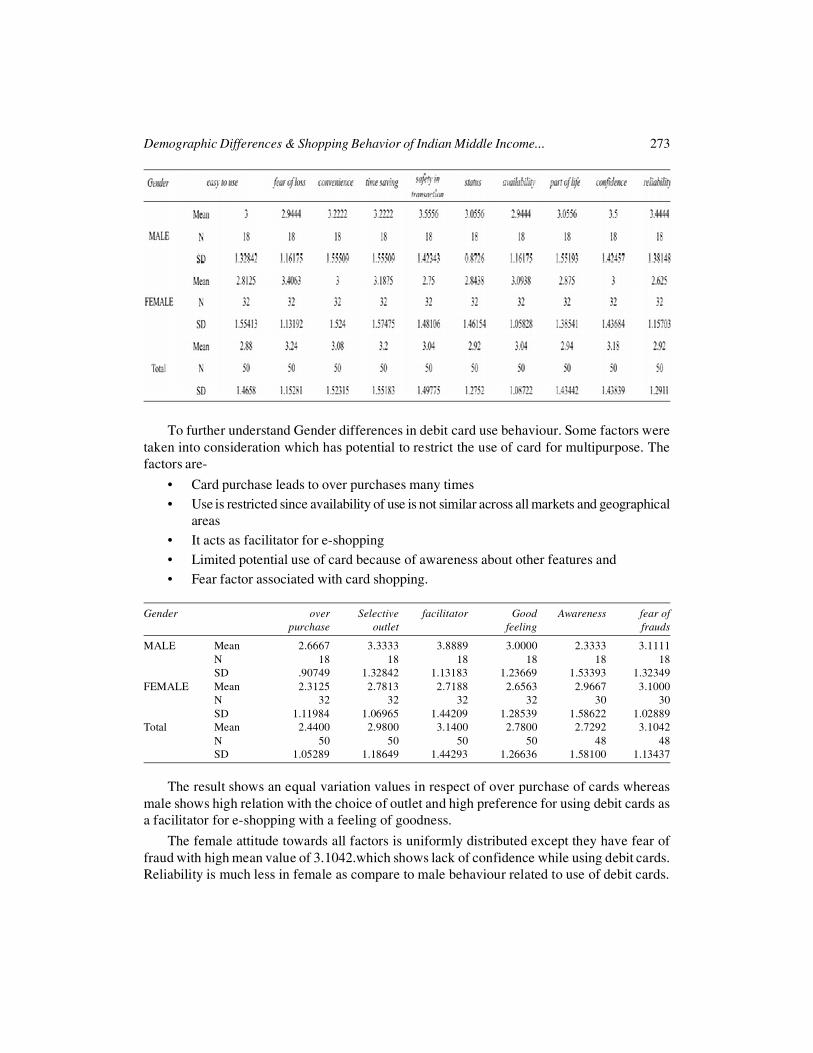
To further understand Gender differences in debit card use behaviour. Some factors weretaken into consideration which has potential to restrict the use of card for multipurpose. Thefactors are-
• Card purchase leads to over purchases many times• Use is restricted since availability of use is not similar across all markets and geographical
areas• It acts as facilitator for e-shopping• Limited potential use of card because of awareness about other features and• Fear factor associated with card shopping.
Gender over Selective facilitator Good Awareness fear ofpurchase outlet feeling frauds
MALE Mean 2.6667 3.3333 3.8889 3.0000 2.3333 3.1111N 18 18 18 18 18 18SD .90749 1.32842 1.13183 1.23669 1.53393 1.32349
FEMALE Mean 2.3125 2.7813 2.7188 2.6563 2.9667 3.1000N 32 32 32 32 30 30SD 1.11984 1.06965 1.44209 1.28539 1.58622 1.02889
Total Mean 2.4400 2.9800 3.1400 2.7800 2.7292 3.1042N 50 50 50 50 48 48SD 1.05289 1.18649 1.44293 1.26636 1.58100 1.13437
The result shows an equal variation values in respect of over purchase of cards whereasmale shows high relation with the choice of outlet and high preference for using debit cards asa facilitator for e-shopping with a feeling of goodness.
The female attitude towards all factors is uniformly distributed except they have fear offraud with high mean value of 3.1042.which shows lack of confidence while using debit cards.Reliability is much less in female as compare to male behaviour related to use of debit cards.
274 Vivek Kumar Tripathi and Tanu Marwah
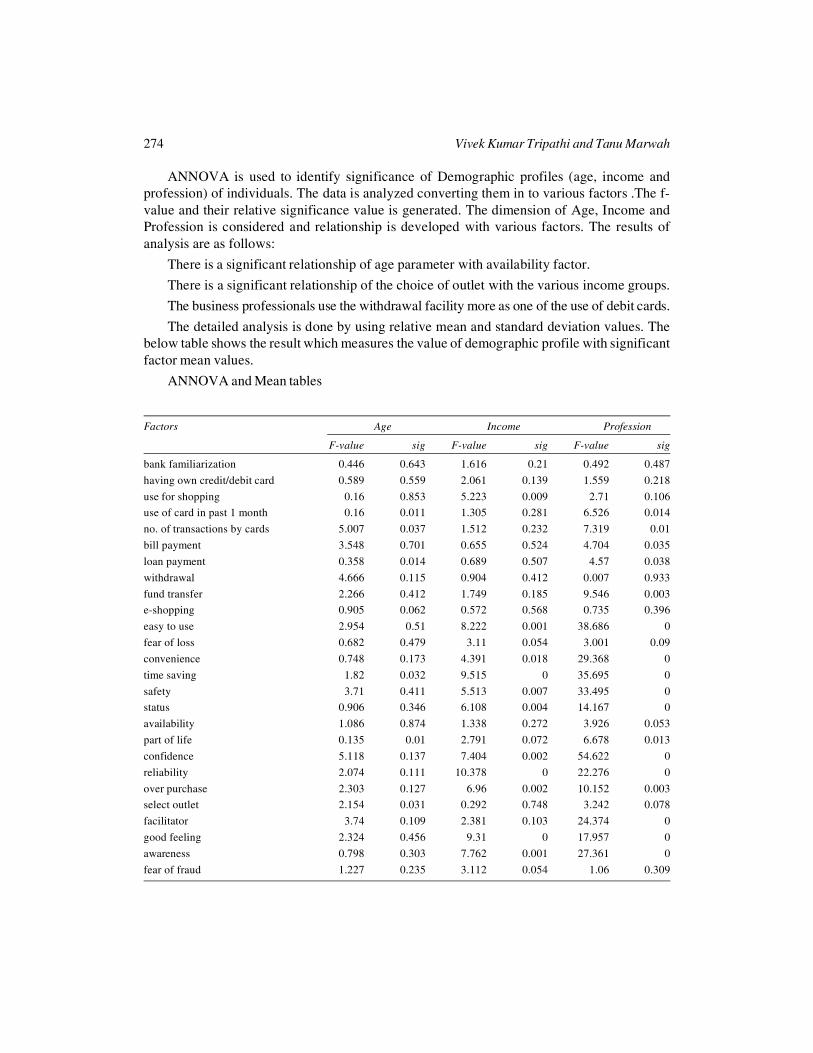
ANNOVA is used to identify significance of Demographic profiles (age, income andprofession) of individuals. The data is analyzed converting them in to various factors .The f-value and their relative significance value is generated. The dimension of Age, Income andProfession is considered and relationship is developed with various factors. The results ofanalysis are as follows:
There is a significant relationship of age parameter with availability factor.
There is a significant relationship of the choice of outlet with the various income groups.
The business professionals use the withdrawal facility more as one of the use of debit cards.
The detailed analysis is done by using relative mean and standard deviation values. Thebelow table shows the result which measures the value of demographic profile with significantfactor mean values.
ANNOVA and Mean tables
Factors Age Income Profession
F-value sig F-value sig F-value sig
bank familiarization 0.446 0.643 1.616 0.21 0.492 0.487
having own credit/debit card 0.589 0.559 2.061 0.139 1.559 0.218
use for shopping 0.16 0.853 5.223 0.009 2.71 0.106use of card in past 1 month 0.16 0.011 1.305 0.281 6.526 0.014
no. of transactions by cards 5.007 0.037 1.512 0.232 7.319 0.01
bill payment 3.548 0.701 0.655 0.524 4.704 0.035
loan payment 0.358 0.014 0.689 0.507 4.57 0.038
withdrawal 4.666 0.115 0.904 0.412 0.007 0.933
fund transfer 2.266 0.412 1.749 0.185 9.546 0.003e-shopping 0.905 0.062 0.572 0.568 0.735 0.396
easy to use 2.954 0.51 8.222 0.001 38.686 0
fear of loss 0.682 0.479 3.11 0.054 3.001 0.09
convenience 0.748 0.173 4.391 0.018 29.368 0
time saving 1.82 0.032 9.515 0 35.695 0
safety 3.71 0.411 5.513 0.007 33.495 0status 0.906 0.346 6.108 0.004 14.167 0
availability 1.086 0.874 1.338 0.272 3.926 0.053
part of life 0.135 0.01 2.791 0.072 6.678 0.013
confidence 5.118 0.137 7.404 0.002 54.622 0
reliability 2.074 0.111 10.378 0 22.276 0
over purchase 2.303 0.127 6.96 0.002 10.152 0.003select outlet 2.154 0.031 0.292 0.748 3.242 0.078
facilitator 3.74 0.109 2.381 0.103 24.374 0
good feeling 2.324 0.456 9.31 0 17.957 0
awareness 0.798 0.303 7.762 0.001 27.361 0
fear of fraud 1.227 0.235 3.112 0.054 1.06 0.309
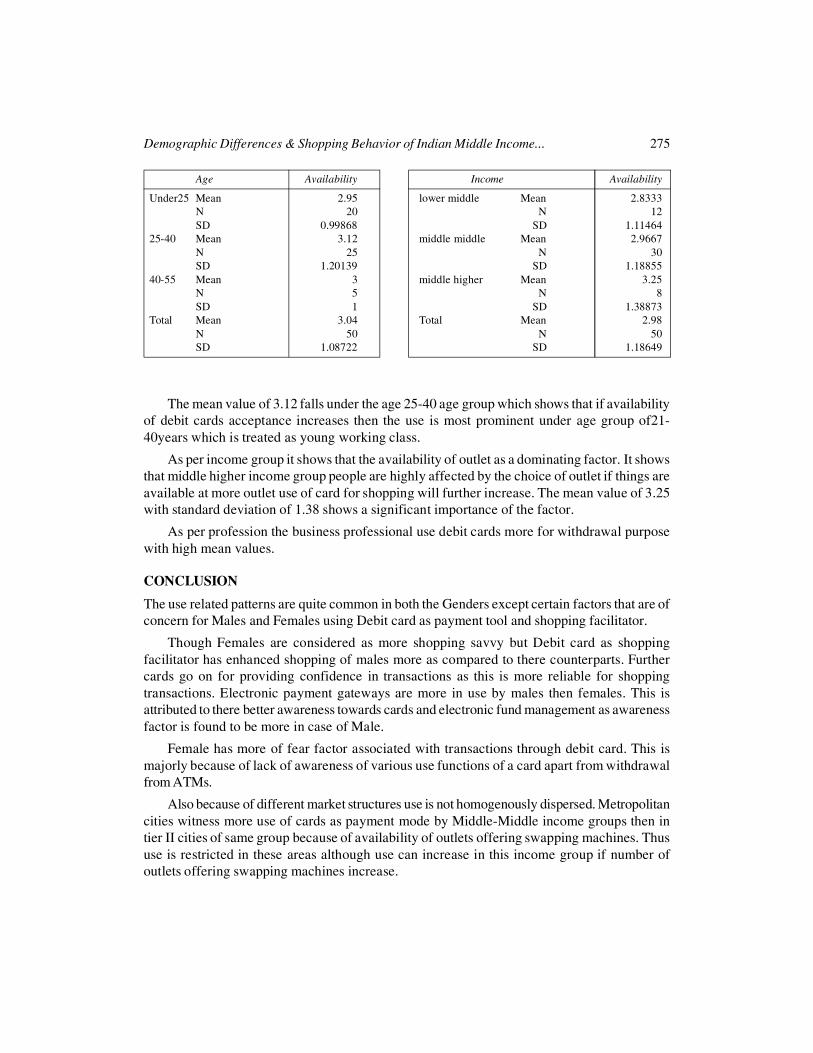
Demographic Differences & Shopping Behavior of Indian Middle Income... 275
Age Availability Income Availability
Under25 Mean 2.95 lower middle Mean 2.8333 N 20 N 12 SD 0.99868 SD 1.11464
25-40 Mean 3.12 middle middle Mean 2.9667 N 25 N 30 SD 1.20139 SD 1.18855
40-55 Mean 3 middle higher Mean 3.25 N 5 N 8 SD 1 SD 1.38873
Total Mean 3.04 Total Mean 2.98 N 50 N 50 SD 1.08722 SD 1.18649
The mean value of 3.12 falls under the age 25-40 age group which shows that if availabilityof debit cards acceptance increases then the use is most prominent under age group of21-40years which is treated as young working class.
As per income group it shows that the availability of outlet as a dominating factor. It showsthat middle higher income group people are highly affected by the choice of outlet if things areavailable at more outlet use of card for shopping will further increase. The mean value of 3.25with standard deviation of 1.38 shows a significant importance of the factor.
As per profession the business professional use debit cards more for withdrawal purposewith high mean values.
CONCLUSION
The use related patterns are quite common in both the Genders except certain factors that are ofconcern for Males and Females using Debit card as payment tool and shopping facilitator.
Though Females are considered as more shopping savvy but Debit card as shoppingfacilitator has enhanced shopping of males more as compared to there counterparts. Furthercards go on for providing confidence in transactions as this is more reliable for shoppingtransactions. Electronic payment gateways are more in use by males then females. This isattributed to there better awareness towards cards and electronic fund management as awarenessfactor is found to be more in case of Male.
Female has more of fear factor associated with transactions through debit card. This ismajorly because of lack of awareness of various use functions of a card apart from withdrawalfrom ATMs.
Also because of different market structures use is not homogenously dispersed. Metropolitancities witness more use of cards as payment mode by Middle-Middle income groups then intier II cities of same group because of availability of outlets offering swapping machines. Thususe is restricted in these areas although use can increase in this income group if number ofoutlets offering swapping machines increase.
276 Vivek Kumar Tripathi and Tanu Marwah
References
Ashish Das, Rakhi Agarwal (2010), Cashless Payment System in India- A Roadmap. Technical Report.
Carow K. A., Staten M. E. (1999), Debit, Credit, or Cash: Survey Evidence on Gasoline Purchases. Journal ofEconomics and Business, 51, 210–224.
Durkin T. A. (2000). Credit Cards: Use and Consumer Attitudes 1970–2000. Federal Reserve Bulletin, 86, 623–634.
Evans D. S., Schmalensee R. (1999), Paying with Plastic. Cambridge, MA: The MIT Press.
Feinberg R. A. (1986), Credit Card as Spending Facilitating Stimuli: A Conditioning Interpretation. Journal ofConsumer Research, 13, 348–356.
Gerdes G., Walton J. K. (2002), The Use of Checks and other Non-cash Payment Instruments in the UnitedStates. Federal Reserve Bulletin, August, 360–374.
Greene W. H. (1997), Econometric Analysis (3rd ed.) New York, NY: Prentice Hall.
Jonathan Zimman (2009), Debit or Credit? Journal of Banking & Finance, 33(2), 358-366.
Jinkook Lee, Fahzy Abdul Rahman M. S., Hyungsoo Kim (2007), Debit Card Usage: An Examination of itsImpact on Household Debt. Financial Service Review 16, 73-87.
Kennickell A. B., Kwast M. L. (1997), Who uses Electronic Banking? Results from The 1995 Survey of ConsumerFinance. Annual Meetings of the Western Economic Association, Seattle, WA.
King A. S., King J. T. (2005), The Decision between Debit and Credit: Finance Charges, Float, and Fear.Financial Services Review, 14, 21–36.
Mann R. J. (2002), Credit Cards and Debit Cards in the United States and Japan. Monetary and EconomicStudies, 20, 123–159.
Young Sik Kim, Manjong Lee (2010), A Model of Debit Card as a Means of Payment. Journal of EconomicDynamics and Control, 34(8), 1359-1368.
Zinman J. (2004), Why Use Debit Instead of Credit? Consumer Choice in a Trillion-dollar Market. FederalReserve Bank of New York Staff Reports (191).
Gerdes, G., & Walton, J. K. (2002), The Use of Checks and other Non-cash Payment Instruments in the UnitedStates. Federal Reserve Bulletin, August, 360–374.
Rook, D. W. (1987), The Buying Impulse. Journal of Consumer Research, 14, 189–199.
www.rbi.org.in.


�����������������������������������������������������������������������������������������������������������������������������������������������������������������������������������������������������������������


![Index []digital collaboration, see collaborative work digital divide access to technology 426 cross-national differences 430 demographic factors 427 ethnic differences 428 future research](https://img.dokumen.tips/doc/110x75/5f99248424958124a20fa162/index-digital-collaboration-see-collaborative-work-digital-divide-access-to.jpg)