Embed Size (px)
Citation preview

Demographic Differences in How Students Navigate Through MOOCs
Philip J. Guo MIT CSAIL -> University of Rochester
Katharina Reinecke Harvard -> University of Michigan

Online education strives to bring 1-on-1, mastery-based tutoring
to everyone.

Prereq: understand how people from different demographics
use ed-tech

xMOOC: Coursera, edX, Udacity

How do demographics such as age and country of origin
affect navigation in MOOCs?
OUR STUDY

How can we redesign MOOCs to serve more kinds of students?
OUR STUDY

edX platform
Certificate of completion: ~60% grade

METHODOLOGY
Data Analysis 4 edX courses, Fall ’12: Intro CS, A.I., Stat, Chem
Demographics Country, age, gender, years of education
Student Intent Only certificate earners: 11,490 (10% of total)

Certificate earners cover only ~78% of course pages
Navigation Overview
1.04 backjumps per visited page
Most backjumps were assessment -> lecture

edX certificate earners do opportunistic learning

Focus on country and age

Top 5 countries, 50% of certificate earners

Top 30 countries, 83% of certificate earners

Student-teacher ratio Source: UNESCO Institute for Statistics (primary school data)

Sweden: 9 students/teacher Low student-teacher ratio: Belgium, Hungary, Italy, Poland, Sweden

High student-teacher ratio: Mexico, Kenya, Nigeria, India, Pakistan
Kenya: 47 students/teacher
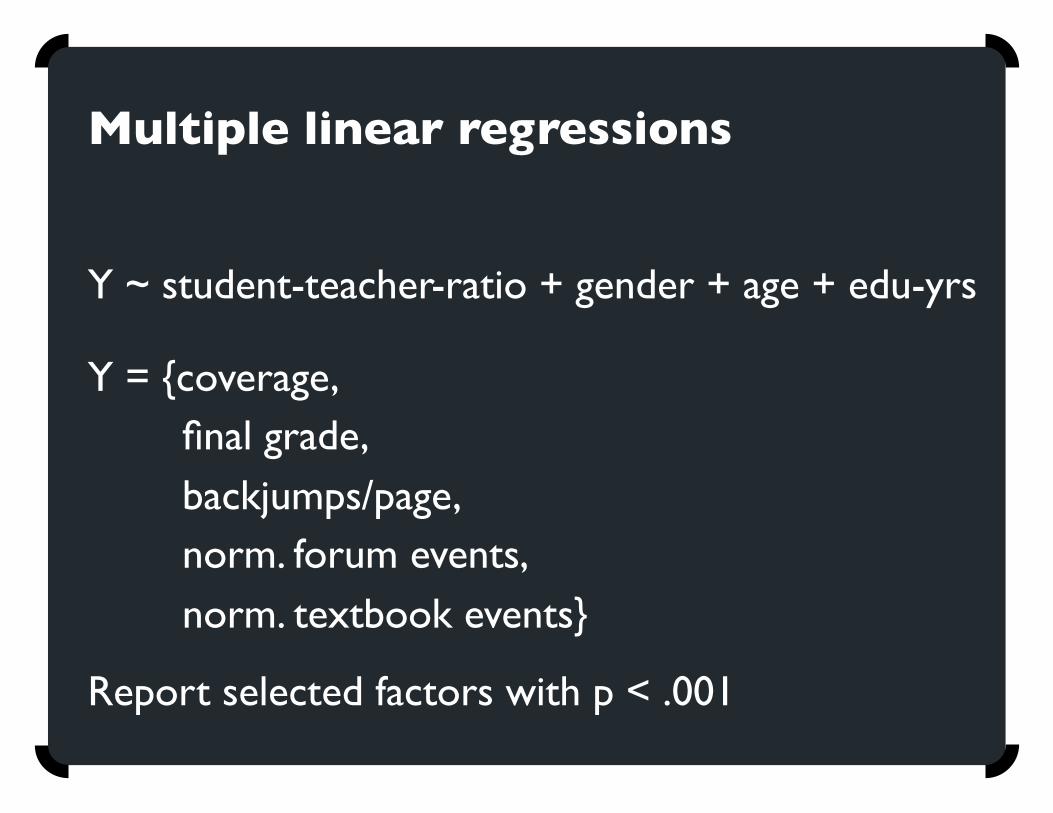
Multiple linear regressions
Y ~ student-teacher-ratio + gender + age + edu-yrs
Y = {coverage, final grade, backjumps/page, norm. forum events, norm. textbook events}
Report selected factors with p < .001

(Caution: generalizing over entire countries)
Higher coverage Lower coverage
More backjumps Fewer backjumps
No significant grade differences
No forum or textbook event differences
Low student-teacher ratio High student-teacher ratio

Higher coverage Lower coverage
More backjumps Fewer backjumps
Student-centric education Teacher-centric education
Field-independent: explorers [Witkin et al. 1977] [Hofstede 1986]
Field-dependent: observers
Low student-teacher ratio High student-teacher ratio

Student-teacher ratio
Mean (# backjumps / visited pages)

Lower coverage Higher coverage (+20%)
Fewer backjumps More backjumps (+20%)
Less forum participation More forum participation (2x)
Fewer textbook visits More textbook visits (+30%)
Hypothesis: Older students more independent and self-directed
(even controlling for country and other demographic variables)
Younger students Older students

Student age range
Mean (# forum posts / total events)

Future work: qualitative insights

Philip Guo @pgbovine www.pgbovine.net
Study Finding Design Ideas
Opportunistic learning Rethink linearity
Variance in coverage and forum posts
Beyond pass/fail certificates
Explorers vs. observers Adaptive scaffolding
SUMMARY
Future MOOCs: one size fits all