Embed Size (px)
Citation preview
Vol. 33, No. 1, January-March 2015 97
Assessment of genetic parameters for various quantitative and qualitiative traits in hybrid rice (Oryza sativa L.)I J T A© Serials Publications
*Parmeshwar Ku. Sahu, Deepak Sharma, Pooja Sahu, Satyapal Singh, Prabha Rani Chaudharyand Fakeer Chand Sao
ABSTRACT: The present investigation was carried out during kharif 2012 and kharif 2013 at research cum instructional farmIGKV, Raipur to evaluate the genetic parameters for thirty three quantitative and qualitative traits in thirty three rice genotypes.Analysis of variance revealed highly significant differences for almost all the traits under study. The characters, viz., pollenfertility percent, productive tillers per plant, harvest index, fertile spikelet per panicle, sterile spikelets per panicle, grain yieldper plant, biological yield per plant, seed index, kernel L/B ratio and head rice recovery exhibited high genotypic coefficient ofvariation (GCV) and phenotypic coefficient of variation (PCV). Small differences between GCV and PCV were recorded for allthe characters studied which indicated less influence of environment on these characters. Pollen fertility percent, fertile spikeletper panicle, sterile spikelet per panicle, total spikelet per panicle, spikelet fertility percent, productive tillers per, days to 50%flowering, flag leaf area, plant height, 100 seed weight, grain yield per plant, biological yield per plant, harvest index, head ricerecovery, brown rice L/B ratio and kernal L/B ratio exhibited high heritability coupled with high genetic advance as percent ofmean, suggesting that These characters are governed by additive gene action direct selection for the improvement of thesecharacters may be rewarding.Key words: Genetic advance, selection, heritability, GCV, PCV,
* Department of Genetics and Plant Breeding, Indira Gandhi Krishi Vishwavidyalaya, Raipur-492012, Chhattisgarh (India)E-mail: [email protected]
INTRODUCTION
The development of superior rice populationinvolved the intelligent use of available geneticvariability both indigenous as well as exotic to caterthe need of various farming situations of rice. Thegrain yield with good quality is the primary traittargeted for improvement of rice productivity.Knowledge on the genetic architecture of genotypesis necessary to formulate effic ient breedingmethodology (Babu et al., 2012). It is essential to findout the relative magnitude of additive and nonadditive genetic variances, heritability and geneticgain with regard to the characters of concern to thebreeder (Paikhomba et al., 2014). The systematicbreeding programme involves the steps like creatinggenetic variabil ity, practicing selection andutilization of selected genotypes to evolve promisingvarieties. The large spectrum genetic variability insegregating populations depends on the level ofgenetic diversity among genotypes offer better scope
for selection. Improvement in grain quality that doesnot lower yield is the need of hour at present contextin order to benefit all rice growers and consumers(Dhanwani et al., 2013). Like grain yield, its qualityis not easily amenable to selection due to its complexnature. Lack of clear cut perception regarding thecomponent traits of good quality rice is one of theimportant reasons for tardy progress in breeding forquality rice varieties. Heritability estimates alongwith genetic advance are normally more helpful inpredicting the gain under selection than heritabilityestimates alone (Ghosh and Sharma, 2012).Therefore, estimates of GCV, PCV, heritability andgenetic advance will play an important role inexploiting future research projections of riceimprovement. In the present investigation, anattempt has been made to elucidate information onnature and magnitude of genetic parameters forgrain yield and quality components in certainparents and rice hybrids.
Parmeshwar Ku. Sahu, Deepak Sharma, Pooja Sahu, Satyapal Singh, Prabha Rani Chaudhary & F. C. Sao
98 International Journal of Tropical Agriculture © Serials Publications, ISSN: 0254-8755
MATERIALS AND METHODS
The present experiment was conducted at researchfarm, Department of Genetics and Plant Breeding,Indira Gandhi Krishi Vishwavidyalaya, Raipur(Chhattisgarh.) in kharif 2012 and kharif 2013. Thematerials comprised of thirty three rice genotypes(including three CMS lines, seven testers and twentyone hybrids). The experimental material was plantedin a completely randomized block design (RCBD)with two replications in two blocks. Each blockconsisted of thirty three genotypes randomizedwithin each block. Twenty one days old seedlingswere transplanted at 20 cm apart between rows and15 cm within the row. All necessary precautions weretaken to maintain uniform plant population in eachtreatment. All the recommended package of practiceswas followed along with necessary prophylactic plantprotection measures to raise a good crop. Fiverepresentative plants for each genotype in eachreplication were randomly selected to recordobservations on the quantitative and qualitycharacters under study. The mean of five observationswere used for analysis. In order to obtain informationon the three CMS-lines, their respective maintainerlines were grown, as A-line and B-line are isogenicline except for male sterility. The data recorded onthirty three characters were subjected to the followingstatistical analysis: Analysis of variance (ANOVA)was calculated by the suggested formula of Panse andSukhatme (1967). The genotypic coefficient ofvariation (GCV) and phenotypic coefficient ofvariation (PCV) was calculated by the formula givenby Burton (1952). Heritability in broad sense (h2) wascalculated by the formula suggested by Hanson et al.(1956). From the heritability estimates, the geneticadvance (GA) was estimated by the formula givenby Johnson et al. (1955).
RESULTS AND DISCUSSION
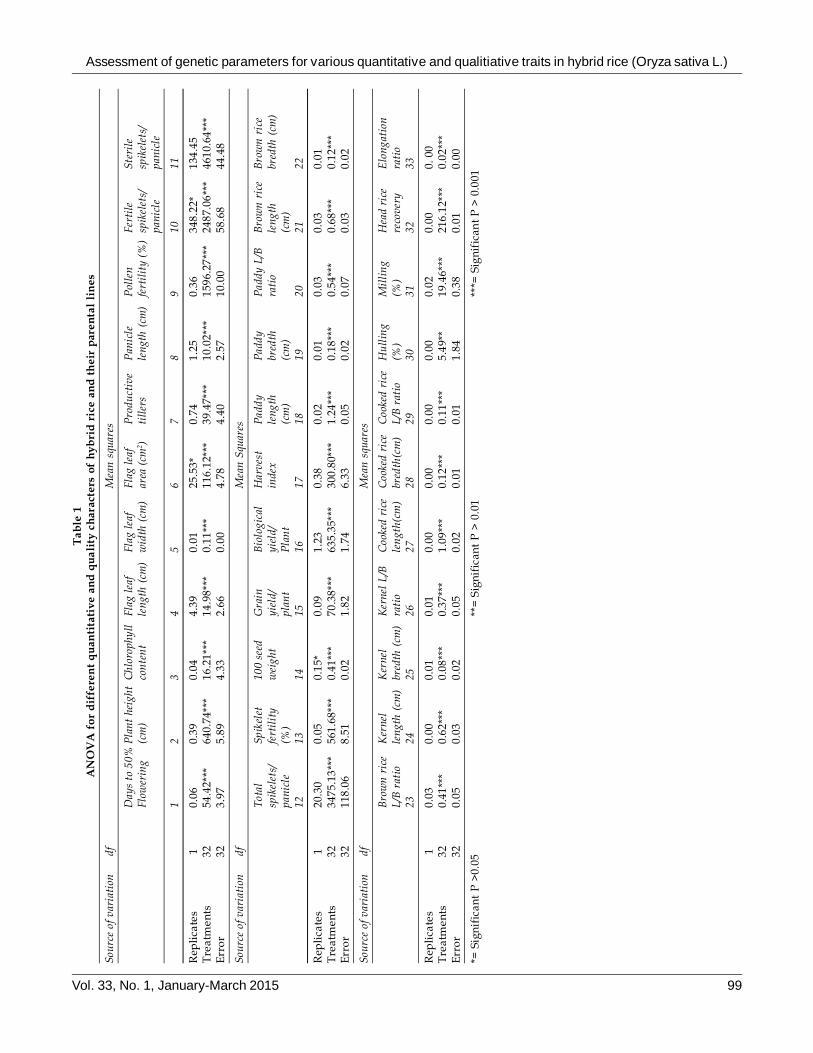
The analysis of variance indicated the highlysignificant differences among all the genotypes foralmost all the traits studied (Table 1) indicatingpresence of high variability among the genotypes.Thus, there is an ample scope for selection of differentquantitative and qualitative characters for riceimprovement (Prasad et al., 2013). A wide range ofvariation was observed in the rice genotypes for allthe quantitative and qualitative characters (Table 2).Coefficients of variation studies indicated that theestimates of PCV were slightly higher than thecorresponding GCV estimates for almost all traitsindicating that the characters were less influenced by
the environment. Therefore, selection on the basis ofphenotype alone can be effective for the improvementof these traits.
The magnitude of coefficient of variation wascategorized as high (> 20%), moderate (10- 20%) andlow (< 10%). The variation between genotypic andphenotypic coefficient of variation was less for allcharacters studied (Table 2). The slight differencebetween GCV and PCV was also reported by Prasadet al., (2013), Dhanwani et al., (2013) and Sao et al.,(2013). The highest genotypic and phenotypiccoefficient of variation were recorded for thecharacters, sterile spikelets per panicle (61.48% and62.07%), pollen fertility percent (46.13% and 46.42%),productive tillers per plant (37.40% and 41.83%),harvest index (36.62% and 37.40%), fertile spikelet perpanicle (33.91% and 34.72%), grain yield per plant(30.26% and 31.05%) and biological yield per plant(30.21% and 30.29%). The moderate genotypic andphenotypic coefficient of variation were recorded forthe characters, 100 seed weight (17.62% and 18.68%)followed by head rice recovery (17.31% and 17.31%),plant height (16.01% cm and 16.16%), Brown rice L/B ratio (12.73 % and 14.52%) and The low genotypicand phenotypic coefficient of variation was recordedfor the characters, kernel breadth (8.49% and 10.65%),kernel length (8.27% and 8.62%), cooked rice length(8.11% and 8.22%), paddy length (8.05% and 8.39%),brown rice length (7.93% and 8.27%) and elongationratio (7.91% and 8.11%). The high magnitude ofgenotypic coefficient of variation reveals the highgenetic variability present in the material studied.Similar results for high GCV and PCV in rice werealso reported by Dhanwani et al., (2013) and Sao et al.,(2013) in grain yield per plant; Panwar (2005) inspikelet fertility percent and grain yield per plant;Prasad et al., (2013) and Jayashudha and Sharma(2010) in spikelet fertility percent; and Babu et al.(2012) in fertile spikelet per panicle and sterile spikeletper panicle.
The reliability of the phenotypic value dependson the estimates of heritability for a particularcharacter. Therefore high heritability helps in theeffective selection for a particular character. Themagnitude of heritability was categorized as high(>70%), moderate (31-70%) and low (<30%). In thepresent investigation most of all the charactersexhibited high broad sense heritability (Table 2).Heritability was recorded the highest for head ricerecovery (100%), biological yield per plant (99.73%),pollen fertility percent (99.37%), plant height (99.07%),spikelet fertility percent (98.51%), harvest index
Vol. 33, No. 1, January-March 2015 99
Assessment of genetic parameters for various quantitative and qualitiative traits in hybrid rice (Oryza sativa L.)T
able
1A
NO
VA
for
dif
fere
nt
qua
nti
tati
ve a
nd q
uali
ty c
hara
cter
s of
hyb
rid
ric
e an
d t
hei
r pa
rent
al l
ines
Sour
ce o
f var
iati
ondf
Mea
n sq
uare
s
Day
s to
50%
Plan
t he
ight
Chl
orop
hyll
Flag
leaf
Flag
leaf
Flag
leaf
Prod
ucti
veP
anic
leP
olle
nFe
rtile
Ster
ileFl
ower
ing
(cm
)co
nten
tle
ngth
(cm
)w
idth
(cm
)ar
ea (
cm2 )
tille
rsle
ngth
(cm
)fe
rtili
ty (
%)
spik
elet
s/sp
ikel
ets/
pani
cle
pani
cle
12
34
56
78
910
11
Rep
licat
es1
0.06
0.39
0.04
4.39
0.01
25.5
3*0.
741.
250.
3634
8.22
*13
4.45
Tre
atm
ents
3254
.42*
**64
0.74
***
16.2
1***
14.9
8***
0.11
***
116.
12**
*39
.47*
**10
.02*
**15
96.2
7***
2487
.06*
**46
10.6
4***
Erro
r32
3.97
5.89
4.33
2.66
0.00
4.78
4.40
2.57
10.0
058
.68
44.4
8
Sour
ce o
f var
iati
ondf
Mea
n Sq
uare
s
Tota
lSp
ikel
et10
0 se
edG
rain
Biol
ogic
alH
arve
stPa
ddy
Padd
yPa
ddy
L/B
Brow
n ri
ceBr
own
rice
spik
elet
s/fe
rtili
tyw
eigh
tyi
eld/
yiel
d/in
dex
leng
thbr
edth
rati
ole
ngth
bred
th (
cm)
pani
cle
(%)
plan
tPl
ant
(cm
)(c
m)
(cm
)12
1314
1516
1718
1920
2122
Rep
licat
es1
20.3
00.
050.
15*
0.09
1.23
0.38
0.02
0.01
0.03
0.03
0.01
Tre
atm
ents
3234
75.1
3***
561.
68**
*0.
41**
*70
.38*
**63
5.35
***
300.
80**
*1.
24**
*0.
18**
*0.
54**
*0.
68**
*0.
12**
*Er
ror
3211
8.06
8.51
0.02
1.82
1.74
6.33
0.05
0.02
0.07
0.03
0.02
Sour
ce o
f var
iati
ondf
Mea
n sq
uare
s
Brow
n ri
ceK
erne
lK
erne
lK
erne
l L/B
Coo
ked
rice
Coo
ked
rice
Coo
ked
rice
Hul
ling
Mil
ling
Hea
d ri
ceE
long
atio
nL/
B ra
tio
leng
th (
cm)
bred
th (
cm)
rati
ole
ngth
(cm
)br
edth
(cm
)L/
B ra
tio
(%)
(%)
reco
very
rati
o23
2425
2627
2829
3031
3233
Rep
licat
es1
0.03
0.00
0.01
0.01
0.00
0.00
0.00
0.00
0.02
0.00
0. 0
0T
reat
men
ts32
0.41
***
0.62
***
0.08
***
0.37
***
1.09
***
0.12
***
0.11
***
5.49
**19
.46*
**21
6.12
***
0.02
***
Erro
r32
0.05
0.03
0.02
0.05
0.02
0.01
0.01
1.84
0.38
0.01
0.00
*= S
igni
fica
nt P
>0.
05**
= Si
gnif
ican
t P
> 0
.01
***=
Sig
nifi
cant
P >
0.0
01
Parmeshwar Ku. Sahu, Deepak Sharma, Pooja Sahu, Satyapal Singh, Prabha Rani Chaudhary & F. C. Sao
100 International Journal of Tropical Agriculture © Serials Publications, ISSN: 0254-8755
(97.91%), milling percent (97.85%), fertile spikelets perpanicle (97.66%), elongation ratio (97.53%), grain yieldper plant (97.45%), total spikelet per panicle (96.67%),flag leaf area (95.97%), paddy length (95.95%), kernellength (95.93%), brown rice length (95.88%). Highheritability values indicate that the characters understudy are less influenced by environment in theirexpression. The plant breeder, therefore adopt simpleselection method on the basis of the phenotype of thecharacters which ultimately improves the geneticbackground of these traits. Similar results were alsoquoted by Jayashudha and Sharma (2010), Babu et al.(2012), Ghosh and Sharma, (2012), Dhanwani et al.,(2013), Sao et al., (2013) and Karuppaiyan et al., (2013).
The estimates of genetic advance as per cent ofmean provide more reliable information regarding theeffectiveness of selection in improving the traits.Genetic advance denotes the improvement in thegenotypic value of the new population over the
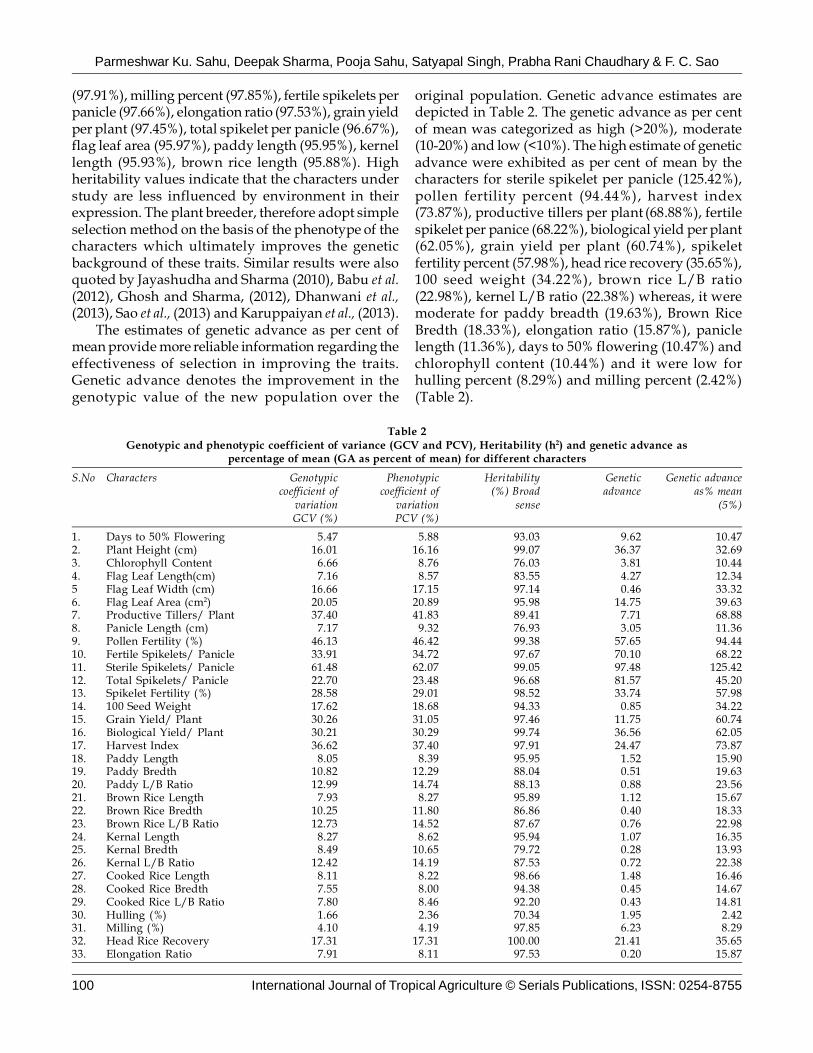
original population. Genetic advance estimates aredepicted in Table 2. The genetic advance as per centof mean was categorized as high (>20%), moderate(10-20%) and low (<10%). The high estimate of geneticadvance were exhibited as per cent of mean by thecharacters for sterile spikelet per panicle (125.42%),pollen fertility percent (94.44%), harvest index(73.87%), productive tillers per plant (68.88%), fertilespikelet per panice (68.22%), biological yield per plant(62.05%), grain yield per plant (60.74%), spikeletfertility percent (57.98%), head rice recovery (35.65%),100 seed weight (34.22%), brown rice L/B ratio(22.98%), kernel L/B ratio (22.38%) whereas, it weremoderate for paddy breadth (19.63%), Brown RiceBredth (18.33%), elongation ratio (15.87%), paniclelength (11.36%), days to 50% flowering (10.47%) andchlorophyll content (10.44%) and it were low forhulling percent (8.29%) and milling percent (2.42%)(Table 2).
Table 2Genotypic and phenotypic coefficient of variance (GCV and PCV), Heritability (h2) and genetic advance as
percentage of mean (GA as percent of mean) for different characters
S.No Characters Genotypic Phenotypic Heritability Genetic Genetic advancecoefficient of coefficient of (%) Broad advance as% mean
variation variation sense (5%)GCV (%) PCV (%)
1. Days to 50% Flowering 5.47 5.88 93.03 9.62 10.472. Plant Height (cm) 16.01 16.16 99.07 36.37 32.693. Chlorophyll Content 6.66 8.76 76.03 3.81 10.444. Flag Leaf Length(cm) 7.16 8.57 83.55 4.27 12.345 Flag Leaf Width (cm) 16.66 17.15 97.14 0.46 33.326. Flag Leaf Area (cm2) 20.05 20.89 95.98 14.75 39.637. Productive Tillers/ Plant 37.40 41.83 89.41 7.71 68.888. Panicle Length (cm) 7.17 9.32 76.93 3.05 11.369. Pollen Fertility (%) 46.13 46.42 99.38 57.65 94.4410. Fertile Spikelets/ Panicle 33.91 34.72 97.67 70.10 68.2211. Sterile Spikelets/ Panicle 61.48 62.07 99.05 97.48 125.4212. Total Spikelets/ Panicle 22.70 23.48 96.68 81.57 45.2013. Spikelet Fertility (%) 28.58 29.01 98.52 33.74 57.9814. 100 Seed Weight 17.62 18.68 94.33 0.85 34.2215. Grain Yield/ Plant 30.26 31.05 97.46 11.75 60.7416. Biological Yield/ Plant 30.21 30.29 99.74 36.56 62.0517. Harvest Index 36.62 37.40 97.91 24.47 73.8718. Paddy Length 8.05 8.39 95.95 1.52 15.9019. Paddy Bredth 10.82 12.29 88.04 0.51 19.6320. Paddy L/B Ratio 12.99 14.74 88.13 0.88 23.5621. Brown Rice Length 7.93 8.27 95.89 1.12 15.6722. Brown Rice Bredth 10.25 11.80 86.86 0.40 18.3323. Brown Rice L/B Ratio 12.73 14.52 87.67 0.76 22.9824. Kernal Length 8.27 8.62 95.94 1.07 16.3525. Kernal Bredth 8.49 10.65 79.72 0.28 13.9326. Kernal L/B Ratio 12.42 14.19 87.53 0.72 22.3827. Cooked Rice Length 8.11 8.22 98.66 1.48 16.4628. Cooked Rice Bredth 7.55 8.00 94.38 0.45 14.6729. Cooked Rice L/B Ratio 7.80 8.46 92.20 0.43 14.8130. Hulling (%) 1.66 2.36 70.34 1.95 2.4231. Milling (%) 4.10 4.19 97.85 6.23 8.2932. Head Rice Recovery 17.31 17.31 100.00 21.41 35.6533. Elongation Ratio 7.91 8.11 97.53 0.20 15.87
Vol. 33, No. 1, January-March 2015 101
Assessment of genetic parameters for various quantitative and qualitiative traits in hybrid rice (Oryza sativa L.)
The estimates of genetic advance as per cent ofmean provide more reliable information regarding theeffectiveness of selection in improving the traits.Genetic advance denotes the improvement in thegenotypic value of the new population over theoriginal population. The high heritability along withhigh genetic advance were registered as per cent ofmean for pollen fertility percent, fertile spikelet perpanicle, sterile spikelet per panicle, total spikelet perpanicle, biological yield per plant, plant height,spikelet fertility percent, harvest index, head ricerecovery, flag leaf are, grain yield per plant, days to50% flowering, productive tillers per, 100 seed weight,brown rice L/B ratio and kernal L/B ratio. Thecharacters that show high heritability coupled withhigh genetic advance are controlled by additive geneaction (Panse, 1957) and can be improved throughsimple or progeny selection methods while thecharacters which showed high heritability coupledwith moderate or low genetic advance can beimproved by intermitting superior genotypes ofsegregating population developed from combinationbreeding (Samadhia, 2005). Similar findings were alsosupported by Jayashudha and Sharma (2010),
Subbaiha et al. (2011) Seyoum et al. (2012), Ghoshand Sharma, (2012), Babu et al. (2012), Dhanwani etal., (2013), Sao et al., (2013) and Karuppaiyan et al.,(2013).
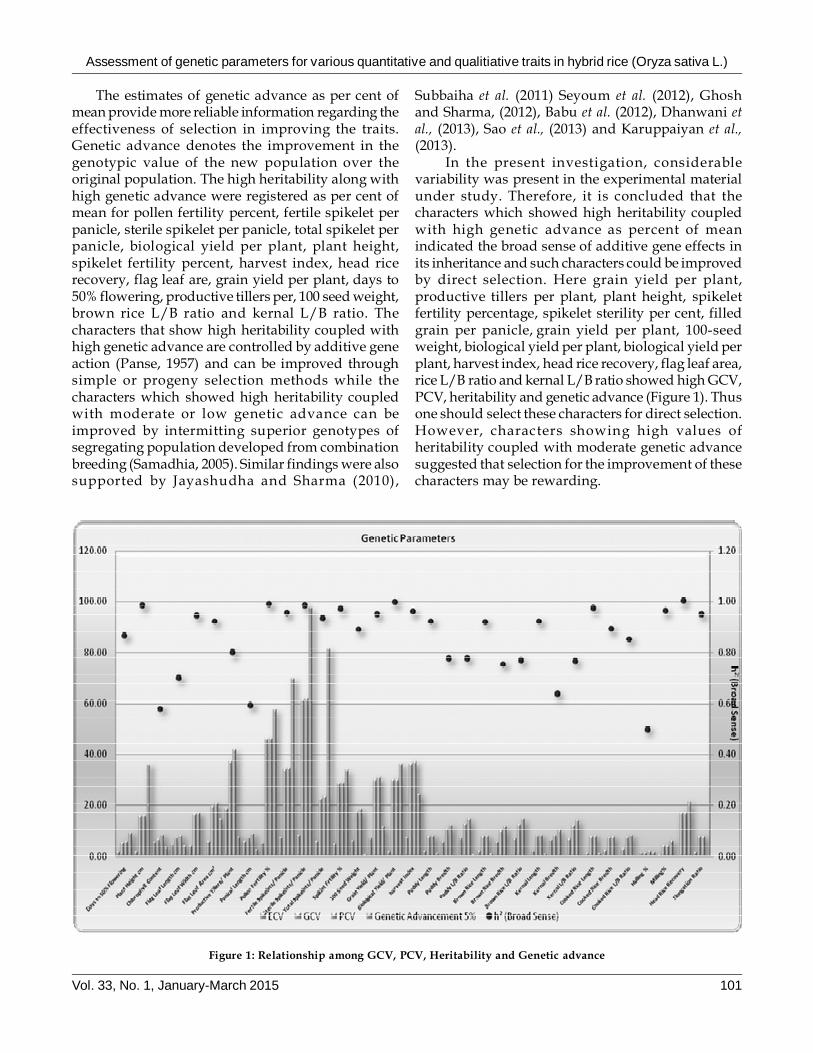
In the present investigation, considerablevariability was present in the experimental materialunder study. Therefore, it is concluded that thecharacters which showed high heritability coupledwith high genetic advance as percent of meanindicated the broad sense of additive gene effects inits inheritance and such characters could be improvedby direct selection. Here grain yield per plant,productive tillers per plant, plant height, spikeletfertility percentage, spikelet sterility per cent, filledgrain per panicle, grain yield per plant, 100-seedweight, biological yield per plant, biological yield perplant, harvest index, head rice recovery, flag leaf area,rice L/B ratio and kernal L/B ratio showed high GCV,PCV, heritability and genetic advance (Figure 1). Thusone should select these characters for direct selection.However, characters showing high values ofheritability coupled with moderate genetic advancesuggested that selection for the improvement of thesecharacters may be rewarding.
Figure 1: Relationship among GCV, PCV, Heritability and Genetic advance
Parmeshwar Ku. Sahu, Deepak Sharma, Pooja Sahu, Satyapal Singh, Prabha Rani Chaudhary & F. C. Sao
102 International Journal of Tropical Agriculture © Serials Publications, ISSN: 0254-8755
REFERENCES
Babu, V.R., Shreya, K., Dangi, K.S., Usharani, G. andNagesh, P. (2012), Genetic Variability Studies forQualitative and Quantitative traits in popular Rice(Oryza sativa L.) hybrids of India. International Journalof Scientific and Research Publications 2: 2250-3153.
Burton, G.W. and Devane, E.H. (1952), Estimatingheritability in tall fescue (Festuca arundinaceae) fromreplicated clonal material. Agronomy Journal 45: 478-481.
Dhanwani, R.K., Sarawagi, A.K., Solanki, A. and Tiwari,J.K. (2013), Genetic variability analysis for various yieldattributing and quality traits in rice (O. sativa L.). Thebioscan, 8(4): 1403-1407.
Hanson, W.D., Robinson, H.F. and Comstock, R.E. (1956),Biometrical studies of yield in segregating populationKorean Lespandeza. Agronomy Journal 48: 268-272.
Jayashudha, S. and Sharma, D. (2010), Identification ofmaintainers and restorers for CMS lines of rice undershallow low lands. Electronic Journal of Plant Breeding,1: 311-314.
Johnson, H.W., Robinson, H.F. and Comstock, R.E. (1955),Estimation of genetic and environmental variability insoybean. Agronomy Journal 47: 314-318.
Karuppaiyan, R., Kapoor, C. and Gopi, R. (2013), Variability,heritability and genetic divergence in lowland ricegenotypes under the mid-hills of Sikkim. Oryza, 50 (1)81-84.
Paikhomba, N., Kumar, A., Chaurasia, A.K. and Rai, P.K.(2014), Assessment of Genetic Parameters for Yield andYield Components in Hybrid Rice and Parents. Journalof Rice Research, 2: 117.
Panse, V.G. (1957), Genetics of quantitative characters inrelation to plant breeding. Indian Journal of Genetics, 17:318-328.
Panse, V.G., Sukhatme, P.V. (1967), Statistical methods foragricultural workers (2nd Ed) ICAR publications, NewDelhi, India.
Panwar, L.L. (2005), Line x Tester analysis of combiningability in rice. Indian Journal of Genetics 65: 51-52.
Samadhia, D. K. (2005), Genetic variability studies in Lasora(Cordia myxa Roxb.). Indian J. Plant Genetic Resources.18(3): 236-240.
Seyoum, M., Sentayehu, A. and Kassahum, B. (2012),Genetic variability, heritability, correlation coefficientand path analysis for yield and yield related traits inupland rice. J. Plant Sciences. 7(1): 1320.
Shiva Prasad, G., Sujatha, M., Subba Rao, L.V. andChaithanya U. 2013. Studies on variability, heritabilityand genetic advance for quantitative characters in Rice(Oryza sativa L.). Annals of Biological Research, 4 (6):372-375.
Ghosh S. C. and Sharma, Deepak. (2012), Geneticparameters of agro-morpho-physiological traits in rice(Oryza sativa L.). Electronic Journal of Plant Breeding,3(1): 711-714.