Embed Size (px)
Citation preview

HAL Id: hal-03214864https://hal.archives-ouvertes.fr/hal-03214864
Submitted on 3 May 2021
HAL is a multi-disciplinary open accessarchive for the deposit and dissemination of sci-entific research documents, whether they are pub-lished or not. The documents may come fromteaching and research institutions in France orabroad, or from public or private research centers.
L’archive ouverte pluridisciplinaire HAL, estdestinée au dépôt et à la diffusion de documentsscientifiques de niveau recherche, publiés ou non,émanant des établissements d’enseignement et derecherche français ou étrangers, des laboratoirespublics ou privés.
Estimates of genetic parameters for production,behaviour, and health traits in two Swiss honey bee
populationsMatthieu Guichard, Markus Neuditschko, Gabriele Soland, Padruot Fried,
Mélanie Grandjean, Sarah Gerster, Benjamin Dainat, Piter Bijma, Evert W.Brascamp
To cite this version:Matthieu Guichard, Markus Neuditschko, Gabriele Soland, Padruot Fried, Mélanie Grandjean, et al..Estimates of genetic parameters for production, behaviour, and health traits in two Swiss honey beepopulations. Apidologie, 2020, 51 (5), pp.876-891. �10.1007/s13592-020-00768-z�. �hal-03214864�
Estimates of genetic parameters for production, behaviour,and health traits in two Swiss honey bee populations
Matthieu GUICHARD1, Markus NEUDITSCHKO
1, Gabriele SOLAND2, Padruot FRIED2,
Mélanie GRANDJEAN3, Sarah GERSTER
3, Benjamin DAINAT
1, Piter BIJMA
4,
Evert W. BRASCAMP4
1Agroscope, Swiss Bee Research Centre, Schwarzenburgstrasse 161, 3003, Bern, Switzerland2mellifera.ch association, Ahornstrasse 7, 9533, Kirchberg, Switzerland
3Société Romande d’Apiculture par sa commission d’élevage, Rte de la Vignettaz 41, 1700, Fribourg, Switzerland4Wageningen University & Research Animal Breeding and Genomics, PO Box 338, 6700 AH, Wageningen,
The Netherlands
Received 3 June 2019 – Revised 13 January 2020 – Accepted 30 March 2020
Abstract – Successful honey bee breeding programmes require traits that can be genetically improved by selection.Heritabilities for production, behaviour, and health traits, as well as their phenotypic correlations, were estimated intwo distinct Swiss Apis mellifera mellifera and Apis mellifera carnica populations based on 9 years of performancerecords and more than two decades of pedigree information. Breeding values were estimated by a best linearunbiased prediction (BLUP) approach, taking either queen or worker effects into account. In A. m. mellifera , thehighest heritabilities were obtained for defensive behaviour, calmness during inspection, and hygienic behaviour,while in A. m. carnica , honey yield and hygienic behaviour were the most heritable traits. In contrast, estimates forinfestation rates by Varroa destructor suggest that the phenotypic variation cannot be attributed to an additivegenetic origin in either population. The highest phenotypic correlations were determined between defensivebehaviour and calmness during inspection. The implications of these findings for testing methods and themanagement of the breeding programme are discussed.
Apismellifera / genetic parameter / heritability / phenotypic correlation /Varroa destructor
1. INTRODUCTION
In Switzerland, beekeepers from the associa-tions mellifera.ch (MEL), breeding Apis melliferamellifera , and Société Romande d’Apiculture(SAR), rearing Apis mellifera carnica , maintaintwo breeding programmes operating independent-ly, but they share a common interest in improvingthe production, behaviour, and health traits of
honey bees. Their aim is to provide beekeeperswith genetic material corresponding to their re-spective population standards and with good ca-pabilities for beekeeping in local environmentalconditions. The selection is subsidised by govern-ment funding to support local breedingprogrammes.
Both breeding programmes maintain matingstations in distinct Alpine valleys, which en-ables controlled mating of the queens with se-lected drones of the respective honey bee pop-ulation (Plate et al. 2019). Since 2010, selectionin each population occurs after evaluation ofabout 100 to 180 queens per year by qualifiedbeekeepers in networks of test apiaries
Corresponding author: M. Guichard,[email protected] editor: David Tarpy
* The Author(s), 2020.This article is an open access publicationDOI: 10.1007/s13592-020-00768-z
Apidologie (2020) 51:876–891 Original article
throughout Switzerland following standardisedtesting procedures, corresponding or beinghighly similar to other protocols presented inliterature (Büchler et al. 2013; Ehrhardt et al.2010). At the test apiaries, the following traitsare routinely recorded: honey yield, defensivebehaviour, calmness during inspection,swarming drive, hygienic behaviour towardspin-killed brood, and infestation by the parasit-ic mite Varroa destructor , while MEL bee-keepers additionally assess the size of eachhoney bee colony. After an initial treatment toequalize infestation between colonies at a verylow level, no treatments against V. destructorare performed when testing the colonies thefollowing season.
To ascertain the quality of both breedingprogrammes, genetic parameters for the aforemen-tioned traits were estimated using a best linearunbiased prediction (BLUP) approach. Recently,a similar analysis was performed including pheno-typic records from ~ 15,000AustrianA. m. carnicacolonies (Brascamp et al. 2016). The estimation ofgenetic parameters is strongly dependent on datasize and structure; therefore, it was uncertain if thesame approach (Brascamp and Bijma 2014) couldbe applied on our smaller datasets (~ 1000 coloniesper population). In the study of Brascamp et al.(2016), it was demonstrated that genetic effects ofqueen and worker, both contributing to colonyperformance, can be jointly estimated. Under thiscondition, it became feasible to sum up the estimat-ed breeding values (EBVs) for queen and workereffect and use this sum as selection criterion. Insmaller datasets, it is more likely that the maximumlikelihood algorithm may not converge when ajoint estimation is performed, thus requiring esti-mation of either worker or queen effects. Such asituation was described for a recent honey beeselection programme including 151 colonies(Facchini et al. 2019).
The aim of this study was to calculate EBVs,heritability estimates, and phenotypic correlationsfor the different traits recorded by MEL and SARbeekeepers. Furthermore, we also validated theresults of the applied statistical models. The re-sults presented in this study will allow Swissbeekeepers to optimise their breeding programmeand selection strategies.
2. MATERIAL AND METHODS
2.1. Structure of the applied breedingprogrammes
In the MEL breeding programme, groups of 12sister queens are mated on mating stations duringsummer with drones from drone-producing colo-nies headed by sisters. All queens are blindlyevaluated the following year in a network of test-ing apiaries. Based on this evaluation, queens areselected in their third year for grafting to producedaughter queens (female side). The selection ofqueens for production of queens heading drone-producing colonies (male side) additionally oc-curs across the programme according to testresults.
In the SAR breeding programme, experiencedbeekeepers are responsible for the maintenance oftheir own maternal lines. For this purpose, on thefemale side, colonies are empirically selected eachyear for the production of the next generation bygrafting. Following the same strategy as in MEL,groups of 12 full-sister queens are produced anddistributed to different test apiaries, where they areblindly tested to select queens for the male side.Contrary to the MEL programme, only some ofthe best queens may occasionally be used for thefemale side for queen rearing; however, this isuncommon and therefore phenotypic informationis used intensively on the male and hardly on thefemale side.
2.2. Datasets
In 2019, the MEL and SAR honey bee breed-ing associations provided the recorded pheno-types (2009–2018) and ancestry information toestimate heritabilities and EBVs for the differenttraits (honey yield, defensive behaviour, calmnessduring inspection, swarming drive, hygienic be-haviour towards pin-killed brood, and infestationo f V. de s t ruc to r ) . The da t aba se wascomplemented each year, corresponding to thecolonies evaluated during the preceding beekeep-ing season (the number of queens tested by bee-keepers determines the additional amount of in-formation available each year).
877Estimates of genetic parameters for production…

In each dataset, the unique identification num-ber (ID) of the queen was used to identify therespective colonies. Here, we refer to a colony asa group of sister workers originating from thesame queen. The ID of the queen heading thecolony (dam of the workers), of her mother, andof the mother of the drone-producing colonies(sire) that were used to mate the queen of thecolony generally was known. Based upon thisancestry information, two pedigree files (MELand SAR) were generated. For the majority ofthe colonies included in the pedigree files, infor-mation for most of the evaluated traits and theidentification of the testing apiary were available.At each testing apiary, beekeepers report the dateand the person who evaluated the colonies. Theseputative effects (year, tester, and location) on theevaluation of honey bees were confounded, as thequality of all colonies is simultaneously assessedduring the season. The phenotypic records andinformation of the apiary (year, tester, and loca-tion) were included in the respective performancefiles.
2.3. Data preparation
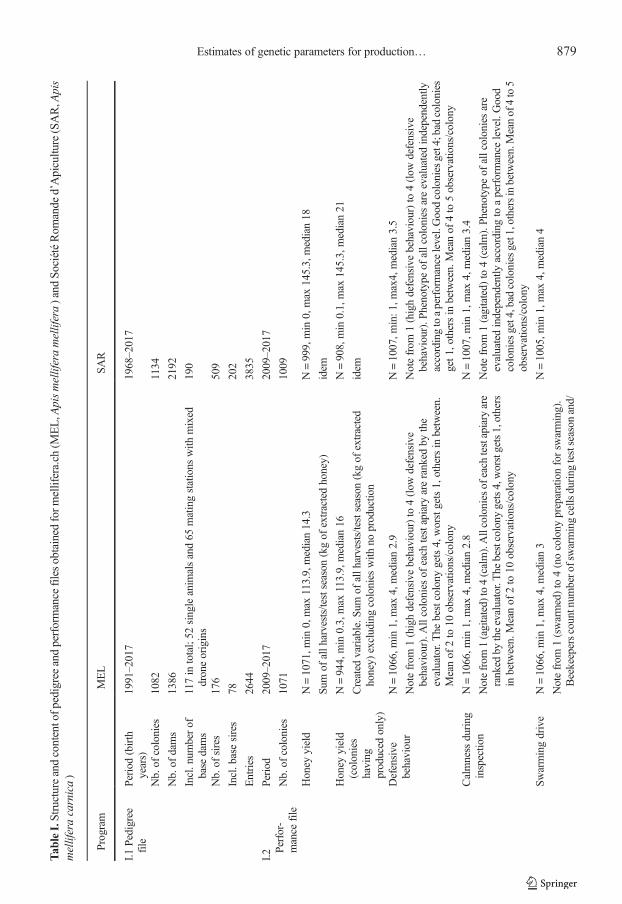
In the pedigree files (Table I), IDs of the damsand sires were entered for each colony. The num-ber of drone-producing colonies was also indicat-ed. A base queen or sire was added to the pedigreefile in case one of the parents was unknown. Ifqueens were mated in the same place with anunknown sire (often a group of unrelated drone-producing colonies), the latter was encoded as acommon sire without known parents. This situa-tion was repeatedly observed in the MEL popula-tion and resulted in the addition of many virtualbase animals. In the pedigree file, the number ofentries corresponds to the total number of colo-nies, dams, and sires. The rows in these filescontain all colonies, dams, and sires, along withthe identities of their own dams and sires.
Before the beginning of the records analysedhere, queens were already mated at mating sta-tions in a way similar to the years included in thedataset. It was therefore considered that the addi-tive genetic relationship between drone-producingcolonies had reached an equilibrium. For each
mating, the number of drones involved was as-sumed to follow a Poisson distribution andwas setto 12 (Brascamp et al. 2016). The inverse of thepedigree relationship matrix between all entries inthe pedigree was calculated following Brascampand Bijma (2014).
In the performance files (Table I), to facilitateinterpretation of the results, phenotypic values foreach trait were entered without transformation,even for not normally distributed traits. Honeyyield was analysed as raw data, but also excludingcolonies that did not produce any honey, in orderto know if absence of production is mainly due todetrimental environmental conditions, or to poorgenetic value of the colony. Two ratios were cal-culated from phenotypic data: the growth rate ofV. destructor infestation between spring and sum-mer (Ehrhardt and Bienefeld 2007), and the colo-ny size growth rate, expressed as the ratio ofcolony size in summer to colony size in spring.Identification of the testing apiary was also addedto the file by combining the geographic locationand the testing year.
2.4. Models
Estimated breeding values for all traits werecalculated with the ASReml software version4.1.2132 (www.vsni.co.uk), using the aforemen-tioned performance files and the inverses of thepedigree relationship matrices.
In a first trial, a model was used to jointlyestimate both worker and queen effects, alongwith the fixed apiary-year effect and an overallmean. In both datasets, due to the data size orstructure, the restricted maximum likelihood algo-rithm did not converge. Thus, worker and queeneffects were evaluated separately. Therefore, themodels were defined to include either the colonyor the queen for the purpose of estimating theworker and queen effects separately. In the modelincluding the colony, we accounted for the factthat the workers are a group of individuals, ratherthan a single individual, by calculating the rela-tionship matrix following the approach ofBrascamp and Bijma (2014).
For each dataset, two linear models on singletraits were finally used, the first on worker effects(WM) and the second on queen effects (QM) as
878 M. Guichard et al.
Tab
leI.Structureandcontentofp
edigreeandperformance
filesobtained
form
ellifera.ch
(MEL,A
pismelliferamellifera)and
SociétéRom
ande
d’Apicultu
re(SAR,A
pis
melliferacarnica)
Program
MEL
SAR
I.1Pedigree
file
Period(birth
years)
1991–2017
1968–2017
Nb.of
colonies
1082
1134
Nb.of
dams
1386
2192
Incl.num
berof
base
dams
117in
total;52
singleanim
alsand65
matingstations
with
mixed
droneorigins
190
Nb.of
sires
176
509
Incl.basesires
78202
Entries
2644
3835
I.2 Pe
rfor-
mance
file
Period
2009–2017
2009–2017
Nb.of
colonies
1071
1009
Honey
yield
N=1071,m
in0,max
113.9,median14.3
N=999,min
0,max
145.3,median18
Sum
ofallh
arvests/testseason
(kgof
extractedhoney)
idem
Honey
yield
(colonies
having
produced
only)
N=944,min
0.3,max
113.9,median16
N=908,min
0.1,max
145.3,median21
Created
variable.S
umof
allh
arvests/testseason
(kgof
extracted
honey)
excludingcolonies
with
noproductio
nidem
Defensive
behaviour
N=1066,m
in1,max
4,median2.9
N=1007,m
in:1
,max4,median3.5
Notefrom
1(highdefensivebehaviour)to
4(low
defensive
behaviour).A
llcolonies
ofeach
testapiary
areranked
bythe
evaluator.The
bestcolony
gets4,worstgets1,othersin
between.
Meanof
2to
10observations/colony
Notefrom
1(highdefensivebehaviour)to
4(low
defensive
behaviour).P
henotype
ofallcoloniesareevaluatedindependently
accordingtoaperformance
level.Goodcoloniesget4;bad
colonies
get1
,othersin
between.Meanof
4to
5observations/colony
Calmness
during
inspectio
nN=1066,m
in1,max
4,median2.8
N=1007,m
in1,max
4,median3.4
Notefrom
1(agitated)
to4(calm).Allcolonies
ofeach
testapiary
are
ranked
bytheevaluator.The
bestcolony
gets4,worstgets1,others
inbetween.Meanof
2to
10observations/colony
Notefrom
1(agitated)
to4(calm).Phenotype
ofallcoloniesare
evaluatedindependently
accordingto
aperformance
level.Good
colonies
get4,bad
colonies
get1,othersinbetween.Meanof
4to5
observations/colony
Swarmingdrive
N=1066,m
in1,max
4,median3
N=1005,m
in1,max
4,median4
Notefrom
1(swarmed)to
4(nocolony
preparationforsw
arming).
Beekeeperscountnum
bero
fswarmingcells
during
testseason
and/
879Estimates of genetic parameters for production…

Tab
leI
(contin
ued)
Program
MEL
SAR
orreportactio
nsperformed
topreventswarming.Coordinatorgives
anem
piricaln
otefrom
1to
4taking
colony
size
anddevelopm
ent
into
account(bigcolony
having
produced
honeybutw
antin
gto
swarm
getsbetternotethan
smallcolonywith
noproductio
nin
samesituation).
Notefrom
1(swarmed)to
4(nocolony
preparationforsw
arming).
Beekeepersgive
repeated
notes(between2to
and5repetitions)
during
testseason.L
owestn
oteisretained.
V.destructor
infestationin
spring
N=1017,m
in0,max
14.2,m
edian0.2
N=948,min
0,max
4.5,median0.1
Sum
ofnaturally
dead
mitesrecorded
onbotto
mboards
for3weeks
during
Salix
sp.blossom
,expressed
asmeannumberoffallenmites
percolony
perday
idem
V.destructor
infestationin
summer
N=975,min
0,max
17.7,m
edian0.6
N=927,min
0,max
18.9,m
edian0.3
Num
berof
adultfem
aleV.destructor
mitespresentinahoneybee
sampletakenfrom
thehoneysuperor
lateralh
oney
fram
esin
the
broodcham
ber.Expressed
inmites/10
ghoneybees.
idem
V.destructor
infestation
grow
thrate
N=959,min
0.24,m
ax2.2,median1.1
N=927,min
0.6,max
2.1,median1.1
Created
variable.G
rowth
rate(G
R)as
combinatio
nof
spring
and
summer
infestations:
GR¼
log
1þ10:1
þmitessummer=10gbees
1þmitesspring
=day
��
idem
Hygienic
behaviour
N=972,min
0,max
13.2,m
edian3.5
N=929,min
0,max
100,median54
Rem
ovalof
pin-killedbrood(50killedpupae,purpleeyestage),
numberof
emptiedcells
andduratio
nbetweenpiercing
andresults
(±8h)
indicated.Durationischosen
inorderto
ideally
have
nocolony
with
0or
100%
ofem
ptiedcells.E
xpressed
asnumberof
cells
completelyem
ptiedperhour.M
eanof
twotests.
Rem
ovalof
pin-killedbrood(50killedpupae,purpleeyestage),
numberof
emptiedcells
indicated.Exposureduratio
nischosen
inordertoideally
have
nocolony
with
0or
100%
ofem
ptiedcells
but
isnotreported.Expressed
aspercentage
ofcleanedcells.M
eanof
twotests.
Colonysize
inspring
N=960,min
0.2,max
24,m
edian6.5
Not
documented
Num
berof
fram
escoveredby
honeybees
Colonysize
atlastharvest
N=782,min
1.5,max
68,m
edian14.5
Not
documented
Num
berof
fram
escoveredby
honeybees
Colonysize
grow
thrate
N=776,min
0.2,max
30,m
edian2.3
Not
available
Created
variable.R
atio
colony
size
insummer/colonysize
inspring
880 M. Guichard et al.

random effects. The complete models are present-ed below:
& P ij = μ +Apiaryi + colonyj + e ij (WM)& P ij = μ +Apiaryi + queenj + e ij (QM)
where P ij is the phenotype associated with theworker or queen of apiary i and colony j ; μ isthe general mean of the population for thisphenotype; Apiaryi is the fixed effect of thetesting environment (date, location, and evalu-ator were confounded as all colonies per testapiary were evaluated each time); colonyj isthe random effect associated with one workerof colony j ; queenj is the random effect asso-ciated with the queen heading colony j ; and e ij
is the residual associated with the measure-ment. We refer to the models as WM (workermodel) and QM (queen model), as they areused to estimate variance components forworker effect and queen effect, respectively.
2.5. Heritability estimates
With the two models (WM and QM), it waspossible to derive three heritability estimates. Be-cause the colony consists of a group of workers,the WM yields two heritabilities (Brascamp andBijma 2019). First, a heritability relating to theworker effect of a single individual,
h2W ¼ var colonyð Þ=var Pð Þ, which is a mea-sure for the scope of selection. In this expres-sion, var (colony) is the estimate of the colo-ny variance as produced by ASReml whenusing the relationship matrix according toBrascamp and Bijma (2014). Second, a heri-tability relating to a group of workers,h2W ¼ 0:4 var colonyð Þ=var Pð Þ, which reflects
the part of the phenotypic variance due to thecolony effect. The 0.4 is the additive genetic rela-tionship between drone-producing queens in a sirein the base generation, assuming an equilibrium(Brascamp and Bijma 2019). The QMprovided an
estimate of the heritability for the queen effect h2Q.Genetic correlations between worker and queeneffects could not be calculated, as the estimates forworker and queen effects were estimated in twoseparate models.
2.6. Validation of the model
For the models WM and QM, the quality of theEBVs was evaluated by comparing the predictedphenotypes for workers or queens (usingWM andQM, respectively) with their realised phenotypes.This approach is known as cross-validation, and isa common strategy for validation of EBVs inlivestock (e.g. Luan et al. 2009). Prediction in-volves the estimation of the EBVs for workers orqueens by excluding their own phenotypes and istherefore based solely on the information of rela-tives. In practice, we randomly divided the perfor-mance file into 10 equally sized subsets. Then, wedid 10 analysis to estimated EBVs, in each anal-ysis masking records of one of the subsets. Indi-viduals in the masked subset, however, did receiveEBVs because of pedigree relationships with theindividuals in the remaining 90% of the data.These EBVs served as predicted phenotypes.Realised phenotypes for the masked individualsequalled the observation as a deviation from thecorresponding fixed-effect estimate. For bothWM and QM, we compared the predicted pheno-types and their realisation through the regressionof the latter on the former. Theoretically, this valueequals unity, and the estimated regression coeffi-cient provides insight into whether the modelsproduce unbiased EBVs. We also compared theaccuracy of WM and QM to produce unbiasedEBVs by considering the standard errors of theregression coefficients in order to distinguishwhich model should potentially be favoured, ifsome differences were noted.
2.7. Phenotypic correlations
Due to the small datasets, it was not possible tocompute genotypic correlations with sufficientlysmall standard errors. In such a situation, pheno-typic correlations were preferred for evaluatingthe relationships among traits in the respectivepopulations. The measured values were correctedfor the test apiary effect obtained from WM, andall pairwise correlations for each population werecalculated with Pearson’s product-moment meth-od using the cor.test function in R (R-Core-Team2018). Standard errors (SEr ) associated to thecorrelation estimates (r ) were obtained as follows:
881Estimates of genetic parameters for production…

Tab
leII.E
stim
ated
variance
components(Var),heritabilities(h
2)forworker(h
2 W),colony
(h2 W),or
queen(h
2 Q)effectsandassociated
standard
errors(betweenbrackets)for
measuredphenotypes
andcalculated
ratio
sfrom
MELandSA
Rdatasets.n.d.indicates
thatno
variance
attributed
toeither
workeror
queeneffectswas
detected
bythemodels
II.1MEL
Honey
yield
Honey
yield
(colonies
having
produced
only)
Defensive
behaviour
Calmness
during
inspectio
n
Swarming
drive
V.destructor
infestation
inspring
V.destruct-
or infesta-
tion
in summer
V.destruct-
or infesta-
tion
grow
thrate
Hygienic
behaviour
Colony
size
(spring)
Colony
size
(last
harvest)
Colony
size
grow
thrate
Workermodel
Var
(worker)
5.02
(8.36)
n.d.
0.32
(0.09)
0.12
(0.05)
0.11
(0.09)
0.03
(0.06)
n.d.
n.d.
1.07
(0.46)
n.d.
n.d.
0.16
(0.26)
Var
(colony)
2.01
(3.34)
0.13
(0.04)
0.05
(0.02)
0.05
(0.03)
0.01
(0.02)
0.43
(0.18)
0.06
(0.10)
Var
(residual)
88.1(4.78)
0.25
(0.02)
0.25
(0.02)
0.66
(0.04)
0.78
(0.04)
1.86
(0.14)
2.71
(0.17)
Var
(phenotype)
90.1(4.24)
0.37
(0.02)
0.30
(0.01)
0.70
(0.03)
0.80
(0.04)
2.28
(0.13)
2.77
(0.15)
h2 W0.06
(0.09)
0.85
(0.21)
0.39
(0.17)
0.16
(0.12)
0.04
(0.07)
0.47
(0.19)
0.06
(0.09)
h2 W0.02
(0.04)
0.34
(0.09)
0.16
(0.07)
0.06
(0.05)
0.02
(0.03)
0.19
(0.07)
0.02
(0.04)
Queen
model
Var
(queen)
8.88
(5.38)
4.32
(4.75)
0.11
(0.03)
0.04
(0.02)
0.05
(0.03)
n.d.
n.d.
n.d.
0.39
(0.18)
n.d.
1.07
(1.18)
0.21
(0.21)
Var
(residual)
81.6(5.81)
80.6(5.71)
0.24
(0.03)
0.26
(0.02)
0.65
(0.04)
1.83
(0.17)
18.1(1.42)
2.57
(0.22)
Var
(phenotype)
90.4(4.28)
84.8(4.24)
0.35
(0.02)
0.29
(0.01)
0.70
(0.03)
2.23
(0.11)
19.3(1.05)
2.78
(0.15)
h2 Q0.10
(0.06)
0.05
(0.05)
0.32
(0.08)
0.12
(0.06)
0.07
(0.05)
0.18
(0.08)
0.06
(0.06)
0.08
(0.08
882 M. Guichard et al.

II.2SA
R
Honey
yield
Honey
yield
(colonieshaving
produced
only)
Defensive
behaviour
Calmness
during
inspectio
n
Swarming
drive
V.destructor
infestationin
spring
V.destruct-
or infesta-
tionin
summer
V.destruct-
or infesta-
tion
grow
thrate
Hygienic
behaviour
Workermodel
Var
(worker)
44.7(22.9)
43.4(24.2)
0.01
(0.01)
0.01
(0.02)
n.d.
0.00
(0.00)
n.d.
n.d.
50.6(38.4)
Var
(colony)
17.9(9.18)
17.3(9.71)
0.00
(0.01)
0.00
(0.01)
0.00
(0.00)
20.3(15.4)
Var
(residual)
146(9.17)
144(9.67)
0.17
(0.01)
0.17
(0.01)
0.07
(0.00)
299(18.3)
Var
(phenotype)
164(8.33)
162(8.66)
0.18
(0.01)
0.17
(0.01)
0.07
(0.00)
320(16.2)
h2 W0.27
(0.13)
0.27
(0.14)
0.04
(0.08)
0.06
(0.09)
0.00
(0.01)
0.16
(0.12)
h2 W0.11
(0.05)
0.11
(0.06)
0.02
(0.03)
0.03
(0.04)
0.00
(0.03)
0.06
(0.05)
Queen
model
Var
(queen)
18.3(10.4)
16.5(10.8)
0.00
(0.01)
0.02
(0.01)
0.01
(0.03)
n.d.
n.d.
n.d.
30.2(19.1)
Var
(residual)
144(10.9)
144(11.3)
0.17
(0.01)
0.15
(0.01)
0.73
(0.05)
288(21.2)
Var
(phenotype)
162(7.91)
160(8.19)
0.18
(0.01)
0.17
(0.01)
0.74
(0.03)
318(15.9)
h2 Q0.11
(0.06)
0.10
(0.07)
0.02
(0.04)
0.09
(0.05)
0.02
(0.05)
0.09
(0.06)
883Estimates of genetic parameters for production…

SEr ¼ffiffiffiffiffiffiffi1−r2n−2
q, n − 2 being the associated degrees
of freedom also provided by cor.test.
3. RESULTS
In Table II, the estimated variance components,heritabilities, and their respective standard errorsfor both populations are summarised. For theMEL population, the highest heritabilities wereobtained for defensive behaviour, calmness dur-ing inspection, and hygienic behaviour (Table II).For these three traits, heritabilities estimated forcolony and queen effects were in the same range
(0.34 and 0.32, 0.16 and 0.12, and 0.19 and 0.18,respectively). Low heritabilities were obtained forhoney yield, swarming drive, and colony sizegrowth rate (0.02 and 0.10, 0.06 and 0.07, and0.02 and 0.08, respectively). No colony or queeneffects were detected on the V. destructor infesta-tion growth rate, and almost no effects were foundon the infestations themselves (except low effectsfor infestation in spring with WM). For SARpopulation, heritabilities were generally verylow, with the only exception being for honey yieldand hygienic behaviour (0.11 and 0.11, 0.06 and0.09, respectively, for colony and queen effects)(Table II).
Figure 1. Tests of the models (models on queen or worker effects for MEL or SAR populations). Regressioncoefficient of linear relation between phenotypes corrected for apiary effects and breeding values calculated onlyaccording to pedigree is plotted in relationship to the estimated heritabilities. Bars indicate standard errors. A: honeyyield, B: honey yield (colonies having produced only), C: defensive behaviour, D: calmness during inspection, E:swarming drive, F: V. destructor infestation in spring, G: V. destructor infestation in summer, H: V. destructorinfestation growth rate, I: hygienic behaviour, J: colony size (spring), K: colony size (last harvest), L: colony sizegrowth rate. In the model on queen effects from the SAR population, one trait (V. destructor infestation in spring)was highly negative and is therefore represented in the top right corner diagram.
884 M. Guichard et al.

Tab
leIII.Pairwisecorrelations
betweenphenotypes
correctedforapiary
effectsobtained
bytheworkermodelandassociated
standard
errors(betweenbrackets)
III.1MEL
Honey
yield
Honey
yield
(colonies
having
produced
only)
Defensive
behaviour
Calmness
during
inspectio
n
Swarming
drive
V.destructor
infestation
inspring
V.destructor
infestation
insummer
V.destruct-
or infesta-
tion
grow
thrate
Hygienic
behaviour
Colonysize
(spring)
Colony
size
(last
harvest)
Honey
yield
(colonies
having
produced
only)
0.99
(0.00)
Defensive
behaviour
0.11
(0.04)
0.11
(0.04)
Calmness
during
inspectio
n
0.21
(0.04)
0.21
(0.04)
0.71
(0.03)
Swarming
drive
−0.06
(0.04)
−0.06
(0.04)
0.07
(0.04)
0.04
(0.04)
V.destructor
infestationin
spring
0(0.04)
0(0.04)
0.01
(0.04)
0.03
(0.04)
−0.01
(0.04)
V.destructor
infestationin
summer
0.05
(0.04)
0.05
(0.04)
0.02
(0.04)
−0.01
(0.04)
−0.06
(0.04)
0.16
(0.04)
V.destructor
infestation
grow
thrate
0.05
(0.04)
0.05
(0.04)
0.04
(0.04)
−0.02
(0.04)
0.01
(0.04)
−0.5(0.04)
0.59
(0.03)
Hygienic
behaviour
0.13
(0.04)
0.12
(0.04)
0.02
(0.04)
0.07
(0.04)
−0.02
(0.04)
−0.01
(0.04)
0.03
(0.04)
0(0.04)
colony
size
(spring)
0.40
(0.04)
0.39
(0.04)
0.01
(0.04)
0.13
(0.04)
−0.11
(0.04)
0.09
(0.04)
0.11
(0.04)
0.05
(0.04)
0.08
(0.04)
Colonysize
(lasth
arvest)
0.52
(0.03)
0.50
(0.04)
0.12
(0.04)
0.24
(0.04)
−0.03
(0.04)
0.01
(0.04)
−0.06
(0.04)
−0.02
(0.04)
0.14
(0.04)
0.40
(0.04)
Colonysize
grow
thrate
−0.08
(0.04)
−0.08
(0.04)
0.09
(0.04)
0.07
(0.04)
0.05
(0.04)
−0.08
(0.04)
−0.10
(0.04)
−0.04
(0.04)
−0.03
(0.04)
−0.38
(0.04)
0.09
(0.04)
885Estimates of genetic parameters for production…
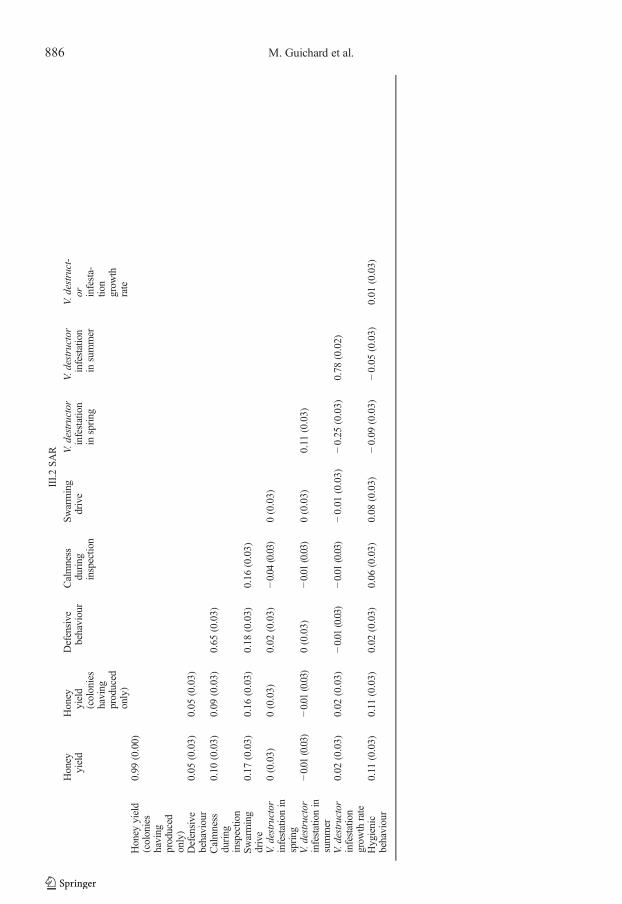
III.2SA
R
Honey
yield
Honey
yield
(colonies
having
produced
only)
Defensive
behaviour
Calmness
during
inspectio
n
Swarming
drive
V.destructor
infestation
inspring
V.destructor
infestation
insummer
V.destruct-
or infesta-
tion
grow
thrate
Honey
yield
(colonies
having
produced
only)
0.99
(0.00)
Defensive
behaviour
0.05
(0.03)
0.05
(0.03)
Calmness
during
inspectio
n
0.10
(0.03)
0.09
(0.03)
0.65
(0.03)
Swarming
drive
0.17
(0.03)
0.16
(0.03)
0.18
(0.03)
0.16
(0.03)
V.destructor
infestationin
spring
0(0.03)
0(0.03)
0.02
(0.03)
−0.04
(0.03)
0(0.03)
V.destructor
infestationin
summer
−0.01
(0.03)
−0.01
(0.03)
0(0.03)
−0.01
(0.03)
0(0.03)
0.11
(0.03)
V.destructor
infestation
grow
thrate
0.02
(0.03)
0.02
(0.03)
−0.01
(0.03)
−0.01
(0.03)
−0.01
(0.03)
−0.25
(0.03)
0.78
(0.02)
Hygienic
behaviour
0.11
(0.03)
0.11
(0.03)
0.02
(0.03)
0.06
(0.03)
0.08
(0.03)
−0.09
(0.03)
−0.05
(0.03)
0.01
(0.03)
886 M. Guichard et al.

In both populations, standard errors for theheritability estimates were high (with magnitudeoften similar to the values of the estimates), andonly a limited number of traits: defensive behav-iour, calmness during inspection, and hygienicbehaviour in MEL, and honey yield and hygienicbehaviour in SAR datasets, had heritabilitiesabove 0.1. For the honey yield trait, in the MELpopulation, heritabilities were estimated to beslightly higher when colonies with zero yield wereincluded in the data.
Results from the validation of the models arepresented in Figure 1. Estimated linear regressioncoefficients for the “realised” and “predicted”phenotypes are represented in relation to the her-itability estimated for the traits. Most of the re-gression coefficients did not significantly differfrom 1, indicating that the models provided unbi-ased estimates. One noticeable exception was theQM for the SAR population, in which all coeffi-cients significantly differed from 1. In the othermodels, the most precise predictions (regressioncoefficients close to 1 and low standard errors)were observed for traits with heritabilities estimat-ed over 0.1. In data from MEL, hygienic behav-iour estimated by WM gave better predictionsthan QM estimates. In SAR data, one trait(V. destructor infestation in spring) had a stronglynegative regression coefficient and a very lowheritability estimate; convergence of the maxi-mum likelihood algorithm for the calculation ofthe latter may have been possible only due toparticularities of the available data.
Pairwise correlations between all traits are pre-sented in Table III. In the MEL population, thehighest correlation (0.71) was found between de-fensive behaviour and calmness during inspec-tion. In addition, honey yield was positively cor-related with colony size in spring and summer(0.40 and 0.52, respectively) and with calmnessduring inspection (0.21). Colony size in springwas the only trait that moderately (0.09 to 0.11)correlated with V. destructor infestation levels.Hygienic behaviour and V. destructor infestationlevels were found to be uncorrelated. Hygienicbehaviour had a moderate positive correlationwith honey yield (0.13).
In the SAR dataset (Table III), a high correla-tion (0.65) was observed between defensive
behaviour and calmness during inspection. Amoderate correlation (0.11) was identified be-tween honey yield and hygienic behaviour. Alow correlation (− 0.09) was observed betweenV. destructor infestation in spring and the hygien-ic behaviour of the colony, but this result was notobserved in summer conditions.
4. DISCUSSION
The genetic analysis of two independent honeybee datasets, each having about 1000 colonieswith observations, indicated that it was possibleto calculate genetic parameters even in small pop-ulations. However, in our case, it was not possibleto estimate queen and worker effects jointly, likein previous studies (Bienefeld and Pirchner 1990,1991; Brascamp et al. 2016; Ehrhardt et al. 2010).As two linear models (WM and QM) had to beused, part of the variation linked to the queeneffect may have been included in the worker effectin WM, and vice versa, nor was it possible toestimate the genetic correlation between workerand queen effects for the same trait.
As MEL and SAR populations were not genet-ically connected, were managed differently, andhad distinct evaluation protocols for some traits,comparisons between estimates should only bedone with caution. This is also the case for com-parisons to some previously published studies, inwhich heritabilities may have been estimated withother methods.
In both datasets, heritabilities were low to mod-erate for honey yield, below previously describedvalues in other countries (Andonov et al. 2019;Bienefeld and Pirchner 1990; Brascamp et al.2016; Najafgholian et al. 2011; Tahmasbi et al.2015; Zakour et al. 2012). This may be explainedby the specificities of honey production in Swit-zerland, which mainly relies on rapeseed nectarand silver fir honeydew (Persano Oddo et al.2004), both strongly influenced by environmentalconditions with high environmental variability:production may, for instance, be highly influencedby genotype-environment interactions. In addi-tion, the colony size recorded byMEL beekeeperswas almost not heritable but positively correlatedto honey yield; the latter may be influenced bycolony management (for instance, space
887Estimates of genetic parameters for production…
availability for the queen for laying eggs or feed-ing, if necessary). In theMEL data, the heritabilityestimates for honey yield were slightly higherwhen non-producing colonies were included inthe dataset. This result suggests a putative geneticeffect on non-producing colonies; therefore, wesuggest including non-producing colonies in thedata analysis.
Heritability estimates for defensive behaviourand calmness during inspection differed betweenthe two populations, with high values in MEL,corresponding to previously published values forother populations (Andonov et al. 2019; Bienefeldand Pirchner 1990; Brascamp et al. 2016;Tahmasbi et al. 2015) or even being higher thanothers (Zakour et al. 2012). Lower estimates wereobtained for the SAR population; this may berelated to evaluation protocols. As the qualitylevel of the colonies was recorded, and as manyexpressed apparently satisfying behaviour levelsfor these traits, half of the colonies were evaluatedbetween 3.5 and 4 (maximum grade). We there-fore observed a lower variation in the recordingsof these traits compared with the MEL dataset,where the worst colony per apiary was graded 1,the best colony was graded 4, and the others weredistributed in between (Table I). Thus, the lowheritabilities might be the result of the low vari-ability reported and not the absence of a geneticeffect. In order to improve the assessment ofcalmness during inspection and defensive behav-iour in SAR, we suggest evaluating the coloniesby using the full scale from 1 to 4 for relativeranking to better discriminate the best colonies.This had already been suggested tomore efficient-ly select for low defensive behaviour in an ex-tremely aggressive A. m. syriaca population(Zakour and Bienefeld 2013). If almost no vari-ability can be detected in the field for some traits,for instance when all colonies are very close to theoptimum, other approaches could be preferred,such as removing the few colonies with low per-formance from the programme. High correlationsbetween defensive behaviour and calmness duringinspection were obtained for both populations(0.71 and 0.65 for MEL and SAR, respectively).High genetic correlations have been reported pre-viously for these two traits in an Austrian A. m.carnica population (Brascamp et al. 2016). This
may indicate either that beekeepers are not able todistinguish the two traits, or that they are in gen-eral closely linked. Breeding programmes couldconsider including only one trait or to definebetter tools to assess the two traits more distinctly.
In agreement with a previous study (Brascampet al. 2016), heritability estimates for swarmingdrive were low (< 0.1) for queen and colony ef-fects, indicating either strong genotype-environment interactions (involving weather orhoney flow conditions), non-genetic quality fac-tors of the queen, or a lack of exactitude in theassessment of this trait by the beekeepers. Highervalues have been obtained in two other popula-tions (Andonov et al. 2019; Tahmasbi et al. 2015),indicating that in the latter, selection for this traitcould be possible.
Surprisingly, heritability estimations forV. destructor infestations only led to null values.This result is not in line with previous findingsobtained by others (Büchler et al. 2008; Ehrhardtet al. 2010) but corresponds to some observations(Harbo and Harris 1999; Maucourt 2019). Lownon-significant heritabilities were found in springin WM. However, spring values are mainly re-corded in order to check the efficiency of pre-testing treatment (infestation should be close tozero for all colonies); it is therefore likely thatthese values are due to specificities of the datasetrather than genetic differences among colonies. Incontrast, we would have expected higher estimat-ed heritabilities for infestation rates in summerand infestation growth rates between spring andsummer. Several reasons may explain this result:either infestationmay not be influenced by geneticbackground of the host, or these influences aremasked early by far more important horizontaltransmissions between colonies and/or apiaries.These transmissions, for instance linked to rob-bing, are likely to happen starting at the end ofspring, as relatively long gaps between spring andsummer honey flows are frequent in Switzerland.Many apiaries in Switzerland still use traditionalhives grouped in small pavilions with the en-trances of the different colonies being side by side.Apiaries with hives kept in groups and entriesfacing in the same direction are known to increasemite transfers between colonies (Dynes et al.2019; Seeley and Smith 2015). In addition, many
888 M. Guichard et al.

regions in Switzerland have a high colony andapiary density per square kilometre (Fluri et al.2004; von Büren et al. 2019), and colony densityhas been linked with mite re-invasion flows inneighbouring Germany (Frey and Rosenkranz2014). These mite flows between colonies likelymask colony effects. Finally, as V. destructor in-festation measurements require precise protocols,it should be verified if, despite training providedby the associations, all beekeepers performed themeasurements with the necessary exactitude.However, no heritability for the infestation levelwas observed either in a research population ofsimilar size (Maucourt 2019). This may indicatethat under some conditions, even if evaluators aretrained, heritabilities for this trait are extremelylow, perhaps due to environmental effects. Even ifheritabilities for V. destructor so far have beenlow, beekeepers should continue to measure infes-tation levels to support the monitoring of thetesting network and to guarantee good health con-ditions at the testing apiaries (efficient treatmentsbetween testing periods). Mortality due to poorinfestation management by the beekeeper can beavoided, enabling complete testing of a maximumnumber of queens, which are highly valuable aspotential drivers of genetic progress.
In the case of MEL, estimated heritabilities forhygienic behaviour were comparable with valuesfound in the literature (Büchler et al. 2008;Ehrhardt et al. 2010; Facchini et al. 2019;Maucourt 2019). Lower values in the case ofSARmay be due to the evaluation protocol of thistrait. Perhaps, more precise data could be obtainedif values were expressed as the number of cellscleaned per hour (test duration is not known sofar), following the approach of MEL. We foundno association between hygienic behaviour andV. destructor infestation level in summer. Hygien-ic behaviour is employed as a criterion to improvebrood health, but many beekeepers may associatethis trait with the aim of selecting colonies thatshow resistance to V. destructor , for instance bymeans of Varroa sensitive hygiene. The link be-tween hygienic behaviour and resistance toV. destructor is controversially discussed(Leclercq et al. 2018). In the present case, it isunlikely that selection for hygienic behaviour maylead to better survival of colonies in the context of
V. destructor infestations. This could be becauseother resistance traits (for instance grooming,Varroa sensitive hygiene, suppressed mite repro-duction, swarming) or more likely, a combinationof such traits, may be more efficient defencemechanisms under Swiss conditions, as this isthe case in certain naturally resistant populations(Locke 2016). It is unclear how hygienic behav-iour could help to decrease the number of cases ofthe widespread European foulbrood, as the prev-alence of this endemic disease is also highly in-fluenced by colony density (von Büren et al.2019). For these reasons, the ability of hygienicbehaviour to limit chalkbrood or European orAmerican foulbrood prevalence should beassessed in the Swiss context. In the meantime,selecting for hygienic behaviour should not havedetrimental effects on honey yield, as both traitsshow a low positive correlation (0.13 and 0.11 forMEL and SAR, respectively).
Tests from the models showed that EBVs wereunbiased for almost all traits, especially for traitswith heritabilities above 0.1. One noticeable ex-ception was QM for the SAR dataset, where allestimates were biased. This might be related to thelack of performance data on the female side, asmost of the colonies used for queen breeding areempirically selected by the beekeepers in chargeof the lines. We suggest, in the future, addingperformance information on the female side, forinstance by using tested queens as dams to pro-duce the next generation. In the MEL dataset,EBVs for hygienic behaviour obtained by WMwere estimated more accurately than those obtain-ed by QM. This may be explained by the fact thathygienic behaviour depends on the ability ofworkers to detect dead brood, a task that doesnot involve the queen. In this study, we couldnot estimate jointly the worker and queen effects.By adding data to the performance files in the nextyears, an aim for the associations could be tojointly assess the two effects in the future, as soonas convergence of the maximum likelihood algo-rithm can be obtained. This is expected to lead to amore accurate estimate of the breeding objective,when defined as the sum of worker and queeneffects in a joint analysis.
Based on our results, beekeepers could selectfor traits with the highest heritabilities, and could
889Estimates of genetic parameters for production…

periodically calculate genetic progress to verifywhether selection leads to the desired results. Oth-er parameters, such as generation interval, queenmortality due to management issues, and selectiondifferentials could also be considered to optimisegenetic progress. Standardization and quality ofdata collection should be verified frequently, as itis crucial for the quality of datasets and forobtaining better genetic estimates. Moreover,standardization will help in comparing resultswith other studies in the future. This is also thecase for breeding value and heritability estimationmethods. Traits related to V. destructor infestationneed to be re-examined locally, in order to explorethe genetic background of honey bees for resis-tance selection under Swiss conditions.
ACKNOWLEDGEMENTS
We thank Andrew Brown for his assistance with thedata analysis and two anonymous reviewers for theirvaluable comments.
AUTHOR’S CONTRIBUTION
MG, GS, PF, BD, MN, PB, and EWB conceivedand planned the study. GS and MeGr provided theraw data recorded by the beekeepers. PB and EWBprovided the analysis method; MG and EWB per-formed data analysis. MG, GS, PF, MeGr, SG, andEWB contributed to the interpretation of the re-sults. MG drafted the manuscript and designed thefigures and tables. MN, GS, PF, MeGr, SG, BD,PB, and EWB provided critical feedback on themanuscript and participated in its revision.
Funding information
Financial support for this study was provided byBundesamt für Landwirtschaft BLW (Swiss Feder-al Office for Agriculture FOAG), grant No.627000708.
COMPLIANCE WITH ETHICALSTANDARDS
Conflict of interest The authors declare that they have noconflicts of interest.
OPEN ACCESS
This article is licensed under a Creative CommonsAttribution 4.0 International License, which permitsuse, sharing, adaptation, distribution and reproductionin any medium or format, as long as you give appropri-ate credit to the original author(s) and the source, pro-vide a link to the Creative Commons licence, and indi-cate if changes were made. The images or other thirdparty material in this article are included in the article'sCreative Commons licence, unless indicated otherwisein a credit line to the material. If material is not includedin the article's Creative Commons licence and yourintended use is not permitted by statutory regulation orexceeds the permitted use, you will need to obtainpermission directly from the copyright holder. To viewa copy of this licence, visit http://creativecommons.org/licenses/by/4.0/.
Estimations des paramètres génétiques pour la produc-tion, le comportement et les indicateurs de santé dansdeux populations d’abeilles suisses.
Apis mellifera / paramètre génétique / héritabilité /corrélation phénotypique / Varroa destructor.
Abschätzen von genetischen Parametern für dieProduktion, Verhalten, und Gesundheitsmerkmale beizwei schweizer Honigbienen-Populationen.
Apis mellifera / genetische Parameter / Heritabilität /phänotypische Korrelation/ Varroa destructor.
REFERENCES
Andonov, S., Costa, C., Uzunov, A., Bergomi, P.,Lourenco, D.,Misztal, I. (2019)Modeling honey yield,defensive and swarming behaviors of Italian honeybees (Apis mellifera ligustica ) using linear-thresholdapproaches. BMC Genet. 20 (1), 78. https://doi.org/10.1186/s12863-019-0776-2
Bienefeld, K., Pirchner, F. (1990) Heritabilities for severalcolony traits in the honeybee (Apis mellifera carnica ).Apidologie. 21 (3), 175-183
Bienefeld, K., Pirchner, F. (1991) Genetic correlationsamong several colony characters in the honey bee(Hymenoptera: Apidae) taking queen and worker ef-fects into account. Ann. Entomol. Soc. Am. 84 (3),324-331
890 M. Guichard et al.
Brascamp, E. W., Bijma, P. (2014) Methods to estimatebreeding values in honey bees. Genet. Sel. Evol. 46 (1),1-15
Brascamp, E. W., Bijma, P. (2019). A note on geneticparameters and accuracy of estimated breeding valuesin honey bees. Genet. Sel. Evol. 51 (1). https://doi.org/10.1186/s12711-019-0510-6
Brascamp, E. W., Willam, A., Boigenzahn, C., Bijma, P.,Veerkamp, R. F. (2016) Heritabilities and genetic cor-relations for honey yield, gentleness, calmness andswarming behaviour in Austrian honey bees. [Erratumto this publication was published in Apidologie, 49(4),462-463 (2018)]. Apidologie. 47 (6), 739-748.https://doi.org/10.1007/s13592-016-0427-9
Büchler, R., Garrido, C., Bienefeld, K., Ehrhardt, K. (2008)Selection for Varroa tolerance: concept and results of along-term selection project. Apidologie 5 (39), 598
Büchler, R., Andonov, S., Bienefeld, K., Costa, C., Hatjina,F., Kezic, N., . . . Wilde, J. (2013). Standard methodsfor rearing and selection of Apis mellifera queens. J.Apic . Res . 52 (1) . h t tps : / /doi .org/10 .3896/IBRA.1.52.1.07
Dynes, T. L., Berry, J., Delaplane, K. S., Brosi, B. J., deRoode, J. C. (2019). Reduced density and visuallycomplex apiaries reduce parasite load and promotehoney production and overwintering survival in honeybees. PLoS One. 14 (5). https://doi.org/10.1371/jour-nal.pone.0216286
Ehrhardt, K., Bienefeld, K. (2007) Einsatz und Erprobungvon P rü fpa r ame t e rn zu r Se l ek t i on e i ne rvarroatoleranten Honigbiene in der Praxis.Abschlussbericht über die wissenschaftliche Betreuungbei der Durchführung des Forschungs- undEntwicklungsvorhabens (Project report) LLHKirchhain and LB Hohen Neuendorf, 03UM008
Ehrhardt, K., Büchler, R., Bienefeld, K. (2010) Geneticparameters of new traits to improve the tolerance ofhoneybees to Varroa mites. Proceedings of the 9thWorld Congress on Genetics Applied to Livestock Pro-duction (9th WCGALP), 1–6 August 2010, Leipzig
Facchini, E., Bijma, P., Pagnacco, G., Rizzi, R., Brascamp,E. W. (2019). Hygienic behaviour in honeybees: acomparison of two recording methods and estimationof genetic parameters. Apidologie. https://doi.org/10.1007/s13592-018-0627-6
Fluri, P., Schenk, P., Frick, R. (2004) L’apiculture en Suisse.ALP Forum. 2004 (8 F), 1-52
Frey, E., Rosenkranz, P. (2014) Autumn Invasion Rates ofVarroa destructor (Mesostigmata: Varroidae) IntoHoney Bee (Hymenoptera: Apidae) Colonies and theResulting Increase in Mite Populations. J. Econ.Entomol. 107 (2), 508-515. https://doi.org/10.1603/EC13381
Harbo, J. R., Harris, J. W. (1999). Selecting honey bees forresistance to Varroa jacobsoni . Apidologie. 30 (2-3),183-196
Leclercq, G., Francis, F., Gengler, N., Blacquière, T. (2018)Bioassays to quantify hygienic behavior in honey bee(Apis mellifera L.) Colonies: a review. J. Apic. Res.https://doi.org/10.1080/00218839.2018.1494916
Locke, B. (2016). Natural Varroa mite-surviving Apismellifera honeybee populations. Apidologie. 47 (3),467-482. https://doi.org/10.1007/s13592-015-0412-8
Luan, T., Woolliams, J. A., Lien, S., Kent, M., Svendsen,M., Meuwissen, T. H. (2009). The accuracy of geno-mic selection in Norwegian red cattle assessed bycross-validation. Genetics. 183 (3), 1119-1126
Maucourt, S. (2019) Genetic selection of the honey bee(Apis mellifera ) in a northern climate. Proceedings ofthe 46th Apimondia International Apicultural Con-gress, Montréal, 8-12 September 2019, Québec, Can-ada. Available online at https://www.apimondia.com/en/databases/congresses-proceedings/106-apimondia-2019-montreal-canada-proceedings (lastaccess 2019.12.20)
Najafgholian, J., Pakdel, A., Tahmasbi, G., Nehzati, G.(2011) New approach for estimating of heritability inhoneybee population. Int. J. Plant Anim. Environ. Sci.1 (2), 70-75
Persano Oddo, L., Piana, L., Bogdanov, S., Bentabol, A.,Gotsiu, P., Kerkvliet, J., . . ., von der Ohe, K. (2004)Botanical species giving unifloral honey in Europe.Apidologie. 35 (special issue), 82-93
Plate, M., Bernstein, R., Hoppe, A., Bienefeld, K. (2019)The importance of controlled mating in honeybeebreeding. Genet. Sel. Evol. 51 (1), 74. https://doi.org/10.1186/s12711-019-0518-y
R-Core-Team. (2018) R: A language and environment forstatistical computing. R Foundation for StatisticalComputing, Vienna. Retrieved from http://www.R-project.org/
Seeley, T. D., Smith, M. L. (2015). Crowding honeybeecolonies in apiaries can increase their vulnerability tothe deadly ectoparasite Varroa destructor . Apidologie.46 (6), 716-727. https://doi.org/10.1007/s13592-015-0361-2
Tahmasbi, G., Kamali, M. A., Ebadi, R., Nejati Javaremi,A., Babaei, M., Gharadaghi, A. A., Bahraini, R. (2015)Genetic trends and parameters of honey production,swarming and defense behavior in Iranian honeybee(Apis mellifera meda ) colonies. J. Agric. Sci. Technol.17 , 1735-1742
von Büren, R. S., Oehen, B., Kuhn, N. J., Erler, S. (2019)High-resolution maps of Swiss apiaries and their ap-plicability to study spatial distribution of bacterial hon-ey bee brood diseases. PeerJ. 7 , e6393. https://doi.org/10.7717/peerj.6393
Zakour, M. K.,Bienefeld, K. (2013) Subjective Evaluationof Defensive Behavior in the Syrian Honeybee (ApisMellifera Syriaca ). J. Apic. Sci. 57 (2), 137-145.https://doi.org/10.2478/JAS-2013-0024
Zakour, M. K., Ehrhardt, K., & Bienefeld, K. (2012) Firstestimate of genetic parameters for the Syrian honey beeApis mellifera syriaca . Apidologie. 43 (5), 600-607.https://doi.org/10.1007/s13592-012-0130-4
Publisher’s note Springer Nature remains neutralwith regard to jurisdictional claims in published mapsand institutional affiliations.
891Estimates of genetic parameters for production…