Embed Size (px)
Citation preview
Identifying Key Performance Indicators: The Foundation of an Institutional Dashboard
Jeffrey A. Seybert, Ph.D., Director National Higher Education Benchmarking Institute
Johnson County Community College
What is a Dashboard in Higher Education?
• A brief document that graphically displays critical institutional information in a succinct, easily understood, visually appealing format
• A tool to communicate the current health of the organization and its progress toward its strategic objectives
Purposes of Dashboards
• To communicate current information about major indices of organizational performance to primary stakeholders
• To provide information to assist in evaluation of organizational performance
• To provide a comprehensive analysis of how the organization’s achievement of its strategic objectives leads to effectively carrying out its mission and vision
• To provide information about organizational performance compared to appropriate benchmarks
Why Do We Need Dashboards in Higher Ed.?
• Institutional leadership has a responsibility to be accountable to both internal and external stakeholders
• Stakeholders want/need accurate, concise, easy-to-understand, up-to-date data & information about organizational performance
• Traditional communication sources in higher ed. (e.g., annual reports) are usually obsolete by the time they reach stakeholders and typically fail to provide necessary/sufficient detail about organizational performance
Components of Dashboards
• A limited set of measures—usually referred to as “Key Performance Indicators” (or KPIs)
• An integrated data structure for that set of measures • A source of comparative benchmarks for the
measures • Graphics for displaying the measures
Characteristics of an Effective Dashboard
• Operationally focused—tied to the institution’s mission and strategic plan
• Timely • Accurate • Easy to understand • Represents the current state of the organization • Provides a straightforward summary of
organizational performance
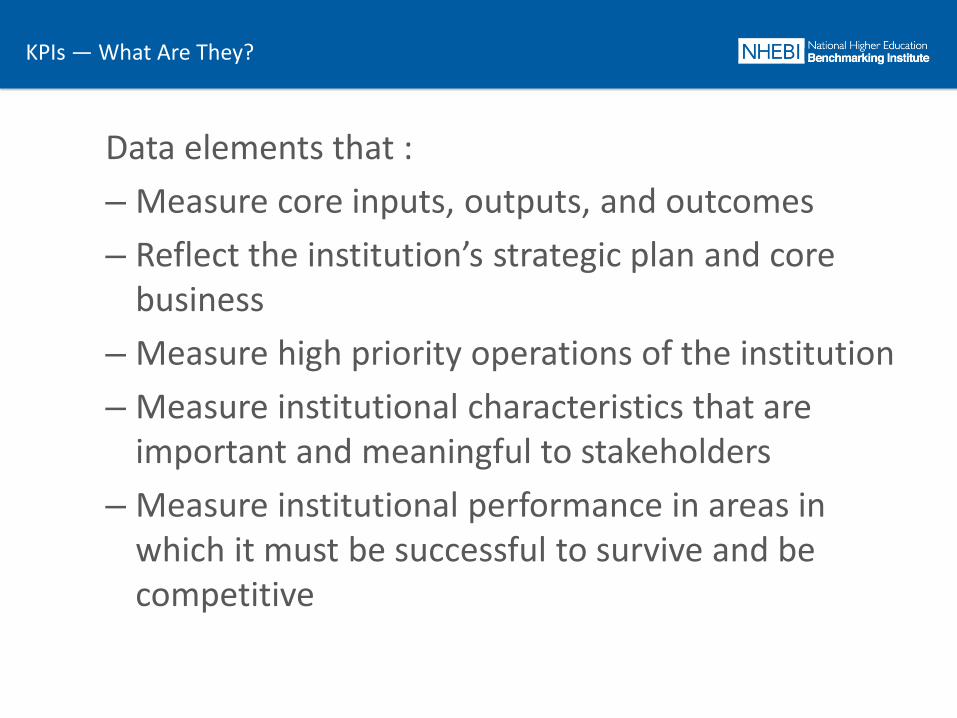
KPIs — What Are They?
Data elements that : – Measure core inputs, outputs, and outcomes – Reflect the institution’s strategic plan and core
business – Measure high priority operations of the institution – Measure institutional characteristics that are
important and meaningful to stakeholders – Measure institutional performance in areas in
which it must be successful to survive and be competitive
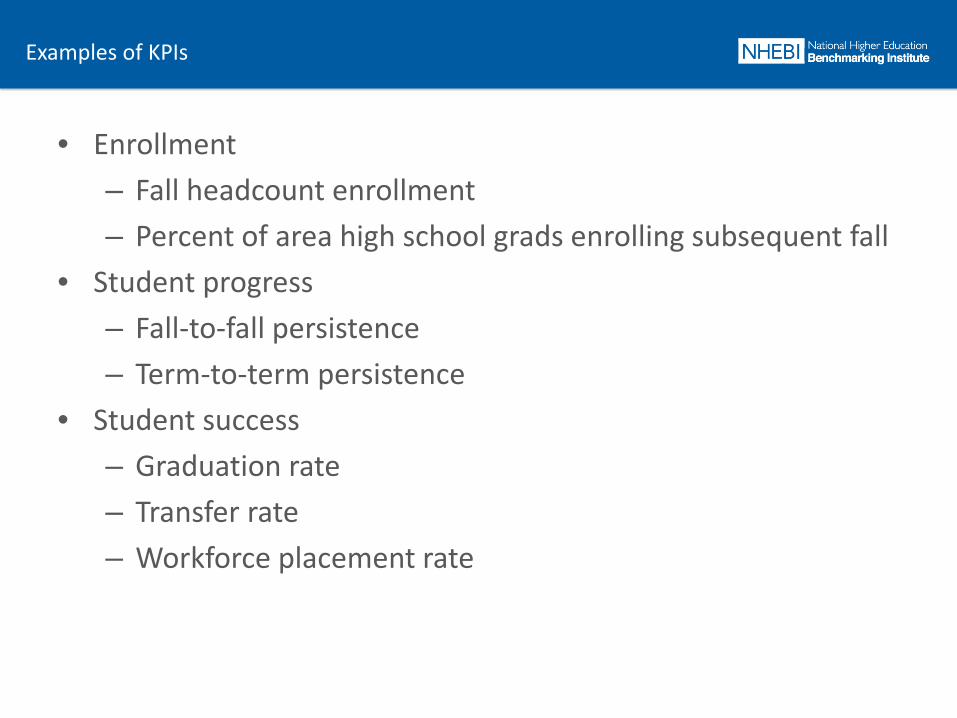
Examples of KPIs
• Enrollment – Fall headcount enrollment – Percent of area high school grads enrolling subsequent fall
• Student progress – Fall-to-fall persistence – Term-to-term persistence
• Student success – Graduation rate – Transfer rate – Workforce placement rate
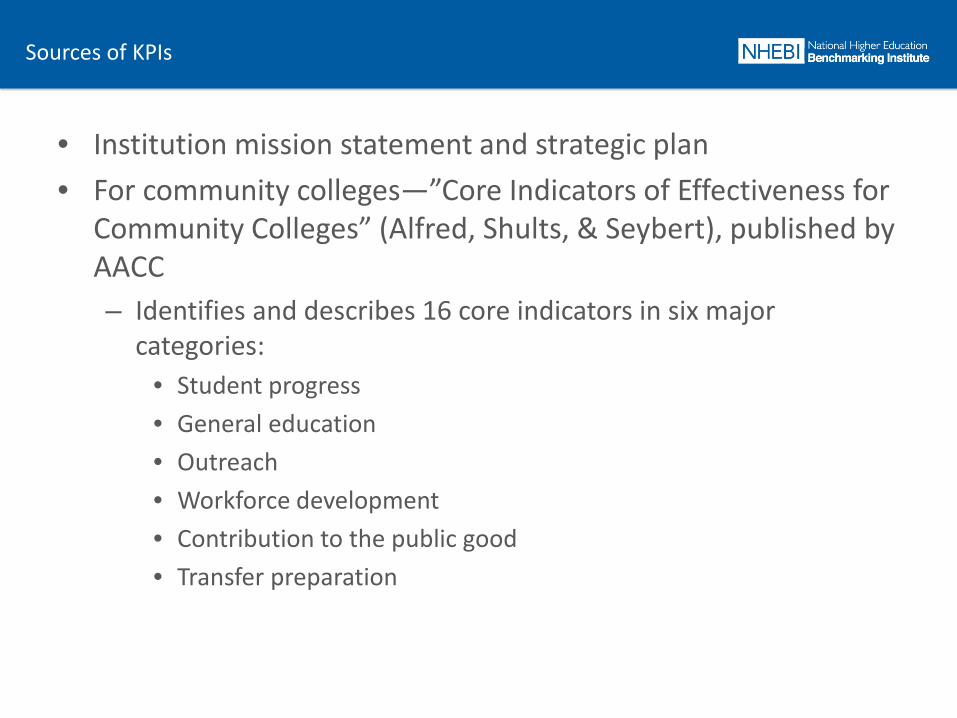
Sources of KPIs
• Institution mission statement and strategic plan • For community colleges—”Core Indicators of Effectiveness for
Community Colleges” (Alfred, Shults, & Seybert), published by AACC – Identifies and describes 16 core indicators in six major
categories: • Student progress • General education • Outreach • Workforce development • Contribution to the public good • Transfer preparation
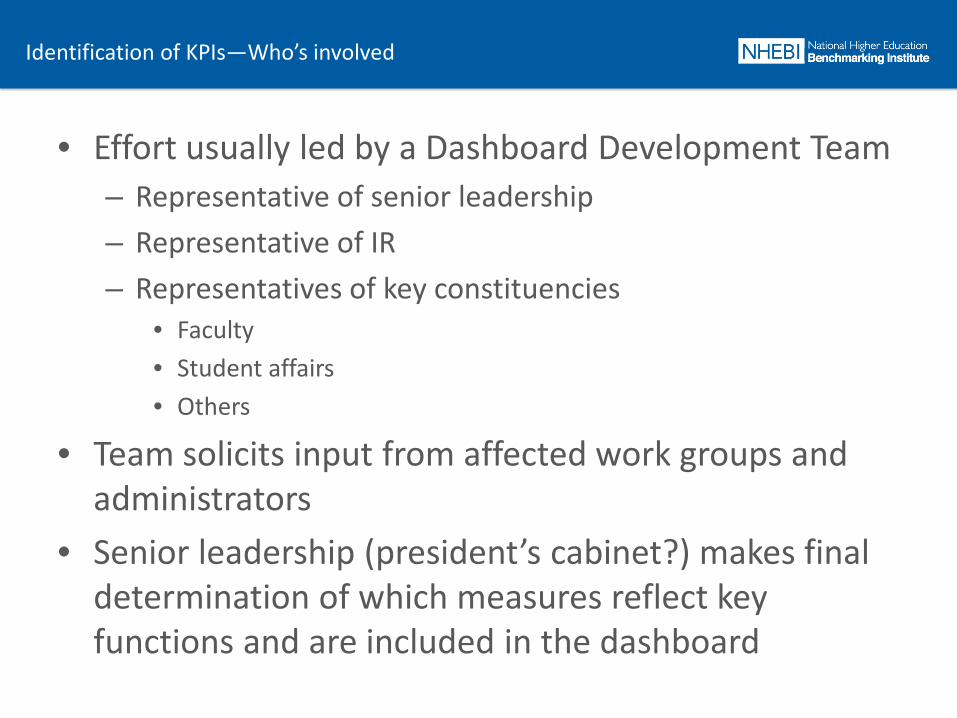
Identification of KPIs—Who’s involved
• Effort usually led by a Dashboard Development Team – Representative of senior leadership – Representative of IR – Representatives of key constituencies
• Faculty • Student affairs • Others
• Team solicits input from affected work groups and administrators
• Senior leadership (president’s cabinet?) makes final determination of which measures reflect key functions and are included in the dashboard
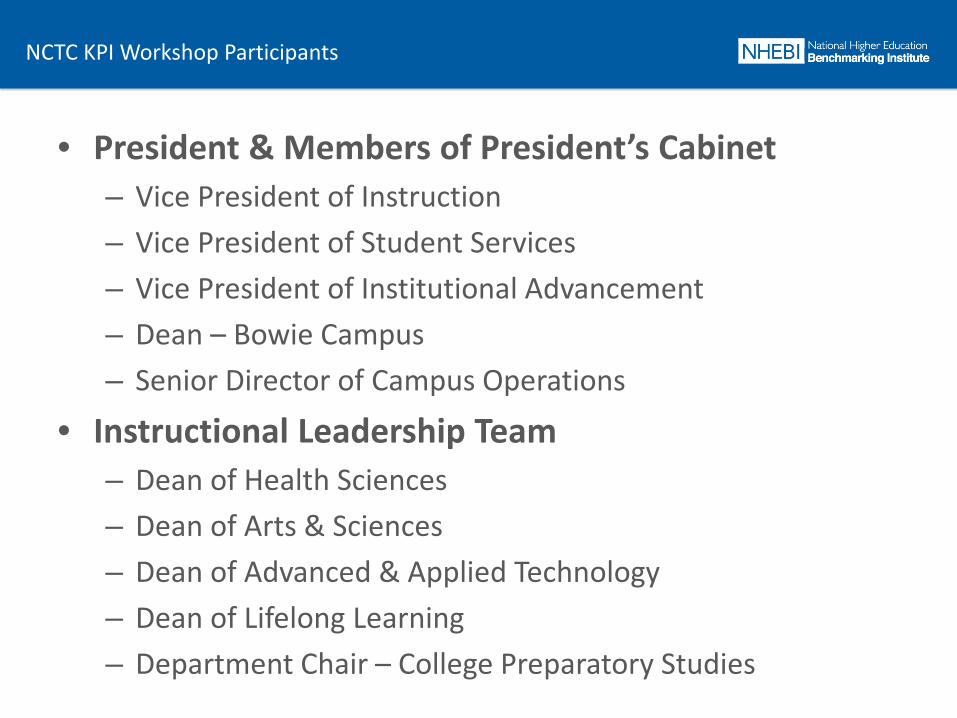
NCTC KPI Workshop Participants
• President & Members of President’s Cabinet – Vice President of Instruction – Vice President of Student Services – Vice President of Institutional Advancement – Dean – Bowie Campus – Senior Director of Campus Operations
• Instructional Leadership Team – Dean of Health Sciences – Dean of Arts & Sciences – Dean of Advanced & Applied Technology – Dean of Lifelong Learning – Department Chair – College Preparatory Studies
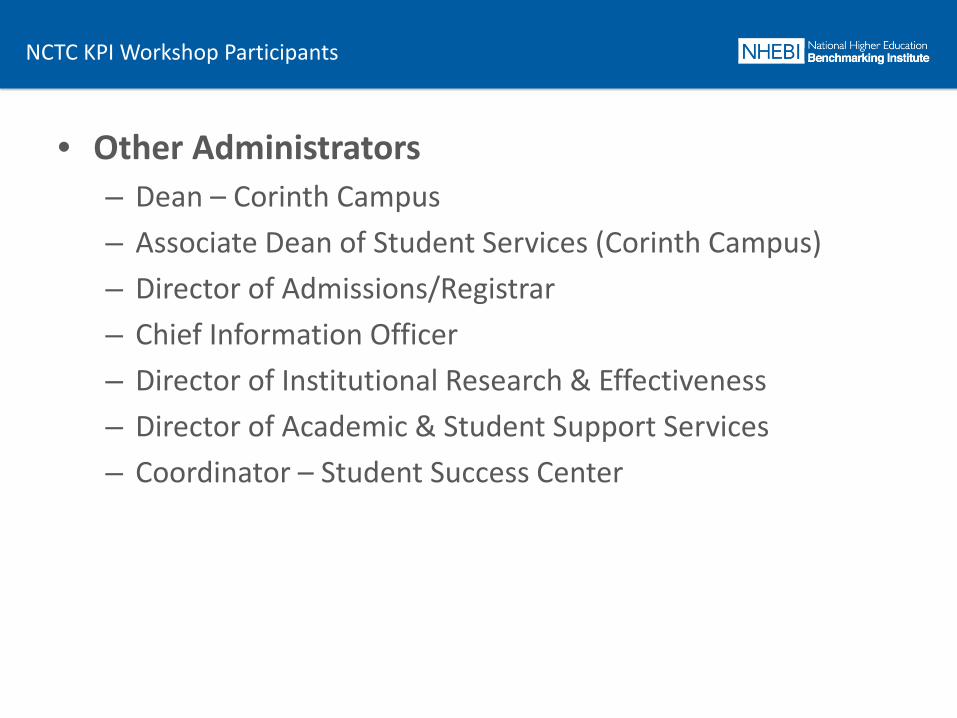
NCTC KPI Workshop Participants
• Other Administrators – Dean – Corinth Campus – Associate Dean of Student Services (Corinth Campus) – Director of Admissions/Registrar – Chief Information Officer – Director of Institutional Research & Effectiveness – Director of Academic & Student Support Services – Coordinator – Student Success Center
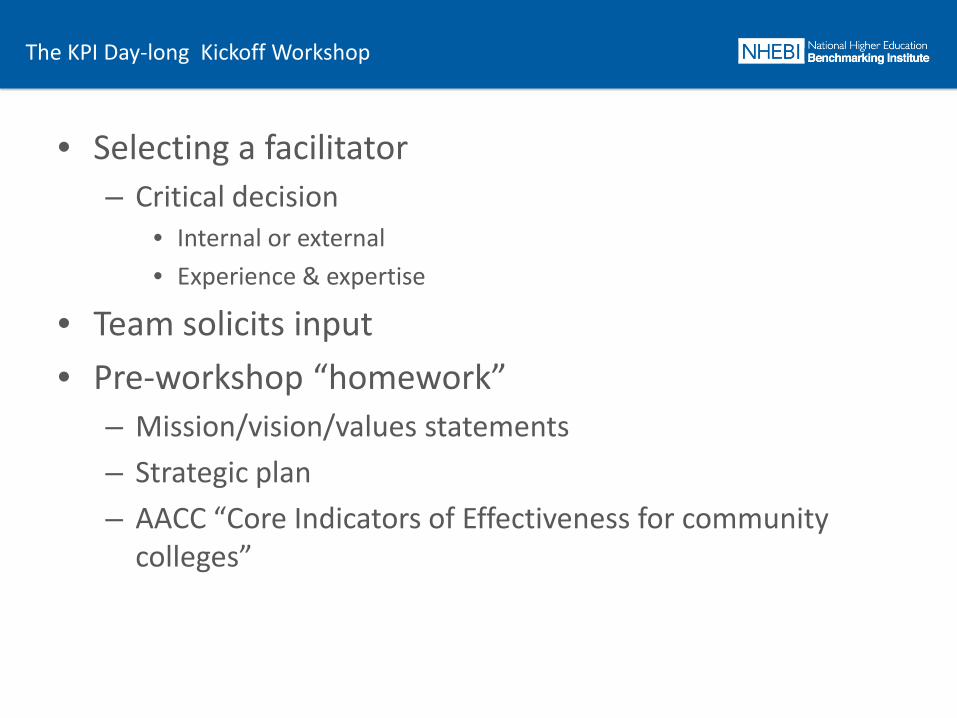
The KPI Day-long Kickoff Workshop
• Selecting a facilitator – Critical decision
• Internal or external • Experience & expertise
• Team solicits input • Pre-workshop “homework”
– Mission/vision/values statements – Strategic plan – AACC “Core Indicators of Effectiveness for community
colleges”
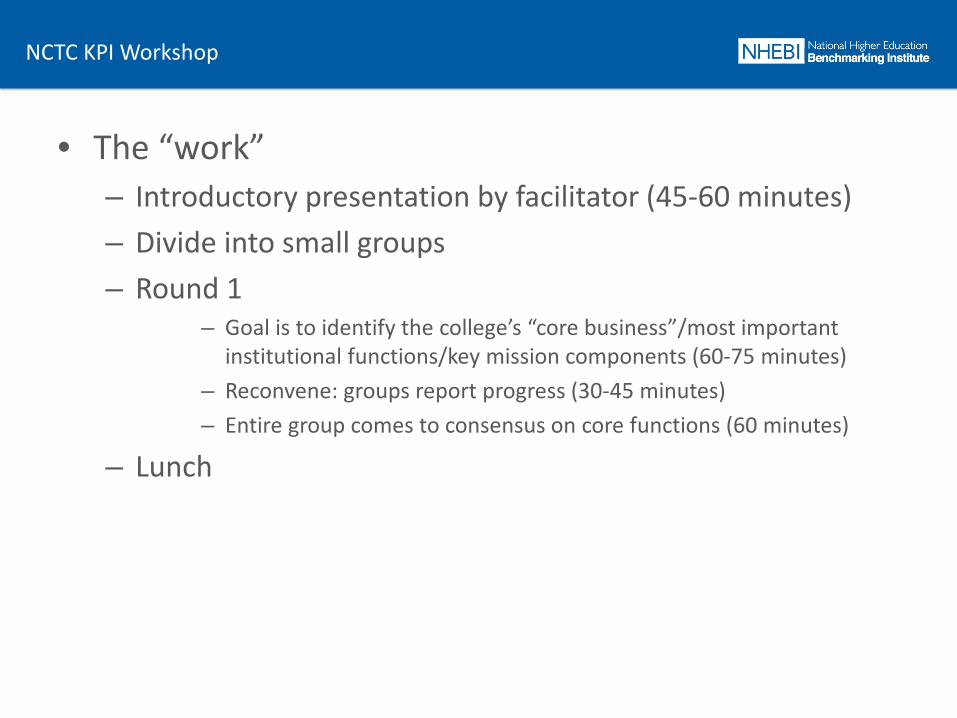
NCTC KPI Workshop
• The “work” – Introductory presentation by facilitator (45-60 minutes) – Divide into small groups – Round 1
– Goal is to identify the college’s “core business”/most important institutional functions/key mission components (60-75 minutes)
– Reconvene: groups report progress (30-45 minutes) – Entire group comes to consensus on core functions (60 minutes)
– Lunch
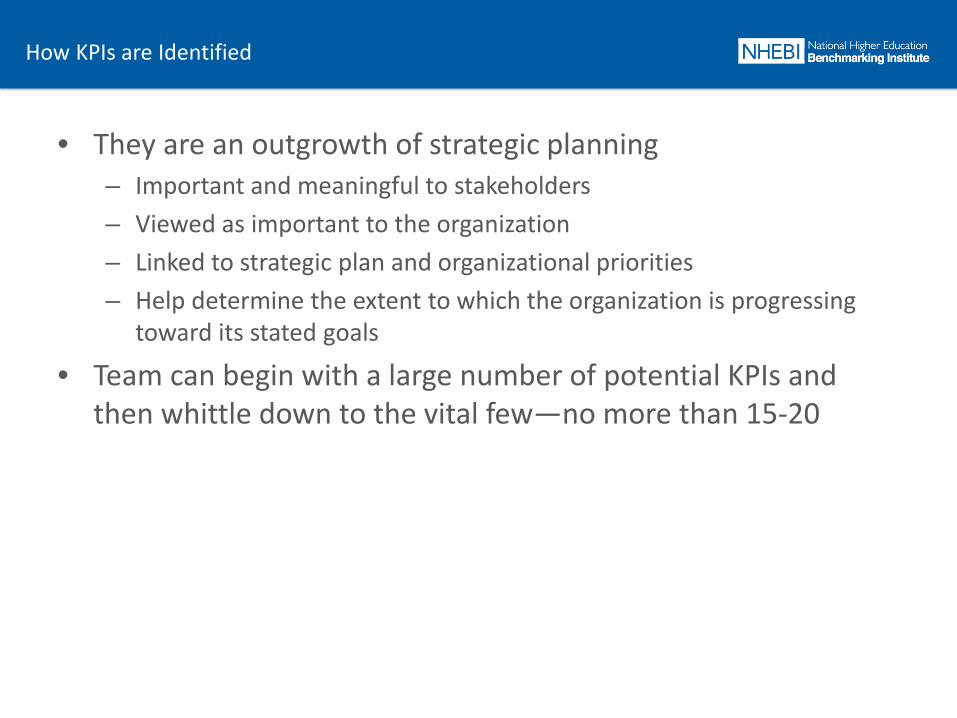
How KPIs are Identified
• They are an outgrowth of strategic planning – Important and meaningful to stakeholders – Viewed as important to the organization – Linked to strategic plan and organizational priorities – Help determine the extent to which the organization is progressing
toward its stated goals
• Team can begin with a large number of potential KPIs and then whittle down to the vital few—no more than 15-20
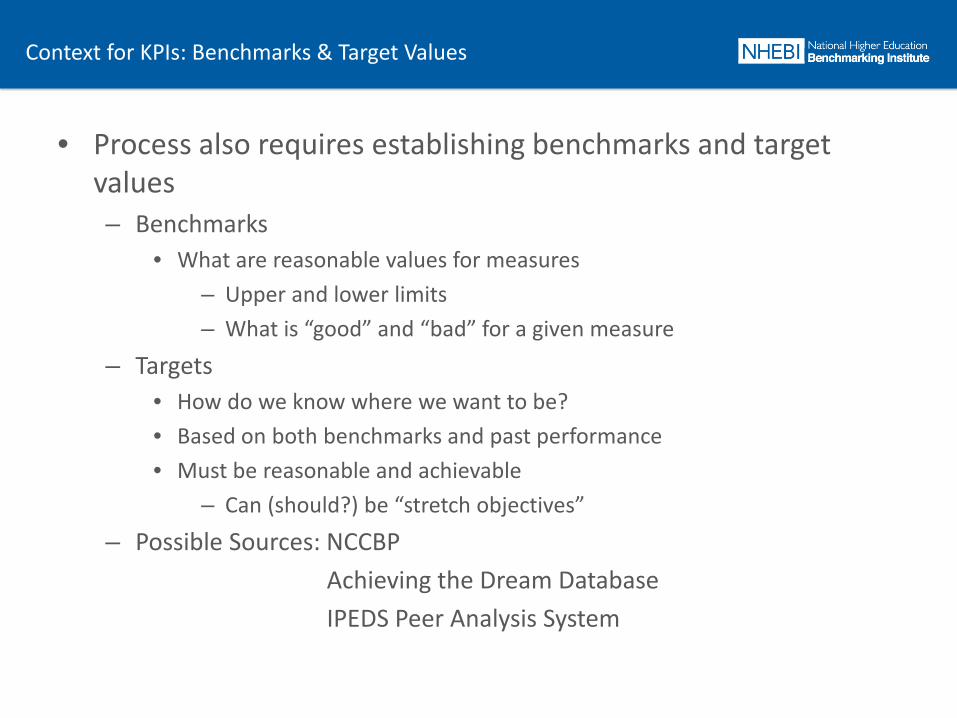
Context for KPIs: Benchmarks & Target Values
• Process also requires establishing benchmarks and target values – Benchmarks
• What are reasonable values for measures – Upper and lower limits – What is “good” and “bad” for a given measure
– Targets • How do we know where we want to be? • Based on both benchmarks and past performance • Must be reasonable and achievable
– Can (should?) be “stretch objectives” – Possible Sources: NCCBP
Achieving the Dream Database IPEDS Peer Analysis System
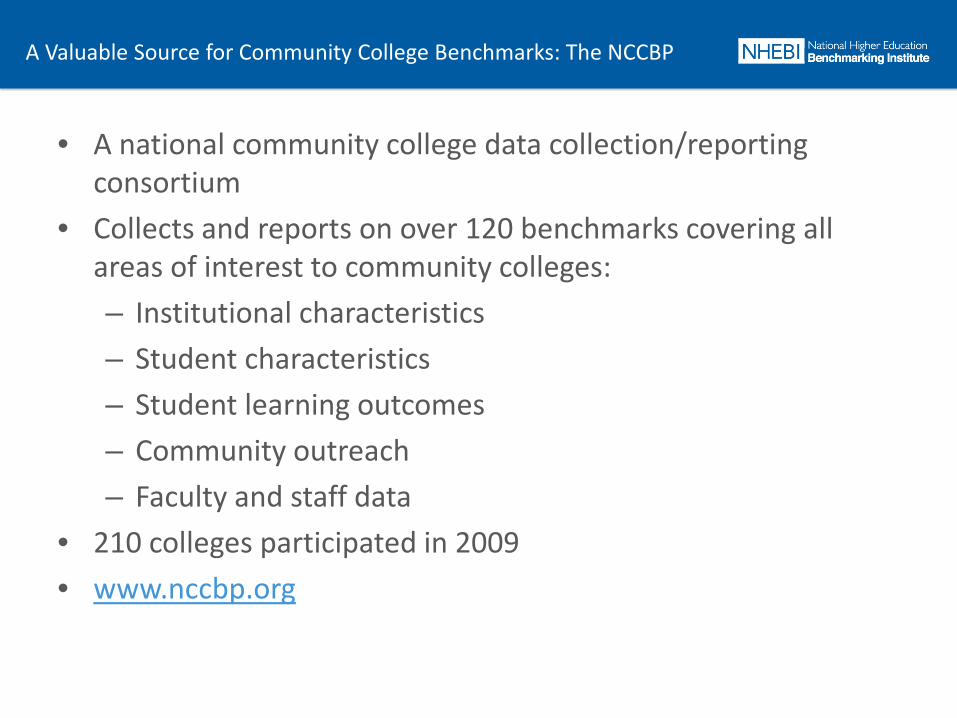
A Valuable Source for Community College Benchmarks: The NCCBP
• A national community college data collection/reporting consortium
• Collects and reports on over 120 benchmarks covering all areas of interest to community colleges: – Institutional characteristics – Student characteristics – Student learning outcomes – Community outreach – Faculty and staff data
• 210 colleges participated in 2009 • www.nccbp.org
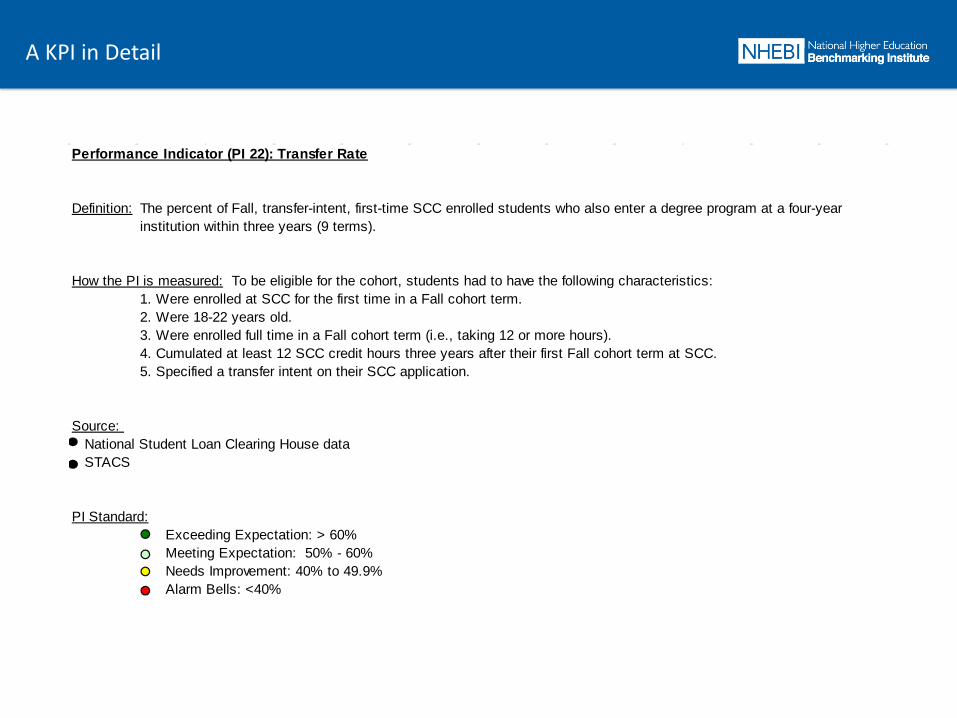
A KPI in Detail
Performance Indicator (PI 22): Transfer Rate
Definition: The percent of Fall, transfer-intent, first-time SCC enrolled students who also enter a degree program at a four-yearinstitution within three years (9 terms).
How the PI is measured: To be eligible for the cohort, students had to have the following characteristics:1. Were enrolled at SCC for the first time in a Fall cohort term.2. Were 18-22 years old.3. Were enrolled full time in a Fall cohort term (i.e., taking 12 or more hours).4. Cumulated at least 12 SCC credit hours three years after their first Fall cohort term at SCC.5. Specified a transfer intent on their SCC application.
Source: National Student Loan Clearing House dataSTACS
PI Standard:Exceeding Expectation: > 60%Meeting Expectation: 50% - 60%Needs Improvement: 40% to 49.9%Alarm Bells: <40%
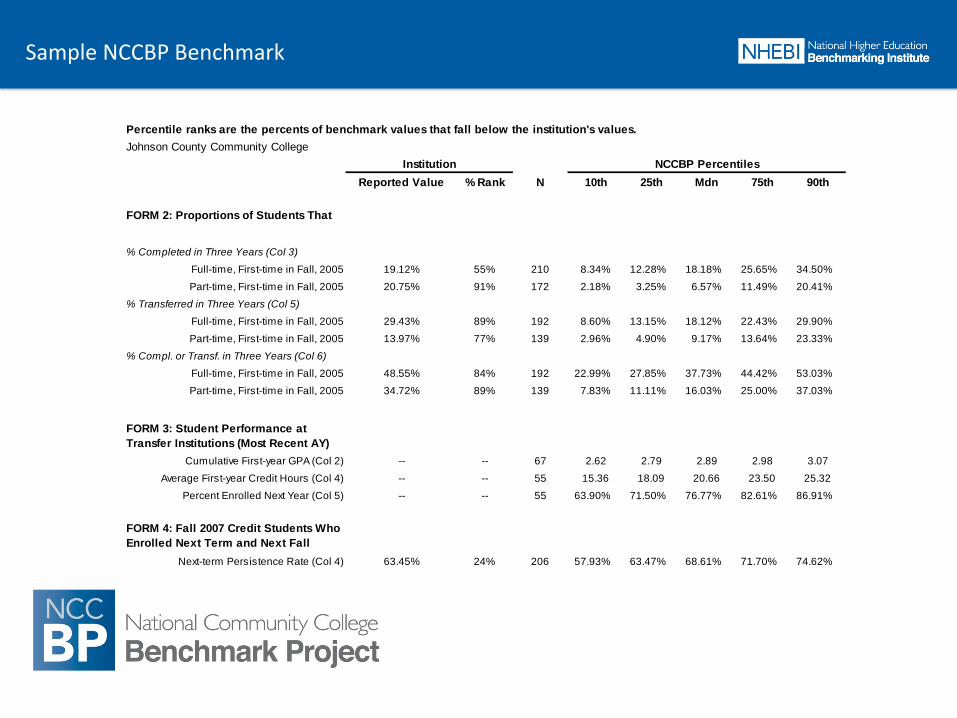
Sample NCCBP Benchmark
% Rank N 10th 25th Mdn 75th 90th
55% 210 8.34% 12.28% 18.18% 25.65% 34.50%
91% 172 2.18% 3.25% 6.57% 11.49% 20.41%
89% 192 8.60% 13.15% 18.12% 22.43% 29.90%
77% 139 2.96% 4.90% 9.17% 13.64% 23.33%
84% 192 22.99% 27.85% 37.73% 44.42% 53.03%
89% 139 7.83% 11.11% 16.03% 25.00% 37.03%
-- 67 2.62 2.79 2.89 2.98 3.07
-- 55 15.36 18.09 20.66 23.50 25.32
-- 55 63.90% 71.50% 76.77% 82.61% 86.91%
24% 206 57.93% 63.47% 68.61% 71.70% 74.62%
FORM 4: Fall 2007 Credit Students Who Enrolled Next Term and Next Fall
Next-term Persistence Rate (Col 4) 63.45%
Cumulative First-year GPA (Col 2) --
Average First-year Credit Hours (Col 4) --
Percent Enrolled Next Year (Col 5) --
% Compl. or Transf. in Three Years (Col 6)
Full-time, First-time in Fall, 2005 48.55%
Part-time, First-time in Fall, 2005 34.72%
FORM 3: Student Performance at Transfer Institutions (Most Recent AY)
Part-time, First-time in Fall, 2005 20.75%
% Transferred in Three Years (Col 5)
Full-time, First-time in Fall, 2005 29.43%
Part-time, First-time in Fall, 2005 13.97%
Institution NCCBP PercentilesReported Value
FORM 2: Proportions of Students That
% Completed in Three Years (Col 3)
Full-time, First-time in Fall, 2005 19.12%
Percentile ranks are the percents of benchmark values that fall below the institution's values.Johnson County Community College
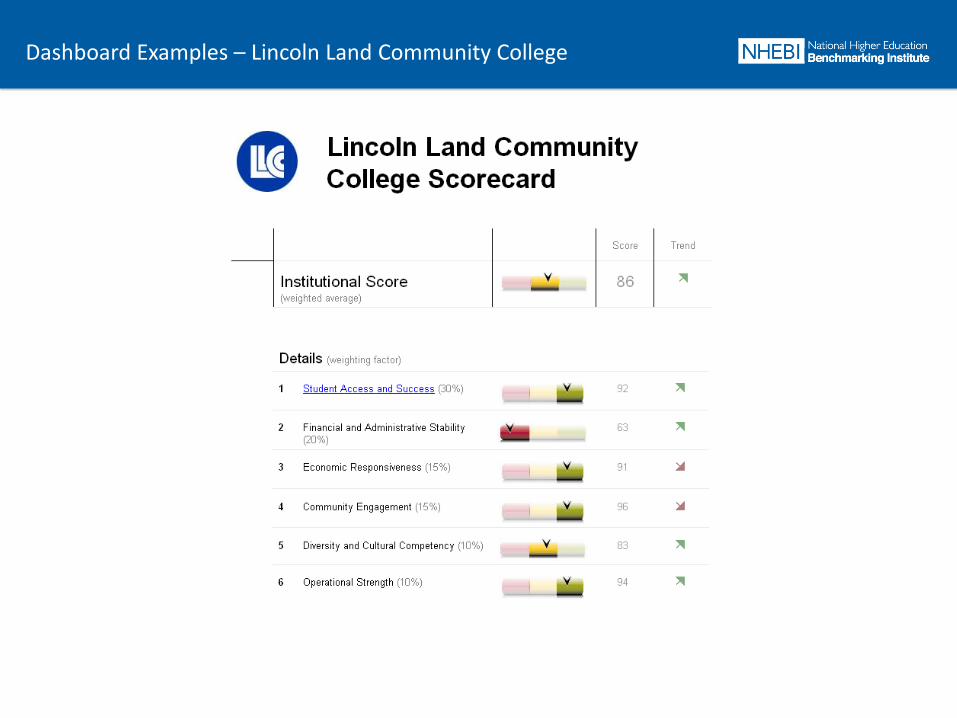
Dashboard Examples – Lincoln Land Community College
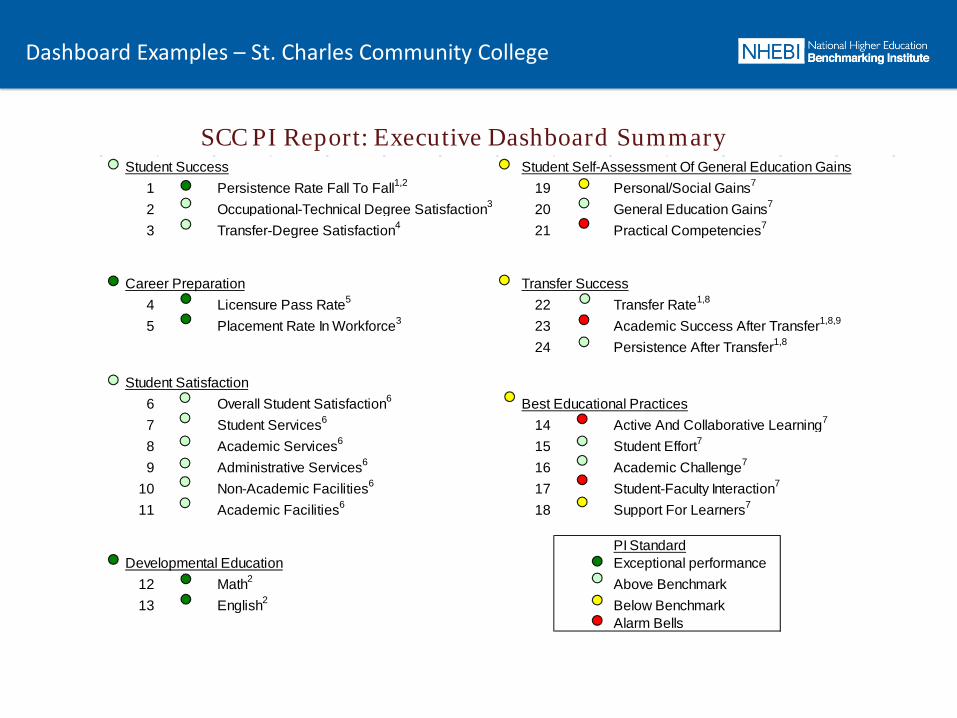
Dashboard Examples – St. Charles Community College
SCC PI Report: Executive Dashboard SummaryStudent Success Student Self-Assessment Of General Education Gains
1 Persistence Rate Fall To Fall1,2 19 Personal/Social Gains7
2 Occupational-Technical Degree Satisfaction3 20 General Education Gains7
3 Transfer-Degree Satisfaction4 21 Practical Competencies7
Career Preparation Transfer Success4 Licensure Pass Rate5 22 Transfer Rate1,8
5 Placement Rate In Workforce3 23 Academic Success After Transfer1,8,9
24 Persistence After Transfer1,8
Student Satisfaction6 Overall Student Satisfaction6 Best Educational Practices7 Student Services6 14 Active And Collaborative Learning7
8 Academic Services6 15 Student Effort7
9 Administrative Services6 16 Academic Challenge7
10 Non-Academic Facilities6 17 Student-Faculty Interaction7
11 Academic Facilities6 18 Support For Learners7
PI StandardDevelopmental Education Exceptional performance
12 Math2 Above Benchmark13 English2 Below Benchmark
Alarm Bells
Dashboards – Strengths
• Relatively straightforward way to monitor current institutional performance
• Provide metrics on KPIs that represent core institutional goals, issues, and operations
• Easy to understand • Engaging presentation format to communicate
important information • Can be used at all levels of the institution (institution
as a whole, division, department)
Dashboards – Challenges
• Design and implementation require a comprehensive understanding of complex data definitions, sources, appropriate analyses, and sources of appropriate benchmarks – Requires appropriate expertise (internal or external)
• Don’t provide an in-depth understanding of underlying data that drive the KPIs --Limited in scope and somewhat simplistic --Lack of detail makes it difficult to understand the “whys” of
institutional performance • Provide no information regarding what should be done—
no guidance for institutional action • To be optimally effective need to be supported by formal
underlying data structure with drill-down capabilities—a balanced scorecard
Exercise I
1. Identify three elements of your institution’s mission/“core business.” 2. Identify first-level KPIs for each of the elements of your institution’s core business 3. Report results of your deliberations