Embed Size (px)
Citation preview

93
Armanshahr Architecture & Urban Development, 5(8), 93-105, Spring Summer 2012
ISSN: 2008-5079
Identifying Measures and Indicators Affecting the Walkability of Neighbourhoods with a Sustainable Neighbourhood Development Approach
Case Study: Chizar Neighbourhood, Tehran, Iran
Razieh Rezazadeh1, Laleh Latifi Oskouei2* and Maryam Mohammadi3
1Associate Professor, Dept. of Urban Planning, Iran University of Science and Technology, Tehran, Iran.2 M.A. Graduate in Urban Planning, Iran University of Science and Technology, Tehran, Iran.3 PhD Candidate in Urban Planning, Iran University of Science and Technology, Tehran, Iran.
Received 12 May 2012; Revised 24 July 2012; Accepted 29 November 2012
ABSTRACT: Sustainable transportation with the aim of urban sustainable development aims to improve the environmental quality and the socio-economic condition. One of the most important strategies for achieving sustainable transportation is planning and designing for walking, or in other words increasing urban walkability. Therefore, increased walkability has become a key issue in urban planning. Understanding influential measures on urban and neighbourhood walkability for residents have become very important. Therefore, the aim of this paper is to identify the factors affecting walkability in order to improve neighbourhoods’ sustainability from the residents’ point of view. The results of increased walkability are investigated through various social, economic and environmental aspects. This article is based on a subjective approach to define the effective measures on walkability in the case study of Chizar neighbourhood in Tehran. Therefore, the article is an applied analytical one based on quantitative analysis. Based on a survey technique, 200 sample questionnaires were collected. The data then was used to conduct correlation and regression analyses. The results show that the most important factors affecting the residents’ perception of walkability include access to daily and weekly needs, sense of security and safety, environmental aesthetics, permeability and traffic characteristics.
Keywords: neighbourhood, walkability, sustainable development, Chizar neighbourhood, Tehran, Iran.
INTRODUCTIONIn urban sustainable development, human quality
of life is considered as one of the most important aspects. Continuation of high quality of life of residents is accompanied by social welfare and development. Among the various dimensions of a city, which result in sustainable urban development, transportation is an important one. Considering the definition of neighbourhood as a physical and functional entity that develops and supports the creation of desirable social and neighbourly relations, the significance of adequate access has been focused on as one of the physical dimensions of neighbourhood sustainability. Therefore, emphasis on reaching a national sustainable transportation pattern can
lead to achieving physical, environmental, economic, and even social sustainability in the neighbourhood. The aim of this article is to investigate walkability in the neighbourhood as one of the strategies to reach a sustainable transportation system.
Today, due to the pattern of urban development and separation of work, education and entertainment zones, reliance on vehicles is inevitable. Pedestrian-oriented neighbourhood does not suggest a lack of ownership or use of vehicles, but rather in these neighbourhoods the relationship between houses, facilities and services through streets is in such a way that can promote people to have physical movement and social interaction in their daily lives. Studies show that the continuation of the current attitude, which gives too much attention to vehicular requirements and very little attention to pedestrian movement has created a situation, which *Corresponding author email: [email protected]

94
Rezazadeh, R. et al.
excludes pedestrians from the city. Lack of pedestrian presence in the neighbourhood and weak walkability decreases safety and social relationships and increases environmental problems such as sound and air pollution, poor public health, lack of neighbourhood identity and sense of attachment, which leads to the gradual decay and dilapidation of the neighbourhood. Therefore, understanding the effective criteria in the residents’ opinion is one of the important issues in neighbourhood walkability of different social groups that should be considered in order to be able to identify the strengths and weaknesses of an existing situation and to plan to remove defects and promote walkability and neighbourhood quality.
At first, a brief definition of sustainable transportation and its strategies has been presented. Then, after determining the importance of neighbourhood walkability to create a sustainable neighbourhood, a few definitions of walkability has been presented. In order to determine the effective components for neighbourhood walkability from the residents’ point of view, same components have been studied and then the effective walkability components have been selected for the neighbourhood. In the next step, the findings have been evaluated through a subjective measure. Residents of Chizar neighbourhood have been asked about individual and environmental characteristics via a questionnaire. A total of 200 questionnaires were filled out in which independent variables including individual, family as well as environmental components were analysed in addition to dependent variables, such as walking frequency (quantitative index) and walking desirability (qualitative index). Data analysis was conducted in SPSS 17 software and regarding the type of data, Spearman and Chi square correlation tests were used to identify the correlation and factor analysis was applied to extract components. Finally, the relationship between frequency and desirability of walking (dependent variables) and extracted components of analysis (independent variables) has been presented through a multivariate linear regression in two separate models.
SUSTAINABLE NEIGHBOURHOOD & TRANSPORTATION
Walkable NeighbourhoodAccording to the Compact Oxford English Dictionary
(2006), a pedestrian is “a person walking rather than traveling in a vehicle”. Pedestrian activity is therefore defined as a mode of transport comparable to vehicular modes such as driving, cycling and catching the train. Pedestrians walk for different reasons including getting from origins to destinations (like commuting from home to work), transferring from one mode to another (like at a transit interchange) and accessing destinations (like going between the garage and the house at the end of a trip) (Lo, 2009, p. 145).
Defining the walkable neighbourhood extends beyond pedestrian concerns, as the ability to walk in a neighbourhood indicates not only a type of mobility and means of travel, but also a type of sociability between neighbours, which, together, likely affect the physical, mental, and spiritual health of people in the community (Moundonet et al., 2006, 100).
An Investigation into the Patterns of Neighbourhood Development and the Importance of Walkability
The meaning of the phrase “development pattern” from a lexical point of view, is a pattern that contains the increased movement of a city information structure in a way that this increase leads to an increase or decrease in mass and energy in the inner system of a city (Nour Mohammdzadeh, 2006, p. 22). Due to the current situation and problems, in recent years, urban planning has gone through many new trends and approaches, such as urban sustainability, smart growth, new urbanism, social equity, environmental planning, land use and so on. In the following paragraph the main principles of pattern development and neighbourhood planning is elaborated. Such patterns have been named as transition oriented development, smart growth and new urbanism. All of these patterns are derived from the urban sustainability development approach.
95
Armanshahr Architecture & Urban Development, 5(8), 93-105, Spring Summer 2012
Table 1.The principles of urban planning and design in different patterns of neighbourhood development
Development Pattern PrinciplesTOD Improving in movement, walkability, different life surroundings, neighbourhood regeneration (opcit : 73-
75; CUTA, 1986; Nieweer, 2004؛American, Fa ulkener)Smart Growth Mixed land uses, constructing concept and small community, create a range of housing opportunities and
choices, create a walkable neighbourhood, foster distinctive, attractive communities with a strong sense of place, conserving the environmental dimension provide a variety of transportation choices, reinforcing neighbourhood community through development taking decision and predictable (Mineta Transportation Institute, 2001) (http://www.smartgrowth.org/principles/housing_ops.php)
New Urbanism Walkability, connectivity, mixed-use & diversity, mixed housing, quality architecture &urban design, traditional neighbourhood structure, increased density, green transportation, sustainability, quality of life (www.newurbanism.org)
Beyond these patterns, New Urbanism is considered as one of the pattern of neighbourhood development. This term was used for the first time in early1980s. This pattern was the combination of two patterns: TND (Traditional Neighbourhood Development) which is used by architects Elizabeth Moule and Elizabeth Plater-Zyberk in western beaches of USA and by Peter Calthorpe, Stefanos Polyzoides, and Daniel Solomon (Walters, 2004, p. 54). The New Urbanism approach, not only contained urban design but also emphasis on the main goals of planning such as development management, environmental conservation and regeneration of liveable cities. New Urbanism is a postmodern movement for creating a built environment, which is sustainable and compact. It is a trend, which is the product of problem solving
by current American urbanism in order to confront the sprawl developments of Americans cities and the impact of modern movement.
In summary since the 1980s New Urbanisms have been working on developing neighbourhoods that not only allow people to walk for leisure but also allow the residents to walk to nearby shopping and public spaces. These increases in opportunities for walking can enhance people’s lives through improved health, reduction in expenditure for fuels, enhancement of the physical environment through reductions of carbon monoxide, and the potential for increased social capital through accidental and intentional social opportunities (Glanz, 2011, p. 3). Table 2 shows the qualities that are concerned in this movement.
Table 2.Considerations and qualities that are gained through the New Urbanism approach, (Kets, 1994)
Factors ConsiderationsNetwork Proper joining in network, ease of movement, many path ways, narrow street, safety of pedestrian
movement, considering human scaleArchitecture Considering history and tradition, vernacular characteristics, identity, monument, originality of
construction Land use Every neighbourhood should consider different types of households and land uses, access to
services and retail, access to services is not depended on the car Design Emphasis on the enclosure of path, conserving the scale between the height and the width of
path, access for movement of pedestrian and cycle, located parking far from public view and outside the city fabric
Economic consideration
The low costs for creating and conservation infrastructure because of the density
Many of the New Urbanism principles are taken from old cities. Traditional patterns like walkability, mixed used and turning to the ideas of ideal city-garden of Unwin and Parker are presented in this pattern. So they present a new alternative as the neo-traditional community, which
compared to the existing suburban model in the modern movement, has a higher density, mixed land uses, public transportation and concern for pedestrian and cycle routes and continuity in the network.

96
Indicators Affecting The Walkability of Neighbourhoods
An Exploration in to Recent Research about Walkability
Recently, there has been an attempt to comprehend and evaluate walkability. Although, the literature reviews have been done for various working areas and the scale of the studies have been different, nevertheless, these studies can be summarized into two groups of objective and subjective measures. Objective measures include tools through which quantitative surveys are conducted based on predetermined components and through observation and specialty. The most important objective measuring tools are: motion detector tools to record levels of daily physical activity and direct observation of behaviour through CCTV camera records. On the other hand, subjective measures consist of techniques and tools, which analyse the subjective perceptual surveys. One of the most important perceptual assessment tools is the questionnaire technique. Some studies have merged these two methods and in some cases they are compared to each other by choosing the corresponding criteria, for example Mc. Gane et al. (2007) have compared
objective measures to perceptions. However, their study showed that subjective measures are more important than objective ones for determining the level of a physical activity such as walking.
Effective Components and Indices on Walkability
After reviewing the literature on pedestrian-oriented environments, the most effective components can be summarized into two groups of individual and environmental characteristics. Effective individual characteristics on walking behaviour are sex, age, the length of residency in the neighbourhood and the purpose of walking. In many studies environmental components have been investigated through different subcomponent as well as diverse categorizations. All components that have been used in this study are based on the comprehensive framework that Pikora et al have presented, which also include neighbourhood function, safety, health, as well as destinations (Pikora et al. 2003; Pikora et al. 2002). Table 3 shows the components and indices used in walkability evaluation studies.
Table 3. Components and indices of relevant studies on walkability evaluation (Extracted and adjusted by authors)
Research Index Component Context
Pikora et al. (2002); Pikora et al. (2003); Pikora et al. (2006) Surface type
Pavement surfaceFu
nctio
nally
Pikora et al. (2002); Smith (2008 ); Pikora et al. (2003); Pikora et al. (2006)
Maintenance of the path
Pikora et al. (2002); Kansas City Walkability Plan, (2003); Lo (2009); Stevens (2005); Pikora et al. (2003); Pikora et al. (2006) Continuity
Pikora et al. (2002); Edwing et al. (2006); Pikora et al, (2003); Pikora et al. (2006) Sidewalk width
Pikora et al. (2002); Leslie and Cerin (2008) Steep pathStevens (2005); Pikora et al. (2002); Smith (2008 ); Pikora et al, (2003); Pikora et al. (2006)
Traffic control equipment
Traffic characteristic
Greenberg and Renne (2005) Traffic cultureCerin et al. (2007a); Bhattarai (2007); Edwing et al. (2006); Leslie and Cerin (2008); Stevens (2005); Pikora et al. (2002); Pikora et al. (2006)
Traffic volume
Pikora et al. (2002); Cerin et al. (2007a); Frank et al. (2006); Bhattarai (2007); Mavoa et al. (2009); Cerin et al. (2007b); Leslie and Cerin (2008); Leslie et al. (2005); Leslie et al. (2007); Owen et al. (2007), Neckerman et al. (2009), Smith (2008), Pikora et al, (2003); Pikora et al. (2006)
The distance between intersections(intersection density) Permeability
Pikora et al. (2002); Pikora et al, (2003); Pikora et al. (2006) Alternative routesCerin et al. (2007a), Leslie and Cerin (2008), Smith (2008) Dead-end routes

97
Armanshahr Architecture & Urban Development, 5(8), 93-105, Spring Summer 2012
Pikora et al. (2002); Stevens (2005); Pikora et al, (2003); Pikora et al. (2006) Lighting
Individual
Safe
ty
Cerin et al. (2007a); Cerin et al. (2007b); Kansas City Walkability Plan (2003); Leslie et al. (2005); Lo (2009); Neckerman et al. (2009) Safety from crime
Pikora et al. (2002); Pikora et al, (2003); Pikora et al. (2006)Being seen by other pedestrians and cavalry
(Cerin, E. et al, 2007a); (Cerin, E. et al, 2007b); Leslie and Cerin (2008); (Kansas City Walkability Plan, 2003); (Leslie, E. et el, 2005); (Lo, R. 2009); (Stevens, R., 2005); (Neckerman, K. et al, 2009); (Brown B. et al, 2007)20
Pikora et al. (2002); Smith (2008), Pikora et al, (2003); Pikora et al. (2006)
Places for pedestrians crossing the road width
Traffic
Pikora et al. (2002); Stevens (2005); Smith (2008), Pikora et al, (2003); Pikora et al. (2006)
Lights and traffic signs
Pikora et al. (2002); Stevens (2005) Pedestrian bridgesBhattarai (2007); Stevens (2005);Pikora et al. (2002);Smith (2008 ); Pikora et al, (2003); Pikora et al. (2006)
Presence or absence of speed limits in local streets
Pikora et al. (2002); Kansas City Walkability Plan (2003); Moudon et al. (2006); Lo (2009); Brown et al. (2007), Smith (2008 )
Interesting and varied views
Landscapes
Aes
thet
ics
Pikora et al. (2002); Bhattarai (2007); Edwinget al. (2006), Stevens (2005); Smith(2008 ); Pikora et al, (2003); Pikora et al. (2006) Presence of trees
Pikora et al. (2002); Smith(2008 ); Pikora et al, (2003); Pikora et al. (2006) Maintenance and care
Pikora et al. (2002); Pikora et al, (2003); Pikora et al. (2006) Amounts of pollutionsPikora et al. (2002); Bhattarai (2007); Pikora et al, (2003); Availability of parks
Pikora et al. (2002); Pikora et al, (2003); Pikora et al. (2006) Variety of architectural styles
Edwinget al. (2006); Pikora et al. (2002); Smith(2008 ); Pikora et al, (2003); Pikora et al. (2006) Cleanliness
Pikora et al. (2002); Pikora et al, (2003); Pikora et al. (2006); Cerin et al. (2007a); Frank et al, (2006), Mavoa et al. (2009), Cerin et al. (2007b); Leslie and Cerin (2008); Leslie et el. (2005); Leslie et al, (2007); Stevens (2005); Owen et al. (2007); Neckerman et al. (2009); Brown et al. (2007); Smith (2008 )
Facilities available nationally(mixing of lands)
Availability of facilities and access to them in neighbourhood D
estin
atio
ns
Pikora et al. (2002); Lo (2009); Stevens (2005), Neckerman et al. (2009); Bhattarai (2007), Pikora et al, (2003); Pikora et al. (2006)
Access to public transportation stations
STUDY AREA:CHIZAR NEIGHBOURHOOD
Chizar neighbourhood in zone 1 within Tehran municipality has chosen as the case study area. Chizar neighbourhood is an old rural area, which has been encompassed by urban development and therefore, it
has an organic development pattern focused around the old rural nucleus. Chizar neighbourhood has a circle like shape with a radius of about 500 metres, which provides a good walking distance from edges to its nucleus. These all contribute to it as an example of a good walkable neighbourhood within the City of Tehran.

98
Rezazadeh, R. et al.
Fig. 1.The position of Chizar neighbourhood in zone one of Tehran municipalitySource: http://region1.tehran.ir
Networking system of Chizar and walkability of ways
The neighbourhood of Chizar is an old district with an organic fabric. This characteristic has been preserved until now. Two different and distinct parts can be defined in Chizar. The first is the main core and the old quarters, where the morphology is different and the fabric is organic. Here, not only the buildings are old, but also the street network is organic and constructed in an unordered way. Beside this area, a new urban fabric is constructed as part of the physical development of the neighbourhood. This part surrounds the main part and is different in construction and paths change according to the needs of the new urban structure. Overall, the system of Chizar’s networking is as follows:
- Most of the paths in Chizar provide accessibility through the district; they provide access to the residential areas.
- There are only two paths into the neighbourhood, which are narrow.
- Other paths act as distributers, but they are also inappropriate as they are too narrow.
- New high-density constructions have also created different problems in Chizar: there is no appropriate correlation between the width of paths and the density of new constructions, so the efficiency of public paths has been compromised.
An investigation into the pedestrian paths in Chizar showed that there is not a well-defined network for the presence of people and their social and optional activities with in the neighbourhood. A deeper exploration revealed that there are some paths, which are only used by pedestrians because of their steep slope. However, the conflict between pedestrian and vehicular routes in the main square and other public spaces of the neighbourhood and also the transformation of many urban spaces into car parks has decreased the potential of these spaces for becoming civic places for the presence of neighbours. There are also other problems in the quality of the paths and routes, such as their narrowness, discontinuity of space, lack of enough services and equipment in paths, all of which leads to low social presence and satisfaction of walkability in Chizar.

99
Armanshahr Architecture & Urban Development, 5(8), 93-105, Spring Summer 2012
WALKABILITY MEASURESBased on previous research, components and indices important in a walkability study have been chosen.
Fig. 2. Components of the model for walkability evaluation
METHODOLOGYThis study is a descriptive-analytical one, which
has been conducted in Chizar neighbourhood. The selected sample size for this research is 200. The questionnaires were distributed through a random selection procedure. The aim of this study is subjective evaluation of walkability in Chizar neighbourhood. For this purpose, based on a comprehensive literature review, relative independent variables measuring individual and environmental characteristics were composed in the questionnaire. They are as follows:
- Individual characteristic (The purpose of walking)- Residents perception of the environmental
characteristics- Weekly walking frequency within the neighbourhood - Desirability of walking within the neighbourhoodAfter completion of questionnaire, data were entered
in the SPSS software. In order to analyse the correlation
Chi square and Spearman correlation tests as well as multivariate linear regression were used.
RESEARCH FINDINGS
Effective Individual Characteristics on Frequency and Desirability of Walking
The investigated individual characteristics of this research are the residents’ most important reasons for walking. These characteristics are classified into two groups of compulsory walking, like going shopping and doing daily activities or using walking as a transportation mode, as well as optional walking such as walking for fitness purposes or spending leisure time. It is assumed that the purpose of walking as an interfering factor has an effect on the frequency and desirability of walking. The results of Chi-square correlation test show that there is

100
Indicators Affecting The Walkability of Neighbourhoods
a significant correlation with a significance level of 0.01 between walking and its frequency. In addition, there is a highly significant correlation between the purpose of walking and the desirability of walking at 0.000 significance level. Table 5 (in the Appendix) shows the average times of walking and its desirability in terms of walking purposes (compulsory or optional) separately. As it can be seen from the table, those who mentioned their most important purpose as compulsory walking have walked longer than others. On the other hand, residents who had mentioned their main purpose as optional walking were most pleased with their walking. This is one of the most significant findings of this research.
Correlation between Frequency and Desirability of Walking
Studying the correlation between frequency and desirability of walking in the neighbourhood through Spearman correlation coefficient shows that there is not a significant correlation between frequency and desirability of walking in this neighbourhood (Sig>0.05).
Extracting Environmental Factors on Frequency and Desirability of Walking
In order to extract effective environmental factors, factor analysis has been used. Factor analysis has been done in SPSS17 with 22 variables, all of which had rated identification. According to table 6 (in the Appendix), the results of the KMO index show that the model qualification has been confirmed (KMO between 0.6 and 0.7). Bartlett’s test confirms this problem. It should be noted that in this analysis in order to extract factors, major component analysis has been used and for rotation of factors, Varimax rotation has been applied.
Generally, the 22 variables used in subjective evaluation of the resident’s perception of environmental characteristics of the neighbourhood explain 61.20% of the variance in the data. Through factor analysis, 8 factors were extracted (Table 4).
In the next step, the contribution of the eight extracted factors as independent variables on frequency and desirability of walking as dependent variables have been studied through two separate models.
Multivariate linear regression showed that walking frequency as a dependent variable is influenced by independent variables such as access to the weekly needs (F1), access to daily needs (F2), perception of safety (F5), and neighbourhood traffic characteristics (F8).
Equation 1 shows these relations and the significant coefficients of each component on walking frequency. It
should be mentioned that statistics F is at the significant level of 99% (Sig=0.0) and shows a significant regression. Durbin-Watson statistics in this model is equal to 1/91 that shows absence of correlation between errors. Predictability of the model is as high as 69% as R square coefficient shows (R2=0.69). In other words, 69% walking frequency by independent variables of this model, access to weekly requirements (F1), access to daily requirements (F2), and perception of safety (F5), neighbourhood traffic characteristics (F8) would be explained.
Y1 = 3.460 + 0.821 F1 + 0.091F2 + 0.90 F5 + 0.085 F8 (1)
Regression analysis of desirability of walking through the extracted factors shows that permeability (F7), quality and cleanliness (F4), perception of safety (F6) and environmental aesthetics (F3) are contributing to the desirability of walking. Equation (2) shows this relation and significance coefficients of each component on the desirability of walking. Statistics F for this model has a significant level of 99% (Sig=0.0), which shows the significance of the regression analysis. Statistics Durbin-Watson in this model has been calculated 1/91. Determination coefficient in this model is equal to 34% (R2=0.34). In other words, 34% walking desirability would be explained based on the identified effective factors in this equation:
Y2 = 2.922 + 0.409 F7 + 0.352 F4 + 0.259 F6 + 0.121 F3 (2)
COMPILATION OF OBJECTIVES AND STRATEGIES
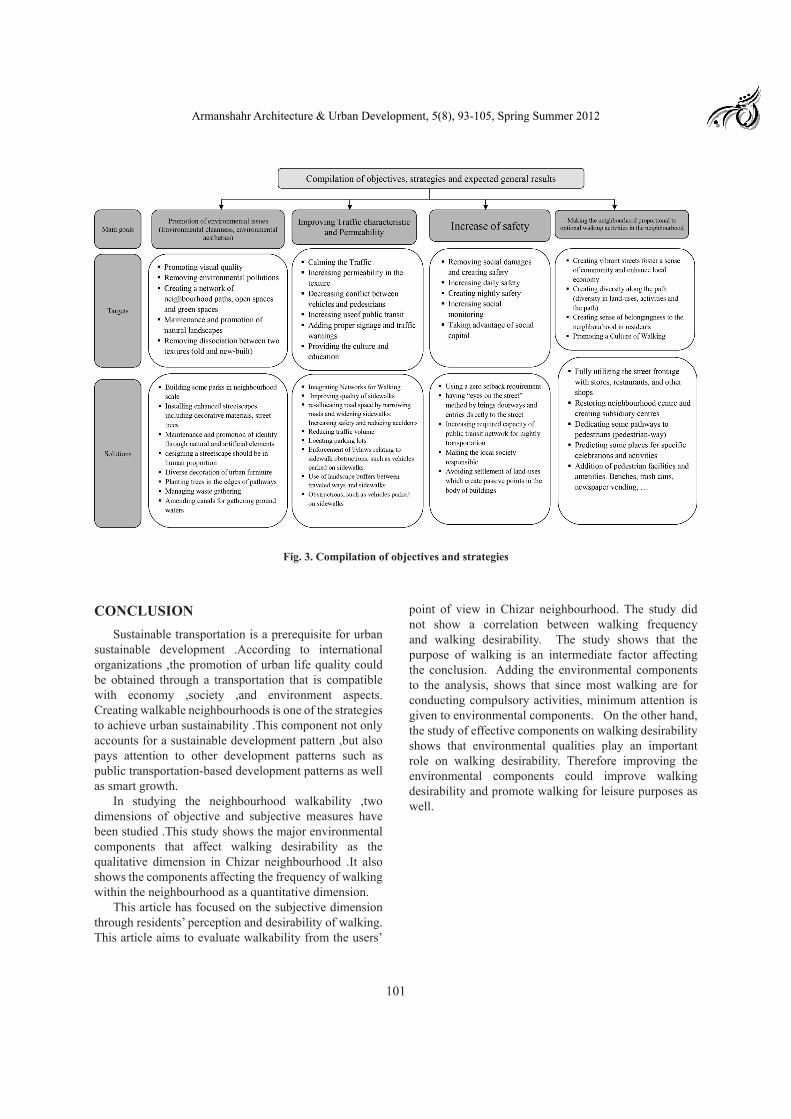
Considering the characteristics of Chizar neighbourhood, certain strategies are provided to promote walkability. These guidelines have a strategic aspect and their codification is not only based on theoretical principles but also on field data analysis in order to solve problems and improve Chizar’s walkability. In this step, the emphasis is on the participation of residents in identifying problems and developing solutions. People participation in this study has been in the form of questionnaires and surveys. Based on the findings of the research, following major objectives have been compiled:
- Making the neighbourhood proportional to optional walking activities in the neighbourhood
- Increasing safety- Improving traffic characteristic and permeability- Promotion of environmental issuesConsidering the aforementioned major
objectives, operational goals and major strategies have been compiled (Fig. 3).
101
Armanshahr Architecture & Urban Development, 5(8), 93-105, Spring Summer 2012
Fig. 3. Compilation of objectives and strategies
CONCLUSIONSustainable transportation is a prerequisite for urban
sustainable development .According to international organizations ,the promotion of urban life quality could be obtained through a transportation that is compatible with economy ,society ,and environment aspects. Creating walkable neighbourhoods is one of the strategies to achieve urban sustainability .This component not only accounts for a sustainable development pattern ,but also pays attention to other development patterns such as public transportation-based development patterns as well as smart growth.
In studying the neighbourhood walkability ,two dimensions of objective and subjective measures have been studied .This study shows the major environmental components that affect walking desirability as the qualitative dimension in Chizar neighbourhood .It also shows the components affecting the frequency of walking within the neighbourhood as a quantitative dimension.
This article has focused on the subjective dimension through residents’ perception and desirability of walking. This article aims to evaluate walkability from the users’
point of view in Chizar neighbourhood. The study did not show a correlation between walking frequency and walking desirability. The study shows that the purpose of walking is an intermediate factor affecting the conclusion. Adding the environmental components to the analysis, shows that since most walking are for conducting compulsory activities, minimum attention is given to environmental components. On the other hand, the study of effective components on walking desirability shows that environmental qualities play an important role on walking desirability. Therefore improving the environmental components could improve walking desirability and promote walking for leisure purposes as well.
102
Rezazadeh, R. et al.
REFERENCESArrington, GB. & Faulkener, T. (2002). State Wide TOD Study Factors for Success in California. Technical Appendix, California DT 12-19.
Bhattarai P. (2007). A GIS Based Walkability Analysis, an Independent Study. Department of Urban & Regional Planning, USA: University at Buffalo.
Brown et al. (2007).Walkable Route Perceptions and Physical Features. Environment and Behavior Journal,39, pp. 34-61.
Cerin et al. (2007a).Measuring perceived neighbourhood walkability in Hong Kong. Cities; 24, pp. 209–217.
Cerin et al. (2007b). Applying GIS in physical activity research: community ‘walkability’ and walking behaviors. Geospatial Research and Application Frontiers in Environmental and Public Health Systems: Development in the Asia Pacific Region. Springer Verlag. pp. 72 –89.
Edwing et al. (2006).Identifying and Measuring Urban Design Qualities Related to Walkability. Journal of Physical Activity and Health, 3, pp. 223-240.
Frank et al. (2006).Many pathways from land use to health. Associations between neighbourhood walkability and active transportation, body mass index, and air quality. Journal of American Planning Association ,72, pp. 75–87.
Glanz, Theresa A. (2011).Walkability, Social Interaction, and Neighbourhood Design, A Thesis Presented to the Faculty of The Graduate College at the University of Nebraska In Partial Fulfillment of Requirements For the Degree of Master of Community and Regional Planning, Major: Community & Regional Planning, Under the Supervision of Professor Yunwoo Nam. USA: University of Nebraska-Lincoln.
Greenberg R. and RenneJ. (2005).Where Does Walkability Matter the Most? An Environmental Justice Interpretation of New Jersey. Data . Journal of Urban Health: Bulletin of the New York Academy of Medicine.82, pp. 90-100.
Kansas City Walkability Plan (2003).Measuring Walkability: Tools and Assessment, [Electronic Version]. Retrieved August 23, 2009 from website: http://ww4.kcmo.org/planning.nsf/plnpres/walkability.
Kets, P.(1994)The New Urbanism Toward and architecture of community, McGraw Hill.
Leslie et al. (2005).Residents’perceptionsofwalkabilityattributesinobjectively differentneighbourhoods:apilotstu
dy. Health&Place Journal, 11, pp. 227–236.
Leslie et al. (2007).Walkability of local communities: Using geographic information systems to objectively assess relevant environmental attributes. Health & Place Journal,13, pp. 111–122.
Leslie, E. and Cerin, E. (2008).Are perceptions of the local environment related to neighbourhood satisfaction and mental health in adults?Preventive Medicine, 47, pp. 273–278.
Lo, R. (2009).Walkability: what is it?. Journal of Urbanism: International Research on Placemaking an Urban Sustainability, 2, pp.145–166.
Mavoa et al. (2009).Measuring Neighborhood Walkability in New Zealand Cities. Centre for Social and Health Outcomes Research and Evaluation Massey University.
Mineta Transportation Institute (2001). History of transit oriented development (TOD). [Electronic Version]. Retrieved July 03, 2009 from website: http://www.transweb.sjsu.edu/mtiportal/research/publications/documents/envisioning2/mti2001_etodp_website/TOD_History.PDF.
Moudon et al. (2006).Operational Definitions of Walkable Neighborhood Theoretical and Empirical Insights. Journal of Physical Activity and Health, 3, pp. 99-117.
Neckerman et al. (2009).Disparities in Urban Neighborhood Conditions: Evidence from GIS Measures and Field Observation in New York City. Journal of Public Health Policy, 30, pp. 264–285.
Nieweer, S.H. (2004). Transit Oriented Development for the Greater Toronto Area, an International Policy Perspective, University of Toronto.
NourMohammadzadeh, H. (2006).Defining aim in urban planning, Fine arts Journal, 26, pp. 27-36
Owen et al. (2007).Neighborhood Walkability and the Walking Behavior of Australian. Adults. American Journal of Preventive Medicine, 33, pp. 387-395.
Pikora et al. (2002).Developing a Reliable Audit Instrument to Measure the Physical Environment for Physical Activity. American Journal of Preventive Medicine, 23, pp. 187–194.
Pikora et al. (2003).Developing a framework for assessment of the environmental determinantsof walking and cycling. Social Science & Medicine, 56, 1693–1703.
Pikora et al. (2006).Neighborhood Environmental Factors Correlated with Walking near Home: Using Spaces. Med.

103
Armanshahr Architecture & Urban Development, 5(8), 93-105, Spring Summer 2012
Sci. Sports Exerc., 38, pp. 708–714.
Smitth, A. (2008).The Relationship Between Neighborhood Environment And Walking Behavior: The Influence Of Perceptions Dissertation for the degree of Doctor of Philosophy, Faculty of the Graduate School of the University of Maryland.
Stevens, R.(2005). Walkability around Neighborhood Parks: An Assessment Of Four Parks In Springfield, Oregon. Thesis for the degree of Master of Community and Regional Planning, Department of Planning, Public Policy andManagementand the Graduate School of the University of Oregon, USA.
http:// www.newurbanism.org.
http://region1.tehran.ir.
http://www.ippuc.org.br/pensando_a_cidade/index_zoneamento_ingles.htm.
http://www.oxforddictionaries.com

104
Indicators Affecting The Walkability of Neighbourhoods
APPENDIX
Table 4. Results of factor analysis for variables related to environmental factors after matrix rotation
F8 F7 F6 F5 F4 F3 F2 F1
0.851 Access to bakery 10.810 Access to supermarket 2
0.474 Access to grocery store 3
0.855 Access to pharmacy 40.8.7 Access to bank and ATM 50.773 Access to clinic 6
0.715 Natural landscape 7
0.674 Landscape beauty 8
0.627 Trees 9 0.504 Man-made landscape, buildings 10
0.400 Parks 11 0.641 Quality of pavement 12
0.614 Cleanliness 130.580 Lack of noise and air pollutions 14
0.772 Security and lack of crimes 150.716 Low rate of crime 16
0.796 Visibility while walking 170.717 Adequate light at night 18
0.767 Lack of dead-ends routes 190.503 Diversity of routes for commuting 20
0.831 Traffic volume 21
-0.444 Number of intersections in the neighbourhood
22
6.07 6.35 6.52 6.63 6.84 8.93 9.28 10.55 Variance variation percent61.2 55.13 48.77 42.24 35.61 28.77 19.84 10.55 Cumulative variation percent
Traf
fic c
hara
cter
istic
s
Perm
eabi
lity
Sens
e of
secu
rity
Sens
e of
safe
ty
Cle
anne
ss
Env
iron
men
t bea
uty
Acc
ess t
o w
eekl
y re
quir
emen
ts
Dai
ly r
equi
rem
ent
Extracted factors
Extracted factors
Major indexes

105
Armanshahr Architecture & Urban Development, 5(8), 93-105, Spring Summer 2012
Table 5. Frequency and desirability of walking based on walking type.
Optional walking Compulsory walking The average frequency and desirability for the purposes separatelyAverage Times Average Times
4.9866
5.33129
Walking frequency
3.41 2.86 Walking desirability
Table 6. Results of KMO index and Bartlett’s test for environmental characteristics
0.655Kaiser- Meyer- Olkin (Measure of Sampling Adequacy).61.20Total Variance Explained995.06Approx. Chi-Square
Bartlett›s Test of Sphericity 253Df
0.000Sig

106


![Identifying Factors Affecting Software Development Cost509883/FULLTEXT01.pdf · Identifying Factors Affecting Software Development Cost ... and upgraded to COCOMO II in 1995 [3],](https://img.dokumen.tips/doc/110x75/5ac8ba2a7f8b9a51678c91dd/identifying-factors-affecting-software-development-509883fulltext01pdfidentifying.jpg)